
Improving the Sensitivity and Functionality of Mobile Webcam-Based Fluorescence Detectors for Point-of-Care Diagnostics in Global Health


Abstract
:
1. Introduction
1.1. Mobile Technologies for POCT
1.2. Optical Detection and Analysis
1.3. Applications for Mobile Optical Detectors
1.4. The Limitations of Low-Cost Mobile POCT Optical Detectors
2. Mobile Imaging Fluorescence Detectors
2.1. Basic Configuration of Mobile Imaging Fluorescence Detectors
2.2. Optical Detectors
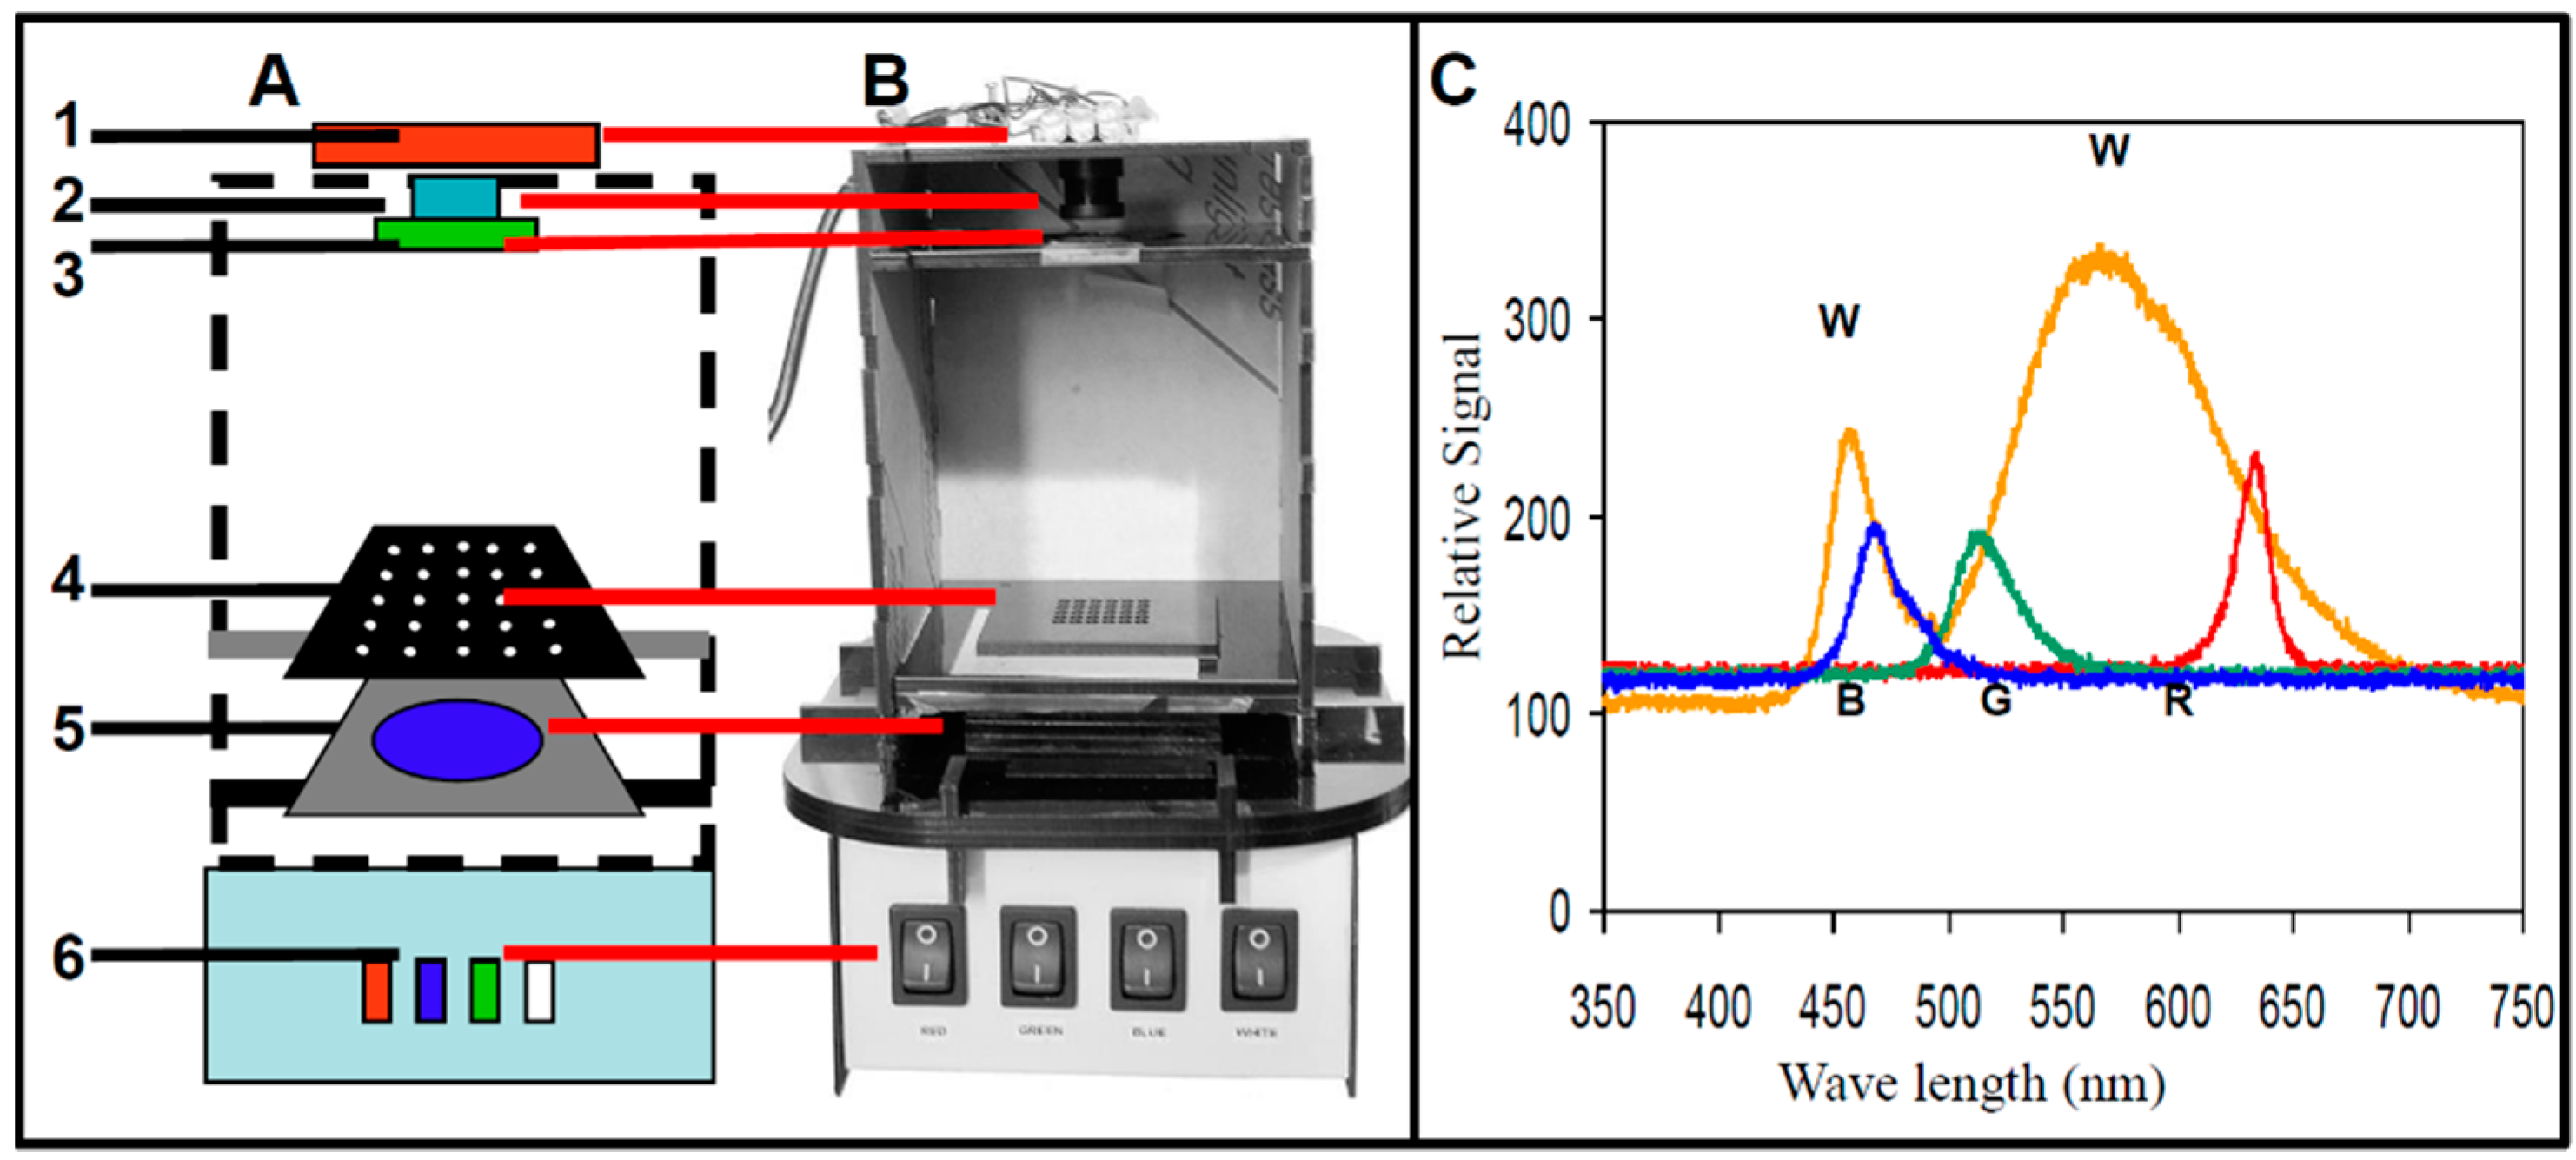
2.3. LED Illumination Module
2.4. Assay Plate
2.5. Fluorescence Detection of Stx2 Activity
2.6. CCD-Based Detectors as Versatile Low-Cost Detectors for Food-Borne Toxins
3. Improving the Sensitivity of Fluorescence Optical Detectors
3.1. Computational Enhancement of the Sensitivity of Webcam-Based Detectors
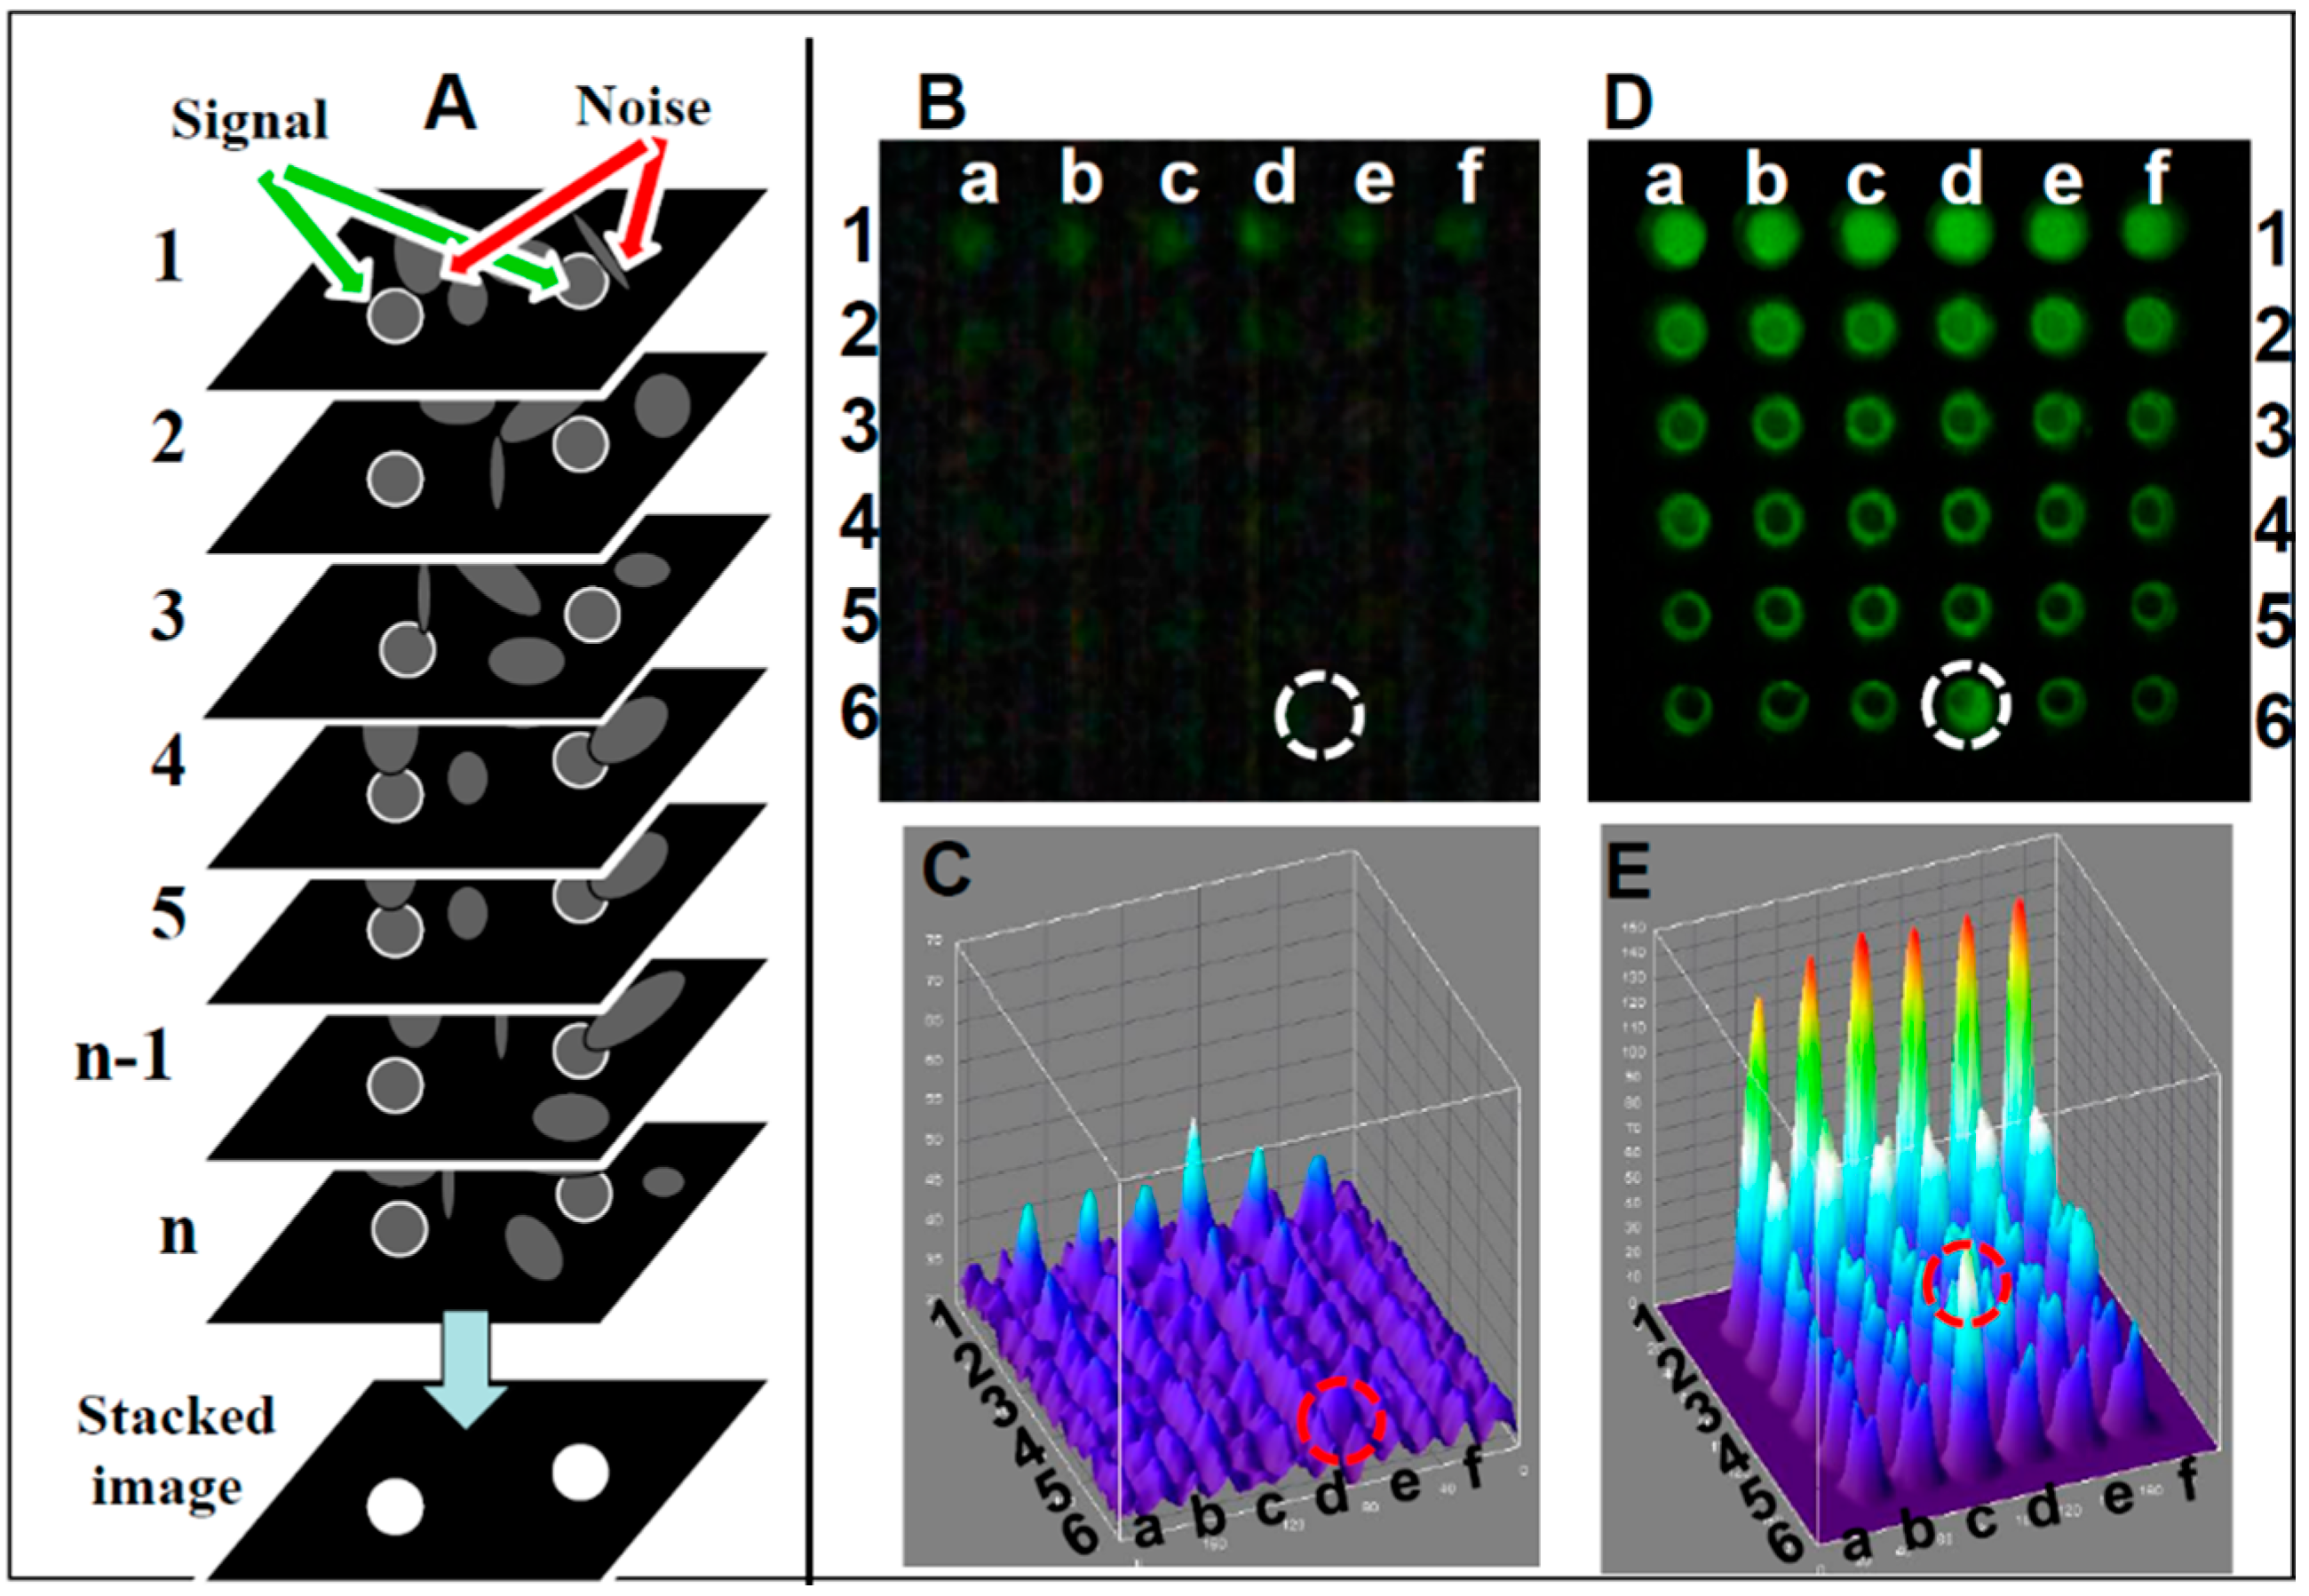
- Image stacking image analysis: A schematic of the image stacking process is shown in Figure 3A. In video mode, the webcam captures n individual frames. Each frame captures pixels with a signal (marked with white circle) and pixels with random noise (marked with arrows). In high noise or low signal individual frames the signal and noise are indistinguishable, reducing the detection level. In the stacked image the random noise is subtracted, lowering random noise in the image while the signal remains constant, resulting in the increased SNR. A comparison between single frame and image stacking is described below.
- Single frame Fluorescein detection: A generic CMOS-based webcam used as a plate reader (Figure 1) equipped with the original 5 mm f3.8 lens was used for detecting Fluorescein (a common florescence dye used in many biological assays). In this experiment, samples in the range of 0–1 mg/mL were analyzed. In Figure 3B, an emission from a single frame of a 36-well plate (rows 1–6 in Figure 3A) with six replicas (columns a–f), where each row is loaded with six different concentrations of Fluorescein (0 mM (water) to 500 mM), is imaged using the webcam and analyzed with ImageJ software (NIH, Bethesda, MD, USA). Thus, it was possible to quantify the intensity of user-specified areas of the image. As shown in the still single frame of Figure 3B, the only signal detected in row 1 is the concentration of 500 μM, and there is no visible signal in the control (water, row #6) except in row 6, column d (marked with a circle), a reference point used to orient the plate. In the ImageJ 3D analysis (Figure 3C), the signal level for each well suggests that there is no strong signal except for the 500 μM (row 1) with an LOD (calculated based on the control (water in row 6) of 1000 μM.
- Image stacking Fluorescein detection: In video mode (30 frames per second), a stream of frames is captured for 10–15 s and saved as a compressed AVI file; this amounts to 300–450 frames. This file is then split into its constituent frames and averaged together through image stacking via ImageJ software [150]. Averaging serves to reduce the effects of random variation in the signal due to noise. Image stacking was used to improve CMOS sensitivity; the plate was detected by the CMOS webcam operating in a video mode enhanced by image stacking (Figure 3D) with the corresponding ImageJ image (Figure 3E), showing a very good signal with a LOD of 60 µM, an LOD similar to a conventional plate reader.
3.2. The Use of Low-Cost Lasers to Increase Light Excitation Combined with Streak Imaging to Improve Detection of Webcam-Based Portable Flow Cytometry
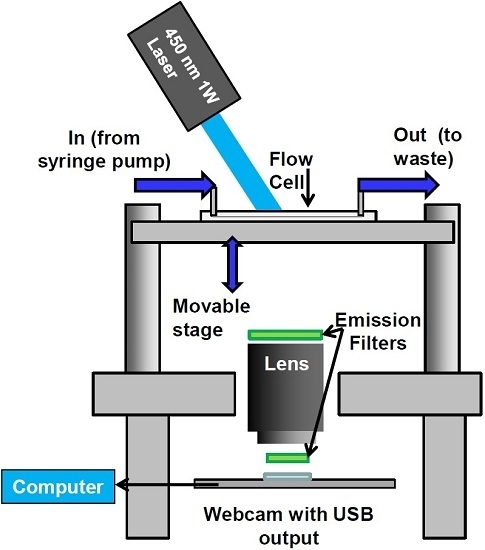
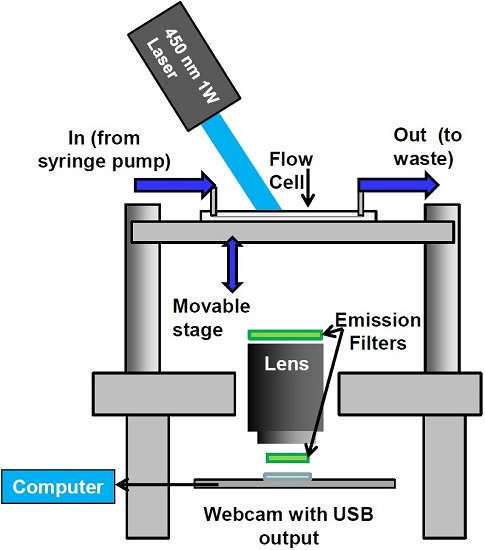
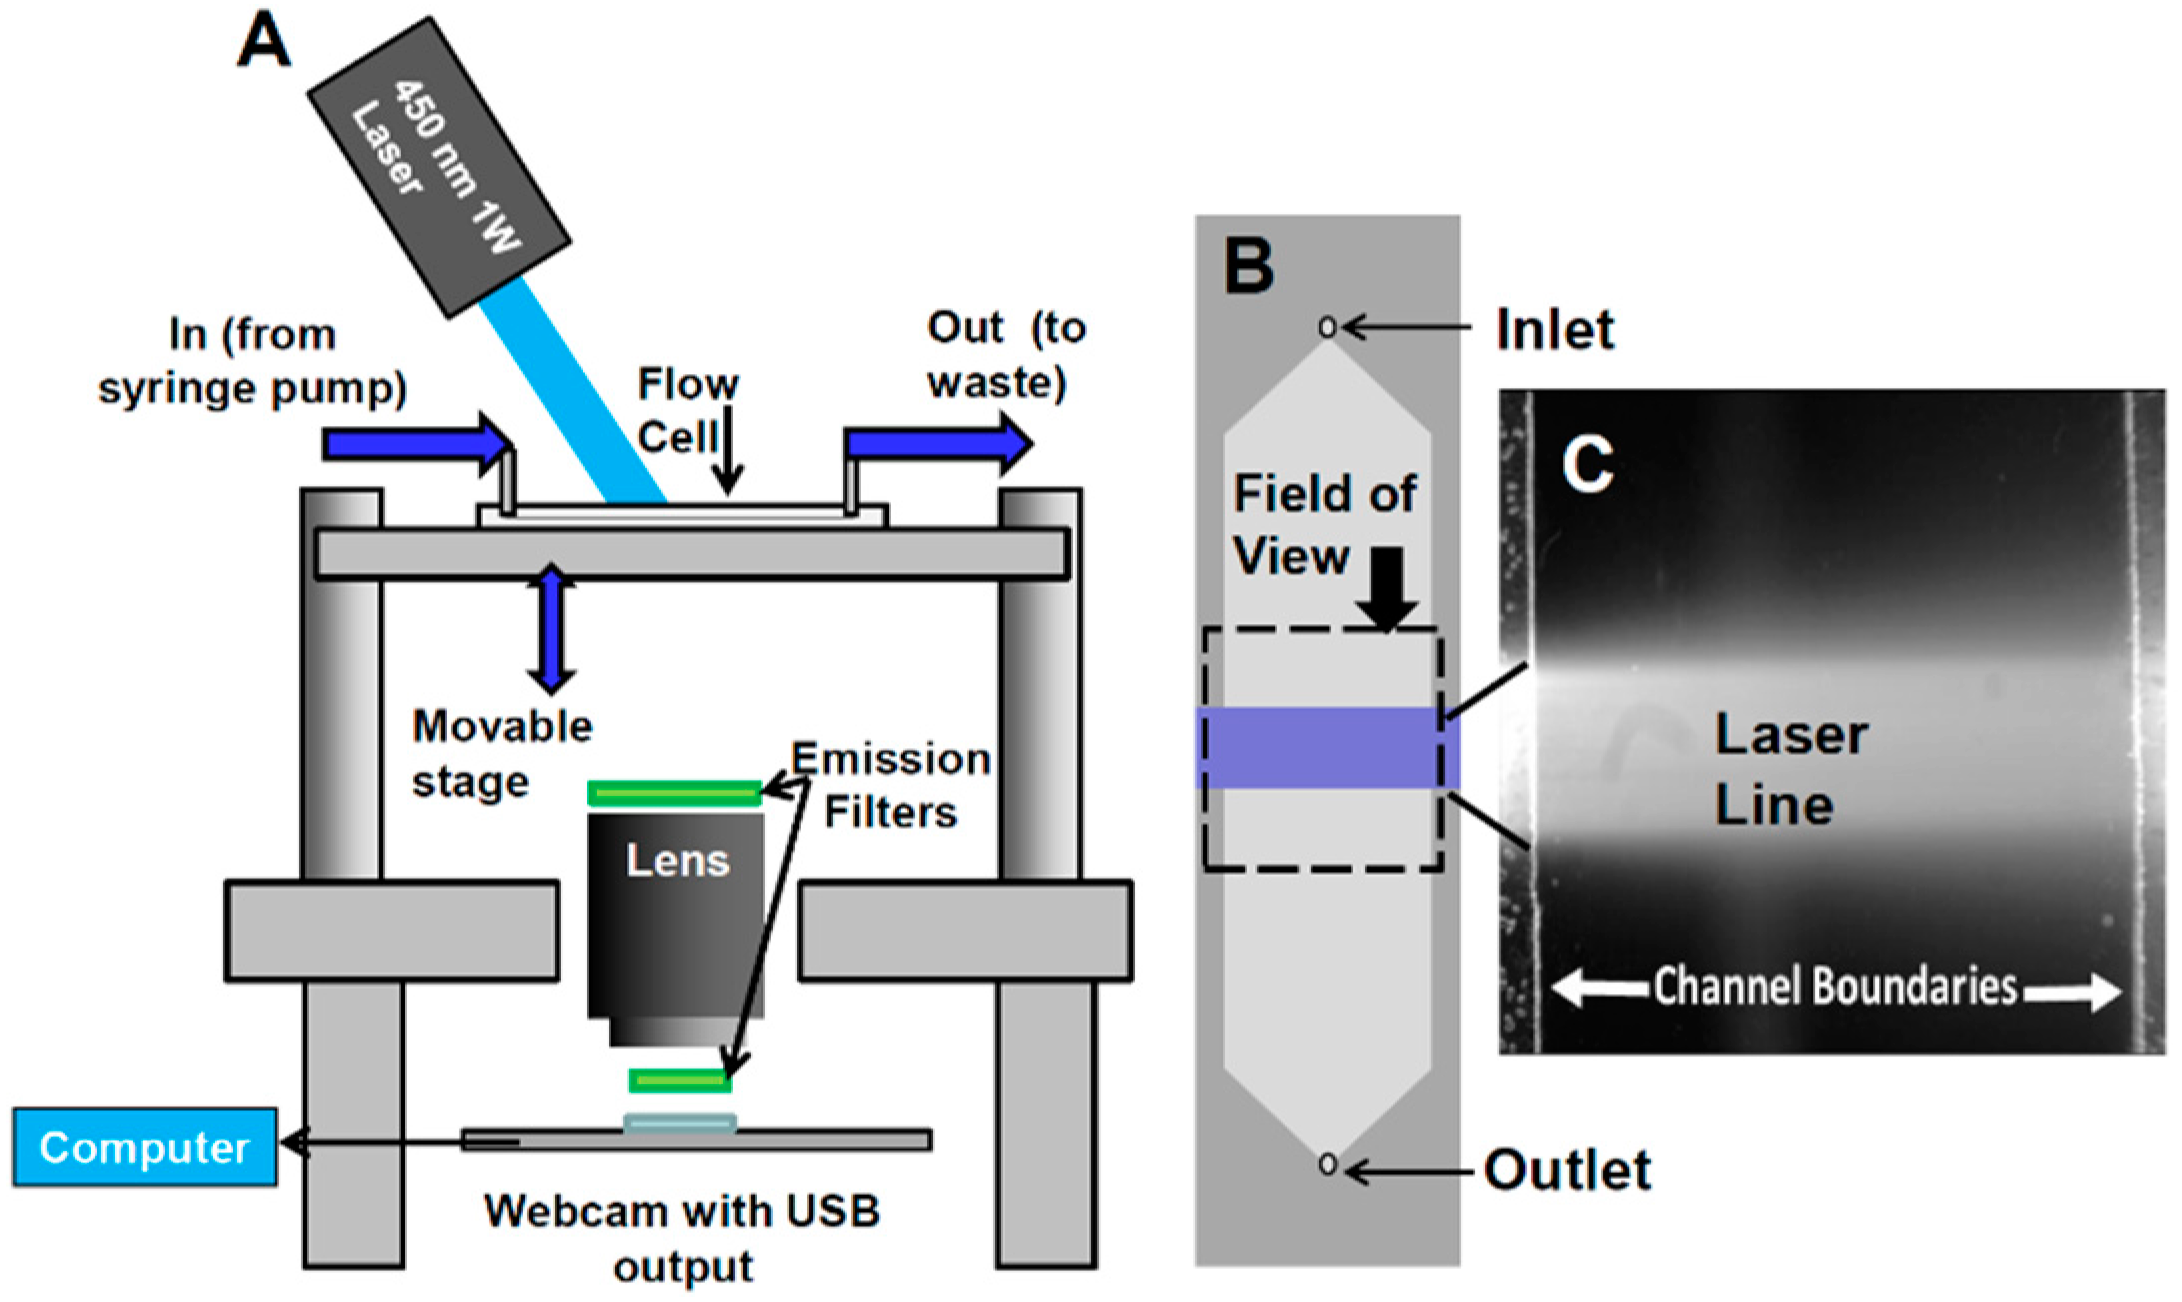
- Configuration of webcam-based mobile flow cytometer: The mobile imaging flow cytometer (Figure 4A) is based on detector configuration of a webcam-based fluorescence plate reader (Figure 1). The optical system was adapted to close-up imaging (e.g. the use of extension tubes and focusing stage) and the LED illuminator (Figure 1A-6) was replaced with a laser. The new device (Figure 4) consists of four modules: (1) a webcam utilized as an imaging sensor; (2) a blue 450 nm 1W laser excitation source that enables high excitation energy and the detection of the cells using the low sensitivity detector; (3) a high throughput flow-cell (Figure 5B); and (4) a focusing stage for image focusing and alignment. The sensor includes the CMOS with the internal electronics of the webcam. The optical system includes a 12-mm f/1.2 CCTV lens, extension tube, and two green emission filters (no excitation filter was needed because of the narrow bandwidth for the laser illumination). The webcam was connected to a computer, which was used to power the webcam and to collect and analyze data. The fluid handling system includes a high throughput flow-cell (Figure 4B) and a programmable syringe pump.
- Webcam-based flow cytometer wide-field imaging: A high-throughput flow-cell (Figure 4B), which enables wide field rapid analysis and reduces the size of the imaging files used for analysis, was constructed in which (1) a glass or quartz microscope slide was used as a lower layer; (2) a middle layer laser was machined from 1.6 mm 3M 9770 double-sided adhesive transfer tape to define the geometry and depth of the fluid channel; and (3) a top layer comprising a glass or quartz microscope slide with two holes drilled for the inlet and outlet ports was aligned with the ends of the fluid channel layer. A wide flow channel (e.g., 20 mm) enables the sample flow rate to be increased and provides the capability to analyze the large sample volumes needed to detect rare cells. The wide cell enables imaging of cells moving a long distance in the flow cell, which maximizes the residence time of cells in the interrogation window of the field of view and maximizes the number of fluorescent cells imaged. The fluid volume of the interrogation window was maximized by the microscope-slide dimensions. The channel depth (~1.6 mm) kept the flow field within the depth of field of the lens being used (Pentax CCTV 12mm f/1.2, operated at approximately f/2.4 to reduce field curvature and improve depth of field). The lens was placed at a distance of approximately 20 mm from the webcam CMOS (using an extension tube), enabling the lens to focus at very close range on the entire detection field of the flow cell. To provide approximately uniform excitation across the width of the channel, the laser source was injected into the side of the flow cell (Figure 4C) at an angle that formed a linear band of excitation across the center of the field of view. For high sensitivity and high image quality, a Sony PlayStation® Eye webcam was used as the imaging sensor.
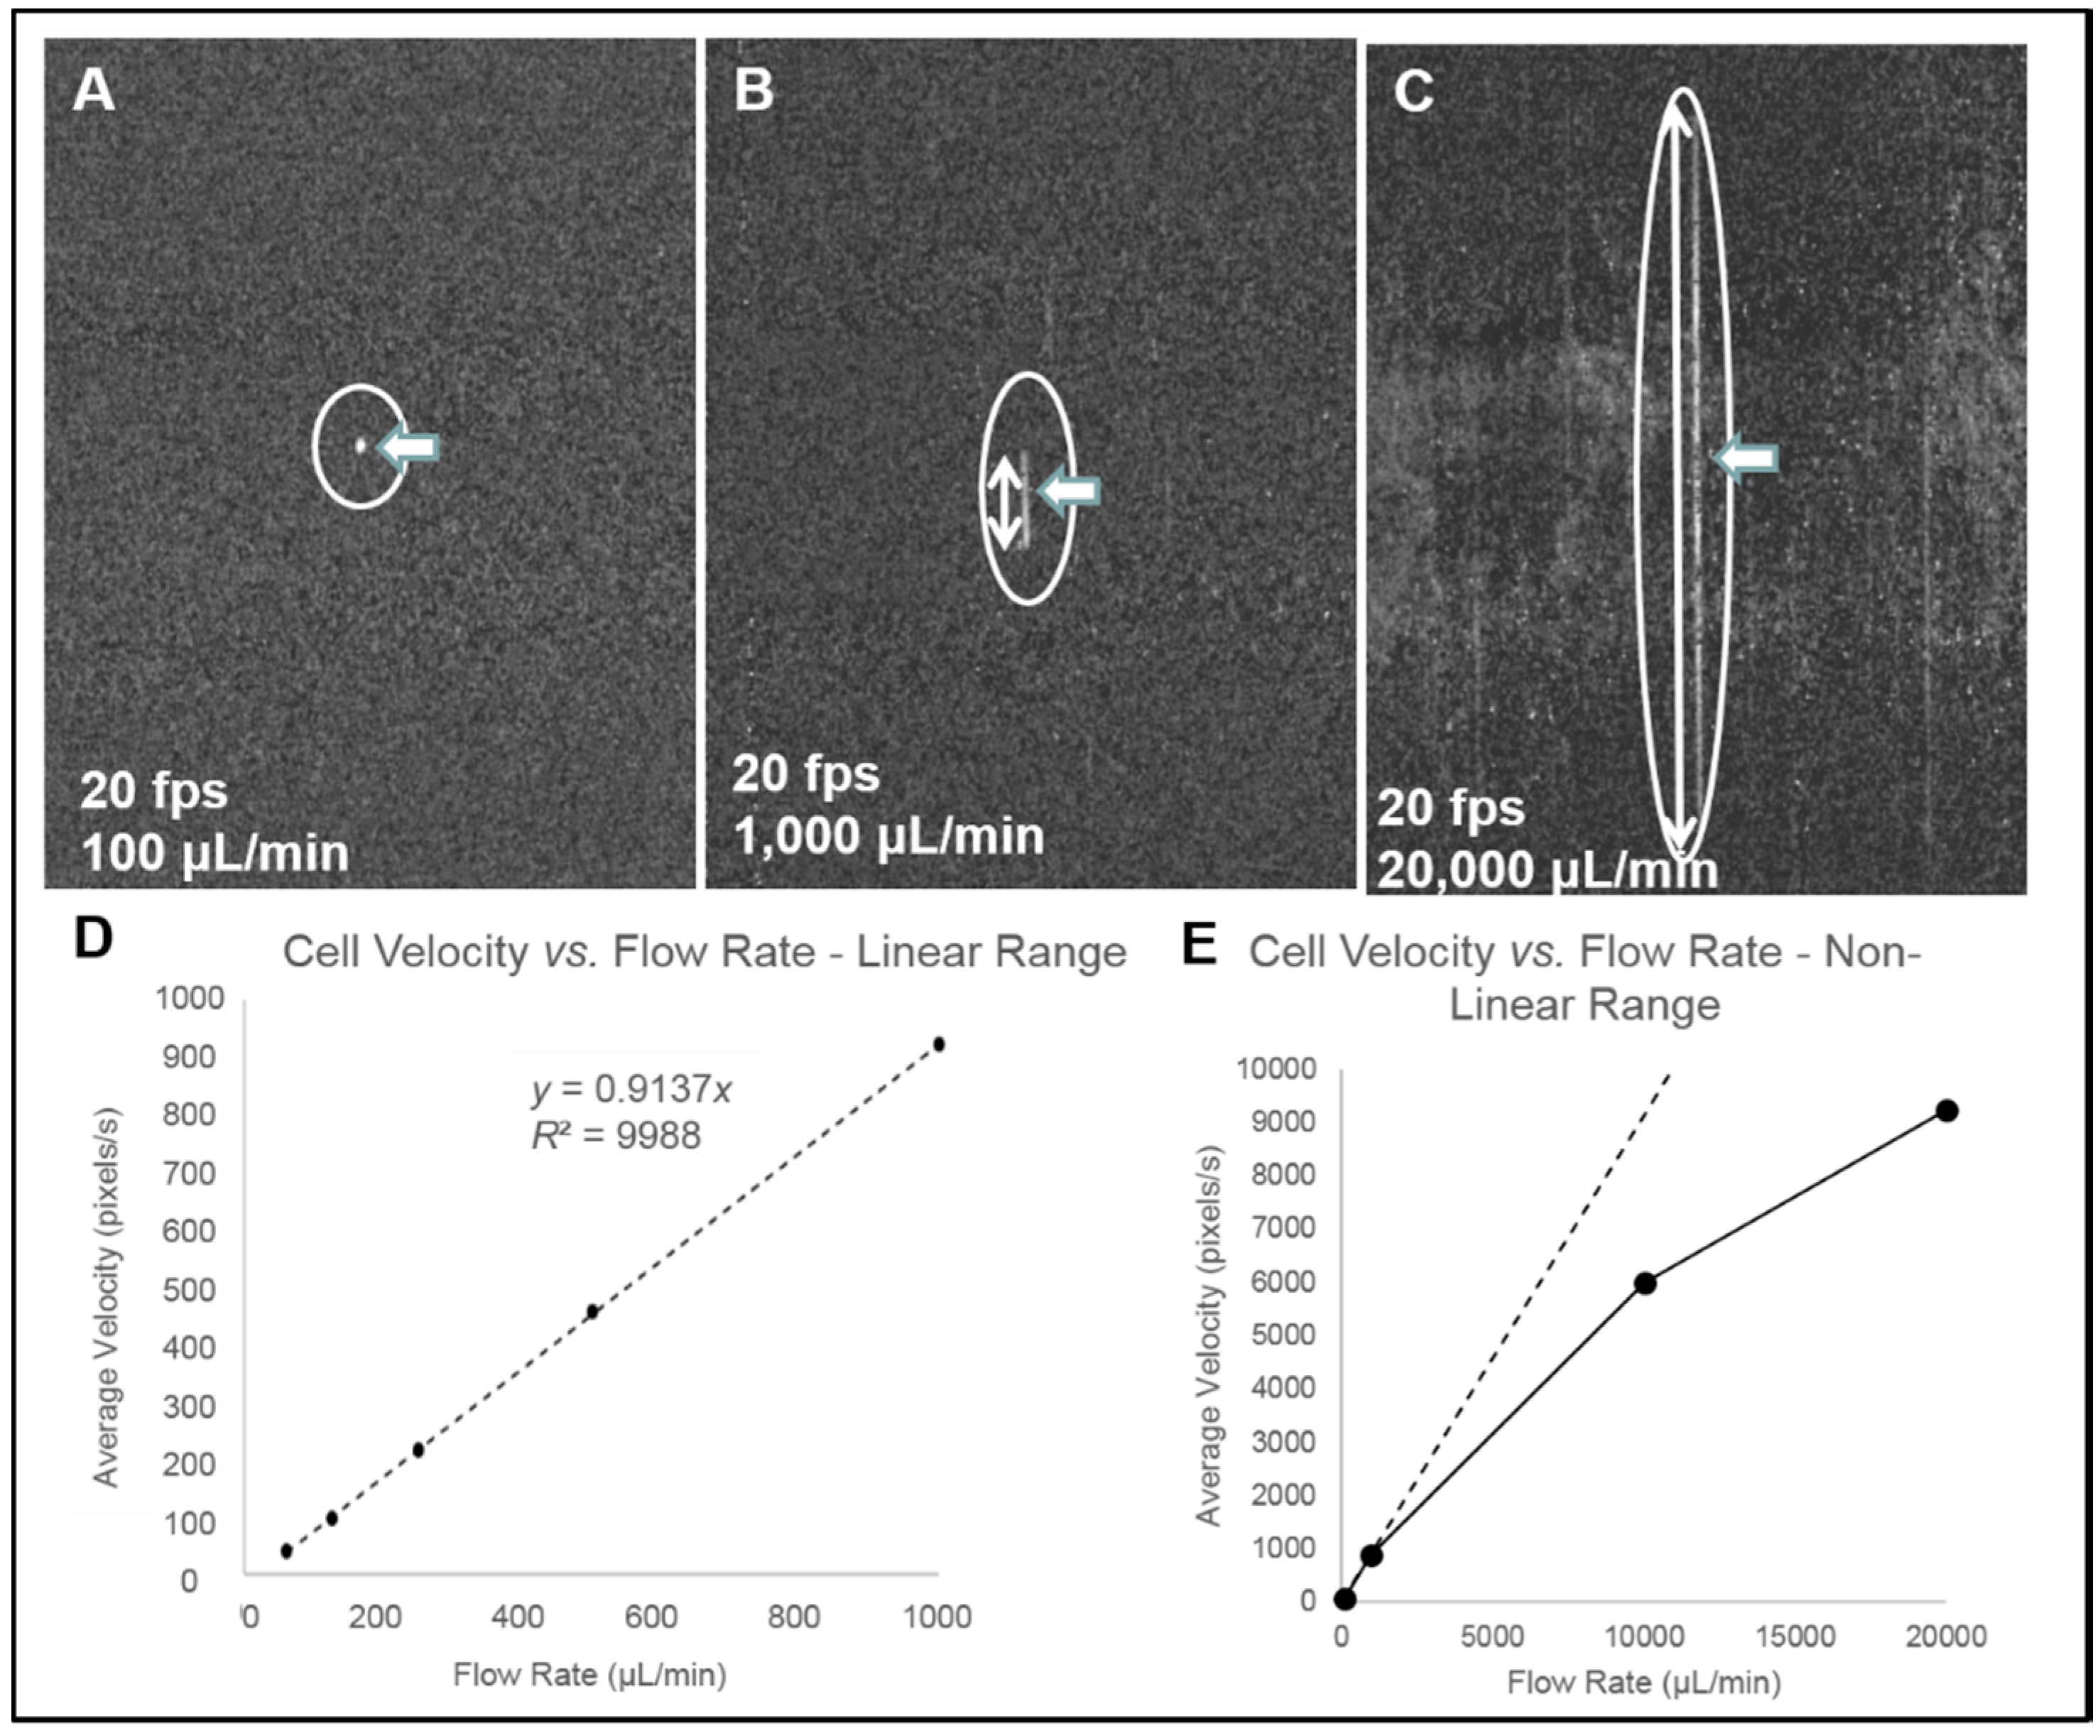
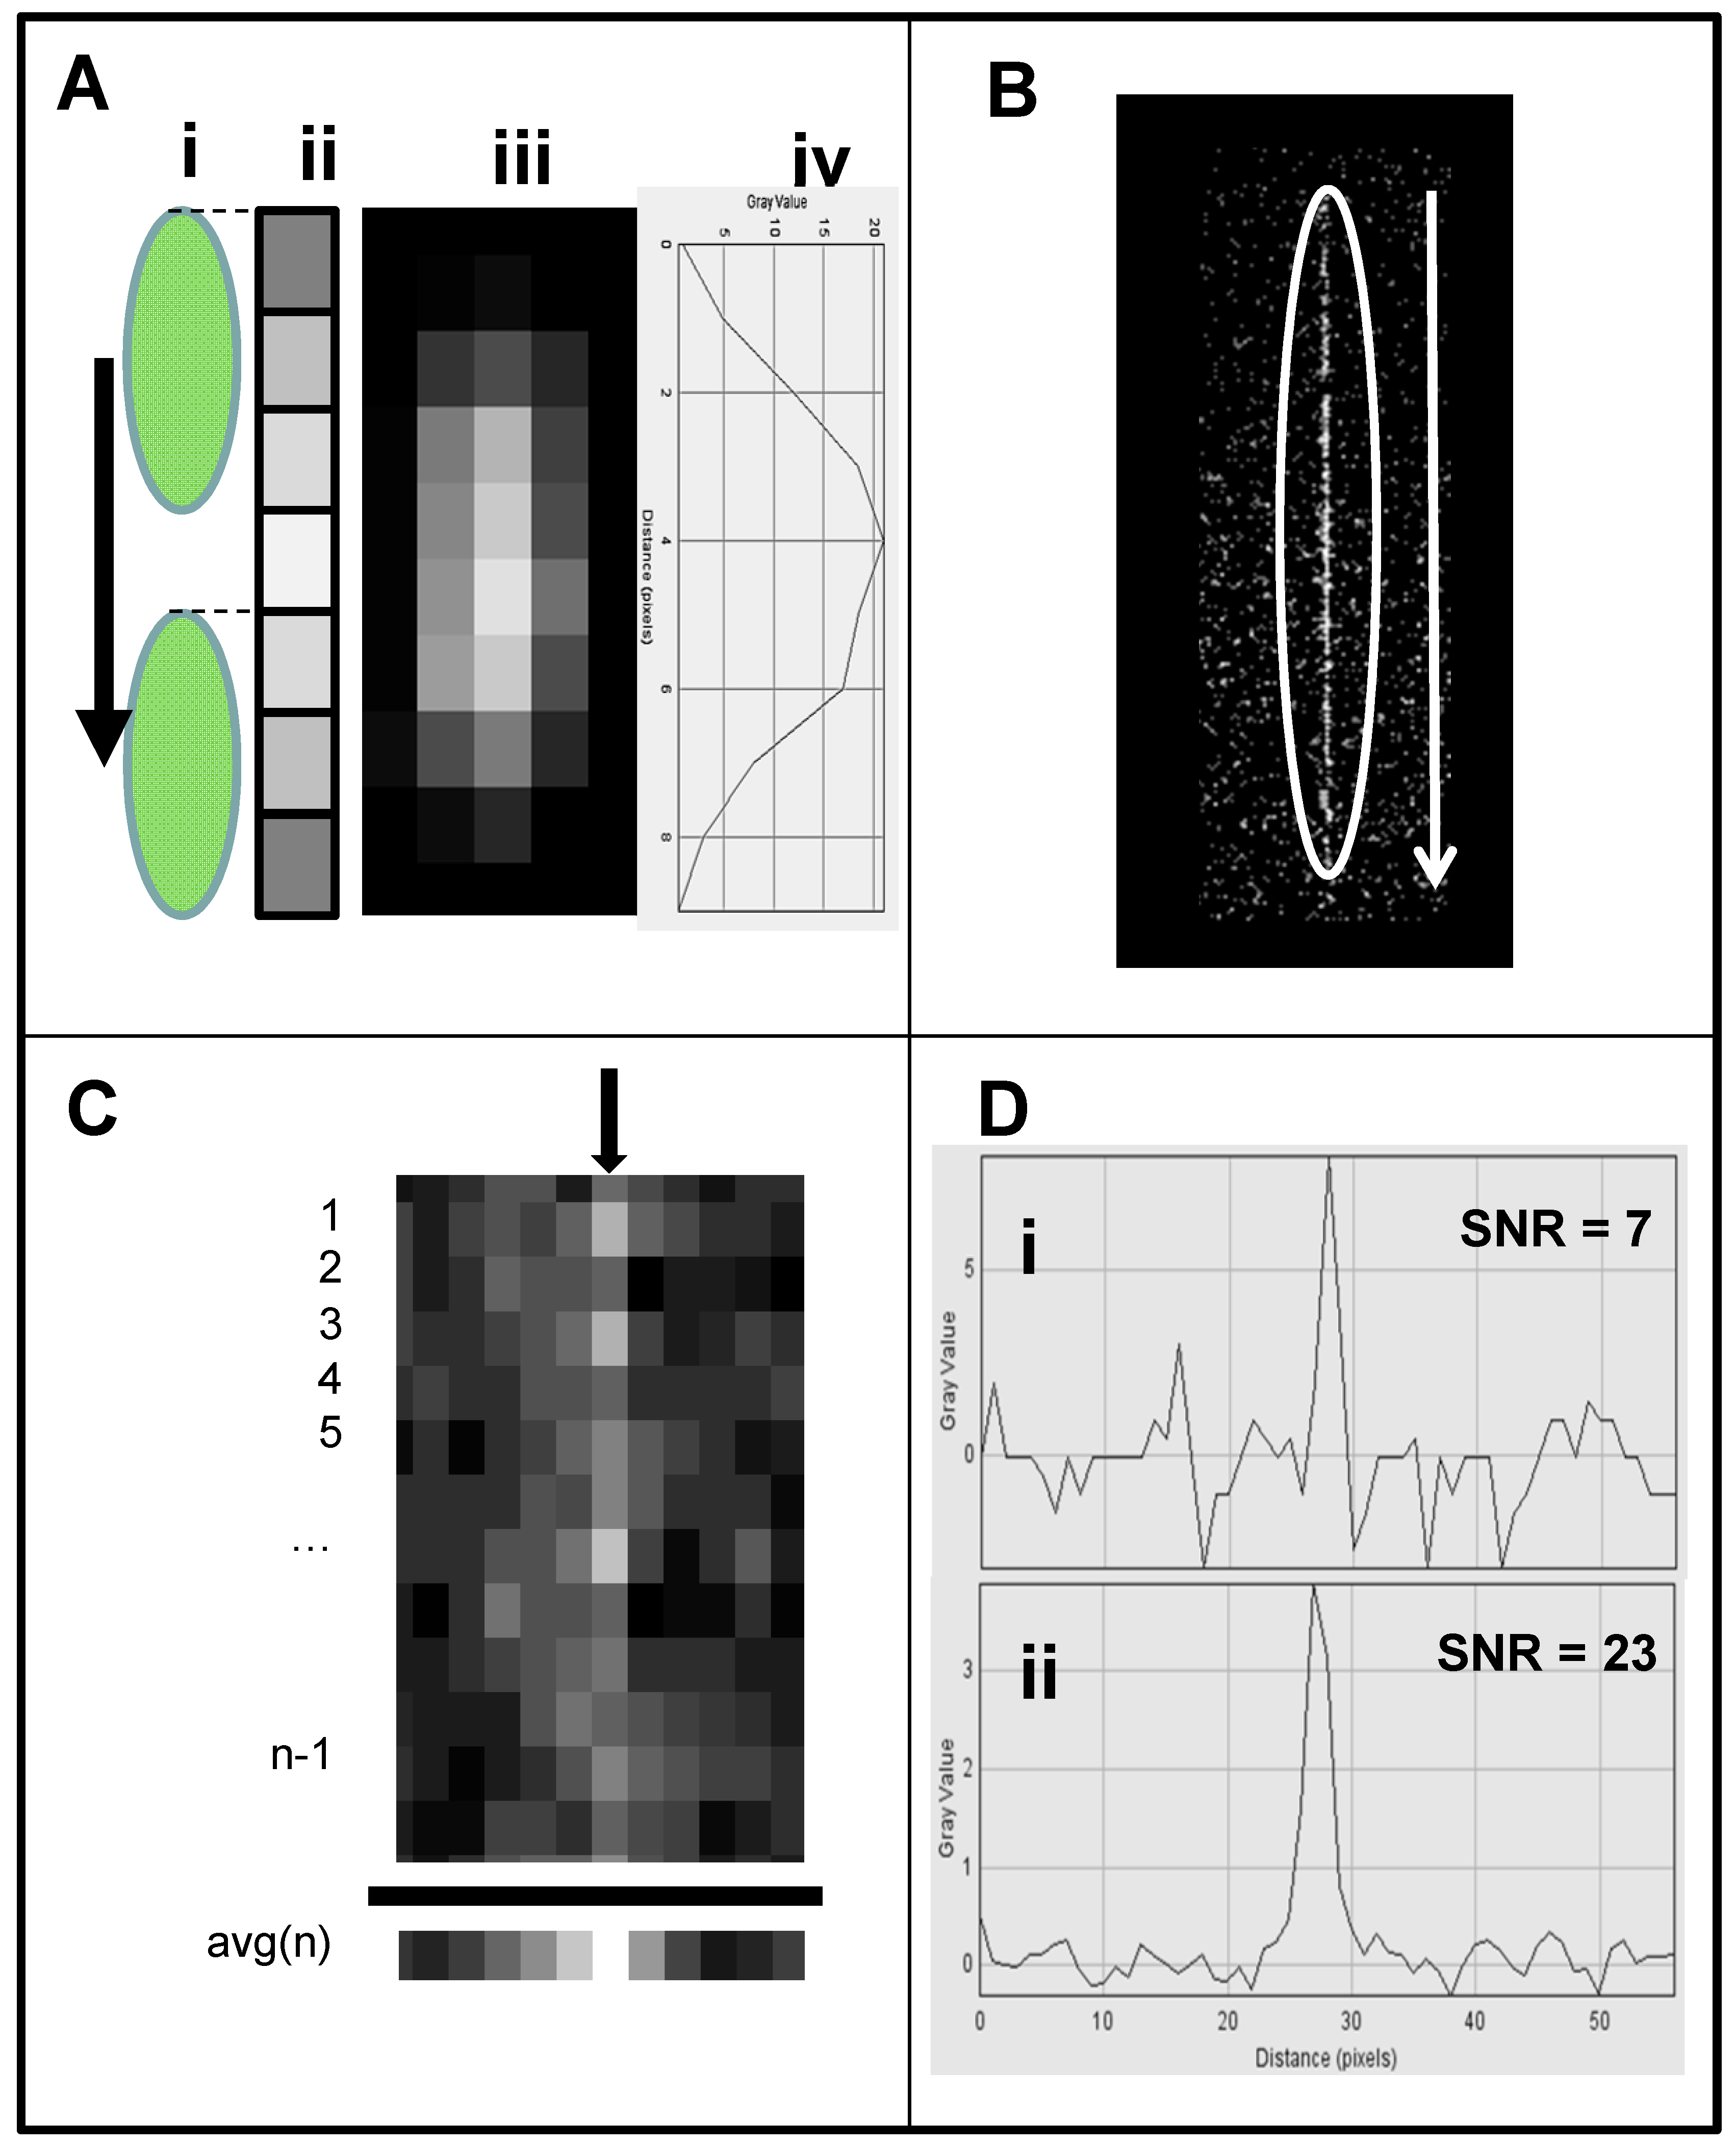
- Cell streak imaging cytometry: Imaging of a large volume of moving cells was accomplished by increasing the flow cell volumetric rate up to to 20,000 μL/min. Images of the moving cells were obtained using “streak photography,” which allows imaging of moving objects at a low frame rate to be captured as short streaks in the final image (Figure 5B). Figure 6A shows schematically a fluorescently labeled cell traversing a number of pixels; the movement is captured by a CMOS detector on multiple pixels. The number of pixels corresponds to the cell distance, while the brightness of the pixels corresponds to the accumulation of the light emitted, with a maximum brightness achieved in the pixel at the image center (Figure 5A iii and iv). An actual image of such a cell is shown in Figure 5B. The direction and relative length of these streaks can be used to measure localized fluid motion. To further increase sensitivity, the signal-to-noise ratio of the images was also enhanced by combining three imaging methods: (1) CMOS color channel selection, (2) background subtraction, and (3) pixel binning [141]. Because the emission of the dye used (SYTO-9) is in the green range (498 nm), noise was reduced by using only the green pixels of the CMOS for the analysis and two green emission filters (on both sides of the lens, see Figure 4A). In order to reduce noise, as shown in Figure 5C, each column of pixels is averaged over the streak length n to produce a single averaged row of pixels, labeled avg(n). Figure 5D shows a plot of pixel values before (i) and after (ii) averaging, showing a three-fold improvement in SNR. The plot in (i) is for the row with the brightest pixel value quantitation, shown in Figure 5D.
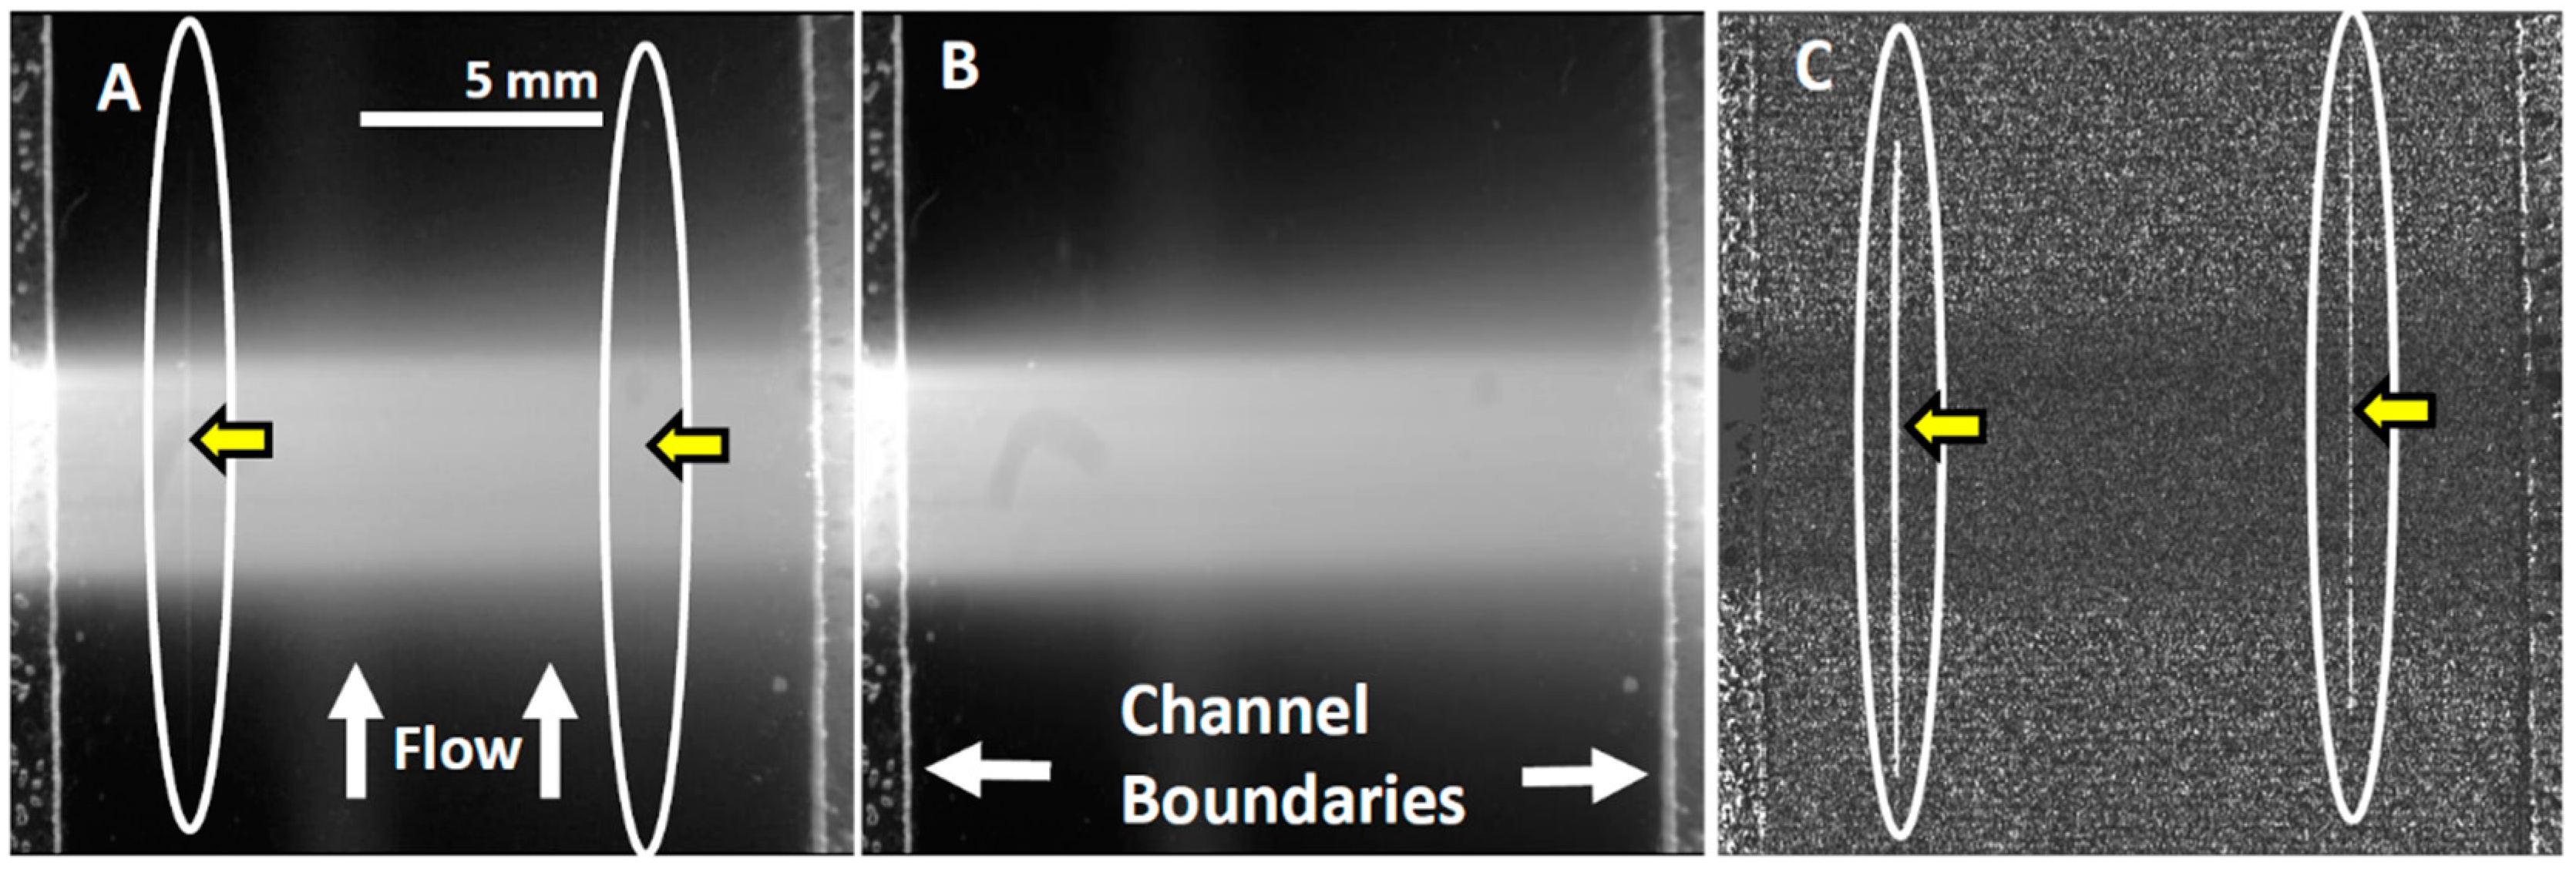
- Streak imaging signal enhancement: To improve detection, only the green channel video images of samples passing through the flow cell were used to improve cell image visibility and reduce noise from the red and blue channels, which do not have significant green color signal. Figure 7A illustrates a single raw webcam image of human THP-1 monocytes stained with SYTO-9 florescence dye (with an excitation maximum at 483 nm and fluorescence emission maximum at 503 nm), showing a fluorescent cell streak (circled and marked with arrows) with the excitation laser line autofluorescence at the center. The average of all 720 video frames from one sample yields (B) a single frame containing only background autofluorescent signal of the green channel of video. This background (Figure 7B) is subtracted from each frame (Figure 5A) to yield an enhanced image (Figure 7C) with improved cell streak visibility.
- Streak imaging cytometry detection of rare cells: The relationship between volumetric sample flow rate, linear particle velocity, and the length of the streak in the wide field flow cell field of view is shown in Figure 7. In this experiment, CYTO-9 labeled THP-1 monocytes were injected at flow rates between 100 μL/min and 20 mL/min (Figure 7). The cells (marked with arrows) were captured at 20 fps (exposure time 1/20 s). The length of the streak is proportional to the flow rate. It was found that there were distinct linear (Figure 7D) ranges of operation. At higher flow rates (Figure 7E), non-linear cell velocity was measured, with a linear trend line plotted for comparison. Non-linearity in the relationship between flow rate and particle velocity is attributed to viscoelastic creep of the flow cell, resulting in increasing cross-sectional area at higher pressures.
4. Cost Considerations for Global Health
- The webcam used as a detector ranges from ~$5 for a basic generic detector (from various suppliers, such as those found on eBay or Alibaba) to ~$10 for a Sony Playstation Eye webcam (eBay, San Jose, CA, USA).
- Multi-wavelength LED White/Green/Blue/Red 48 LED SMD will cost ~$3 (eBay or Alibaba, Hangzhou, China).
- Chroma filters will be one of the most expensive components at ~$70 (Chroma, Bellows Falls, VT, USA).
- ImageJ Imaging software (NIH) for processing images is obtained as freeware.
- Playstation Eye Webcam ~$10 (eBay)
- Chroma filters ~$70 (Chroma)
- Blue 450 nm 1W laser pointer ~$50 (eBay or Alibaba)
- 12 mm f/1.2 CCTV lens ~$7 (eBay or Alibaba)
- Peristaltic pump ~$6 (eBay or Alibaba) or syringe pump, Razel R-99 ~$160 (eBay)
- ImageJ Imaging software (NIH) is free
5. Factors Contributing to Improving the Sensitivity of Mobile, Low-Cost Optical Devices for Fluorescent Detection
- Webcams: While lenses on smartphones are not interchangeable and require additional lens attachments to change the optics, resulting in degraded image quality, many webcams permit lenses to be easily changed (e.g., a f/1.2 lens can be used to maximize the amount of light transmitted to the sensor).
- LEDs: Increasing the power of the excitation source in fluorescent detection by increasing the intensity of the LED illumination (i.e., the use of more LEDs) increases the fluorescent signal.
- Cameras: Using cooled CCD/CMOS devices reduces thermal noise and improves SNR for more sensitive detection, but they are substantially more expensive than webcams.
- Lasers: The use of low-cost lasers equipped with line generator, or removing the laser lens, may increase light intensity and provide narrow wavelength illumination.
- Exposure time: For single frame imaging, some webcams allow for long exposure times (>1 s). Longer exposure can be used to detect faint optical signals; however, longer exposure times can also increase the thermal noise level in the images, requiring the active cooling found in more expensive cameras to control it.
- Video imaging: The use of video imaging mode combined with the image stacking computational approach results in an improved SNR.
- Streak imaging: The use of streak imaging with video mode enables the path of a cell to be captured over many pixels, which reduces the size of the imaging files needed for analysis. It also reduces the time for analysis, and enhances the imaging capabilities of imaging sensors having high noise levels.
- Filters: The quality of filters is very critical. Using high-quality, narrow band filters at the emission/excitation wavelengths reduces noise and improves detection.
- Assays: Fluorescence-based assays generating strong signals are ideal for low-sensitivity optical devices. For immunoassays, primary antibody immobilization can be enhanced by increasing the surface area for antibody binding through the use of nanoparticles, such as gold nanoparticles [121] or carbon nanotubes [118,119].
6. Conclusions
Acknowledgments
Conflicts of Interest
References
- Population Data by World Bank Income Group; World Health Organization: Geneva, Switzerland, 2015.
- Mabey, D.; Peeling, R.W.; Ustianowski, A.; Perkins, M.D. Diagnostics for the Developing World. Nat. Rev. Microbiol. 2004, 2, 231–240. [Google Scholar] [CrossRef] [PubMed]
- Bollyky, T.J.; Templin, T.; Andridge, C.; Dieleman, J.L. Understanding The Relationships Between Noncommunicable Diseases, Unhealthy Lifestyles, And Country Wealth. Health Aff. 2015, 34, 1464–1471. [Google Scholar] [CrossRef] [PubMed]
- Yager, P.; Edwards, T.; Fu, E.; Helton, K.; Nelson, K.; Tam, M.R.; Weigl, B.H. Microfluidic diagnostic technologies for global public health. Nature 2006, 442, 412–418. [Google Scholar] [CrossRef]
- Vashist, S.K.; Luppa, P.B.; Yeo, L.Y.; Ozcan, A.; Luong, J.H. Emerging Technologies for Next-Generation Point-of-Care Testing. Trends Biotechnol. 2015, 33, 692–705. [Google Scholar] [CrossRef] [PubMed]
- Thiyagaraja, S.R.; Vempati, J.; Dantu, R.; Sarma, T.; Dantu, S. Smart phone monitoring of second heart sound split. In Proceedings of the 2014 36th Annual International Conference of the IEEE Engineering in Medicine and Biology Society, Chicago, IL, USA, 26–30 August 2014; pp. 2181–2184.
- Matzek, B.A.; Fivecoat, P.T.; Ritz, R.B. Novel approach to the diagnosis of fractures in an austere environment using a stethoscope and a cellular phone. Wilderness Environ. Med. 2014, 25, 99–102. [Google Scholar] [CrossRef] [PubMed]
- Chandrasekaran, V.; Dantu, R.; Jonnada, S.; Thiyagaraja, S.; Subbu, K.P. Cuffless differential blood pressure estimation using smart phones. IEEE Trans. Biomed. Eng. 2013, 60, 1080–1089. [Google Scholar] [CrossRef] [PubMed]
- Vaidya, A.S.; Srinivas, M.B.; Himabindu, P.; Jumaxanova, D. A smart phone/tablet based mobile health care system for developing countries. Conf. Proc. IEEE Eng. Med. Biol. Soc. 2013, 2013, 4642–4645. [Google Scholar] [PubMed]
- Gregoski, M.J.; Vertegel, A.; Shaporev, A.; Treiber, F.A. Tension Tamer: delivering meditation with objective heart rate acquisition for adherence monitoring using a smart phone platform. J. Altern Complement Med. 2013, 19, 17–19. [Google Scholar] [CrossRef] [PubMed]
- Shillinglaw, B.; Viera, A.J.; Edwards, T.; Simpson, R.; Sheridan, S.L. Use of global coronary heart disease risk assessment in practice: A cross-sectional survey of a sample of U.S. physicians. BMC Health Serv. Res. 2012, 12, 20. [Google Scholar] [CrossRef] [PubMed]
- Remer, I.; Bilenca, A. Laser speckle spatiotemporal variance analysis for noninvasive widefield measurements of blood pulsation and pulse rate on a camera-phone. J. Biophotonics 2015, 8, 902–907. [Google Scholar] [CrossRef] [PubMed]
- Wojtczak, J.; Bonadonna, P. Pocket mobile smartphone system for the point-of-care submandibular ultrasonography. Am. J. Emerg. Med. 2013, 31, 573–577. [Google Scholar] [CrossRef] [PubMed]
- Pirnstill, C.W.; Cote, G.L. Malaria Diagnosis Using a Mobile Phone Polarized Microscope. Sci. Rep. 2015, 5, 13368. [Google Scholar] [CrossRef] [PubMed]
- Phillips, Z.F.; D'Ambrosio, M.V.; Tian, L.; Rulison, J.J.; Patel, H.S.; Sadras, N.; Gande, A.V.; Switz, N.A.; Fletcher, D.A.; Waller, L. Multi-Contrast Imaging and Digital Refocusing on a Mobile Microscope with a Domed LED Array. PLoS ONE 2015, 10, e0124938. [Google Scholar] [CrossRef] [PubMed]
- Koydemir, H.C.; Gorocs, Z.; Tseng, D.; Cortazar, B.; Feng, S.; Chan, R.Y.; Burbano, J.; McLeod, E.; Ozcan, A. Rapid imaging, detection and quantification of Giardia lamblia cysts using mobile-phone based fluorescent microscopy and machine learning. Lab Chip 2015, 15, 1284–1293. [Google Scholar] [CrossRef] [PubMed]
- D'Ambrosio, M.V.; Bakalar, M.; Bennuru, S.; Reber, C.; Skandarajah, A.; Nilsson, L.; Switz, N.; Kamgno, J.; Pion, S.; Boussinesq, M.; et al. Point-of-care quantification of blood-borne filarial parasites with a mobile phone microscope. Sci. Transl. Med. 2015, 7, 286re4. [Google Scholar] [CrossRef] [PubMed]
- Switz, N.A.; D'Ambrosio, M.V.; Fletcher, D.A. Low-cost mobile phone microscopy with a reversed mobile phone camera lens. PLoS ONE 2014, 9, e95330. [Google Scholar] [CrossRef] [PubMed]
- Zhang, Y.; Greenbaum, A.; Luo, W.; Ozcan, A. Wide-field pathology imaging using on-chip microscopy. Virchows Arch. 2015, 467, 3–7. [Google Scholar] [CrossRef] [PubMed]
- Gorocs, Z.; McLeod, E.; Ozcan, A. Enhanced light collection in fluorescence microscopy using self-assembled micro-reflectors. Sci. Rep. 2015, 5, 10999. [Google Scholar] [CrossRef] [PubMed]
- Wei, Q.; Luo, W.; Chiang, S.; Kappel, T.; Mejia, C.; Tseng, D.; Yan Lok Chan, R.; Yan, E.; Qi, H.; Shabbir, F.; et al. Imaging and sizing of single DNA molecules on a mobile phone. ACS Nano 2014, 8, 12725–12733. [Google Scholar] [CrossRef] [PubMed]
- Pushkarsky, I.; Liu, Y.; Weaver, W.; Su, T.W.; Mudanyali, O.; Ozcan, A.; Di Carlo, D. Automated single-cell motility analysis on a chip using lensfree microscopy. Sci. Rep. 2014, 4, 4717. [Google Scholar] [PubMed]
- Delaney, J.L.; Hogan, C.F. Mobile phone based electrochemiluminescence detection in paper-based microfluidic sensors. Methods Mol. Biol. 2015, 1256, 277–289. [Google Scholar] [PubMed]
- Lee, D.S.; Jeon, B.G.; Ihm, C.; Park, J.K.; Jung, M.Y. A simple and smart telemedicine device for developing regions: a pocket-sized colorimetric reader. Lab Chip 2011, 11, 120–126. [Google Scholar] [CrossRef] [PubMed]
- Lab on a Chip Technology; Herold, K.E.; Rasooly, A. (Eds.) Caister Academic press: Norfolk, UK, 2009; Volume 1.
- Comina, G.; Suska, A.; Filippini, D. Autonomous Chemical Sensing Interface for Universal Cell Phone Readout. Angew. Chem. Int. Ed. Engl. 2015, 54, 8708–8712. [Google Scholar] [CrossRef] [PubMed]
- Chen, A.; Wang, R.; Bever, C.R.; Xing, S.; Hammock, B.D.; Pan, T. Smartphone-interfaced lab-on-a-chip devices for field-deployable enzyme-linked immunosorbent assay. Biomicrofluidics 2014, 8, 064101. [Google Scholar] [CrossRef] [PubMed]
- Borysiak, M.D.; Kimura, K.W.; Posner, J.D. NAIL: Nucleic Acid detection using Isotachophoresis and Loop-mediated isothermal amplification. Lab Chip 2015, 15, 1697–1707. [Google Scholar] [CrossRef] [PubMed]
- Sun, S.; Ossandon, M.; Kostov, Y.; Rasooly, A. Lab-on-a-chip for botulinum neurotoxin a (BoNT-A) activity analysis. Lab Chip 2009, 9, 3275–3281. [Google Scholar] [CrossRef] [PubMed]
- Sun, S.; Yang, M.; Kostov, Y.; Rasooly, A. ELISA-LOC: lab-on-a-chip for enzyme-linked immunodetection. Lab Chip 2010, 10, 2093–2100. [Google Scholar] [CrossRef] [PubMed]
- Biosensors and Biodetection: Methods and Protocols; Rasooly, A.; Herold, K.E. (Eds.) Springer: Perlin, Germany.
- Capitan-Vallvey, L.F.; Asensio, L.J.; Lopez-Gonzalez, J.; Fernandez-Ramos, M.D.; Palma, A.J. Oxygen-sensing film coated photodetectors for portable instrumentation. Anal. Chim. Acta 2007, 583, 166–173. [Google Scholar] [CrossRef] [PubMed]
- Mac Sweeney, M.M.; Bertolino, C.; Berney, H.; Sheehan, M. Characterization and optimization of an optical DNA hybridization sensor for the detection of multi-drug resistant tuberculosis. Conf. Proc. IEEE Eng. Med. Biol. Soc. 2004, 3, 1960–1963. [Google Scholar] [PubMed]
- Claycomb, R.W.; Delwiche, M.J. Biosensor for on-line measurement of bovine progesterone during milking. Biosens. Bioelectron. 1998, 13, 1173–1180. [Google Scholar] [CrossRef]
- Bruno, A.E.; Barnard, S.; Rouilly, M.; Waldner, A.; Berger, J.; Ehrat, M. All-solid-state miniaturized fluorescence sensor array for the determination of critical gases and electrolytes in blood. Anal. Chem. 1997, 69, 507–513. [Google Scholar] [CrossRef] [PubMed]
- Moehrs, S.; Del Guerra, A.; Herbert, D.J.; Mandelkern, M.A. A detector head design for small-animal PET with silicon photomultipliers (SiPM). Phys. Med. Biol. 2006, 51, 1113–1127. [Google Scholar] [CrossRef] [PubMed]
- Takei, M.; Kida, T.; Suzuki, K. Sensitive measurement of positron emitters eluted from HPLC. Appl. Radiat. Isot. 2001, 55, 229–234. [Google Scholar] [CrossRef]
- Ruiz-Martinez, M.C.; Berka, J.; Belenkii, A.; Foret, F.; Miller, A.W.; Karger, B.L. DNA sequencing by capillary electrophoresis with replaceable linear polyacrylamide and laser-induced fluorescence detection. Anal. Chem. 1993, 65, 2851–2858. [Google Scholar] [CrossRef] [PubMed]
- Tibbe, A.G.; de Grooth, B.G.; Greve, J.; Liberti, P.A.; Dolan, G.J.; Terstappen, L.W. Cell analysis system based on immunomagnetic cell selection and alignment followed by immunofluorescent analysis using compact disk technologies. Cytometry 2001, 43, 31–37. [Google Scholar] [CrossRef]
- Tsukagoshi, K.; Jinno, N.; Nakajima, R. Development of a micro total analysis system incorporating chemiluminescence detection and application to detection of cancer markers. Anal. Chem. 2005, 77, 1684–1688. [Google Scholar] [CrossRef] [PubMed]
- Roda, A.; Manetta, A.C.; Portanti, O.; Mirasoli, M.; Guardigli, M.; Pasini, P.; Lelli, R. A rapid and sensitive 384-well microtitre format chemiluminescent enzyme immunoassay for 19-nortestosterone. Luminescence 2003, 18, 72–78. [Google Scholar] [CrossRef] [PubMed]
- Taitt, C.R.; Anderson, G.P.; Ligler, F.S. Evanescent wave fluorescence biosensors. Biosens. Bioelectron. 2005, 20, 2470–2487. [Google Scholar] [CrossRef] [PubMed]
- Ngundi, M.M.; Qadri, S.A.; Wallace, E.V.; Moore, M.H.; Lassman, M.E.; Shriver-Lake, L.C.; Ligler, F.S.; Taitt, C.R. Detection of deoxynivalenol in foods and indoor air using an array biosensor. Environ. Sci. Technol. 2006, 40, 2352–2356. [Google Scholar] [CrossRef] [PubMed]
- Moreno-Bondi, M.C.; Taitt, C.R.; Shriver-Lake, L.C.; Ligler, F.S. Multiplexed measurement of serum antibodies using an array biosensor. Biosens. Bioelectron. 2006, 21, 1880–1886. [Google Scholar] [CrossRef] [PubMed]
- Ligler, F.S.; Sapsford, K.E.; Golden, J.P.; Shriver-Lake, L.C.; Taitt, C.R.; Dyer, M.A.; Barone, S.; Myatt, C.J. The array biosensor: portable, automated systems. Anal. Sci. 2007, 23, 5–10. [Google Scholar] [CrossRef] [PubMed]
- Kostov, Y.; Sergeev, N.; Wilson, S.; Herold, K.E.; Rasooly, A. A simple portable electroluminescence illumination-based CCD detector. Methods Mol. Biol. 2009, 503, 259–272. [Google Scholar] [PubMed]
- Sapsford, K.E.; Sun, S.; Francis, J.; Sharma, S.; Kostov, Y.; Rasooly, A. A fluorescence detection platform using spatial electroluminescent excitation for measuring botulinum neurotoxin A activity. Biosens. Bioelectron. 2008, 24, 618–625. [Google Scholar] [CrossRef] [PubMed]
- Sun, S.; Francis, J.; Sapsford, K.E.; Kostov, Y.; Rasooly, A. Multi-wavelength Spatial LED illumination based detector for in vitro detection of Botulinum Neurotoxin A Activity. Sens. Actuators B Chem. 2010, 146, 297–306. [Google Scholar] [CrossRef] [PubMed]
- Rasooly, R.; Balsam, J.; Hernlem, B.J.; Rasooly, A. Sensitive detection of active Shiga toxin using low cost CCD based optical detector. Biosens. Bioelectron. 2015, 68, 705–711. [Google Scholar] [CrossRef] [PubMed]
- Mudanyali, O.; Dimitrov, S.; Sikora, U.; Padmanabhan, S.; Navruz, I.; Ozcan, A. Integrated rapid-diagnostic-test reader platform on a cellphone. Lab Chip 2012, 12, 2678–2686. [Google Scholar] [CrossRef] [PubMed]
- Balsam, J.; Bruck, H.A.; Rasooly, A. Orthographic Projection Capillary Array Fluorescent Sensor for mHealth. Methods 2013, 63, 276–281. [Google Scholar] [CrossRef] [PubMed]
- Balsam, J.; Rasooly, R.; Bruck, H.A.; Rasooly, A. Thousand-fold fluorescent signal amplification for mHealth diagnostics. Biosens. Bioelectron. 2013, 51C, 1–7. [Google Scholar] [CrossRef] [PubMed]
- Balsam, J.; Bruck, H.A.; Rasooly, A. Capillary array waveguide amplified fluorescence detector for mHealth. Sens. Actuators B Chem. 2013, 186, 711–717. [Google Scholar] [CrossRef] [PubMed]
- Zhu, H.; Yaglidere, O.; Su, T.W.; Tseng, D.; Ozcan, A. Wide-field fluorescent microscopy on a cell-phone. Conf. Proc. IEEE Eng. Med. Biol. Soc. 2011, 2011, 6801–6804. [Google Scholar] [PubMed]
- Tseng, D.; Mudanyali, O.; Oztoprak, C.; Isikman, S.O.; Sencan, I.; Yaglidere, O.; Ozcan, A. Lensfree microscopy on a cellphone. Lab Chip 2010, 10, 1787–1792. [Google Scholar] [CrossRef] [PubMed]
- Zhu, H.; Sikora, U.; Ozcan, A. Quantum dot enabled detection of Escherichia coli using a cell-phone. Analyst 2012, 137, 2541–2544. [Google Scholar] [CrossRef] [PubMed]
- Zhu, H.; Mavandadi, S.; Coskun, A.F.; Yaglidere, O.; Ozcan, A. Optofluidic fluorescent imaging cytometry on a cell phone. Anal. Chem. 2011, 83, 6641–6647. [Google Scholar] [CrossRef] [PubMed]
- Liu, Y.; Liu, Q.; Chen, S.; Cheng, F.; Wang, H.; Peng, W. Surface Plasmon Resonance Biosensor Based on Smart Phone Platforms. Sci. Rep. 2015, 5, 12864. [Google Scholar] [CrossRef] [PubMed]
- Sowerby, S.J.; Crump, J.A.; Johnstone, M.C.; Krause, K.L.; Hill, P.C. Smartphone Microscopy of Parasite Eggs Accumulated into a Single Field of View. Am. J. Trop Med. Hyg. 2016, 94, 227–230. [Google Scholar] [CrossRef] [PubMed]
- Dendere, R.; Myburg, N.; Douglas, T.S. A review of cellphone microscopy for disease detection. J. Microsc. 2015, 260, 248–59. [Google Scholar] [CrossRef] [PubMed]
- Zhu, H.; Ozcan, A. Opto-fluidics based microscopy and flow cytometry on a cell phone for blood analysis. Methods Mol. Biol. 2015, 1256, 171–190. [Google Scholar] [PubMed]
- Bogoch, I.I.; Andrews, J.R.; Speich, B.; Utzinger, J.; Ame, S.M.; Ali, S.M.; Keiser, J. Mobile phone microscopy for the diagnosis of soil-transmitted helminth infections: a proof-of-concept study. Am. J. Trop. Med. Hyg. 2013, 88, 626–629. [Google Scholar]
- Ilhan, H.A.; Dogar, M.; Ozcan, M. Digital holographic microscopy and focusing methods based on image sharpness. J. Microsc. 2014, 255, 138–149. [Google Scholar] [CrossRef] [PubMed]
- Yeo, S.J.; Choi, K.; Cuc, B.T.; Hong, N.N.; Bao, D.T.; Ngoc, N.M.; Le, M.Q.; Hang Nle, K.; Thach, N.C.; Mallik, S.K.; et al. Smartphone-Based Fluorescent Diagnostic System for Highly Pathogenic H5N1 Viruses. Theranostics 2016, 6, 231–242. [Google Scholar] [CrossRef] [PubMed]
- Slusarewicz, P.; Pagano, S.; Mills, C.; Popa, G.; Chow, K.M.; Mendenhall, M.; Rodgers, D.W.; Nielsen, M.K. Automated parasite faecal egg counting using fluorescence labelling, smartphone image capture and computational image analysis. Int. J. Parasitol. 2016. [Google Scholar] [CrossRef] [PubMed]
- Nicolini, A.M.; Fronczek, C.F.; Yoon, J.Y. Droplet-based immunoassay on a “sticky” nanofibrous surface for multiplexed and dual detection of bacteria using smartphones. Biosens. Bioelectron. 2015, 67, 560–569. [Google Scholar] [CrossRef] [PubMed]
- Harshman, D.K.; Rao, B.M.; McLain, J.E.; Watts, G.S.; Yoon, J.Y. Innovative qPCR using interfacial effects to enable low threshold cycle detection and inhibition relief. Sci. Adv. 2015, 1, e1400061. [Google Scholar] [CrossRef] [PubMed]
- Cho, S.; Park, T.S.; Nahapetian, T.G.; Yoon, J.Y. Smartphone-based, sensitive microPAD detection of urinary tract infection and gonorrhea. Biosens. Bioelectron. 2015, 74, 601–611. [Google Scholar] [CrossRef] [PubMed]
- Balsam, J.; Bruck, H.A.; Rasooly, A. Smartphone-based fluorescence detector for mHealth. Methods Mol. Biol. 2015, 1256, 231–245. [Google Scholar] [PubMed]
- Yu, H.; Tan, Y.; Cunningham, B.T. Smartphone fluorescence spectroscopy. Anal. Chem. 2014, 86, 8805–8813. [Google Scholar] [CrossRef] [PubMed]
- Awqatty, B.; Samaddar, S.; Cash, K.J.; Clark, H.A.; Dubach, J.M. Fluorescent sensors for the basic metabolic panel enable measurement with a smart phone device over the physiological range. Analyst 2014, 139, 5230–5238. [Google Scholar] [CrossRef] [PubMed]
- Yu, B.; Nagarajan, V.K.; Ferris, D.G. Mobile fiber-optic sensor for detection of oral and cervical cancer in the developing world. Methods Mol. Biol. 2015, 1256, 155–170. [Google Scholar] [PubMed]
- Dantu, V.; Vempati, J.; Srivilliputhur, S. Non-invasive blood glucose monitor based on spectroscopy using a smartphone. Conf. Proc. IEEE Eng. Med. Biol. Soc. 2014, 2014, 3695–3698. [Google Scholar] [PubMed]
- Arafat Hossain, M.; Canning, J.; Ast, S.; Cook, K.; Rutledge, P.J.; Jamalipour, A. Combined “dual” absorption and fluorescence smartphone spectrometers. Opt. Lett. 2015, 40, 1737–1740. [Google Scholar] [CrossRef] [PubMed]
- Im, H.; Castro, C.M.; Shao, H.; Liong, M.; Song, J.; Pathania, D.; Fexon, L.; Min, C.; Avila-Wallace, M.; Zurkiya, O.; et al. Digital diffraction analysis enables low-cost molecular diagnostics on a smartphone. Proc. Natl. Acad. Sci. USA 2015, 112, 5613–5618. [Google Scholar] [CrossRef] [PubMed]
- Long, K.D.; Yu, H.; Cunningham, B.T. Smartphone instrument for portable enzyme-linked immunosorbent assays. Biomed. Opt. Express 2014, 5, 3792–3806. [Google Scholar] [CrossRef] [PubMed]
- Skandarajah, A.; Reber, C.D.; Switz, N.A.; Fletcher, D.A. Quantitative imaging with a mobile phone microscope. PLoS ONE 2014, 9, e96906. [Google Scholar] [CrossRef] [PubMed]
- Gallegos, D.; Long, K.D.; Yu, H.; Clark, P.P.; Lin, Y.; George, S.; Nath, P.; Cunningham, B.T. Label-free biodetection using a smartphone. Lab Chip 2013, 13, 2124–2132. [Google Scholar] [CrossRef] [PubMed]
- Rodriguez-Manzano, J.; Karymov, M.A.; Begolo, S.; Selck, D.A.; Zhukov, D.V.; Jue, E.; Ismagilov, R.F. Reading Out Single-Molecule Digital RNA and DNA Isothermal Amplification in Nanoliter Volumes with Unmodified Camera Phones. ACS Nano 2016, 10, 3102–3113. [Google Scholar] [CrossRef] [PubMed]
- Levin, S.; Krishnan, S.; Rajkumar, S.; Halery, N.; Balkunde, P. Monitoring of fluoride in water samples using a smartphone. Sci. Total Environ. 2016, 551–552, 101–107. [Google Scholar] [CrossRef] [PubMed]
- Choi, K.; Chang, I.; Lee, J.C.; Kim, D.K.; Noh, S.; Ahn, H.; Cho, J.H.; Kwak, Y.H.; Kim, S.; Kim, H.C. Smartphone-Based Urine Reagent Strip Test in the Emergency Department. Telemed. J. E Health 2016, in press. [Google Scholar] [CrossRef] [PubMed]
- Kaiqi, S.; Quchao, Z.; Ning, H.; Ping, W. High-sensitive and high-efficient biochemical analysis method using a bionic electronic eye in combination with a smartphone-based colorimetric reader system. Conf. Proc. IEEE Eng. Med. Biol. Soc. 2015, 2015, 7720–7723. [Google Scholar]
- De Fez, D.; Luque, M.J.; Garcia-Domene, M.C.; Camps, V.; Pinero, D. Colorimetric Characterization of Mobile Devices for Vision Applications. Optom Vis. Sci. 2016, 93, 85–93. [Google Scholar] [CrossRef] [PubMed]
- Sekine, Y.; Katori, R.; Tsuda, Y.; Kitahara, T. Colorimetric monitoring of formaldehyde in indoor environment using built-in camera on mobile phone. Environ. Technol. 2016, 37, 1647–1655. [Google Scholar] [CrossRef] [PubMed]
- Jung, Y.; Kim, J.; Awofeso, O.; Kim, H.; Regnier, F.; Bae, E. Smartphone-based colorimetric analysis for detection of saliva alcohol concentration. Appl. Opt. 2015, 54, 9183–9189. [Google Scholar] [CrossRef] [PubMed]
- Yang, X.; Wang, Y.; Liu, W.; Zhang, Y.; Zheng, F.; Wang, S.; Zhang, D.; Wang, J. A portable system for on-site quantification of formaldehyde in air based on G-quadruplex halves coupled with A smartphone reader. Biosens. Bioelectron. 2016, 75, 48–54. [Google Scholar] [CrossRef] [PubMed]
- Loh, L.J.; Bandara, G.C.; Weber, G.L.; Remcho, V.T. Detection of water contamination from hydraulic fracturing wastewater: A muPAD for bromide analysis in natural waters. Analyst 2015, 140, 5501–5507. [Google Scholar] [CrossRef] [PubMed]
- Thiha, A.; Ibrahim, F. A Colorimetric Enzyme-Linked Immunosorbent Assay (ELISA) Detection Platform for a Point-of-Care Dengue Detection System on a Lab-on-Compact-Disc. Sensors (Basel) 2015, 15, 11431–11441. [Google Scholar] [CrossRef] [PubMed]
- Barbosa, A.I.; Gehlot, P.; Sidapra, K.; Edwards, A.D.; Reis, N.M. Portable smartphone quantitation of prostate specific antigen (PSA) in a fluoropolymer microfluidic device. Biosens. Bioelectron. 2015, 70, 5–14. [Google Scholar] [CrossRef] [PubMed]
- Nie, H.; Wang, W.; Li, W.; Nie, Z.; Yao, S. A colorimetric and smartphone readable method for uracil-DNA glycosylase detection based on the target-triggered formation of G-quadruplex. Analyst 2015, 140, 2771–2777. [Google Scholar] [CrossRef] [PubMed]
- Veigas, B.; Fortunato, E.; Baptista, P.V. Mobile based gold nanoprobe TB diagnostics for point-of-need. Methods Mol. Biol. 2015, 1256, 41–56. [Google Scholar] [PubMed]
- Sicard, C.; Glen, C.; Aubie, B.; Wallace, D.; Jahanshahi-Anbuhi, S.; Pennings, K.; Daigger, G.T.; Pelton, R.; Brennan, J.D.; Filipe, C.D. Tools for water quality monitoring and mapping using paper-based sensors and cell phones. Water Res. 2015, 70, 360–369. [Google Scholar] [CrossRef] [PubMed]
- Vashist, S.K.; van Oordt, T.; Schneider, E.M.; Zengerle, R.; von Stetten, F.; Luong, J.H. A smartphone-based colorimetric reader for bioanalytical applications using the screen-based bottom illumination provided by gadgets. Biosens. Bioelectron. 2015, 67, 248–255. [Google Scholar] [CrossRef] [PubMed]
- Lopez-Ruiz, N.; Curto, V.F.; Erenas, M.M.; Benito-Lopez, F.; Diamond, D.; Palma, A.J.; Capitan-Vallvey, L.F. Smartphone-based simultaneous pH and nitrite colorimetric determination for paper microfluidic devices. Anal. Chem. 2014, 86, 9554–9562. [Google Scholar] [CrossRef] [PubMed]
- Mancuso, M.; Cesarman, E.; Erickson, D. Detection of Kaposi's sarcoma associated herpesvirus nucleic acids using a smartphone accessory. Lab Chip 2014, 14, 3809–3816. [Google Scholar] [CrossRef] [PubMed]
- Ozgur, E.; Guler, G.; Kismali, G.; Seyhan, N. Mobile phone radiation alters proliferation of hepatocarcinoma cells. Cell Biochem. Biophys. 2014, 70, 983–991. [Google Scholar] [CrossRef] [PubMed]
- Hong, J.I.; Chang, B.Y. Development of the smartphone-based colorimetry for multi-analyte sensing arrays. Lab Chip 2014, 14, 1725–1732. [Google Scholar] [CrossRef] [PubMed]
- Oncescu, V.; O’Dell, D.; Erickson, D. Smartphone based health accessory for colorimetric detection of biomarkers in sweat and saliva. Lab Chip 2013, 13, 3232–3238. [Google Scholar] [CrossRef] [PubMed]
- Shen, L.; Hagen, J.A.; Papautsky, I. Point-of-care colorimetric detection with a smartphone. Lab Chip 2012, 12, 4240–4243. [Google Scholar] [CrossRef] [PubMed]
- Lebiga, E.; Fernandez, R.E.; Beskok, A. Confined chemiluminescence detection of nanomolar levels of H2O2 in a paper-plastic disposable microfluidic device using a smartphone. Analyst 2015, 140, 5006–5011. [Google Scholar] [CrossRef] [PubMed]
- Roda, A.; Guardigli, M.; Calabria, D.; Calabretta, M.M.; Cevenini, L.; Michelini, E. A 3D-printed device for a smartphone-based chemiluminescence biosensor for lactate in oral fluid and sweat. Analyst 2014, 139, 6494–6501. [Google Scholar] [CrossRef] [PubMed]
- Zangheri, M.; Cevenini, L.; Anfossi, L.; Baggiani, C.; Simoni, P.; Di Nardo, F.; Roda, A. A simple and compact smartphone accessory for quantitative chemiluminescence-based lateral flow immunoassay for salivary cortisol detection. Biosens. Bioelectron. 2015, 64, 63–68. [Google Scholar] [CrossRef] [PubMed]
- Roda, A.; Michelini, E.; Cevenini, L.; Calabria, D.; Calabretta, M.M.; Simoni, P. Integrating biochemiluminescence detection on smartphones: mobile chemistry platform for point-of-need analysis. Anal. Chem. 2014, 86, 7299–7304. [Google Scholar] [CrossRef] [PubMed]
- Delaney, J.L.; Hogan, C.F.; Tian, J.; Shen, W. Electrogenerated chemiluminescence detection in paper-based microfluidic sensors. Anal. Chem. 2011, 83, 1300–1306. [Google Scholar] [CrossRef] [PubMed]
- Delaney, J.L.; Doeven, E.H.; Harsant, A.J.; Hogan, C.F. Use of a mobile phone for potentiostatic control with low cost paper-based microfluidic sensors. Anal. Chim. Acta 2013, 790, 56–60. [Google Scholar] [CrossRef] [PubMed]
- Lee, K.L.; You, M.L.; Tsai, C.H.; Lin, E.H.; Hsieh, S.Y.; Ho, M.H.; Hsu, J.C.; Wei, P.K. Nanoplasmonic biochips for rapid label-free detection of imidacloprid pesticides with a smartphone. Biosens Bioelectron 2016, 75, 88–95. [Google Scholar] [CrossRef] [PubMed]
- Bremer, K.; Roth, B. Fibre optic surface plasmon resonance sensor system designed for smartphones. Opt. Express 2015, 23, 17179–17184. [Google Scholar] [CrossRef] [PubMed]
- Zhang, D.; Liu, Q. Biosensors and bioelectronics on smartphone for portable biochemical detection. Biosens. Bioelectron 2016, 75, 273–284. [Google Scholar] [CrossRef] [PubMed]
- Sun, A.; Wambach, T.; Venkatesh, A.G.; Hall, D.A. A Low-Cost Smartphone-Based Electrochemical Biosensor for Point-of-Care Diagnostics. IEEE Biomed. Circuits Syst. Conf. 2014, 2014, 312–315. [Google Scholar] [PubMed]
- Lan, T.; Xiang, Y.; Lu, Y. Detection of protein biomarker using a blood glucose meter. Methods Mol. Biol. 2015, 1256, 99–109. [Google Scholar] [PubMed]
- Nemiroski, A.; Christodouleas, D.C.; Hennek, J.W.; Kumar, A.A.; Maxwell, E.J.; Fernandez-Abedul, M.T.; Whitesides, G.M. Universal mobile electrochemical detector designed for use in resource-limited applications. Proc. Natl. Acad. Sci. USA 2014, 111, 11984–11989. [Google Scholar] [CrossRef] [PubMed]
- Lillehoj, P.B.; Huang, M.C.; Truong, N.; Ho, C.M. Rapid electrochemical detection on a mobile phone. Lab Chip 2013, 13, 2950–2955. [Google Scholar] [PubMed]
- Huang, Y.W.; Ugaz, V.M. Smartphone-based detection of unlabeled DNA via electrochemical dissolution. Analyst 2013, 138, 2522–2526. [Google Scholar] [CrossRef] [PubMed]
- Zhang, L.; Yang, W.; Yang, Y.; Liu, H.; Gu, Z. Smartphone-based point-of-care testing of salivary alpha-amylase for personal psychological measurement. Analyst 2015, 140, 7399–7406. [Google Scholar] [CrossRef] [PubMed]
- Rose, D.P.; Ratterman, M.E.; Griffin, D.K.; Hou, L.; Kelley-Loughnane, N.; Naik, R.R.; Hagen, J.A.; Papautsky, I.; Heikenfeld, J.C. Adhesive RFID Sensor Patch for Monitoring of Sweat Electrolytes. IEEE Trans. Biomed. Eng. 2015, 62, 1457–1465. [Google Scholar] [CrossRef] [PubMed]
- Engvall, E.; Perlmann, P. Enzyme-linked immunosorbent assay (ELISA). Quantitative assay of immunoglobulin G. Immunochemistry 1971, 8, 871–874. [Google Scholar] [PubMed]
- Van Weemen, B.K.; Schuurs, A.H. Immunoassay using antigen-enzyme conjugates. FEBS Lett. 1971, 15, 232–236. [Google Scholar] [CrossRef]
- Yang, M.; Kostov, Y.; Bruck, H.A.; Rasooly, A. Carbon nanotubes with enhanced chemiluminescence immunoassay for CCD-based detection of Staphylococcal enterotoxin B in food. Anal. Chem. 2008, 80, 8532–8537. [Google Scholar] [CrossRef] [PubMed]
- Yang, M.; Kostov, Y.; Rasooly, A. Carbon nanotubes based optical immunodetection of Staphylococcal Enterotoxin B (SEB) in food. Int. J. Food Microbiol. 2008, 127, 78–83. [Google Scholar] [CrossRef] [PubMed]
- Sapsford, K.E.; Francis, J.; Sun, S.; Kostov, Y.; Rasooly, A. Miniaturized 96-well ELISA chips for staphylococcal enterotoxin B detection using portable colorimetric detector. Anal. Bioanal. Chem. 2009, 394, 499–505. [Google Scholar] [CrossRef] [PubMed]
- Yang, M.; Kostov, Y.; Bruck, H.A.; Rasooly, A. Gold nanoparticle-based enhanced chemiluminescence immunosensor for detection of Staphylococcal Enterotoxin B (SEB) in food. Int. J. Food Microbiol. 2009, 133, 265–271. [Google Scholar] [CrossRef] [PubMed]
- Wang, S.; Zhao, X.; Khimji, I.; Akbas, R.; Qiu, W.; Edwards, D.; Cramer, D.W.; Ye, B.; Demirci, U. Integration of cell phone imaging with microchip ELISA to detect ovarian cancer HE4 biomarker in urine at the point-of-care. Lab Chip 2011, 11, 3411–3418. [Google Scholar] [CrossRef] [PubMed]
- Jiang, L.; Mancuso, M.; Lu, Z.; Akar, G.; Cesarman, E.; Erickson, D. Solar thermal polymerase chain reaction for smartphone-assisted molecular diagnostics. Sci. Rep. 2014, 4, 4137. [Google Scholar] [CrossRef] [PubMed]
- Snodgrass, R.; Gardner, A.; Jiang, L.; Fu, C.; Cesarman, E.; Erickson, D. KS-Detect—Validation of Solar Thermal PCR for the Diagnosis of Kaposi's Sarcoma Using Pseudo-Biopsy Samples. PLoS ONE 2016, 11, e0147636. [Google Scholar] [CrossRef] [PubMed]
- Laksanasopin, T.; Guo, T.W.; Nayak, S.; Sridhara, A.A.; Xie, S.; Olowookere, O.O.; Cadinu, P.; Meng, F.; Chee, N.H.; Kim, J.; et al. A smartphone dongle for diagnosis of infectious diseases at the point of care. Sci. Transl. Med. 2015, 7, 273re1. [Google Scholar] [CrossRef] [PubMed]
- Ludwig, S.K.; Tokarski, C.; Lang, S.N.; van Ginkel, L.A.; Zhu, H.; Ozcan, A.; Nielen, M.W.F. Calling Biomarkers in Milk Using a Protein Microarray on Your Smartphone. PLoS ONE 2015, 10, e0134360. [Google Scholar] [CrossRef] [PubMed]
- Berg, B.; Cortazar, B.; Tseng, D.; Ozkan, H.; Feng, S.; Wei, Q.; Chan, R.Y.; Burbano, J.; Farooqui, Q.; Lewinski, M.; et al. Cellphone-Based Hand-Held Microplate Reader for Point-of-Care Testing of Enzyme-Linked Immunosorbent Assays. ACS Nano 2015, 9, 7857–7866. [Google Scholar] [CrossRef] [PubMed]
- Balsam, J.; Ossandon, M.; Bruck, H.A.; Lubensky, I.; Rasooly, A. Low-cost technologies for medical diagnostics in low-resource settings. Expert Opin. Med. Diagn 2013, 7, 243–255. [Google Scholar] [CrossRef] [PubMed]
- Yang, M.; Sun, S.; Kostov, Y.; Rasooly, A. Lab-On-a-Chip for carbon nanotubes based immunoassay detection of Staphylococcal Enterotoxin B (SEB). Lab Chip 2010, 10, 1011–1017. [Google Scholar] [CrossRef] [PubMed]
- Yang, M.; Sun, S.; Kostov, Y.; Rasooly, A. An automated point-of-care system for immunodetection of staphylococcal enterotoxin B. Anal. Biochem. 2011, 416, 74–81. [Google Scholar] [CrossRef] [PubMed]
- Balsam, J.; Bruck, H.A.; Rasooly, A. Cell streak imaging cytometry for rare cell detection. Biosens. Bioelectron. 2015, 64, 54–60. [Google Scholar] [CrossRef] [PubMed]
- Zhu, H.; Ozcan, A. Wide-field Fluorescent Microscopy and Fluorescent Imaging Flow Cytometry on a Cell-phone. 2013. [Google Scholar] [CrossRef]
- Seo, S.; Su, T.W.; Tseng, D.K.; Erlinger, A.; Ozcan, A. Lensfree holographic imaging for on-chip cytometry and diagnostics. Lab Chip 2009, 9, 777–787. [Google Scholar] [CrossRef] [PubMed]
- Su, T.W.; Seo, S.; Erlinger, A.; Ozcan, A. Multi-angle LUCAS for high-throughput on-chip cytometry. Conf. Proc. IEEE Eng. Med. Biol. Soc. 2008, 2008, 1854–1855. [Google Scholar] [PubMed]
- Zuba-Surma, E.K.; Ratajczak, M.Z. Analytical capabilities of the ImageStream cytometer. Methods Cell Biol. 2011, 102, 207–230. [Google Scholar] [PubMed]
- George, T.C.; Basiji, D.A.; Hall, B.E.; Lynch, D.H.; Ortyn, W.E.; Perry, D.J.; Seo, M.J.; Zimmerman, C.A.; Morrissey, P.J. Distinguishing modes of cell death using the ImageStream multispectral imaging flow cytometer. Cytometry A 2004, 59, 237–245. [Google Scholar] [CrossRef] [PubMed]
- Beum, P.V.; Lindorfer, M.A.; Hall, B.E.; George, T.C.; Frost, K.; Morrissey, P.J.; Taylor, R.P. Quantitative analysis of protein co-localization on B cells opsonized with rituximab and complement using the ImageStream multispectral imaging flow cytometer. J. Immunol. Methods 2006, 317, 90–99. [Google Scholar] [CrossRef] [PubMed]
- Lopez-Riquelme, N.; Minguela, A.; Villar-Permuy, F.; Ciprian, D.; Castillejo, A.; Alvarez-Lopez, M.R.; Soto, J.L. Imaging cytometry for counting circulating tumor cells: Comparative analysis of the CellSearch vs ImageStream systems. APMIS 2013, 121, 1139–1143. [Google Scholar] [CrossRef] [PubMed]
- Zhu, H.; Ozcan, A. Wide-field fluorescent microscopy and fluorescent imaging flow cytometry on a cell-phone. J. Vis. Exp. 2013. [Google Scholar] [CrossRef] [PubMed]
- Balsam, J.; Bruck, H.A.; Rasooly, A. Mobile flow cytometer for mHealth. Methods Mol. Biol. 2015, 1256, 139–153. [Google Scholar] [PubMed]
- Balsam, J.; Bruck, H.A.; Rasooly, A. Webcam-based flow cytometer using wide-field imaging for low cell number detection at high throughput. Analyst 2014, 139, 4322–4329. [Google Scholar] [CrossRef] [PubMed]
- Moomaw, B. Camera technologies for low light imaging: overview and relative advantages. Methods Cell Biol. 2013, 114, 243–283. [Google Scholar] [PubMed]
- Balsam, J.; Rasooly, R.; Bruck, H.A.; Rasooly, A. Thousand-fold fluorescent signal amplification for mHealth diagnostics. Biosens. Bioelectron. 2014, 51, 1–7. [Google Scholar] [CrossRef] [PubMed]
- Rasooly, A.; Kostov, Y.; Bruck, H.A. Charged-coupled device (CCD) detectors for Lab-on-a Chip (LOC) optical analysis. Methods Mol. Biol. 2013, 949, 365–385. [Google Scholar] [PubMed]
- Rasooly, A.; Bruck, H.A.; Kostov, Y. An ELISA Lab-on-a-Chip (ELISA-LOC). Methods Mol. Biol. 2013, 949, 451–471. [Google Scholar] [PubMed]
- Balsam, J.; Bruck, H.A.; Rasooly, A. Orthographic projection capillary array fluorescent sensor for mHealth. Methods 2013, 63, 276–281. [Google Scholar] [CrossRef] [PubMed]
- Balsam, J.; Bruck, H.A.; Rasooly, A. Capillary Array Waveguide Amplified Fluorescence Detector for mHealth. Sens. Actuators B Chem. 2013, 186, 711–717. [Google Scholar] [CrossRef] [PubMed]
- Yang, M.; Sun, S.; Kostov, Y.; Rasooly, A. A simple 96 well microfluidic chip combined with visual and densitometry detection for resource-poor point of care testing. Sens. Actuators B Chem. 2011, 153, 176–181. [Google Scholar] [CrossRef] [PubMed]
- Balsam, J.; Ossandon, M.; Kostov, Y.; Bruck, H.A.; Rasooly, A. Lensless CCD-based fluorometer using a micromachined optical Soller collimator. Lab Chip 2011, 11, 941–949. [Google Scholar] [CrossRef] [PubMed]
- Balsam, J.; Bruck, H.A.; Kostov, Y.; Rasooly, A. Image stacking approach to increase sensitivity of fluorescence detection using a low cost complementary metal-oxide-semiconductor (CMOS) webcam. Sens. Actuators B Chem. 2012, 171–172, 141–147. [Google Scholar] [CrossRef] [PubMed]
- Balsam, J.; Bruck, H.A.; Rasooly, A. Two-layer Lab-on-a-chip (LOC) with passive capillary valves for mHealth medical diagnostics. Methods Mol. Biol. 2015, 1256, 247–258. [Google Scholar] [PubMed]
- Taitt, C.R.; Golden, J.P.; Shubin, Y.S.; Shriver-Lake, L.C.; Sapsford, K.E.; Rasooly, A.; Ligler, F.S. A portable array biosensor for detecting multiple analytes in complex samples. Microb. Ecol. 2004, 47, 175–185. [Google Scholar] [CrossRef] [PubMed]
- Herold, K.E.; Sergeev, N.; Matviyenko, A.; Rasooly, A. Rapid DNA amplification using a battery-powered thin-film resistive thermocycler. Methods Mol. Biol. 2009, 504, 441–458. [Google Scholar] [PubMed]
- Ossandon, M.; Balsam, J.; Bruck, H.A.; Rasooly, A.; Kalpakis, K. Automated cell counting for streak mode point of care imaging flow cytometry. 2016. submitted. [Google Scholar]


© 2016 by the authors; licensee MDPI, Basel, Switzerland. This article is an open access article distributed under the terms and conditions of the Creative Commons Attribution (CC-BY) license (http://creativecommons.org/licenses/by/4.0/).
Share and Cite
Rasooly, R.; Bruck, H.A.; Balsam, J.; Prickril, B.; Ossandon, M.; Rasooly, A. Improving the Sensitivity and Functionality of Mobile Webcam-Based Fluorescence Detectors for Point-of-Care Diagnostics in Global Health. Diagnostics 2016, 6, 19. https://doi.org/10.3390/diagnostics6020019
Rasooly R, Bruck HA, Balsam J, Prickril B, Ossandon M, Rasooly A. Improving the Sensitivity and Functionality of Mobile Webcam-Based Fluorescence Detectors for Point-of-Care Diagnostics in Global Health. Diagnostics. 2016; 6(2):19. https://doi.org/10.3390/diagnostics6020019
Chicago/Turabian StyleRasooly, Reuven, Hugh Alan Bruck, Joshua Balsam, Ben Prickril, Miguel Ossandon, and Avraham Rasooly. 2016. "Improving the Sensitivity and Functionality of Mobile Webcam-Based Fluorescence Detectors for Point-of-Care Diagnostics in Global Health" Diagnostics 6, no. 2: 19. https://doi.org/10.3390/diagnostics6020019
APA StyleRasooly, R., Bruck, H. A., Balsam, J., Prickril, B., Ossandon, M., & Rasooly, A. (2016). Improving the Sensitivity and Functionality of Mobile Webcam-Based Fluorescence Detectors for Point-of-Care Diagnostics in Global Health. Diagnostics, 6(2), 19. https://doi.org/10.3390/diagnostics6020019