The Importance of the Taller-than-Wide Feature and the Dimensions of Focal Thyroid Lesions in Assessing the Risk of Malignancy


Abstract
1. Introduction
2. Materials and Methods
Statistical Analysis
- Sensitivity—the percentage of positive diagnoses among all truly positive cases;
- Specificity—the percentage of negative diagnoses among all truly negative cases;
- NPV (Negative Predictive Value)—the rate of truly negative cases among all those indicated as negative by the model;
- PPV (Positive Predictive Value)—the rate of truly positive cases among all those indicated as positive by the model.
3. Results
4. Discussion
5. Study Limitations
6. Research Perspectives
7. Conclusions
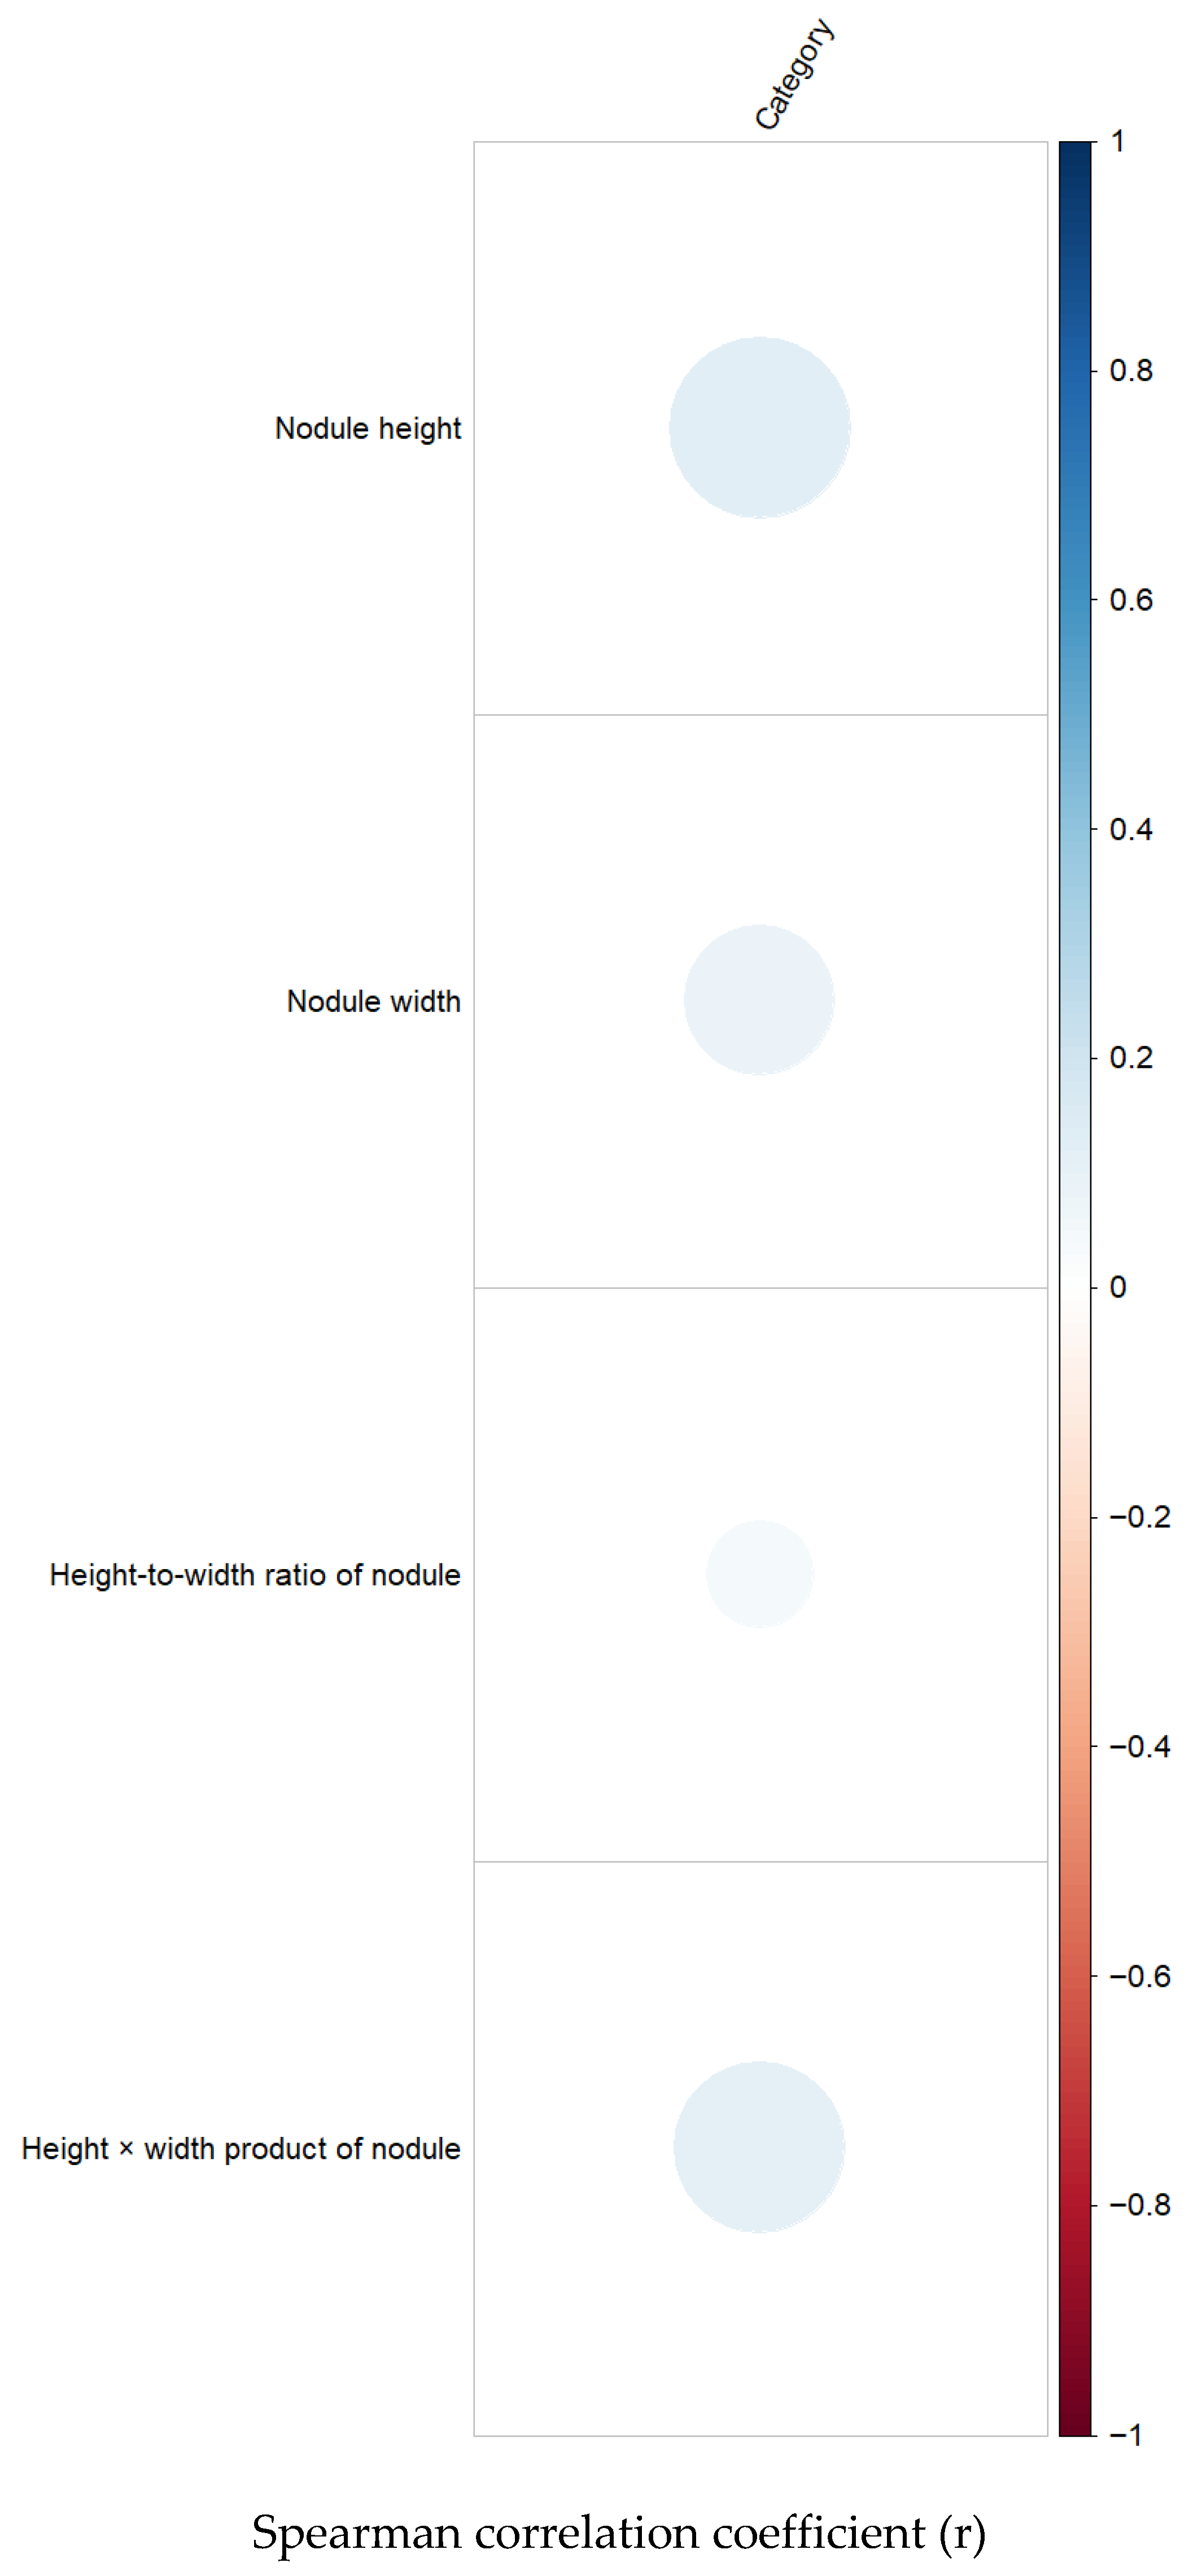
- Morphometric features of focal lesions, such as their height and the height by width product, showed a positive yet very weak correlation with the Bethesda class; as such, they may be used as auxiliary indicators in cytological risk assessment, as their value as independent predictive factors remains limited.
- In this cohort, no significant association was observed between the height-to-width ratio and higher-risk Bethesda categories. Therefore, the TTW feature should be interpreted together with other ultrasound characteristics and cytological findings rather than as an isolated predictor.
- Differences between the results obtained in this study and the reports in international literature may be due to the different size and characteristics of the population, different definitions of the TTW feature, and the varied experiences of individuals performing ultrasound examinations. This suggests the need for continued improvement of classification systems and expansion of the applicability of IT systems in ultrasound scanning.
Author Contributions
Funding
Institutional Review Board Statement
Informed Consent Statement
Data Availability Statement
Acknowledgments
Conflicts of Interest
References
- Mandel, S.J. Diagnostic use of ultrasonography in patients with nodular thyroid disease. Endocr. Pract. 2004, 10, 10246–10252. [Google Scholar] [CrossRef] [Scilit] [PubMed]
- Li, W.; Sun, Y.; Xu, H.; Shang, W.; Dong, A. Systematic review and meta-analysis of American College of Radiology TI-RADS inter-reader reliability for risk stratification of thyroid nodules. Front. Oncol. 2022, 12, 840516. [Google Scholar] [CrossRef] [Scilit] [PubMed]
- Dobruch-Sobczak, K.; Adamczewski, Z.; Szczepanek-Parulska, E.; Migda, B.; Woliński, K.; Krauze, A.; Prostko, P.; Ruchała, M.; Lewiński, A.; Jakubowski, W.; et al. Histopathological verification of the diagnostic performance of the EU-TIRADS classification of thyroid nodules: Results of a multicenter study performed in a previously iodine-deficient region. J. Clin. Med. 2019, 8, 1781. [Google Scholar] [CrossRef] [Scilit] [PubMed]
- Slapa, R.Z.; Jakubowski, W.S.; Słowińska-Srzednicka, J.; Szopiński, K.T. Advantages and disadvantages of three-dimensional ultrasound of thyroid nodules including thin-slice volume rendering. Thyroid Res. 2011, 4, 1. [Google Scholar] [CrossRef] [Scilit] [PubMed]
- Kant, R.; Davis, A.; Verma, V. Thyroid nodules: Advances in evaluation and management. Am. Fam. Physician 2020, 102, 298–304. [Google Scholar] [PubMed]
- Chaudhary, V.; Bano, S. Thyroid ultrasound. Indian J. Endocrinol. Metab. 2013, 17, 219–227. [Google Scholar] [CrossRef] [Scilit] [PubMed]
- Boers, T.; Braak, S.J.; Rikken, N.E.T.; Versluis, M.; Manohar, S. Ultrasound imaging in thyroid nodule diagnosis, therapy, and follow-up: Current status and future trends. J. Clin. Ultrasound 2023, 51, 1087–1100. [Google Scholar] [CrossRef] [Scilit] [PubMed]
- Russ, G.; Bonnema, S.J.; Erdogan, M.F.; Durante, C.; Ngu, R.; Leenhardt, L. European Thyroid Association guidelines for ultrasound malignancy risk stratification of thyroid nodules in adults: The EU-TIRADS. Eur. Thyroid J. 2017, 6, 225–237. [Google Scholar] [CrossRef] [Scilit] [PubMed]
- Cooper, D.S.; Doherty, G.M.; Haugen, B.R.; Kloos, R.T.; Lee, S.L.; Mandel, S.J.; Mazzaferri, E.L.; McIver, B.; Pacini, F.; Schlumberger, M.; et al. Revised American Thyroid Association management guidelines for patients with thyroid nodules and differentiated thyroid cancer. Thyroid 2009, 19, 1167–1214. [Google Scholar] [CrossRef] [Scilit] [PubMed]
- Tessler, F.N.; Middleton, W.D.; Grant, E.G.; Hoang, J.K.; Berland, L.L.; Teefey, S.A.; Cronan, J.J.; Beland, M.D.; Desser, T.S.; Frates, M.C.; et al. ACR Thyroid Imaging Reporting and Data System (TI-RADS): White Paper of the ACR TI-RADS Committee. J. Am. Coll. Radiol. 2017, 14, 587–595. [Google Scholar] [CrossRef] [Scilit] [PubMed]
- Horvath, E.; Majlis, S.; Rossi, R.; Franco, C.; Niedmann, J.P.; Castro, A.; Dominguez, M. An ultrasonogram reporting system for thyroid nodules stratifying cancer risk for clinical management. J. Clin. Endocrinol. Metab. 2009, 94, 1748–1751. [Google Scholar] [CrossRef] [Scilit] [PubMed]
- Jarząb, B.; Dedecjus, M.; Lewiński, A.; Adamczewski, Z.; Bakuła-Zalewska, E.; Bałdys-Waligórska, A.; Barczyński, M.; Biskup-Frużyńska, M.; Bobek-Billewicz, B.; Bossowski, A.; et al. Diagnosis and treatment of thyroid cancer in adult patients—Recommendations of Polish scientific societies and the National Oncological Strategy. 2022 update. Endokrynol. Pol. 2022, 73, 173–300. [Google Scholar] [CrossRef] [Scilit] [PubMed]
- Kim, E.K.; Park, C.S.; Chung, W.Y.; Oh, K.K.; Kim, D.I.; Lee, J.T.; Yoo, H.S. New sonographic criteria for recommending fine-needle aspiration biopsy of nonpalpable solid nodules of the thyroid. Am. J. Roentgenol. 2002, 178, 687–691. [Google Scholar] [CrossRef] [Scilit]
- Li, C.; Xin, X.; Wang, X.; Wei, X.; Zhang, S. The diagnostic value of a new ultrasonographic method for the measurement of a taller-than-wide shape of benign and malignant thyroid nodules. Endocrine 2023, 81, 306–315. [Google Scholar] [CrossRef] [Scilit] [PubMed]
- Mattingly, A.S.; Noel, J.E.; Orloff, L.A. A closer look at “taller-than-wide” thyroid nodules: Examining dimension ratio to predict malignancy. Otolaryngol.-Head Neck Surg. 2022, 167, 236–241. [Google Scholar] [CrossRef] [Scilit] [PubMed]
- Huang, P.; Han, L.; Shi, X.; Xiao, F.S.; Shen, Q.B.; Li, X.J.; Zhang, F.X. Predictive value of the single most suspicious ultrasound feature in subcentimeter thyroid nodules: A retrospective observational cohort study. J. Cancer Res. Clin. Oncol. 2024, 150, 384. [Google Scholar] [CrossRef] [Scilit] [PubMed]
- Grani, G.; Lamartina, L.; Ramundo, V.; Falcone, R.; Lomonaco, C.; Ciotti, L.; Barone, M.; Maranghi, M.; Cantisani, V.; Filetti, S.; et al. Taller-than-wide shape: A new definition improves the specificity of TIRADS systems. Eur. Thyroid J. 2020, 9, 85–91. [Google Scholar] [CrossRef] [Scilit] [PubMed]
- Yang, X.Y.; Huang, L.F.; Han, Y.J.; Cen, X.X.; Tao, Z.X. Histopathological analysis of thyroid nodules with taller-than-wide shape in adults. Int. J. Gen. Med. 2024, 17, 5123–5131. [Google Scholar] [CrossRef] [Scilit] [PubMed]
- Fukushima, M.; Fukunari, N.; Murakami, T.; Kunii, Y.; Suzuki, S.; Kitaoka, M. Reconfirmation of the accuracy of the taller-than-wide sign in multicenter collaborative research in Japan. Endocr. J. 2021, 68, 897–904. [Google Scholar] [CrossRef] [Scilit] [PubMed]
- Smith-Bindman, R.; Lebda, P.; Feldstein, V.A.; Sellami, D.; Goldstein, R.B.; Brasic, N.; Jin, C.; Kornak, J. Risk of thyroid cancer based on thyroid ultrasound imaging characteristics: Results of a population-based study. JAMA Intern. Med. 2013, 173, 1788–1796. [Google Scholar] [CrossRef] [Scilit] [PubMed]
- Wu, M.H.; Chen, K.Y.; Chen, C.N. Software-based analysis of the taller-than-wide feature of high-risk thyroid nodules. Ann. Surg. Oncol. 2021, 28, 4347–4357. [Google Scholar] [CrossRef] [Scilit] [PubMed]
- Yoon, S.J.; Yoon, D.Y.; Chang, S.K.; Seo, Y.L.; Yun, E.J.; Choi, C.S.; Bae, S.H. “Taller-than-wide sign” of thyroid malignancy: Comparison between ultrasound and CT. Am. J. Roentgenol. 2010, 194, 1165–1173. [Google Scholar] [CrossRef] [Scilit] [PubMed]
- Kim, S.Y.; Na, D.G.; Paik, W. Which ultrasound image plane is appropriate for evaluating the taller-than-wide sign in the risk stratification of thyroid nodules? Eur. Radiol. 2021, 31, 7605–7613. [Google Scholar] [CrossRef] [Scilit] [PubMed]
- Hong, M.J.; Lee, Y.H.; Kim, J.H.; Na, D.G.; You, S.H.; Shin, J.E.; Kim, S.K.; Yang, K.S.; Korean Society of Thyroid Radiology. Orientation of the ultrasound probe to identify the taller-than-wide sign of thyroid malignancy: A registry-based study with the Thyroid Imaging Network of Korea. Ultrasonography 2023, 42, 111–120. [Google Scholar] [CrossRef] [Scilit] [PubMed]
- Zhang, H.; Shi, Q.; Gu, J.; Jiang, L.Y.; Bai, M.; Liu, L.; Wu, Y.; Du, L.F. Combined value of virtual touch tissue quantification and conventional sonographic features for differentiating benign and malignant thyroid nodules smaller than 10 mm. J. Ultrasound Med. 2014, 33, 257–264. [Google Scholar] [CrossRef] [Scilit] [PubMed]
- Yang, Y.P.; Zhang, G.L.; Zhou, H.L.; Dai, H.X.; Huang, X.; Liu, L.J.; Xie, J.; Wang, J.X.; Li, H.J.; Liang, X.; et al. Diagnostic efficacy of the contrast-enhanced ultrasound thyroid imaging reporting and data system classification for benign and malignant thyroid nodules. Quant. Imaging Med. Surg. 2024, 14, 5721–5736. [Google Scholar] [CrossRef] [Scilit] [PubMed]
- Al-Masabi, M.; Almarzooq, M.; AlAyed, S.; Alwadai, R.; Alzarra, A.; Alhajlan, M.; Saihb, A.; Alhamami, A.; Ahmed, F.; Al Mansour, M. The accuracy of fine needle aspiration cytology and ultrasonography in assessing thyroid nodules in correlation with histopathology: A retrospective study. Ann. Med. Surg. 2024, 86, 7002–7009. [Google Scholar] [CrossRef] [Scilit] [PubMed]
- Orlando, G.; Graceffa, G.; Mazzola, S.; Vassallo, F.; Proclamà, M.P.; Richiusa, P.; Radellini, S.; Paladino, N.C.; Melfa, G.; Scerrino, G. The role of “critical” ultrasound reassessment in the decision-making of Bethesda III thyroid nodules. Medicina 2023, 59, 1484. [Google Scholar] [CrossRef] [Scilit] [PubMed]
- Papapostolou, K.D.; Evangelopoulou, C.C.; Ioannidis, I.A.; Kassi, G.N.; Morfas, K.S.; Karaminas, N.I.; Karga, H.J. Taller-than-wide thyroid nodules with microcalcifications are at high risk of malignancy. In Vivo 2020, 34, 2101–2105. [Google Scholar] [CrossRef] [Scilit] [PubMed]
- Woliński, K.; Szkudlarek, M.; Szczepanek-Parulska, E.; Ruchała, M. Usefulness of different ultrasound features of malignancy in predicting the type of thyroid lesions: A meta-analysis of prospective studies. Pol. Arch. Intern. Med. 2014, 124, 97–104. [Google Scholar] [CrossRef] [Scilit] [PubMed]
- Yunus, M.; Ahmed, Z. Significance of ultrasound features in predicting malignant solid thyroid nodules: Need for fine-needle aspiration. J. Pak. Med. Assoc. 2010, 60, 848–853. [Google Scholar] [PubMed]
- Remonti, L.R.; Kramer, C.K.; Leitão, C.B.; Pinto, L.C.; Gross, J.L. Thyroid ultrasound features and risk of carcinoma: A systematic review and meta-analysis of observational studies. Thyroid 2015, 25, 538–550. [Google Scholar] [CrossRef] [Scilit] [PubMed]
- Guo, D.; Lin, Z.; Wang, J.; Liao, X.; Huang, H.; Zhai, Y.; Chen, Z. Optimizing C-TIRADS for sub-centimeter thyroid nodules using machine learning-derived feature importance. Front. Endocrinol. 2025, 16, 1668347. [Google Scholar] [CrossRef] [Scilit] [PubMed]
- Moon, H.J.; Kim, E.K.; Kwak, J.Y.; Kim, M.J. A taller-than-wide shape in thyroid nodules in transverse and longitudinal ultrasonographic planes and the prediction of malignancy. Thyroid 2011, 21, 1249–1256. [Google Scholar] [CrossRef] [Scilit] [PubMed]
- Cheng, P.W.; Chou, H.W.; Wang, C.T.; Lo, W.C.; Liao, L.J. Evaluation and development of a real-time predictive model for ultrasound investigation of malignant thyroid nodules. Eur. Arch. Oto-Rhino-Laryngol. 2014, 271, 1199–1206. [Google Scholar] [CrossRef] [Scilit] [PubMed]
- Zhuang, Y.; Li, C.; Hua, Z.; Chen, K.; Lin, J.L. A novel TIRADS of ultrasound classification for thyroid nodules based on six ultrasound features. Biomed. Eng. Online 2018, 17, 82. [Google Scholar] [CrossRef] [Scilit] [PubMed]
- Rago, T.; Vitti, P. Risk stratification of thyroid nodules: From ultrasound features to TIRADS. Cancers 2022, 14, 717. [Google Scholar] [CrossRef] [Scilit] [PubMed]
- Torshizian, A.; Hashemi, F.; Khoshhal, N.; Ghodsi, A.; Rastegar, H.; Mousavi, Z.; Dadgar Moghadam, M.; Mohebbi, M. Diagnostic performance of ACR TI-RADS and ATA guidelines in the prediction of thyroid malignancy: A prospective single tertiary center study and literature review. Diagnostics 2023, 13, 2972. [Google Scholar] [CrossRef] [Scilit] [PubMed]
- Petersen, M.; Schenke, S.A.; Veit, F.; Görges, R.; Seifert, P.; Zimny, M.; Croner, R.S.; Kreissl, M.C.; Stahl, A.R. Thyroid Imaging Reporting and Data Systems: Applicability of the “taller-than-wide” criterion in primary/secondary care units and the role of thyroid scintigraphy. J. Clin. Med. 2024, 13, 514. [Google Scholar] [CrossRef] [Scilit] [PubMed]
- Prieditis, P.; Radzina, M.; Mikijanska, M.; Liepa, M.; Stepanovs, K.; Grani, G.; Durante, C.; Lamartina, L.; Trimboli, P.; Cantisani, V. Non-Marked Hypoechogenic Nodules: Multicenter Study on the Thyroid Malignancy Risk Stratification and Accuracy Based on TIRADS Systems Comparison. Medicina 2022, 58, 257. [Google Scholar] [CrossRef] [Scilit] [PubMed]
- Kotecka-Blicharz, A.; Krzempek, M.; Cortez, A.J.; Oczko-Wojciechowska, M.; Czarniecka, A.; Nożyńska, E.; Chmielik, E.; Jarząb, B.; Krajewska, J. The role of thyroid sonographic malignancy risk features when fine-needle aspiration biopsy result turns out to be indeterminate. Endokrynol. Pol. 2022, 73, 173–180. [Google Scholar] [CrossRef] [Scilit] [PubMed]
- Petersen, M.; Schenke, S.A.; Zimny, M.; Görges, R.; Grunert, M.; Groener, D.; Seifert, P.; Stömmer, P.E.; Kreissl, M.C.; Stahl, A.R.; et al. Introducing a pole concept for nodule growth in the thyroid gland: Taller-than-wide shape, frequency, location and risk of malignancy of thyroid nodules in an area with iodine deficiency. J. Clin. Med. 2022, 11, 2549. [Google Scholar] [CrossRef] [Scilit] [PubMed]
- Thiagarajan, S.; Rane, S.; Chandak, K.; Gurukeerthi, B.; Kantamani, T.; Tuljapurkar, V.; Kumar, S.; Pantvaidya, G. Utility of clinical and radiological features in the management of Bethesda III and IV thyroid nodules. Indian J. Surg. Oncol. 2025, 16, 882–889. [Google Scholar] [CrossRef] [Scilit] [PubMed]
- Brito, J.P.; Gionfriddo, M.R.; Al Nofal, A.; Boehmer, K.R.; Leppin, A.L.; Reading, C.; Callstrom, M.; Elraiyah, T.A.; Prokop, L.J.; Stan, M.N.; et al. The accuracy of thyroid nodule ultrasound to predict thyroid cancer: Systematic review and meta-analysis. J. Clin. Endocrinol. Metab. 2014, 99, 1253–1263. [Google Scholar] [CrossRef] [Scilit] [PubMed]
- Kuscu, B.; Eroğlu, M. The sonographic pattern of nodule and thyroid fine needle aspiration cytology in the evaluation of thyroid malignancy risk. Fam. Pract. Palliat. Care 2023, 8, 1–9. [Google Scholar] [CrossRef] [Scilit]



| Variable | Parameter | Total (N = 367) |
|---|---|---|
| Class | N | 367 |
| Average (SD) | 2.2 (1.1) | |
| Median (Q1–Q3) | 2 (2, 2). | |
| Range | 1–6 | |
| Bethesda Classification | 1 | 18.8% (N = 69) |
| 2 | 57.5% (N = 211) | |
| 3 | 12.5% (N = 46) | |
| 4 | 5.4% (N = 20) | |
| 5 | 2.7% (N = 10) | |
| 6 | 3% (N = 11) | |
| Type of change | Unresectable | 76.3% (N = 280) |
| Resectable | 23.7% (N = 87) | |
| Age [years] | N | 367 |
| Average (SD) | 65.2 (13.6) | |
| Median (Q1–Q3) | 68 (55–75). | |
| Range | 21–94 |
| Variable | Parameter | Total (N = 367) | 1 (N = 69) | 2 (N = 211) | 3 (N = 46) | 4 (N = 20) | 5 (N = 10) | 6 (N = 11) |
|---|---|---|---|---|---|---|---|---|
| Nodule height | 367 | 69 | 211 | 46 | 20 | 10 | 11 | |
| Average (SD) | 16.95 (8.65) | 16.12 (9.56) | 17.19 (9.51) | 16.5 (5.16) | 18.35 (4.36) | 16.6 (6.06) | 17.18 (4.45) | |
| Median (Q1–Q3) | 15 (11–21.5). | 13 (9–23). | 15 (10.5–22). | 16 (13–20.5). | 17.5 (15.75–21). | 18 (12.5–19.75). | 17 (13.5–19). | |
| Range | 4–55 | 5–53 | 4–55 | 7–30 | 10–27 | 7–26 | 13–28 | |
| Width of the nodule | 367 | 69 | 211 | 46 | 20 | 10 | 11 | |
| Average (SD) | 14.15 (6.84) | 14.12 (8.66) | 14.1 (6.95) | 14.26 (4.71) | 15.45 (4.58) | 13 (4.16) | 13.45 (4.95) | |
| Median (Q1–Q3) | 13 (9–18). | 12 (7–20). | 13 (9–18.5). | 14 (11–18). | 14 (12–18). | 13.5 (10.75–14.75). | 12 (10.5–15.5). | |
| Range | 3–38 | 3–38 | 3–38 | 5–24 | 9–29 | 5–19 | 7–25 | |
| The ratio of the height to the width of the nodule | 367 | 69 | 211 | 46 | 20 | 10 | 11 | |
| Average (SD) | 1.25 (0.35) | 1.21 (0.33) | 1.26 (0.35) | 1.22 (0.37) | 1.23 (0.29) | 1.32 (0.39) | 1.35 (0.34) | |
| Median (Q1–Q3) | 1.21 (1–1.43). | 1.14 (0.94–1.33). | 1.25 (1–1.45). | 1.16 (0.95–1.36). | 1.26 (1.11–1.31). | 1.38 (0.96–1.52). | 1.18 (1.1–1.64). | |
| Range | 0.5–2.6 | 0.82–2.33 | 0.5–2.6 | 0.78–2.6 | 0.8–2 | 0.78–1.89 | 1–1.9 | |
| The product of the height and width of the nodule | 367 | 69 | 211 | 46 | 20 | 10 | 11 | |
| Average (SD) | 288.94 (292.82) | 301.91 (354.42) | 297.26 (315.99) | 251.26 (138.4) | 296.1 (155.99) | 228.8 (117.74) | 247.27 (166.22) | |
| Median (Q1–Q3) | 195 (100–360). | 156 (70–420). | 187 (99–364). | 224 (154–374.25). | 270 (180–341.25). | 249.5 (153.75–325.25). | 209 (149.5–278.5). | |
| Range | 12–1786 | 15–1749 | 12–1786 | 42–660 | 120–783 | 35–380 | 91–700 |
| Variable | Correlation with Bethesda Category (r; p-Value) |
|---|---|
| Nodule height | 0.124 (0.017) |
| Nodule width | 0.086 (0.101) |
| Height-to-width ratio | 0.044 (0.405) |
| The product of the height and width of the nodule | 0.111 (0.033) |
| Variable | Parameter | Total (N = 367) | Total Number: N = 280 | Total Number: N = 87 | Test | p-Value | Effect Size |
|---|---|---|---|---|---|---|---|
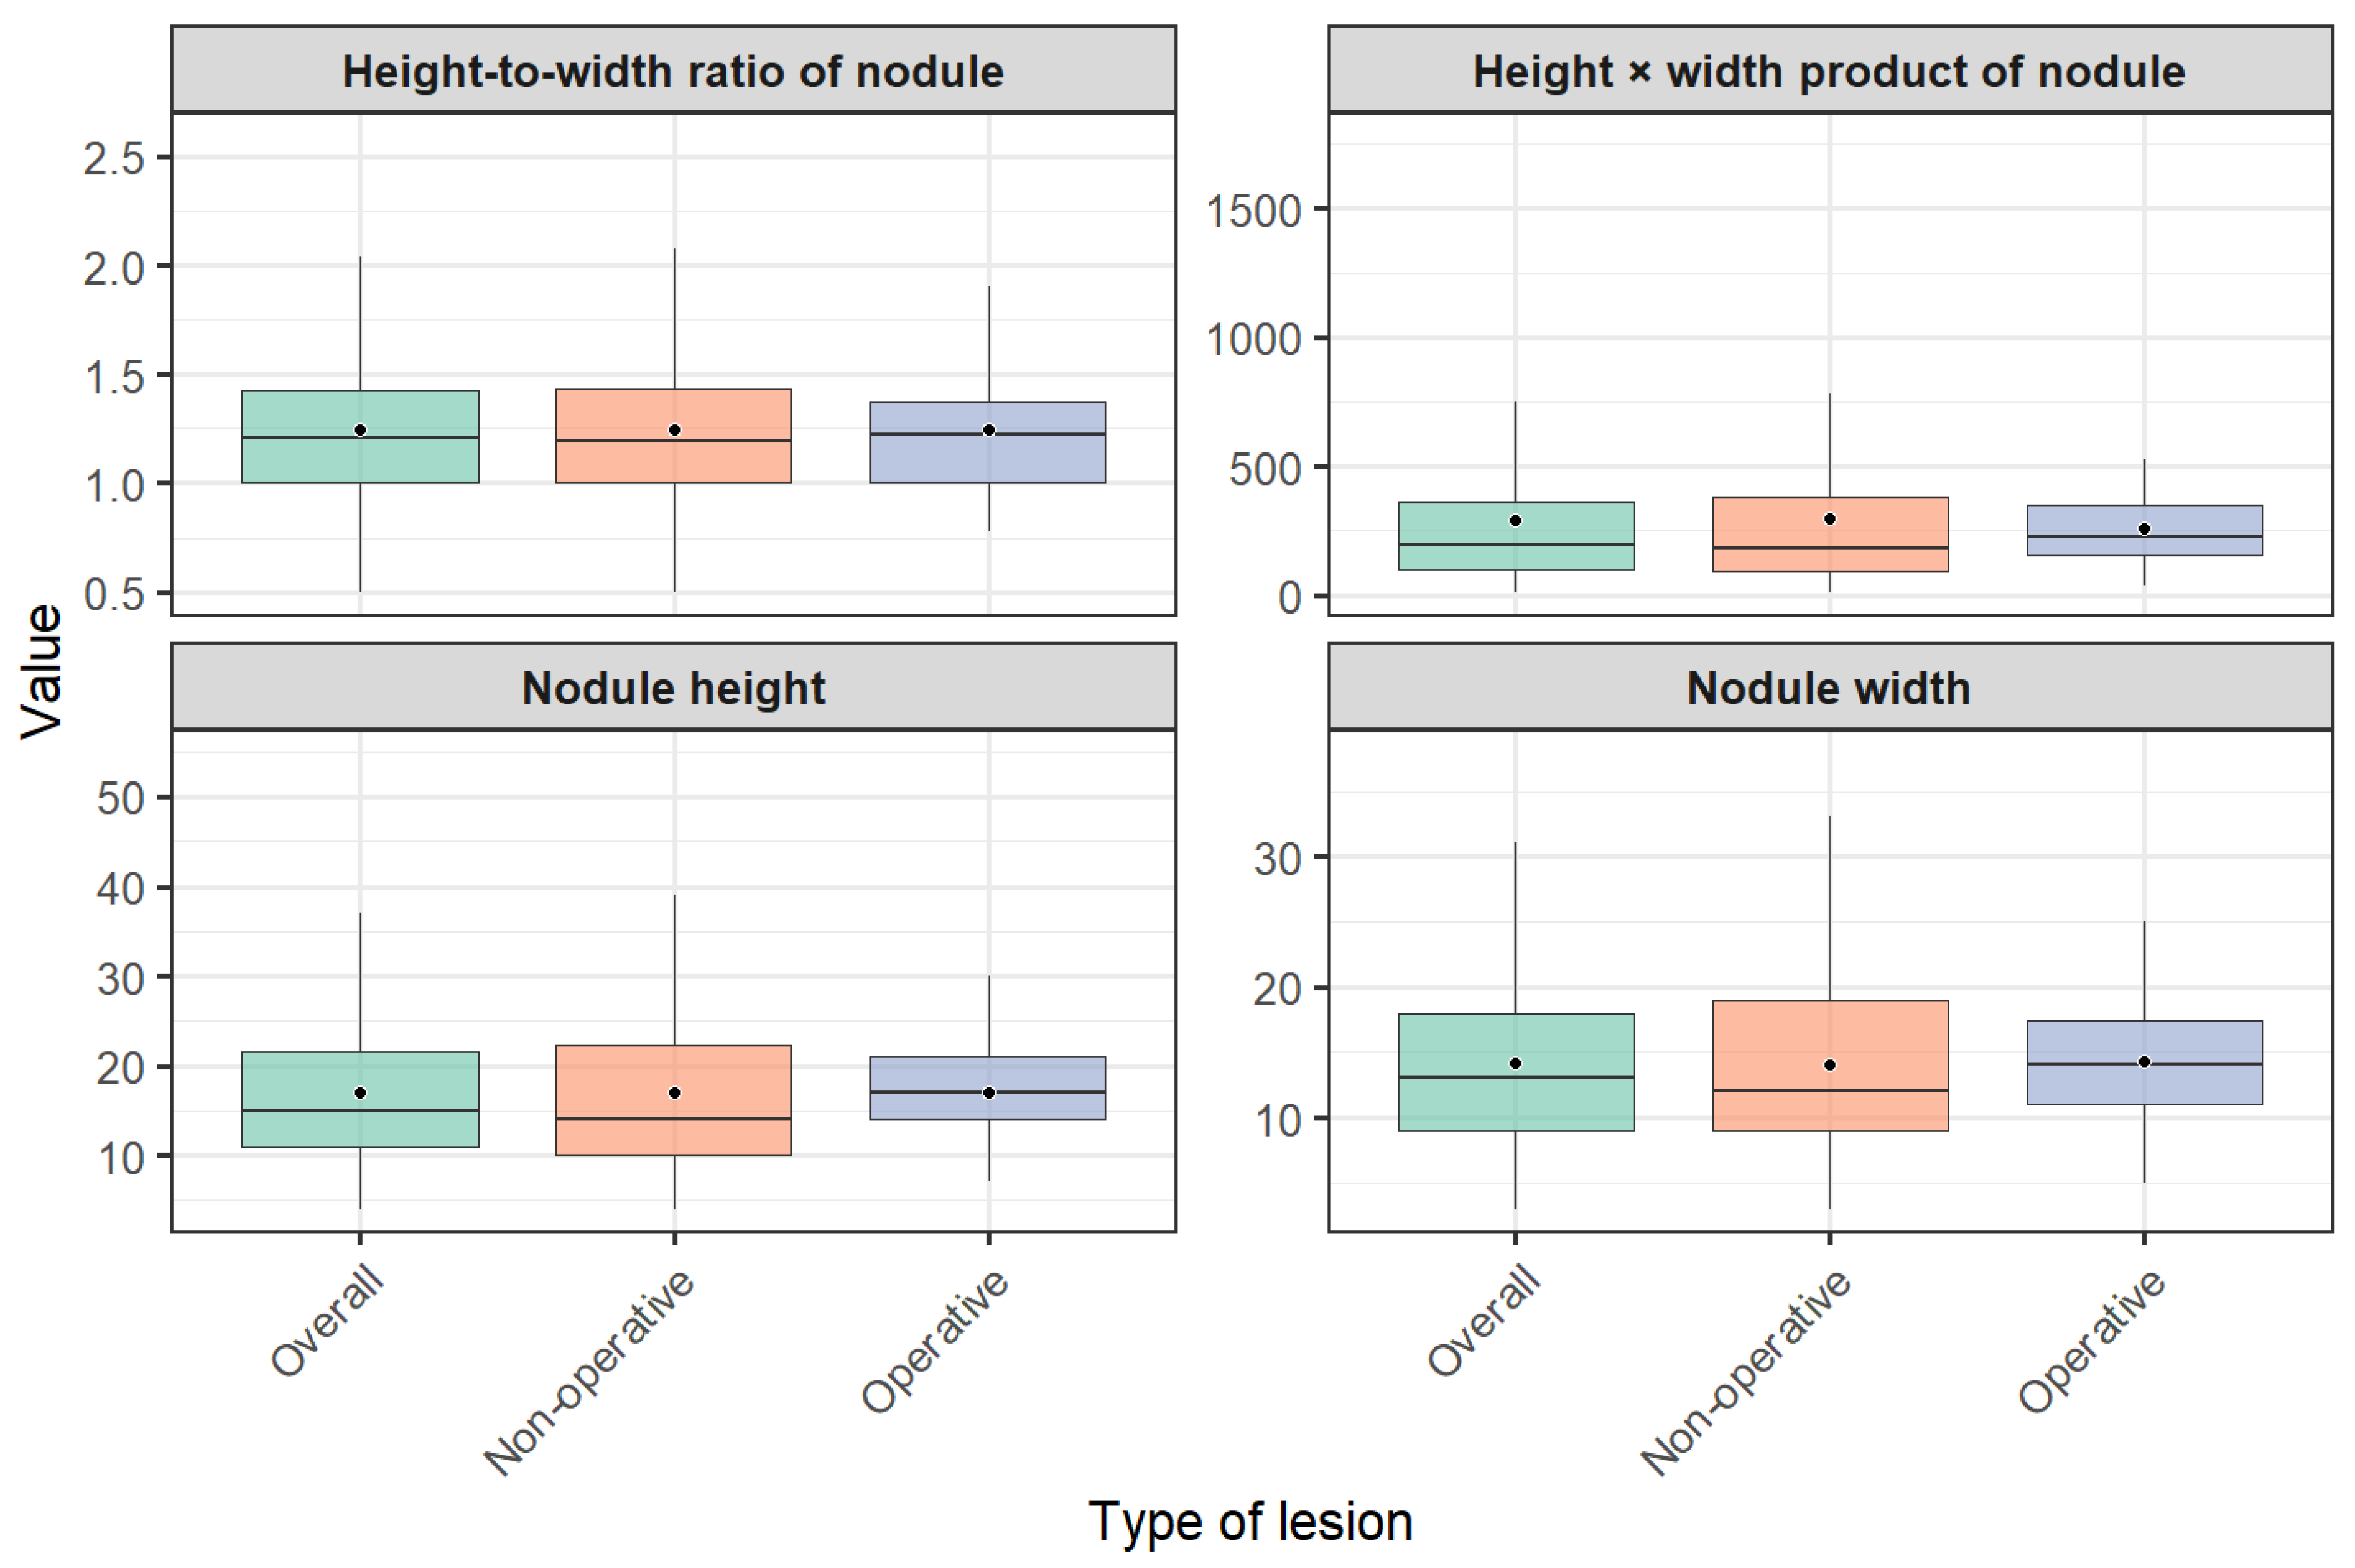
| Nodule height | 367 | 280 | 87 | Mann–Whitney’s U | 0.043 | 0.106 | |
| Average (SD) | 16.95 (8.65) | 16.92 (9.52) | 17.02 (4.98) | ||||
| Median (Q1–Q3) | 15 (11–21.5). | 14 (10–22.25). | 17 (14–21). | ||||
| Range | 4–55 | 4–55 | 7–30 | ||||
| Nodule width | 367 | 280 | 87 | Mann–Whitney’s U | 0.1283 | 0.079 | |
| Average (SD) | 14.15 (6.84) | 14.1 (7.39) | 14.29 (4.64) | ||||
| Median (Q1–Q3) | 13 (9–18). | 12 (9–19). | 14 (11–17.5). | ||||
| Range | 3–38 | 3–38 | 5–29 | ||||
| Height-to-width ratio | 367 | 280 | 87 | Mann–Whitney’s U | 0.9387 | 0.004 | |
| Average (SD) | 1.25 (0.35) | 1.24 (0.35) | 1.25 (0.35) | ||||
| Median (Q1–Q3) | 1.21 (1–1.43). | 1.2 (1–1.43). | 1.22 (1–1.38). | ||||
| Range | 0.5–2.6 | 0.5–2.6 | 0.78–2.6 | ||||
| The product of the height and width of the nodule | 367 | 280 | 87 | Mann–Whitney’s U | 0.0555 | 0.100 | |
| Average (SD) | 288.94 (292.82) | 298.4 (325.23) | 258.48 (143.31) | ||||
| Median (Q1–Q3) | 195 (100–360). | 180 (90–378). | 225 (155–348.5). | ||||
| Range | 12–1786 | 12–1786 | 35–783 |
| Logistic Regression Results Evaluating the Effect of the Height-to-Width Ratio on the Risk of a Lesion Being Qualified for Surgery | ||||||
|---|---|---|---|---|---|---|
| Variable | Estimate | p-value | OR | LCI | UCI | |
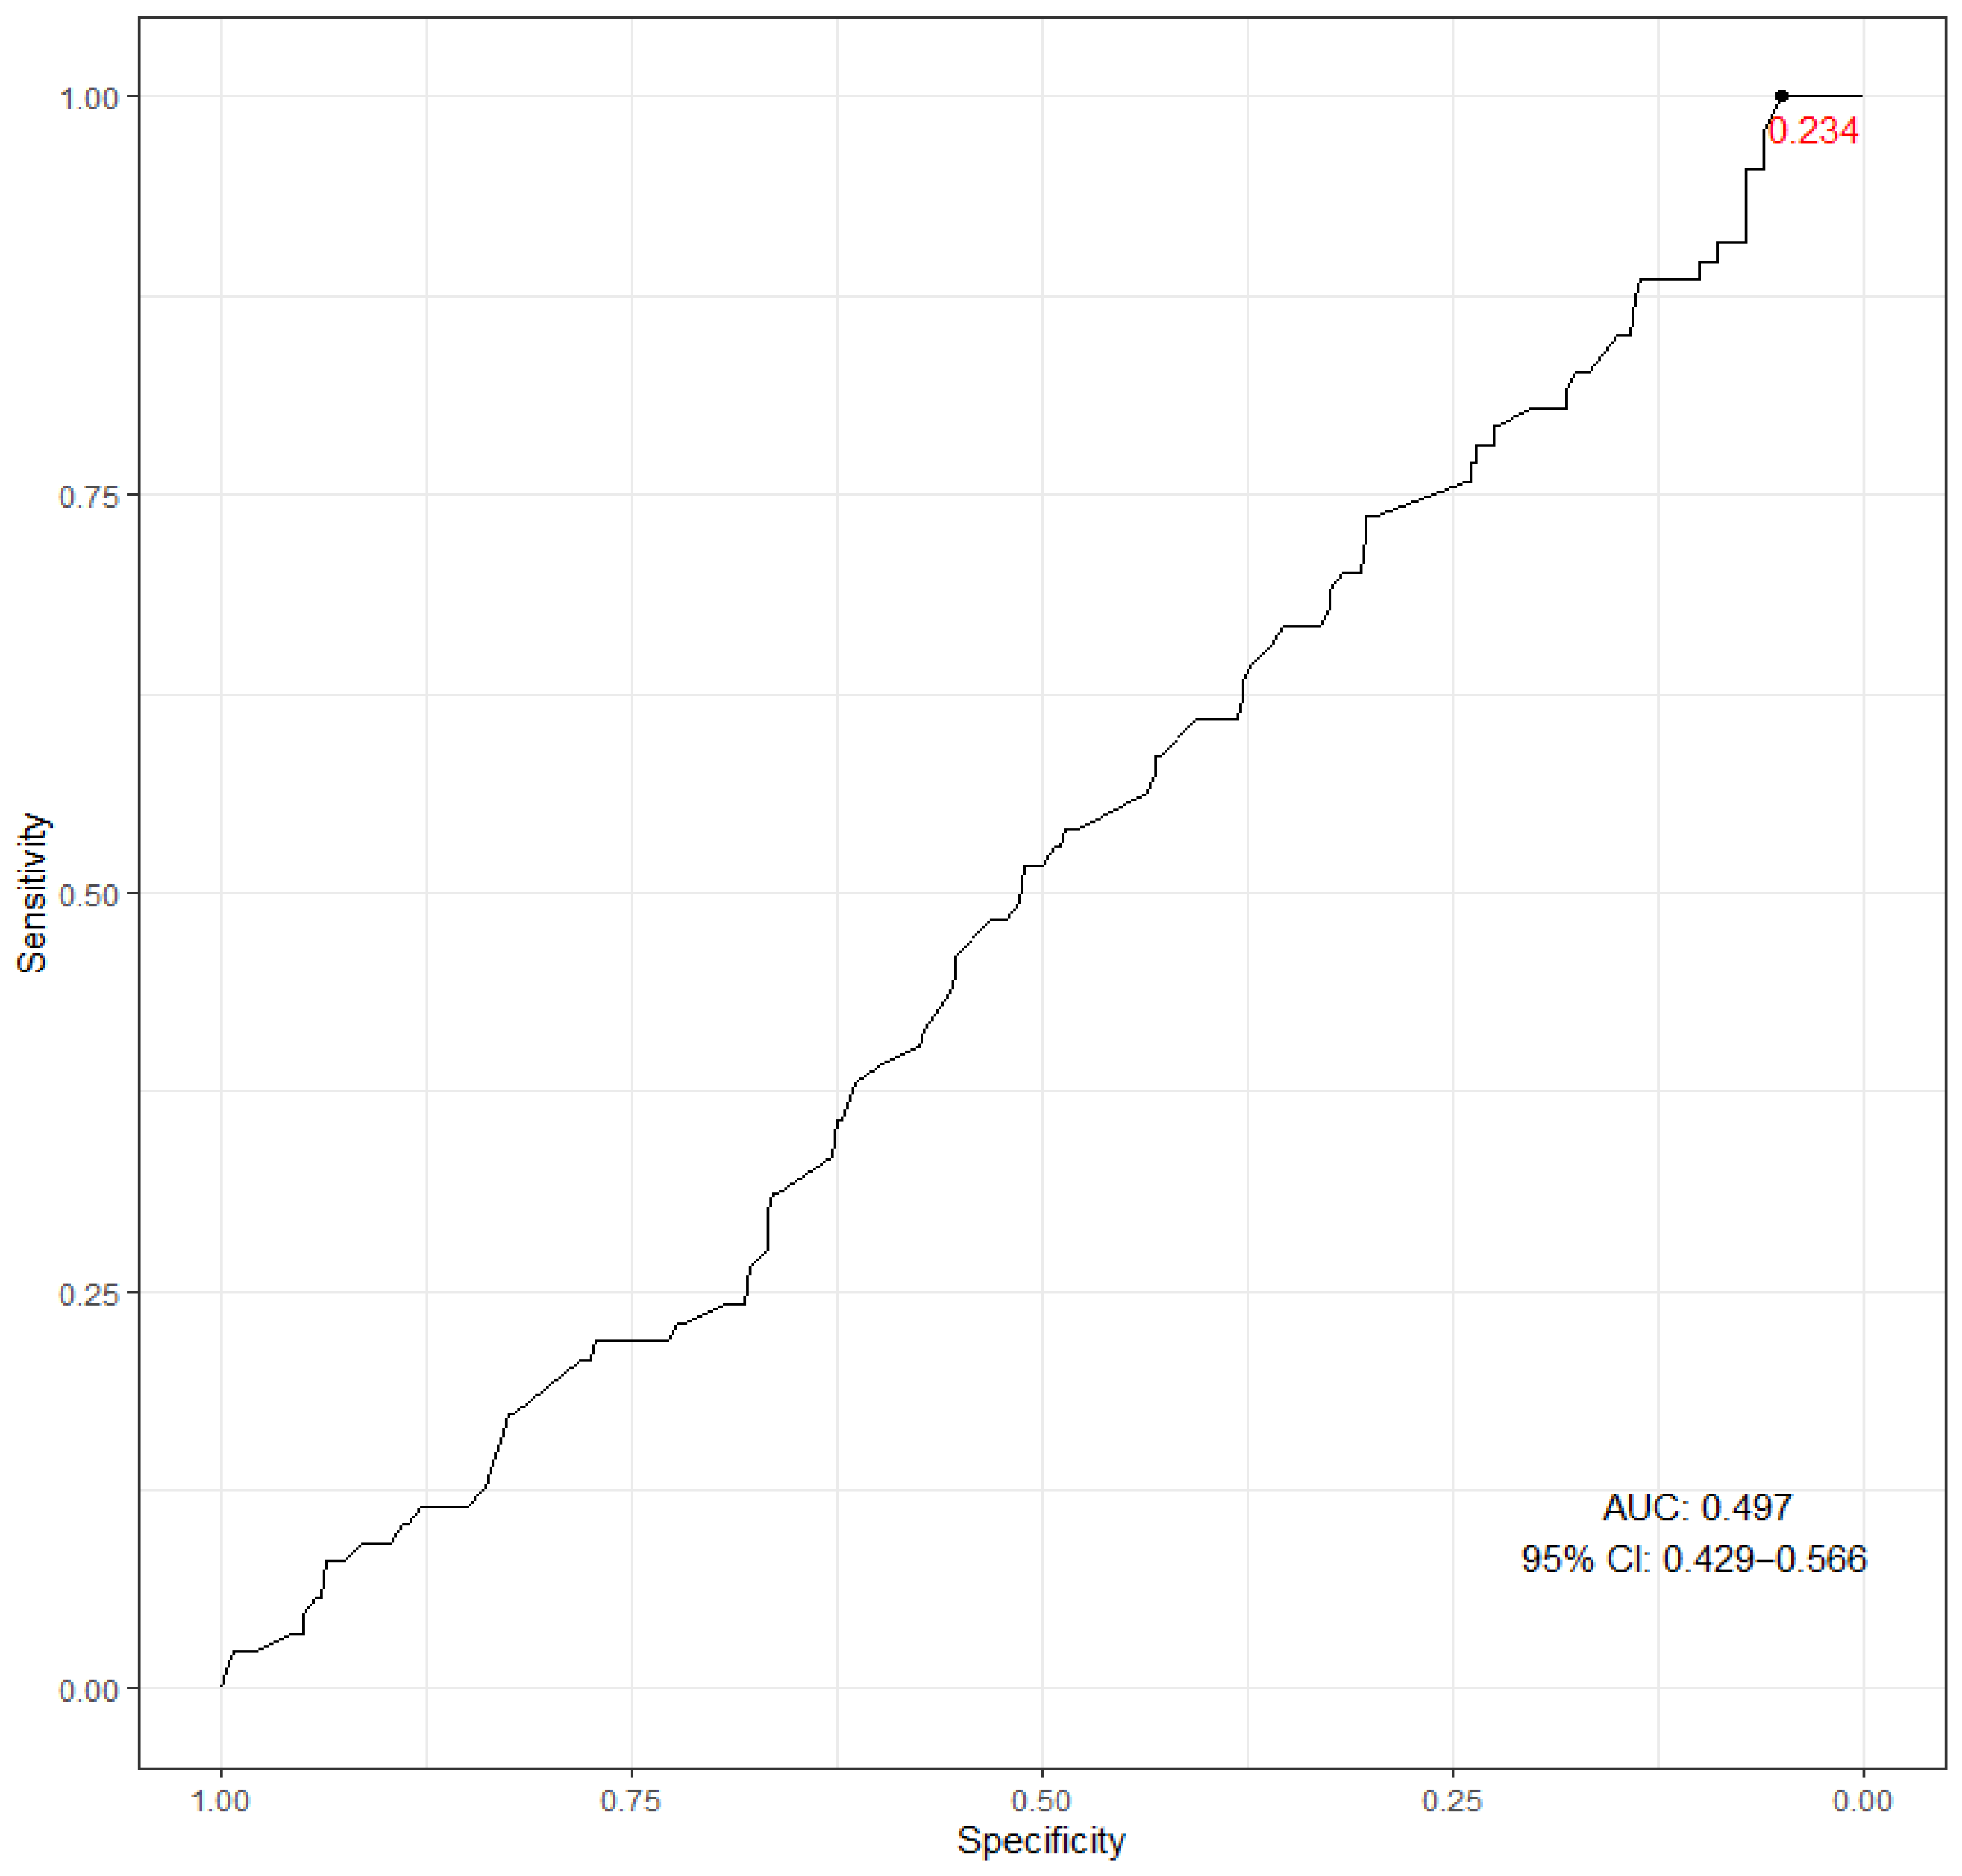
| Height-to-width ratio of nodule | 0.03 | 0.931 | 1.03 | 0.517 | 2.06 | |
| Logistic regression model verification parameters | ||||||
| Group | AUC (95% CI) | Threshold | Sensitivity | Specificity | PPV | NPV |
| Overall | 0.497 (0.429, 0.566). | 0.234 | 1.000 | 0.050 | 0.246 | 1.000 |
| Nodule height-to-width ratio corresponding to the probability threshold at the highest sensitivity | ||||||
| Probability threshold | Height-to-width ratio of nodule at threshold | |||||
| 0.234 | 0.772 | |||||
| Area | Strengths | Weaknesses |
|---|---|---|
| Diagnostic accuracy of the TTW feature | Numerous studies confirm the TTW shape as a highly specific marker of thyroid malignancy, with specificity consistently reported as high across different cohorts and nodule sizes [19,29,32]. The TTW feature is particularly valuable in small nodules and subcentimeter lesions, where it shows strong predictive value in combination with other features [16,32,33]. Machine learning approaches have further validated vertical orientation (TTW) of the lesion as the most predictive feature, improving diagnostic performance [33]. | According to previous studies, despite its high specificity, the TTW feature exhibits low sensitivity, which limits its use as an independent marker of malignancy [23,26]. The variability in sensitivity values reported across studies suggests that a significant proportion of malignant tumors can be missed when relying solely on the TTW feature [19,34]. In addition, the TTW feature is less reliable for follicular carcinoma as it is often missing in this type of malignancy [19]. |
| Measurement methodologies and probe orientation | Studies show that the transverse ultrasound plane is generally sufficient and suitable for the assessment of the TTW feature, with longitudinal or combined planes being of minimal added diagnostic value [23,24]. The effect of probe tilt and orientation on TTW assessment is negligible, which supports the use of standard imaging protocols [19]. Software-based quantitative analysis of the TTW feature improves reliability and reduces operator-dependent variability [21]. | Discrepancies between clinician and software assessments of the TTW feature were highlighted in some studies, pointing to the possibility of misclassification due to subtle measurement differences or confounding ultrasound features [21]. The lack of universal consensus on the measurement planes and criteria may contribute to inconsistent application of ultrasound measurements in clinical practice [34]. |
| Integration with other ultrasound features and risk stratification systems | Combining the TTW feature with other ultrasound features, such as microcalcifications, hypoechogenicity, and irregular margins, significantly improves the prediction of malignancies and the accuracy of risk stratification [27,29,35]. The modified TIRADS and TTW-weighing systems show improved diagnostic performance and clinical utility [26,33,36]. The inclusion of TTW in multiparametric models facilitates better specification of biopsy indications and a reduction in the number of unnecessary procedures [37,38]. | The heterogeneity of risk stratification systems and the variability of TTW weights across the available guidelines complicate direct comparisons and clinical decision-making [39,40]. Some systems may perform more poorly in specific populations or subtypes of tumors, with the optimum combination of features remaining to be standardized [41]. In addition, the risk of malignancy associated with TTW nodules varies significantly between primary/secondary and tertiary care settings, reflecting selection bias and pre-test probability differences [39,42]. |
| Relationship between lesion dimensions and malignancy risk | Studies confirm that the lesion dimensions, especially the height-to-width ratio, are crucial in assessing malignancy, with higher ratios correlating with increased risk [15,32]. Smaller TTW nodules show higher predictive accuracy for papillary thyroid cancer [32]. Combining lesion size with TTW and other features increases sensitivity and specificity [16,25]. | There is an established inverse correlation between nodule size and the TTW shape, which complicates risk assessment in larger nodules [29]. Some studies indicate that the TTW feature is less predictive in nodules greater than 1 cm, suggesting size-dependent diagnostic thresholds [32]. The effect of lesion dimensions on malignancy risk is not uniform across various histological types, limiting the generalizability of findings [19]. |
| Impact of clinical conditions and patient selection | Prospective studies in iodine-deficient areas and primary care settings reveal lower malignancy rates in TTW nodules compared to retrospective analyses in tertiary centers, indicating the influence of patient selection and referral bias [39,42]. This underscores the need to contextualize TTW results and pre-test risk in relation to the clinical environment. | The variability in the incidence of malignant neoplasms in different clinical settings questions the external validity of some of the results and may lead to an over- or underestimation of the predictive value of TTW [39]. Limited data are available on the prognostic value of TTW in unspecified cytologic categories and various patient populations, limiting the diagnostic applicability of the feature [41,43]. |
| Methodological robustness and data quality | Large multicenter studies and meta-analyses provide solid evidence supporting the diagnostic role of TTW, with significant sample sizes and histopathological confirmations [19,44]. The use of machine learning and software-based assessments increases objectivity and reproducibility [21,33]. | Many studies followed a retrospective design, which has inherent limitations, such as selection bias, variable ultrasound operator knowledge, and inconsistent reference standards [27,45]. The lack of uniform protocols for acquiring and interpreting ultrasound scans contributes to the heterogeneity of results [23,34]. Some studies were based on small sample sizes or focused on specific subgroups, limiting generalizability [31]. |
Disclaimer/Publisher’s Note: The statements, opinions and data contained in all publications are solely those of the individual author(s) and contributor(s) and not of MDPI and/or the editor(s). MDPI and/or the editor(s) disclaim responsibility for any injury to people or property resulting from any ideas, methods, instructions or products referred to in the content. |
© 2026 by the authors. Licensee MDPI, Basel, Switzerland. This article is an open access article distributed under the terms and conditions of the Creative Commons Attribution (CC BY) license.
Share and Cite
Ciechomska, M.Z.; Szydlarska, D.; Śliwczyński, A. The Importance of the Taller-than-Wide Feature and the Dimensions of Focal Thyroid Lesions in Assessing the Risk of Malignancy. Diagnostics 2026, 16, 2193. https://doi.org/10.3390/diagnostics16142193
Ciechomska MZ, Szydlarska D, Śliwczyński A. The Importance of the Taller-than-Wide Feature and the Dimensions of Focal Thyroid Lesions in Assessing the Risk of Malignancy. Diagnostics. 2026; 16(14):2193. https://doi.org/10.3390/diagnostics16142193
Chicago/Turabian StyleCiechomska, Marta Zuzanna, Dorota Szydlarska, and Andrzej Śliwczyński. 2026. "The Importance of the Taller-than-Wide Feature and the Dimensions of Focal Thyroid Lesions in Assessing the Risk of Malignancy" Diagnostics 16, no. 14: 2193. https://doi.org/10.3390/diagnostics16142193
APA StyleCiechomska, M. Z., Szydlarska, D., & Śliwczyński, A. (2026). The Importance of the Taller-than-Wide Feature and the Dimensions of Focal Thyroid Lesions in Assessing the Risk of Malignancy. Diagnostics, 16(14), 2193. https://doi.org/10.3390/diagnostics16142193