An Exploratory Six-Probe Blood RNA Signature for Predicting 12-Month Cognitive Decline Along the Alzheimer’s Disease Continuum: An Interpretable Machine Learning Study


Abstract
1. Introduction
1.1. The Clinical and Computational Challenge of Longitudinal Ad Biomarker Discovery
1.2. Existing Computational Approaches and Their Limitations
1.3. Biological Context: Retromer Trafficking, SNX5, AQP7, and the Mechanistic Basis of the Six-Probe Signature Limitations
1.4. Interpretability in Computational Biomarker Discovery
1.5. Research Gaps and Contributions of This Study
- Gap 1—No interpretable XAI pipeline exists for longitudinal AD MMSE-change prediction from blood transcriptomics: All existing models predict cross-sectional diagnosis or provide no feature-level SHAP attribution for longitudinal regression. The combination of Markov Blanket selection, Elastic Net regression, and SHAP LinearExplainer has not been applied to MMSE change prediction [11,15], as addressed by Contribution 1.
- Gap 2—Cell-type compositional confounding is unexamined in blood transcriptomic AD biomarker studies: No published AD blood transcriptomic predictor has applied immune cell deconvolution to confirm whether the signal reflects transcriptional dysregulation or cell proportion shifts [17,18]. This leaves all existing blood transcriptomic AD signatures vulnerable to the criticism that they measure cell composition rather than gene regulation, as addressed by Contribution 2.
- Gap 3—Individual probe cross-platform replication by HGNC symbol mapping is absent for MMSE-predictive signatures: No study has validated individual gene associations from a longitudinal MMSE-change model in an independent cohort on a different array platform [11,19], meaning existing signatures could reflect platform-specific artefacts. Addressed by Contribution 3.
- Gap 4—SNX5 retromer protection and AQP7 glymphatic–metabolic associations lack clinical evidence from blood: The retromer hypothesis [20,21,22] is supported by cellular and post-mortem data but has never been quantified in a multivariate blood transcriptomic model for longitudinal cognitive decline. AQP7 has not appeared in any blood AD biomarker study, leaving the glymphatic–metabolic hypothesis untested at the clinical level [24], as addressed by Contribution 4.
- Gap 5—No reproducible, deployable implementation exists for this class of pipeline: Existing methods papers in AD transcriptomics do not provide fully reproducible implementations, interactive web tool demonstrations, or community-deployable code, thus limiting replication and translation of findings, as addressed by Contribution 6.
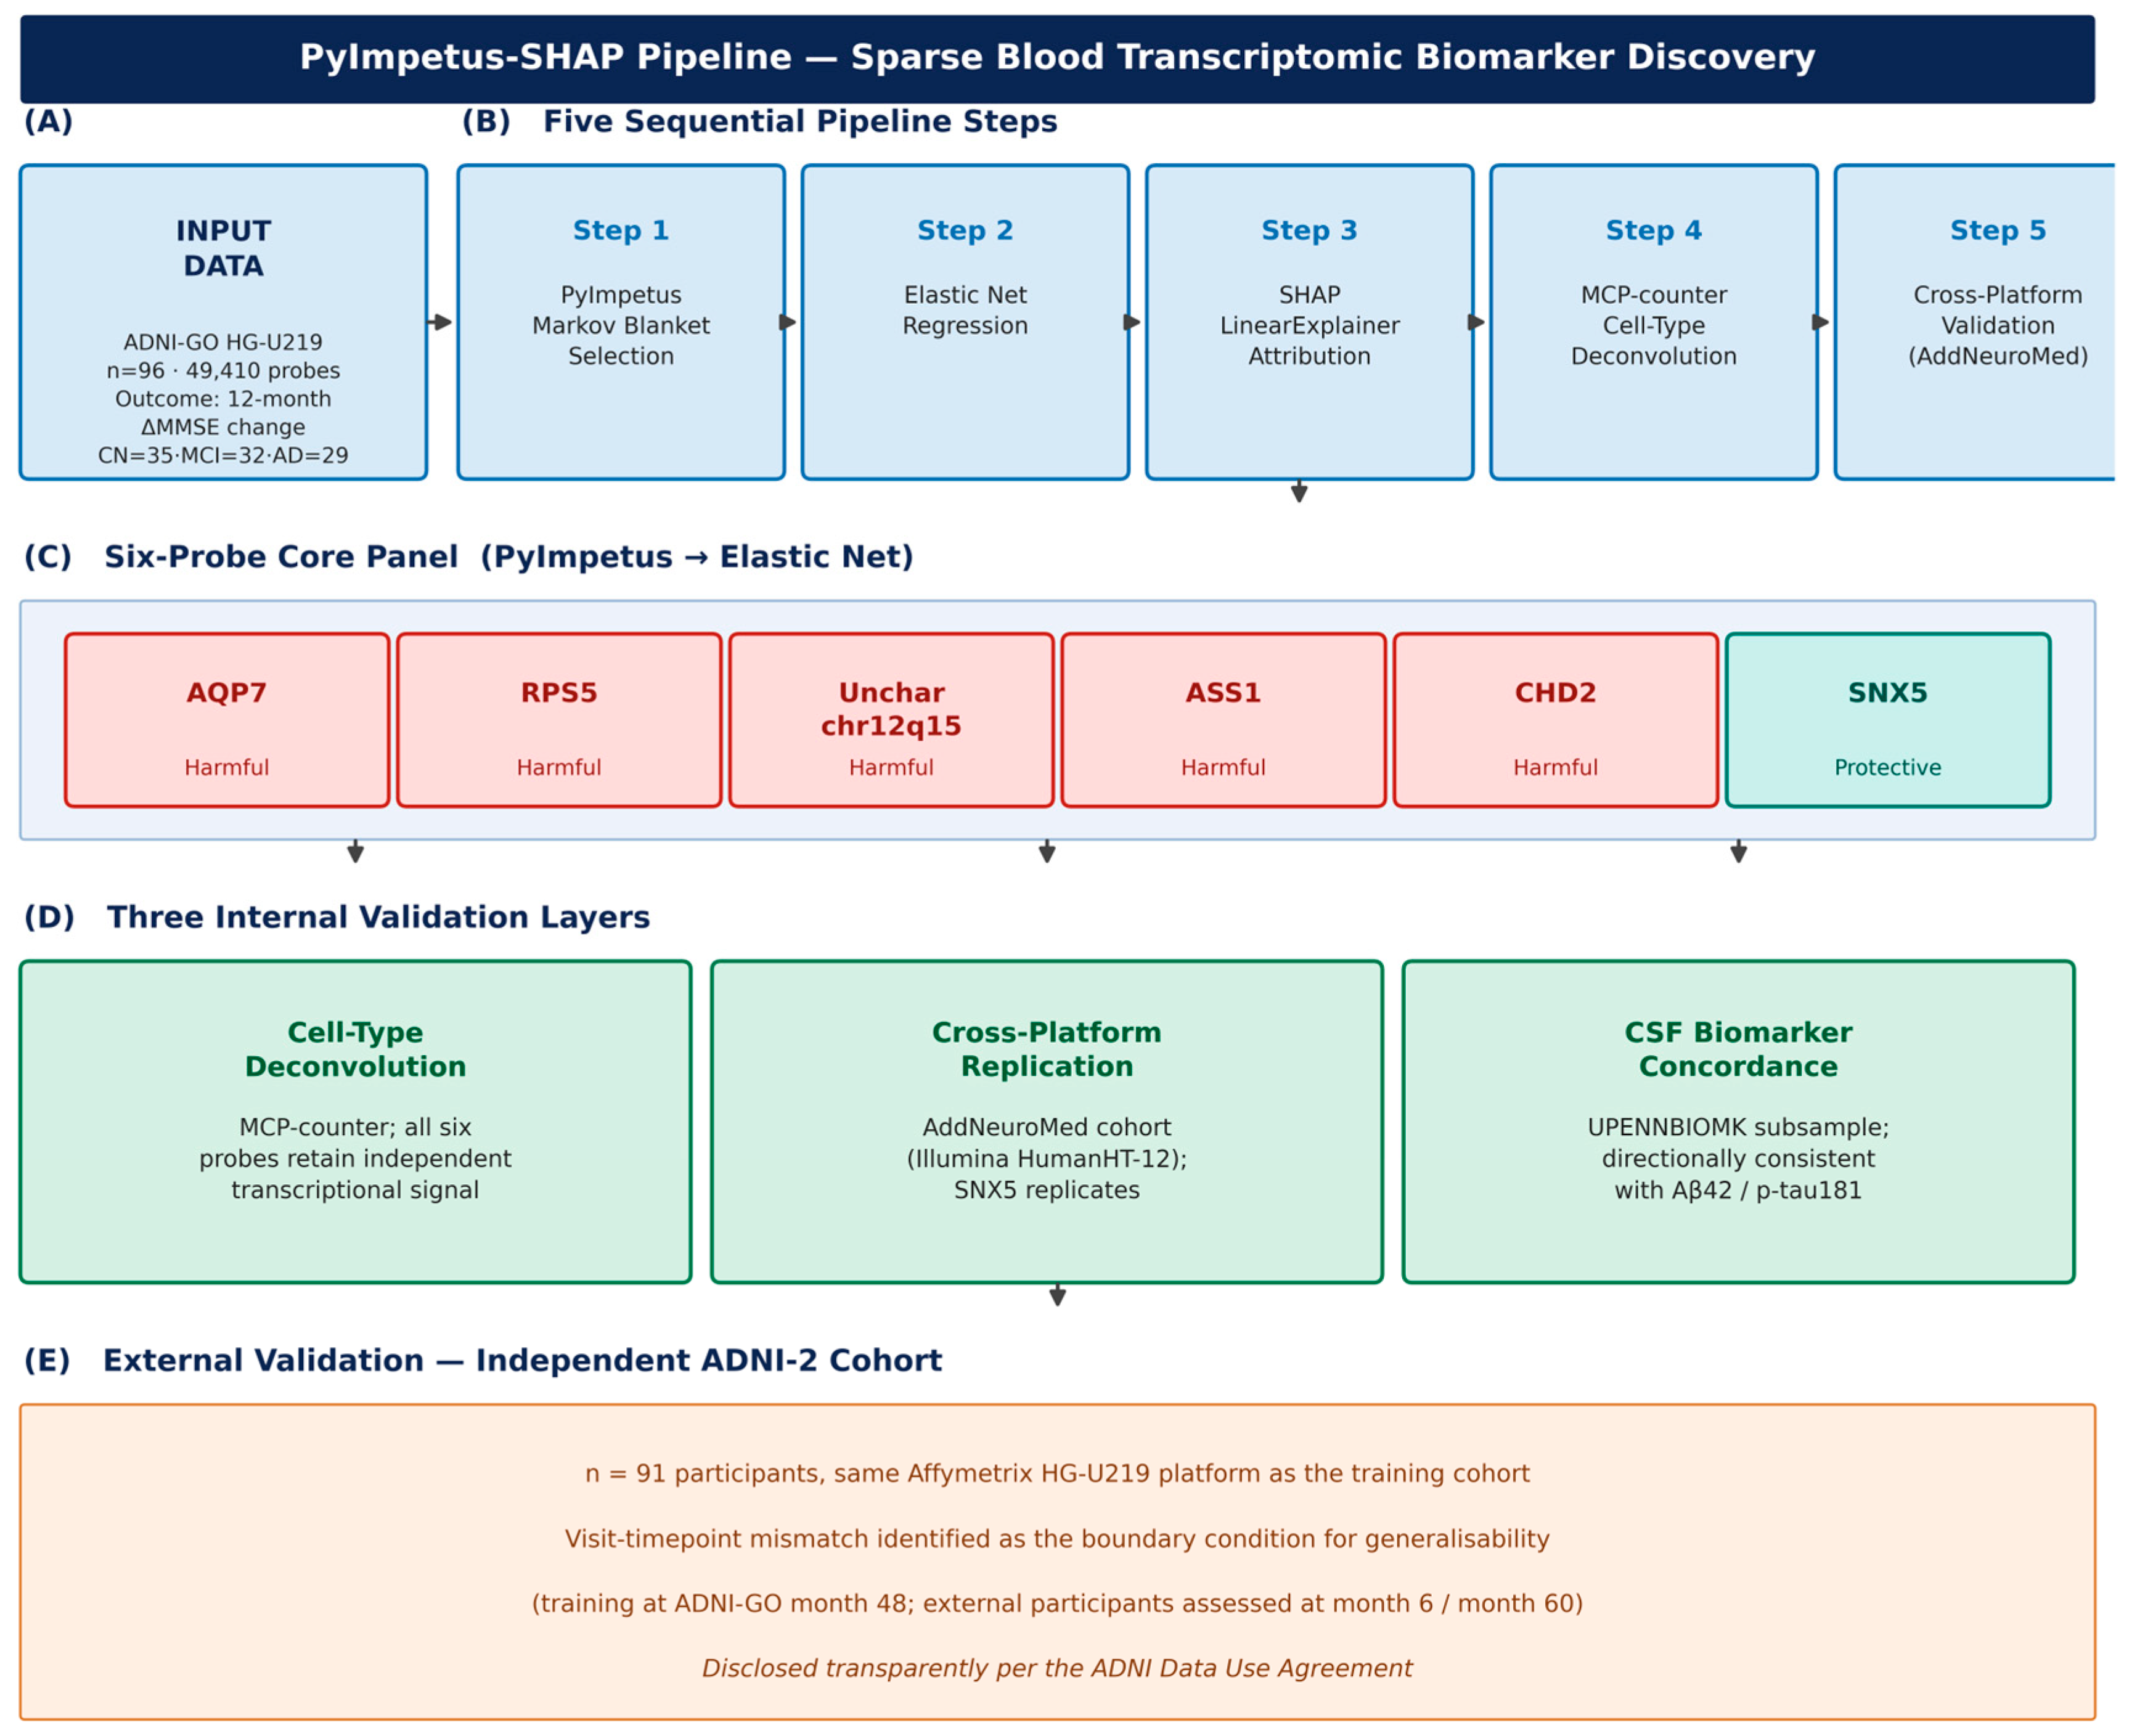
- Contribution 1—PyImpetus-SHAP pipeline: The first integration of Markov Blanket conditional independence testing, Elastic Net regression, and exact SHAP LinearExplainer attribution for longitudinal continuous MMSE change prediction from high-dimensional blood transcriptomics, with stability assessment using Jaccard similarity and permutation testing (addresses Gap 1).
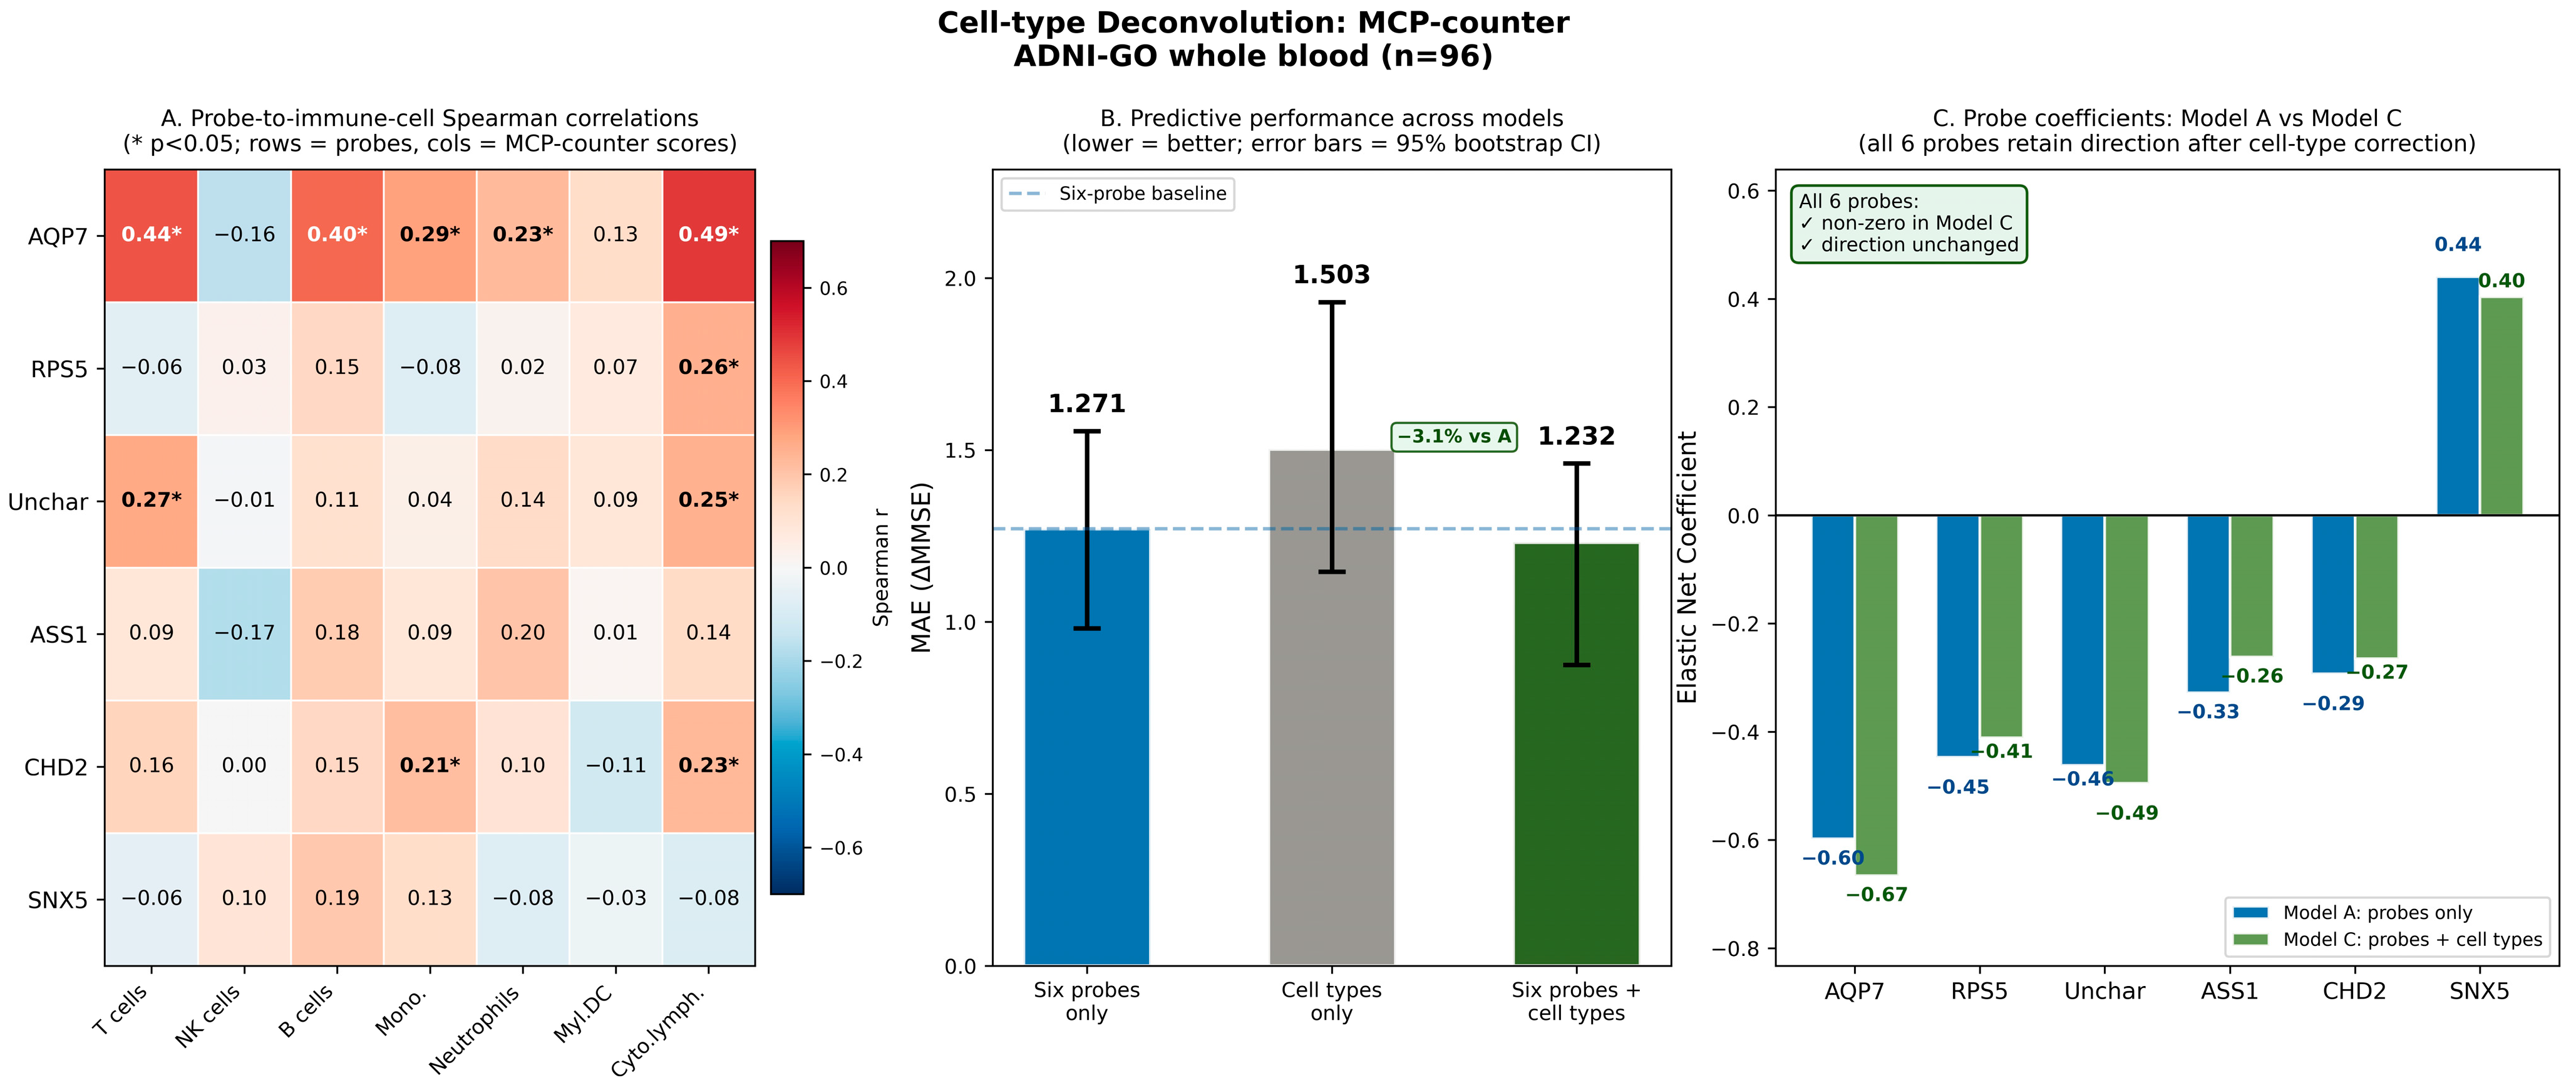
- Contribution 2—Three-model cell-type deconvolution validation framework: A reusable MCP-counter three-model comparison (six probes only; seven immune cell-type scores only; joint model) confirming all six probes retain independent Elastic Net coefficients after cell-type correction, the first such validation in any blood transcriptomic AD study [17,18] (addresses Gap 2).
- Contribution 3—Cross-platform HGNC symbol mapping replication: Five of the six probes were mapped by HGNC gene symbol into the independent European AddNeuroMed cohort (GSE63060, n = 329, Illumina HumanHT-12). SNX5 was the only probe to replicate significantly across platforms (p = 0.002), providing the first cross-platform biological evidence linking blood retromer activity to AD severity. The remaining four probes showed no significant cross-sectional associations, consistent with their role as longitudinal trajectory markers rather than disease state indicators and require validation in independent prospective cohorts (addresses Gap 3).
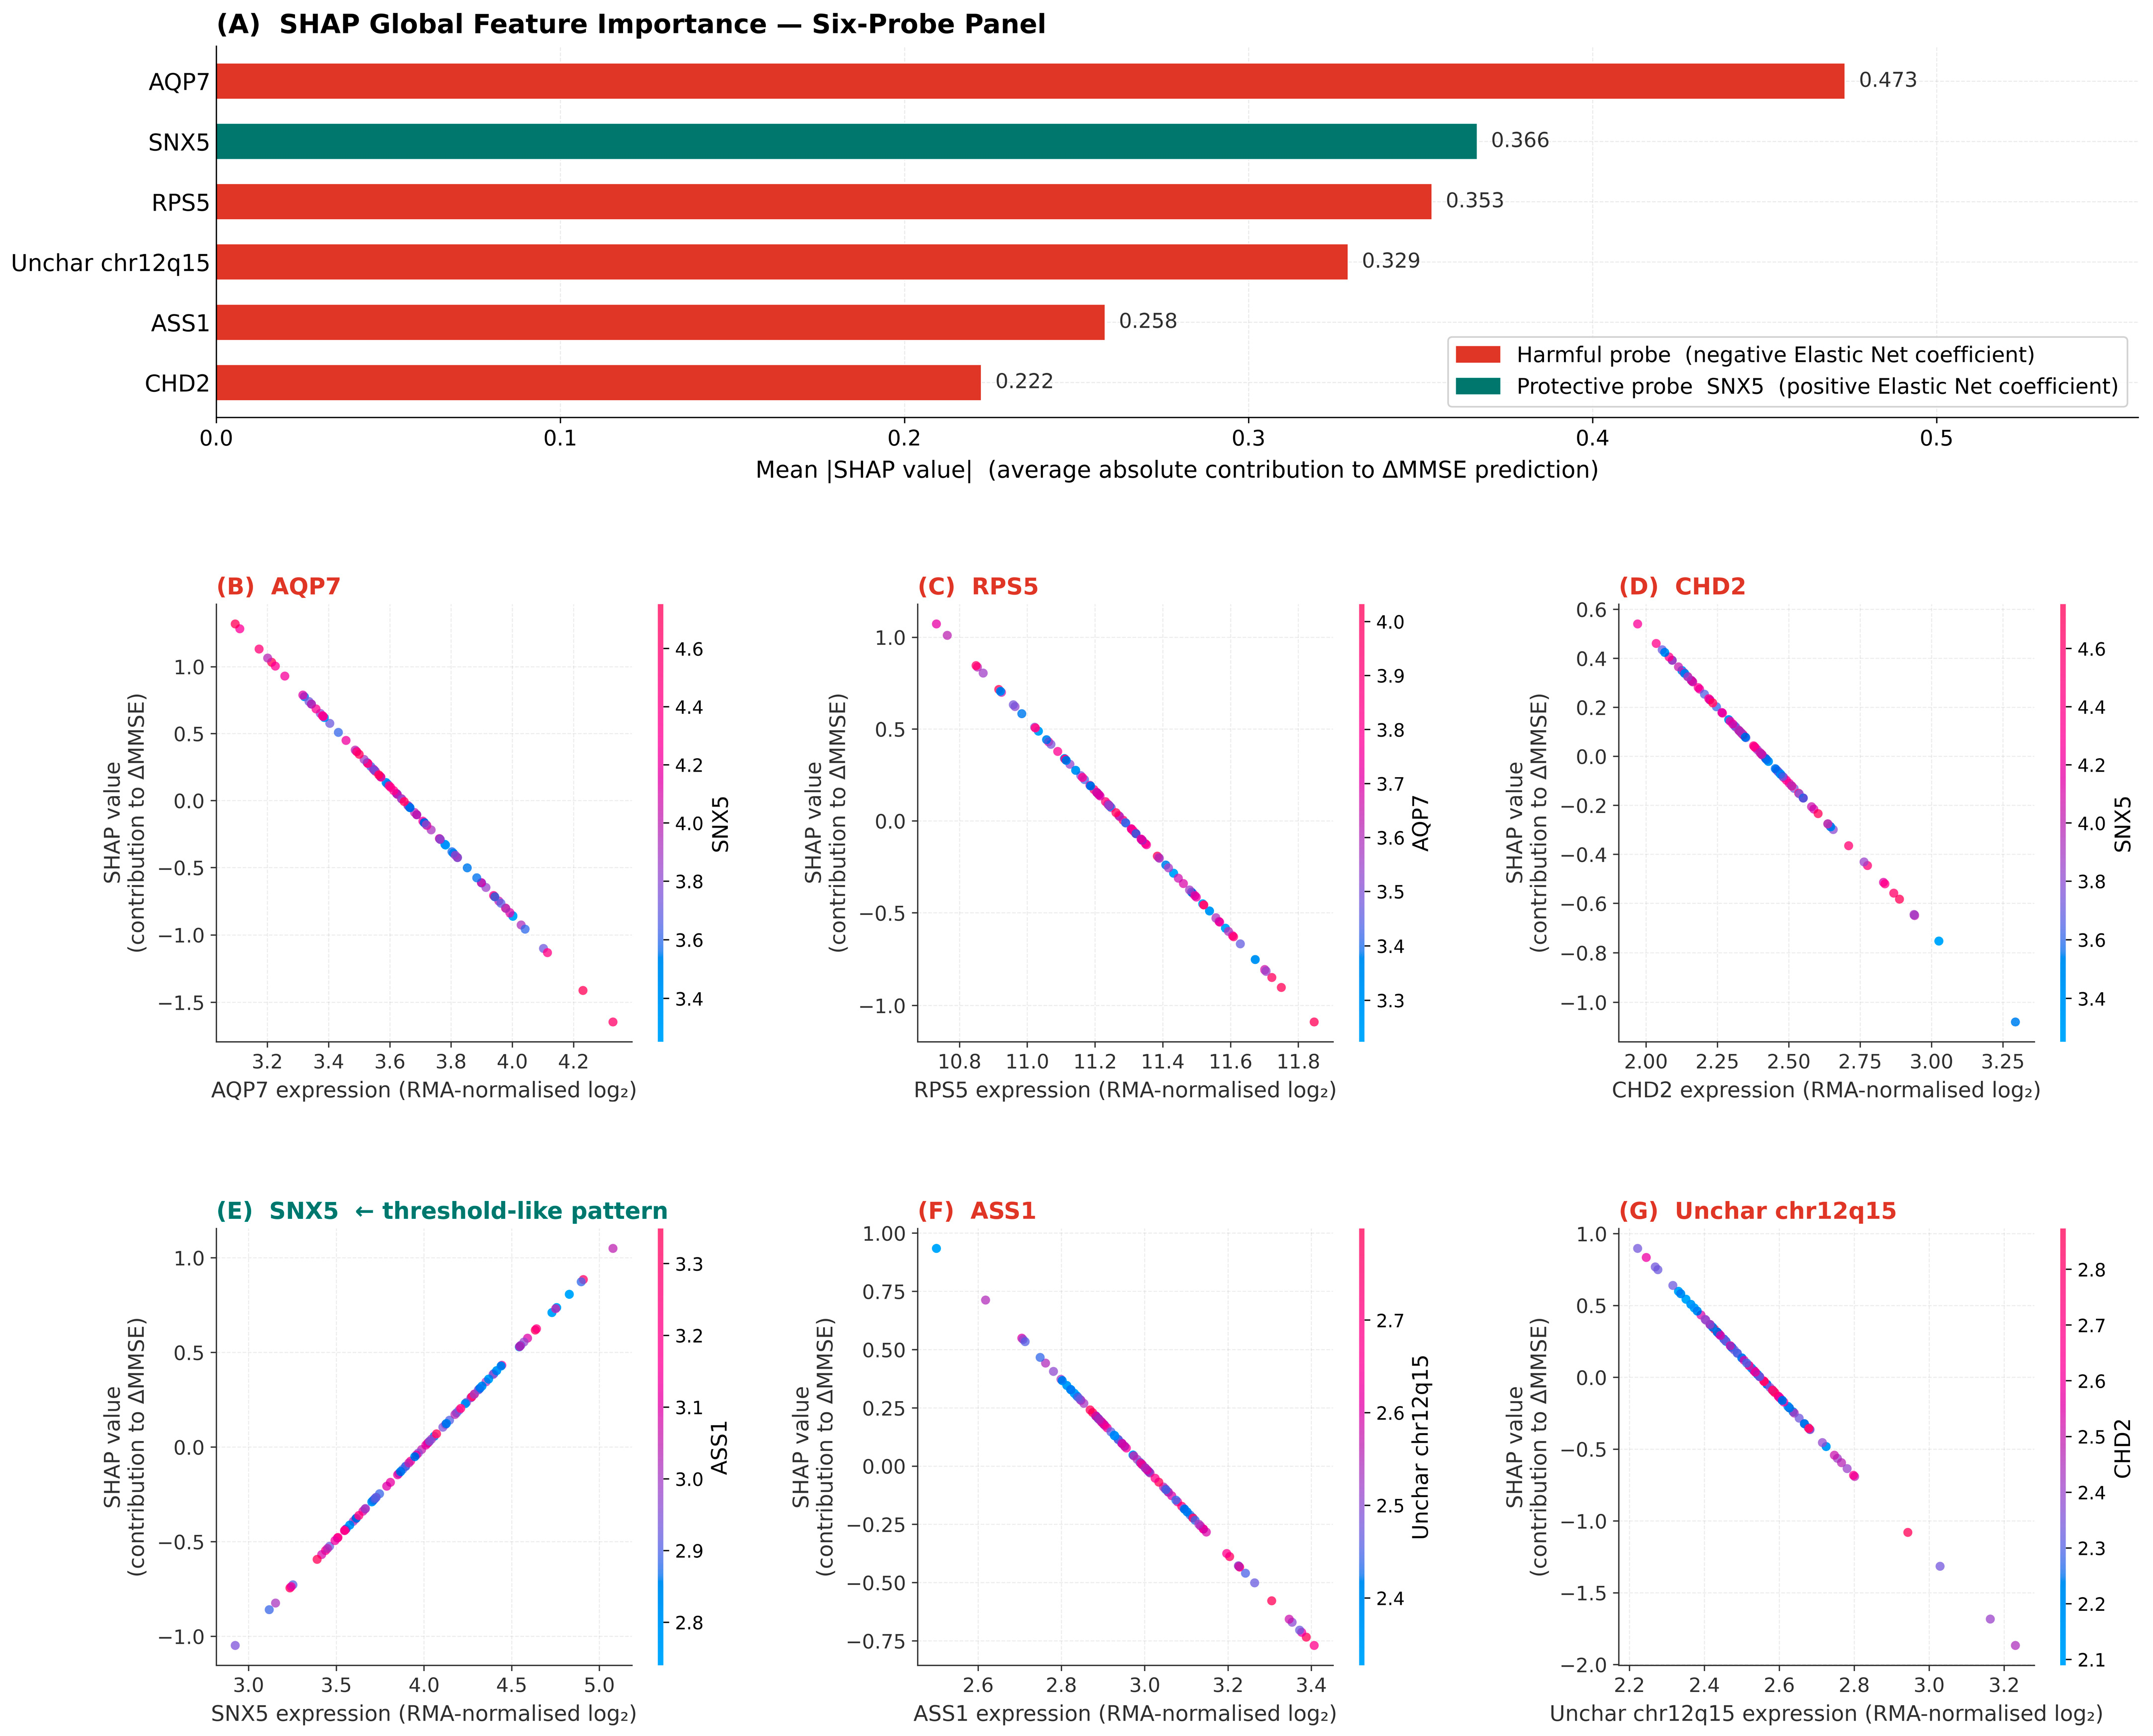
- Contribution 4—Novel AQP7 glymphatic–metabolic discovery: AQP7 identified as the dominant harmful predictor (coefficient −0.598; mean |SHAP| approximately 0.47), a computationally driven discovery with no prior literature support in longitudinal AD blood transcriptomics, opening a new glymphatic–metabolic research direction [24] (addresses Gap 4).
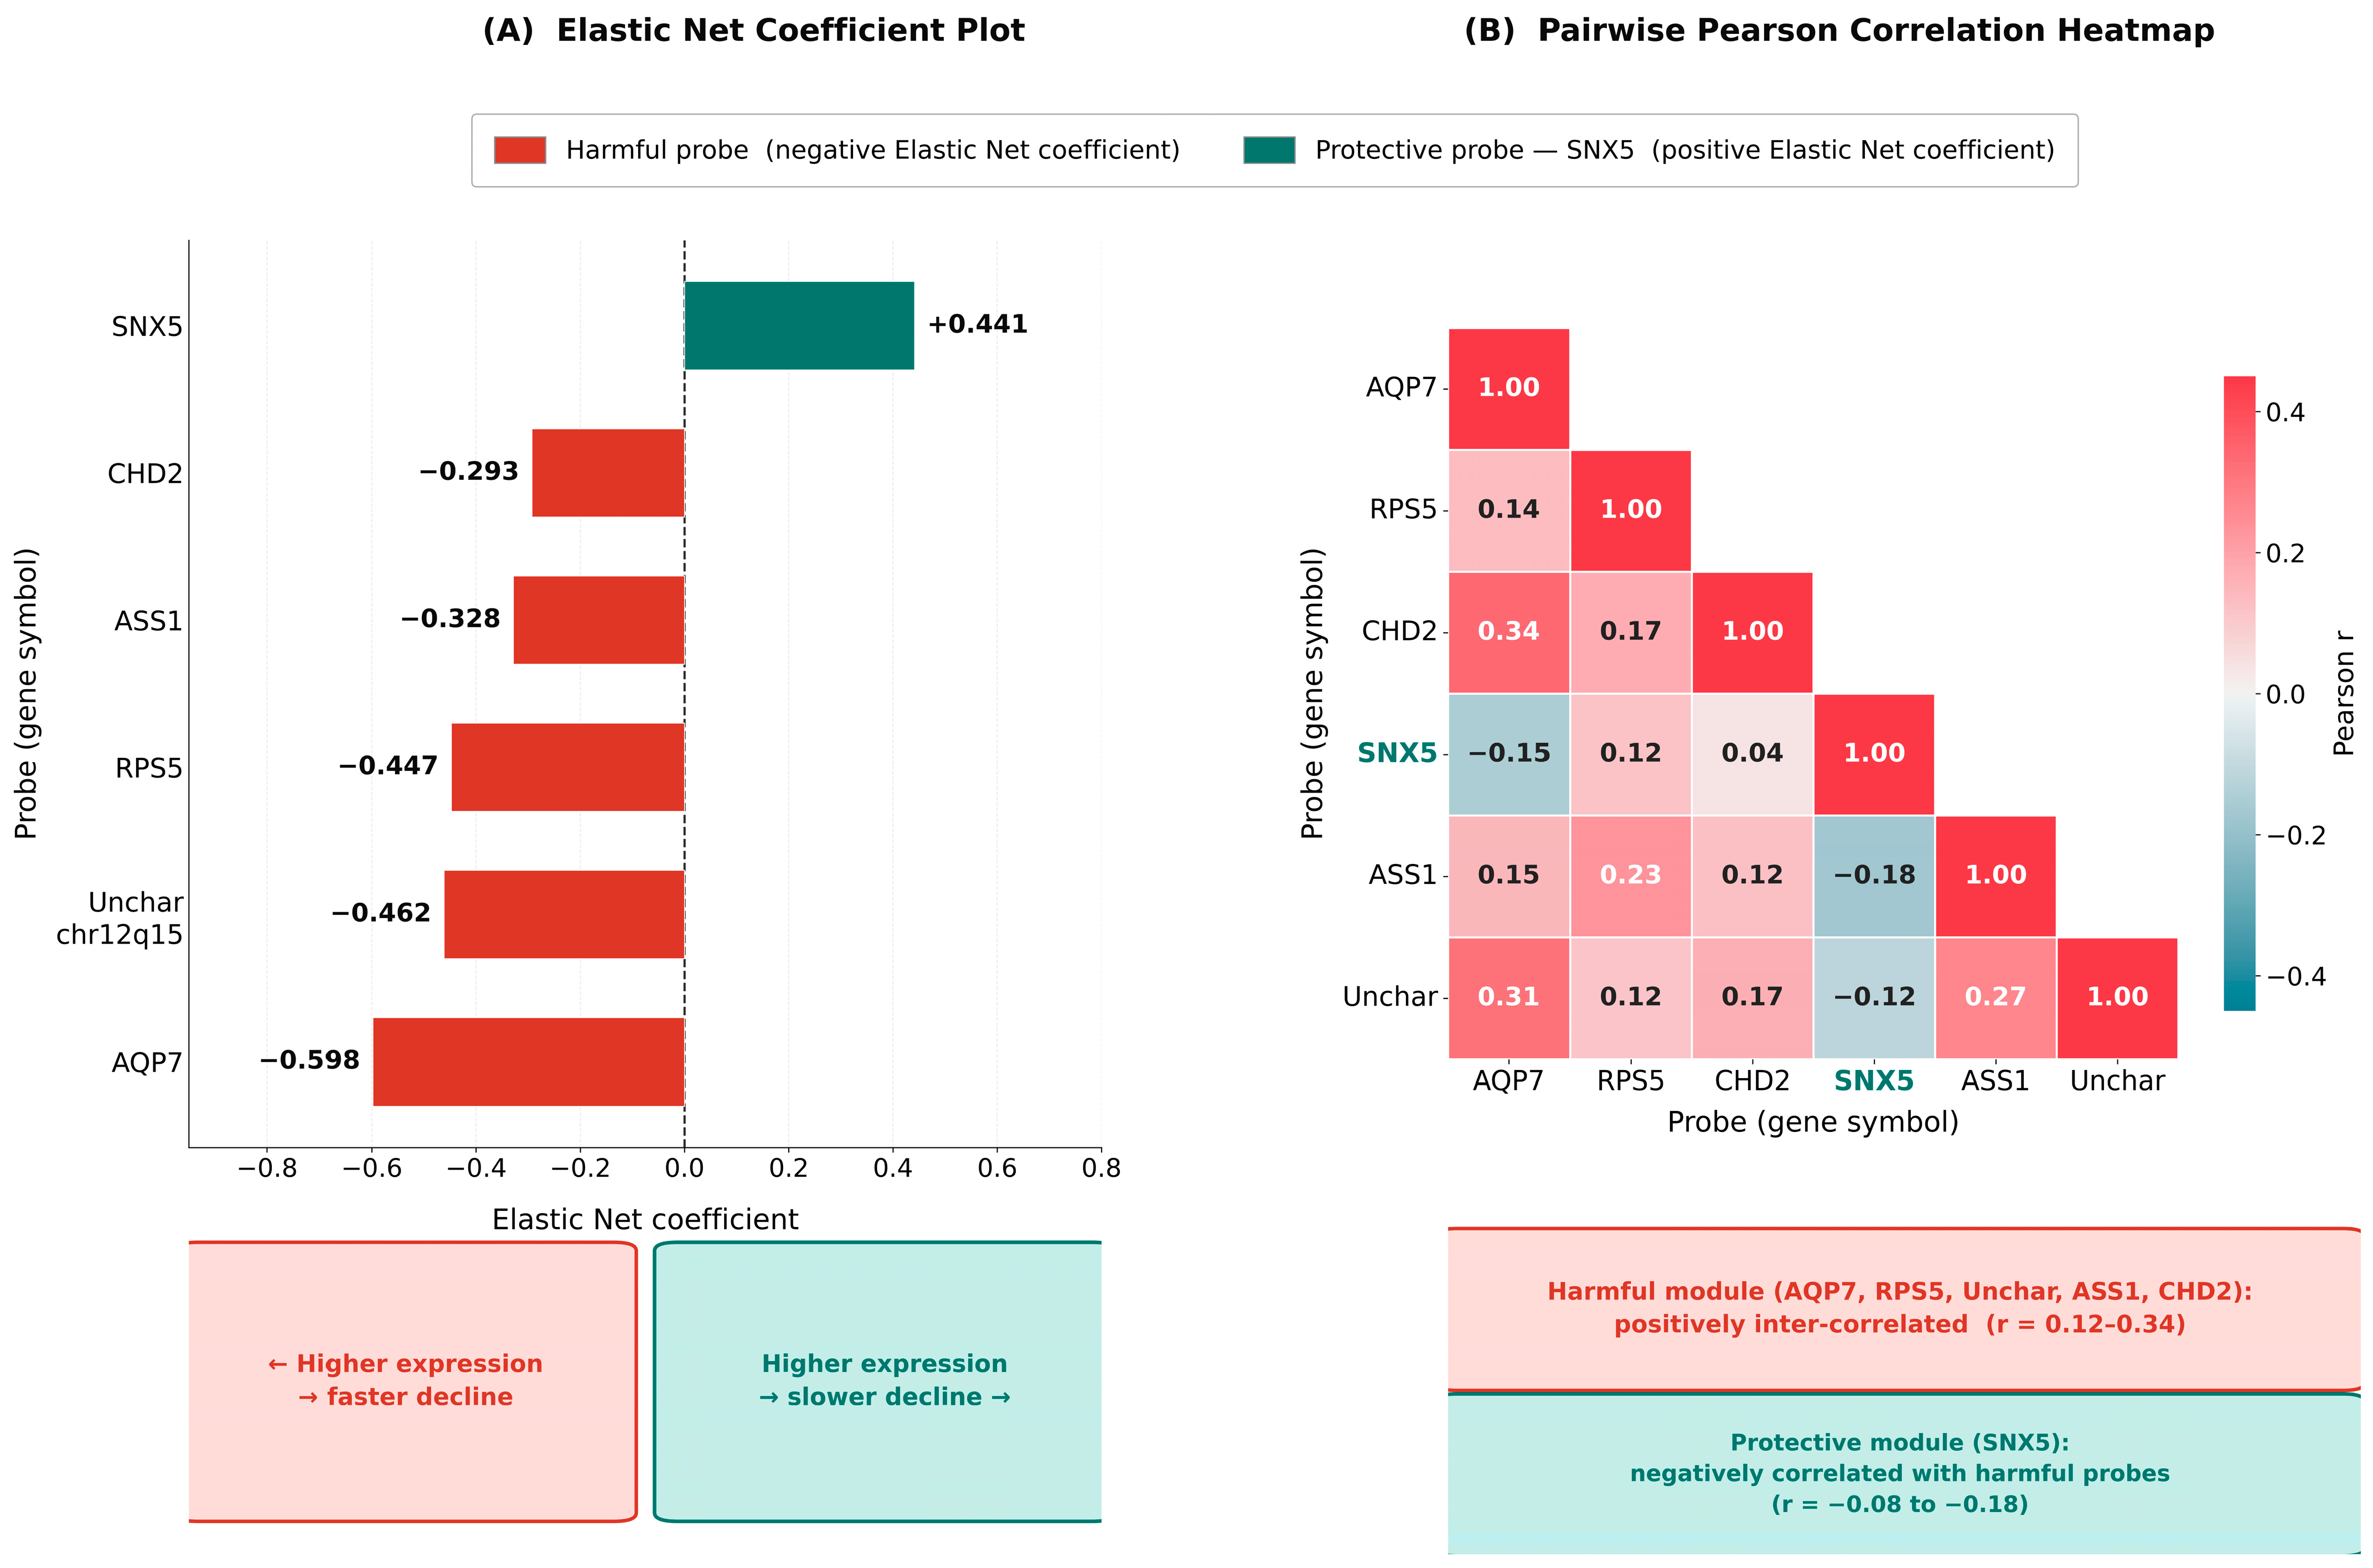
- Contribution 5—Two-module transcriptional architecture: A harmful module (AQP7, RPS5, ASS1, CHD2, uncharacterised chr12q15; positively inter-correlated, r = 0.12–0.34) and a protective module (SNX5; negatively correlated with harmful probes) with reciprocal regulatory structure consistent with shared upstream inflammatory transcriptional control. This is an additional discovery emerging from the pipeline rather than a pre-specified gap; it provides a systems-level biological interpretation of the six-probe panel that extends beyond individual gene associations [11,15].
- Contribution 6—A prototype clinical decision support tool: to make the pipeline tangible beyond a GitHub repository (version 1.0.0; commit 96cb8d5), we built a Streamlit web application (Python 3.10) that runs live at https://pyimpetus-shap-ad.streamlit.app, accessed on 1 June 2026, with no installation needed. Six expression sliders feed the trained model in real time, returning a predicted 12-month MMSE change, a risk category with a suggested review interval (High: ΔMMSE ≤ −2; Moderate: −2 to 0; Low: ≥0), a per-probe SHAP bar chart, and a warning if any value falls outside the training range. All code, the trained model, and the app source are at https://github.com/SAH-ML/pyimpetus-shap-ad, accessed on 1 June 2026 (addresses Gap 5).
1.6. Gaps in the Existing Evidence Base
2. Material and Methods
2.1. Study Population and Data Source
2.2. Data Quality Control and Missing Value Handling
2.3. Pipeline Step 1— PyImpetus Markov Blanket Feature Selection
2.4. Pipeline Step 2: Elastic Net Regression and Cross-Validation
2.5. Pipeline Step 3: SHAP Feature Attribution
2.6. Pipeline Step 4: MCP-Counter Cell-Type Deconvolution
2.7. Pipeline Step 5: Cross-Platform Biological Validation
2.8. CSF Biomarker Concordance
2.9. External Validation Dataset Construction
2.10. Statistical Analysis
2.11. A Web-Based Demonstration Tool for Real-Time Prediction
2.12. Software Availability
3. Results
3.1. Feature Selection Stability and the Six-Probe Core Panel
3.2. Predictive Performance
3.3. SHAP Attribution and Transcriptional Module Structure
3.4. Cell-Type Deconvolution: The Signal Is Transcriptional, Not Compositional
3.5. Cross-Platform Biological Validation in AddNeuroMed
3.6. CSF Biomarker Concordance: Directional but Underpowered Associations
3.7. External Validation and Boundary Conditions for Applicability
4. Discussion
4.1. Pipeline Methodology: What PyImpetus-SHAP Contributes to Biomedical Data Mining
4.2. SNX5 and Retromer Protection: From Molecular Mechanism to Quantitative Clinical Evidence
4.3. AQP7 as a Novel Computational Discovery: Glymphatic–Metabolic Hypothesis
4.4. The CHD2 Reversal: Why Cross-Sectional Replication Can Mislead Trajectory Biomarkers
4.5. Cell-Type Deconvolution as a Proposed Methodological Standard
4.6. Characterising the Boundary Conditions of Applicability: Visit-Timepoint Specificity as a Scientific Finding
4.7. Comparison with Prior Computational Work and Positioning of PyImpetus-SHAP
5. Conclusions
6. Limitations and Future Directions
Author Contributions
Funding
Institutional Review Board Statement
Informed Consent Statement
Data Availability Statement
Acknowledgments
Conflicts of Interest
Abbreviations
References
- Better, M.A. Alzheimer disease facts and figures. Alzheimers Dement. 2023, 19, 1598–1695. [Google Scholar] [CrossRef] [Scilit]
- Petersen, R.C.; Lopez, O.; Armstrong, M.J.; Getchius, T.S.D.; Ganguli, M.; Gloss, D.; Gronseth, G.S.; Marson, D.; Pringsheim, T.; Day, G.S.; et al. Practice guideline update summary: Mild cognitive impairment. Neurology 2018, 90, 126–135. [Google Scholar] [CrossRef] [Scilit] [PubMed]
- Ding, J.; Zhao, Q.; Guo, Q.; Liang, X.; Luo, J.; Yu, L.; Zheng, L.; Hong, Z.; Shanghai Aging Study (SAS). Progression and predictors of mild cognitive impairment in Chinese elderly. Alzheimers Dement. 2016, 4, 28–36. [Google Scholar] [CrossRef] [Scilit] [PubMed]
- Jack, C.R., Jr.; Bennett, D.A.; Blennow, K.; Carrillo, M.C.; Dunn, B.; Haeberlein, S.B.; Holtzman, D.M.; Jagust, W.; Jessen, F.; Karlawish, J.; et al. NIA-AA research framework: Toward a biological definition of Alzheimer’s disease. Alzheimer Dement. 2018, 14, 535–562. [Google Scholar] [CrossRef] [Scilit] [PubMed]
- Schöll, M.; Lockhart, S.N.; Schonhaut, D.R.; O’neil, J.P.; Janabi, M.; Ossenkoppele, R.; Baker, S.L.; Vogel, J.W.; Faria, J.; Schwimmer, H.D.; et al. PET imaging of tau deposition in the aging human brain. Neuron 2016, 89, 971–982. [Google Scholar] [CrossRef] [Scilit] [PubMed]
- Hansson, O.; Blennow, K.; Zetterberg, H.; Dage, J. Blood biomarkers for Alzheimer disease in clinical practice and trials. Nat. Aging 2023, 3, 506–519. [Google Scholar] [CrossRef] [Scilit] [PubMed]
- Bucci, M.; Almkvist, O.; Bluma, M.; Ashton, N.J.; Savitcheva, I.; Chiotis, K.; Di Molfetta, G.; Blennow, K.; Zetterberg, H.; Nordberg, A. Profiling plasma biomarkers, particularly pTau217 and pTau217/Aβ42, and their relation to cognition in memory clinic patients. J. Neurochem. 2025, 169, e70182. [Google Scholar] [CrossRef] [Scilit] [PubMed]
- Lee, E.H.; Kang, S.H.; Shin, D.; Kim, Y.J.; Zetterberg, H.; Blennow, K.; Gonzalez-Ortiz, F.; Ashton, N.J.; Cheon, B.K.; Yoo, H.; et al. Plasma Alzheimer disease biomarker variability: Amyloid-independent and amyloid-dependent factors. Alzheimers Dement. 2025, 21, e14368. [Google Scholar] [CrossRef] [Scilit] [PubMed]
- de Wolf, F.; Ghanbari, M.; Licher, S.; McRae-McKee, K.; Gras, L.; Weverling, G.J.; Wermeling, P.; Sedaghat, S.; Ikram, M.K.; Waziry, R.; et al. Plasma tau, neurofilament light chain and amyloid-beta levels and risk of dementia; a population-based cohort study. Brain 2020, 143, 1220–1232. [Google Scholar] [CrossRef] [Scilit] [PubMed]
- Mattsson, N.; Andreasson, U.; Zetterberg, H.; Blennow, K. Association of plasma neurofilament light with neurodegeneration in patients with Alzheimer disease. JAMA Neurol. 2017, 74, 557–566. [Google Scholar] [CrossRef] [Scilit] [PubMed]
- Chen, X.; Wang, X.; Reddy, J.S.; Quicksall, Z.; Nguyen, T.T.; Reyes, D.A.; Lowe, V.J.; Petersen, R.; Kantarci, K.; Nho, K.; et al. Blood-based genes and co-expression network levels associated with AD/MCI diagnosis, cognitive, and neuroimaging phenotypes and preserved in the brain. Alzheimers Dement. 2025, 21, e109896. [Google Scholar] [CrossRef] [Scilit]
- Hampel, H.; O’Bryant, S.E.; Molinuevo, J.L.; Zetterberg, H.; Masters, C.L.; Lista, S.; Kiddle, S.J.; Batrla, R.; Blennow, K. Blood-based biomarkers for Alzheimer disease: Mapping the road to the clinic. Nat. Rev. Neurol. 2018, 14, 639–652. [Google Scholar] [CrossRef] [Scilit] [PubMed]
- Ritchie, M.E.; Phipson, B.; Wu, D.; Hu, Y.; Law, C.W.; Shi, W.; Smyth, G.K. limma powers differential expression analyses for RNA-sequencing and microarray studies. Nucleic Acids Res. 2015, 43, e47. [Google Scholar] [CrossRef] [Scilit] [PubMed]
- Tibshirani, R. Regression shrinkage and selection via the Lasso. J. R. Stat. Soc. Ser. B Stat. Methodol. 1996, 58, 267–288. [Google Scholar] [CrossRef] [Scilit]
- Wang, F.; Liang, Y.; Wang, Q.W. Interpretable machine learning-driven biomarker identification and validation for Alzheimer disease. Sci. Rep. 2024, 14, 30770. [Google Scholar] [CrossRef] [Scilit] [PubMed]
- Hassan, A.; Paik, J.H.; Khare, S.R.; Hassan, S.A. A wrapper feature selection approach using Markov blankets. Pattern Recognit. 2025, 158, 111069. [Google Scholar] [CrossRef] [Scilit]
- Becht, E.; Giraldo, N.A.; Lacroix, L.; Buttard, B.; Elarouci, N.; Petitprez, F.; Selves, J.; Laurent-Puig, P.; Sautes-Fridman, C.; Fridman, W.H.; et al. Estimating the population abundance of tissue-infiltrating immune and stromal cell populations using gene expression. Genome Biol. 2016, 17, 218. [Google Scholar] [CrossRef] [Scilit] [PubMed]
- Mienye, I.D.; Obaido, G.; Jere, N.; Kayode, A.A.; Oladipo, G.; Ajamu, T. A survey of explainable artificial intelligence in healthcare: Concepts, applications, and challenges. Inf. Med. Unlocked 2024, 51, 101587. [Google Scholar] [CrossRef] [Scilit]
- Westman, E.; Simmons, A.; Muehlboeck, J.-S.; Mecocci, P.; Vellas, B.; Tsolaki, M.; Kłoszewska, I.; Soininen, H.; Weiner, M.W.; Lovestone, S.; et al. AddNeuroMed and ADNI: Similar patterns of Alzheimer’s atrophy and automated MRI classification accuracy in Europe and North America. Neuroimage 2011, 58, 818–828. [Google Scholar] [CrossRef] [Scilit] [PubMed]
- Dong, J.; Tong, W.; Liu, M.; Liu, M.; Liu, J.; Jin, X.; Chen, J.; Jia, H.; Gao, M.; Wei, M.; et al. Endosomal traffic disorders: A driving force behind neurodegenerative diseases. Transl. Neurodegener. 2024, 13, 66. [Google Scholar] [CrossRef] [Scilit] [PubMed]
- Zhang, H.; Huang, T.; Hong, Y.; Yang, W.; Zhang, X.; Luo, H.; Xu, H.; Wang, X. The retromer complex and sorting nexins in neurodegenerative diseases. Front Aging Neurosci. 2018, 10, 79. [Google Scholar] [CrossRef] [Scilit] [PubMed]
- Feng, T.; Niu, M.; Ji, C.; Gao, Y.; Wen, J.; Bu, G.; Xu, H.; Zhang, Y.-W. SNX15 regulates cell surface recycling of APP and Aβ generation. Mol. Neurobiol. 2016, 53, 3690–3701. [Google Scholar] [CrossRef] [Scilit] [PubMed]
- Small, S.A.; Gandy, S. Sorting through the cell biology of Alzheimer disease: Intracellular pathways to pathogenesis. Neuron 2006, 52, 15–31. [Google Scholar] [CrossRef] [Scilit] [PubMed]
- Nedergaard, M.; Goldman, S.A. Glymphatic failure as a final common pathway to dementia. Science 2020, 370, 50–56. [Google Scholar] [CrossRef] [Scilit] [PubMed]
- Evans, H.T.; Taylor, D.; Kneynsberg, A.; Bodea, L.-G.; Götz, J. Altered ribosomal function and protein synthesis caused by tau. Acta Neuropathol. Commun. 2021, 9, 110. [Google Scholar] [CrossRef] [Scilit] [PubMed]
- Jesko, H.; Wilkaniec, A.; Ciaslik, M.; Hilgier, W.; Gassowska, M.; Lukiw, W.J.; Adamczyk, A. Altered arginine metabolism in cells transfected with human wild-type beta amyloid precursor protein (βAPP). Curr. Alzheimer Res. 2016, 13, 1030–1039. [Google Scholar] [PubMed]
- Karachanak-Yankova, S.; Serbezov, D.; Antov, G.; Stancheva, M.; Mihaylova, M.; Hadjidekova, S.; Toncheva, D.; Pashov, A.; Belejanska, D.; Zhelev, Y.; et al. Rare pathogenic variants in pooled whole-exome sequencing data suggest hyperammonemia as a possible cause of dementia not classified as Alzheimer’s disease or frontotemporal dementia. Genes 2024, 15, 753. [Google Scholar] [CrossRef] [Scilit] [PubMed]
- He, R.; Cheng, J.; Qiu, Y.; Hu, Y.; Liu, J.; Wang, T.H.; Cao, X. IGF1R and FLT1 in female endothelial cells and CHD2 in male microglia play important roles in Alzheimer’s disease based on gender difference analysis. Exp. Gerontol. 2024, 194, 112512. [Google Scholar] [CrossRef] [Scilit] [PubMed]
- Pradhan, R.; Petrovic, Z.; Sakib, M.S.; Schröder, S.; Krüger, D.M.; Pena, T.; Diniz, E.; Burckhardt, S.; Schütz, A.L.; Grządzielewska, I.; et al. NeuID, a novel neuron-specific lncRNA, resolves a key epigenetic mechanism linking gene silencing to Alzheimer disease. bioRxiv 2025. [Google Scholar] [CrossRef] [Scilit] [PubMed]
- Chaddad, A.; Peng, J.; Xu, J.; Bouridane, A. Survey of explainable AI techniques in healthcare. Sensors 2023, 23, 634. [Google Scholar] [CrossRef] [Scilit]
- Lundberg, S.M.; Lee, S.I. A unified approach to interpreting model predictions. Adv. Neural Inf. Process. Syst. 2017, 30, 4765–4774. [Google Scholar]
- Heo, G.; Ali, M.; Timsina, J.; Liu, M.; Cruchaga, C.; Sung, Y.J. Large-scale Plasma Proteomic Profiling Identifies a Robust Set of Biomarkers for Detection of Clinical Alzheimer’s Disease. Alzheimer’s Dement. 2024, 20, e089494. [Google Scholar] [CrossRef] [Scilit]
- Yamakawa, A.; Suganuma, M.; Mitsumori, R.; Niida, S.; Ozaki, K.; Shigemizu, D. Alzheimer disease may develop from changes in immune system, cell cycle, and protein processing following alterations in ribosome function. Sci. Rep. 2025, 15, 3838. [Google Scholar] [CrossRef] [Scilit]
- Meng, W.; Inampudi, R.; Zhang, X.; Xu, J.; Huang, Y.; Xie, M.; Bian, J.; Yin, R. An interpretable population graph network to identify rapid progression of Alzheimer disease using UK Biobank. AMIA Annu. Symp. Proc. 2024, 2024, 808–817. [Google Scholar] [PubMed]
- Teunissen, C.E.; Verberk, I.M.W.; Thijssen, E.H.; Vermunt, L.; Hansson, O.; Zetterberg, H.; van der Flier, W.M.; Mielke, M.M.; del Campo, M. Blood-based biomarkers for Alzheimer’s disease: Towards clinical implementation. Lancet Neurol. 2022, 21, 66–77. [Google Scholar] [CrossRef] [Scilit] [PubMed]
- Alzheimer Disease Neuroimaging Initiative. ADNI Database. Available online: http://adni.loni.usc.edu/ (accessed on 10 March 2026).
- Weiner, M.W.; Veitch, D.P.; Aisen, P.S.; Beckett, L.A.; Cairns, N.J.; Green, R.C.; Harvey, D.; Jack, C.R.; Jagust, W.; Liu, E.; et al. The Alzheimer Disease Neuroimaging Initiative: A review of papers published since its inception. Alzheimers Dement. 2013, 9, e111–e194. [Google Scholar] [CrossRef] [Scilit] [PubMed]
- Irizarry, R.A.; Hobbs, B.; Collin, F.; Beazer-Barclay, Y.D.; Antonellis, K.J.; Scherf, U.; Speed, T.P. Exploration, normalization, and summaries of high density oligonucleotide array probe level data. Biostatistics 2003, 4, 249–264. [Google Scholar] [CrossRef] [Scilit] [PubMed]
- Johnson, W.E.; Li, C.; Rabinovic, A. Adjusting batch effects in microarray expression data using empirical Bayes methods. Biostatistics 2007, 8, 118–127. [Google Scholar] [CrossRef] [Scilit] [PubMed]
- Zou, H.; Hastie, T. Regularization and variable selection via the elastic net. J. R. Stat. Soc. Ser. B Stat. Methodol. 2005, 67, 301–320. [Google Scholar] [CrossRef] [Scilit]
- Pedregosa, F.; Varoquaux, G.; Gramfort, A.; Michel, V.; Thirion, B.; Grisel, O.; Blondel, M.; Prettenhofer, P.; Weiss, R.; Dubourg, V.; et al. Scikit-learn: Machine learning in Python. J. Mach. Learn. Res. 2011, 12, 2825–2830. [Google Scholar]
- Corder, E.H.; Saunders, A.M.; Strittmatter, W.J.; Schmechel, D.E.; Gaskell, P.C.; Small, G.W.; Roses, A.D.; Haines, J.L.; Pericak-Vance, M.A. Gene dose of apolipoprotein E type 4 allele and the risk of Alzheimer’s disease in late onset families. Science 1993, 261, 921–923. [Google Scholar] [CrossRef] [Scilit] [PubMed]
- Risacher, S.L.; McDonald, B.C.; Tallman, E.F.; West, J.D.; Farlow, M.R.; Unverzagt, F.W. APOE genotype effects on Alzheimer disease longitudinal cognitive decline. Brain Commun. 2022, 4, fcac028. [Google Scholar]
- Arlot, S.; Celisse, A. A survey of cross-validation procedures for model selection. Stat. Surv. 2010, 4, 40–79. [Google Scholar] [CrossRef] [Scilit]
- Shaw, L.M.; Vanderstichele, H.; Knapik-Czajka, M.; Clark, C.M.; Aisen, P.S.; Petersen, R.C.; Blennow, K.; Soares, H.; Simon, A.; Lewczuk, P.; et al. Cerebrospinal fluid biomarker signature in Alzheimer Disease Neuroimaging Initiative subjects. Ann. Neurol. 2009, 65, 403–413. [Google Scholar] [CrossRef] [Scilit] [PubMed]
- Tombaugh, T.N.; McIntyre, N.J. The mini-mental state examination: A comprehensive review. J. Am. Geriatr. Soc. 1992, 40, 922–935. [Google Scholar] [CrossRef] [Scilit] [PubMed]
- Szklarczyk, D.; Gable, A.L.; Nastou, K.C.; Lyon, D.; Kirsch, R.; Pyysalo, S.; Doncheva, N.T.; Legeay, M.; Fang, T.; Bork, P.; et al. The STRING database in 2021: Customizable protein–protein networks, and functional characterization of user-uploaded gene/measurement sets. Nucleic Acids Res. 2021, 49, D605–D612. [Google Scholar] [CrossRef] [Scilit] [PubMed]
- Wu, J.; Wang, X.; Tian, Q.; Yin, C.; Gao, D.; Ai, X.; Yang, X.; Xiao, T.; Gao, Y.; He, F.; et al. Multi-omics dissection of SNP-mediated immunometabolic signatures in Alzheimer’s disease reveals a novel individual predictive model. NPJ Digit. Med. 2026, 9, 81. [Google Scholar] [CrossRef] [Scilit] [PubMed]
- Xu, Z.; Xiao, N.; Chen, Y.; Huang, H.; Marshall, C.; Gao, J.; Cai, Z.; Wu, T.; Hu, G.; Xiao, M. Deletion of aquaporin-4 in APP/PS1 mice exacerbates brain Aβ accumulation and memory deficits. Mol. Neurodegener. 2015, 10, 58. [Google Scholar] [CrossRef] [Scilit]
- Califf, R.M. Biomarker definitions and their applications. Exp. Biol. Med. 2018, 243, 213–221. [Google Scholar] [CrossRef] [Scilit] [PubMed]
- Dong, J.M.; Zhong, H. Systematic review: Proteomics-driven multi-omics integration for Alzheimer disease pathology and precision medicine. Neurol. Int. 2025, 17, 197. [Google Scholar] [CrossRef] [Scilit] [PubMed]



| Study/Year | Topic Area | Strengths | Weaknesses/Limitations | Potential Bias | Gap Addressed by Present Study |
|---|---|---|---|---|---|
| Petersen et al. 2018 [2] | MCI clinical guideline | Standardised diagnostic criteria; widely adopted in clinical practice | No molecular biomarkers; cognitive testing only; cross-sectional design | Expert consensus bias—empirical data limited | No blood-based longitudinal predictor; no RNA-level data |
| Jack et al. 2018 [4] | ATN biomarker framework | Biological AD definition; integrates amyloid, tau, neurodegeneration | CSF/PET required; expensive; invasive; inaccessible in primary care | Amyloid-centric—may underweight other mechanisms | No transcriptomic model; no longitudinal MMSE prediction |
| Hansson 2023 [6] | Blood biomarkers review | Plasma p-tau217 AUC 91–93%; comprehensive multi-platform review | Prognostic value for rapid MCI conversion remains modest | Publication bias—positive results over-represented | No RNA-level longitudinal predictor; protein biomarkers only |
| Chen et al. 2025 [11] | Blood transcriptome modules | Co-expression modules linked to cognitive and imaging phenotypes | Cross-sectional; no MMSE outcome; no cell-type correction | Cohort bias—predominantly non-Hispanic white participants | No interpretable feature-level attribution; no cell-type validation |
| Wang et al. 2024 [15] | Interpretable ML for AD | SHAP identifies MYH9, RHOQ; classification with transparency | Cross-sectional diagnosis; no longitudinal model; no deconvolution | Overfitting risk—small discovery set; no external validation | No longitudinal MMSE prediction; no cell-type validation |
| Becht et al. 2016 [17] | MCP-counter deconvolution | Validated immune cell scoring from bulk gene expression; no single-cell required | Proxy scores; platform-specific marker probes | Marker gene overlap may affect population specificity | First application in AD longitudinal blood transcriptomic study |
| Dong et al. 2024 [20] | Endosomal traffic review | Retromer dysfunction as a unifying neurodegeneration mechanism | Review only; no predictive model; no blood measurement | Literature selection bias | SNX5 never quantified in blood in living participants |
| Feng et al. 2016 [22] | SNX15 regulates APP/Aβ | SNX15 overexpression directly reduces Aβ in neuronal cultures | In vitro only; no in vivo validation; no cognitive outcome | Positive-result bias—protective effects more likely published | No blood-based longitudinal clinical evidence for SNX5 |
| Nedergaard & Goldman 2020 [24] | Glymphatic failure dementia | Glymphatic system as a final common dementia pathway; mechanistic | Primarily animal models; no blood biomarker quantified | Animal model dominant—human in vivo evidence limited | AQP7 never linked to AD cognitive trajectory in any study |
| Lundberg & Lee 2017 [31] | SHAP unified framework | Exact attributions; efficiency, symmetry, dummy axioms guaranteed | Computationally expensive for large ensemble models | Model-specific SHAP variants may give different results | First application to continuous longitudinal MMSE regression in AD |
| Heo et al. 2024 [32] | Plasma proteomics (Knight-ADRC + Stanford ADRC; n = 3366) | Large multi-cohort sample; 257 replicated AD-associated plasma proteins; ML model AUC = 0.843; proteomic signature predicts faster CDR-SB progression (p = 4.7 × 10⁻⁵) | Plasma proteomics only—no blood transcriptomic or mRNA data; no SHAP or XAI attribution; no continuous longitudinal MMSE-change prediction; no cell-type deconvolution | ADRC cohorts predominantly white North American; AUC metric does not quantify individual-level prediction error | No blood RNA model; no per-probe SHAP attribution; no continuous 12-month MMSE-change prediction; no cross-platform replication |
| Yamakawa et al. 2025 [33] | Ribosomal changes in AD | Ribosome dysfunction precedes immune and cell cycle AD changes | Mechanistic only; no clinical blood biomarker developed | Animal and cell model bias—human longitudinal data absent | RPS5 not quantified in blood longitudinally in any cohort |
| Meng et al. 2024 [34] | Graph network AD progression | Interpretable population graph for rapid AD progression (UK Biobank) | No blood transcriptomic features; no gene-level attribution | Population level not applicable to individual biomarkers | No individual blood gene biomarker; no feature-level SHAP |
| Teunissen et al. 2022 [35] | Blood biomarkers Lancet | Clinical implementation roadmap; regulatory guidance; multi-platform | Protein biomarkers only; no RNA-level information included | Protein-centric—ignores transcriptomic regulatory signals | No blood transcriptomic longitudinal predictor discussed |
| Characteristic | CN (n = 35) | MCI (n = 32) | AD (n = 29) | Overall (n = 96) |
|---|---|---|---|---|
| Age, years | 74.2 ± 6.1 | 72.8 ± 7.3 | 74.6 ± 8.2 | 73.8 ± 7.2 |
| Female sex, n (%) | 18 (51.4) | 15 (46.9) | 13 (44.8) | 46 (47.9) |
| Education, years | 16.1 ± 2.8 | 15.9 ± 2.6 | 15.2 ± 3.1 | 15.7 ± 2.8 |
| APOE4 carrier, n (%) | 9 (25.7) | 16 (50.0) | 19 (65.5) | 44 (45.8) |
| Baseline MMSE | 29.1 ± 1.0 | 27.3 ± 1.8 | 22.6 ± 3.4 | 26.6 ± 3.5 |
| Baseline CDRSB | 0.03 ± 0.12 | 1.46 ± 0.89 | 4.38 ± 2.41 | 1.87 ± 2.28 |
| 12-month MMSE change | −0.23 ± 1.12 | −0.56 ± 1.89 | −1.04 ± 3.21 | −0.56 ± 2.10 |
| Participants with decline (ΔMMSE < 0), n (%) | 12 (34.3) | 16 (50.0) | 17 (58.6) | 45 (46.9) |
| Participants with stable/improved (ΔMMSE ≥ 0), n (%) | 23 (65.7) | 16 (50.0) | 12 (41.4) | 51 (53.1) |
| Probe ID | Gene | Biological Function | EN Coef. | SHAP Rank | Role | Module |
|---|---|---|---|---|---|---|
| 11762936_x_at | AQP7 | Glycerol/water channel; glymphatic and metabolic regulation | −0.598 | 1st (approx. 0.47) | Harmful | Metabolic |
| 200024_PM_at | RPS5 | 40S ribosomal protein S5; translation and tau mRNA interaction | −0.447 | 3rd (approx. 0.35) | Harmful | Ribosomal |
| 11764118_at | Unchar. | Transcribed locus chr12q15; putative lncRNA (no HGNC symbol) | −0.462 | 2nd (approx. 0.33) | Harmful | Non-coding |
| 11757278_x_at | ASS1 | Arginosuccinate synthase 1; urea cycle and nitric oxide synthesis | −0.328 | 5th (approx. 0.25) | Harmful | Metabolic |
| 11762358_at | CHD2 | Chromodomain helicase DNA binding protein 2; chromatin remodelling | −0.293 | 6th (approx. 0.22) | Harmful | Epigenetic |
| 11763188_a_at | SNX5 | Sorting nexin 5; retromer APP/BACE1 endosomal recycling | +0.441 | 4th (approx. 0.36) | Protective | Retromer |
| Model | MAE (Mean ± SD) [95% CI Bootstrap] | RMSE|nRMSE (Mean ± SD) [95% CI] | R2 (Mean ± SD) [95% CI Bootstrap] |
|---|---|---|---|
| Full Elastic Net (all 49,410 probes) | 1.623 ± 0.366 | 2.113 ± 0.476|nRMSE = 0.176 | 0.098 ± 0.185 |
| Six-probe Elastic Net (PyImpetus selected) | 1.381 ± 0.296 (5-fold) LOOCV: 1.388 [95% CI: 0.981–1.555] | 2.003 ± 0.470|nRMSE = 0.167 | 0.133 ± 0.255 (5-fold) LOOCV: 0.247 [95% CI: 0.089–0.405] |
| Six-probe + seven clinical covariates | 1.417 ± 0.287 | 2.012 ± 0.476|nRMSE = 0.168 | 0.133 ± 0.219 |
| Diagnostic Group | n | MAE (Mean ± SD) | RMSE (Mean ± SD) | Clinical Interpretation |
|---|---|---|---|---|
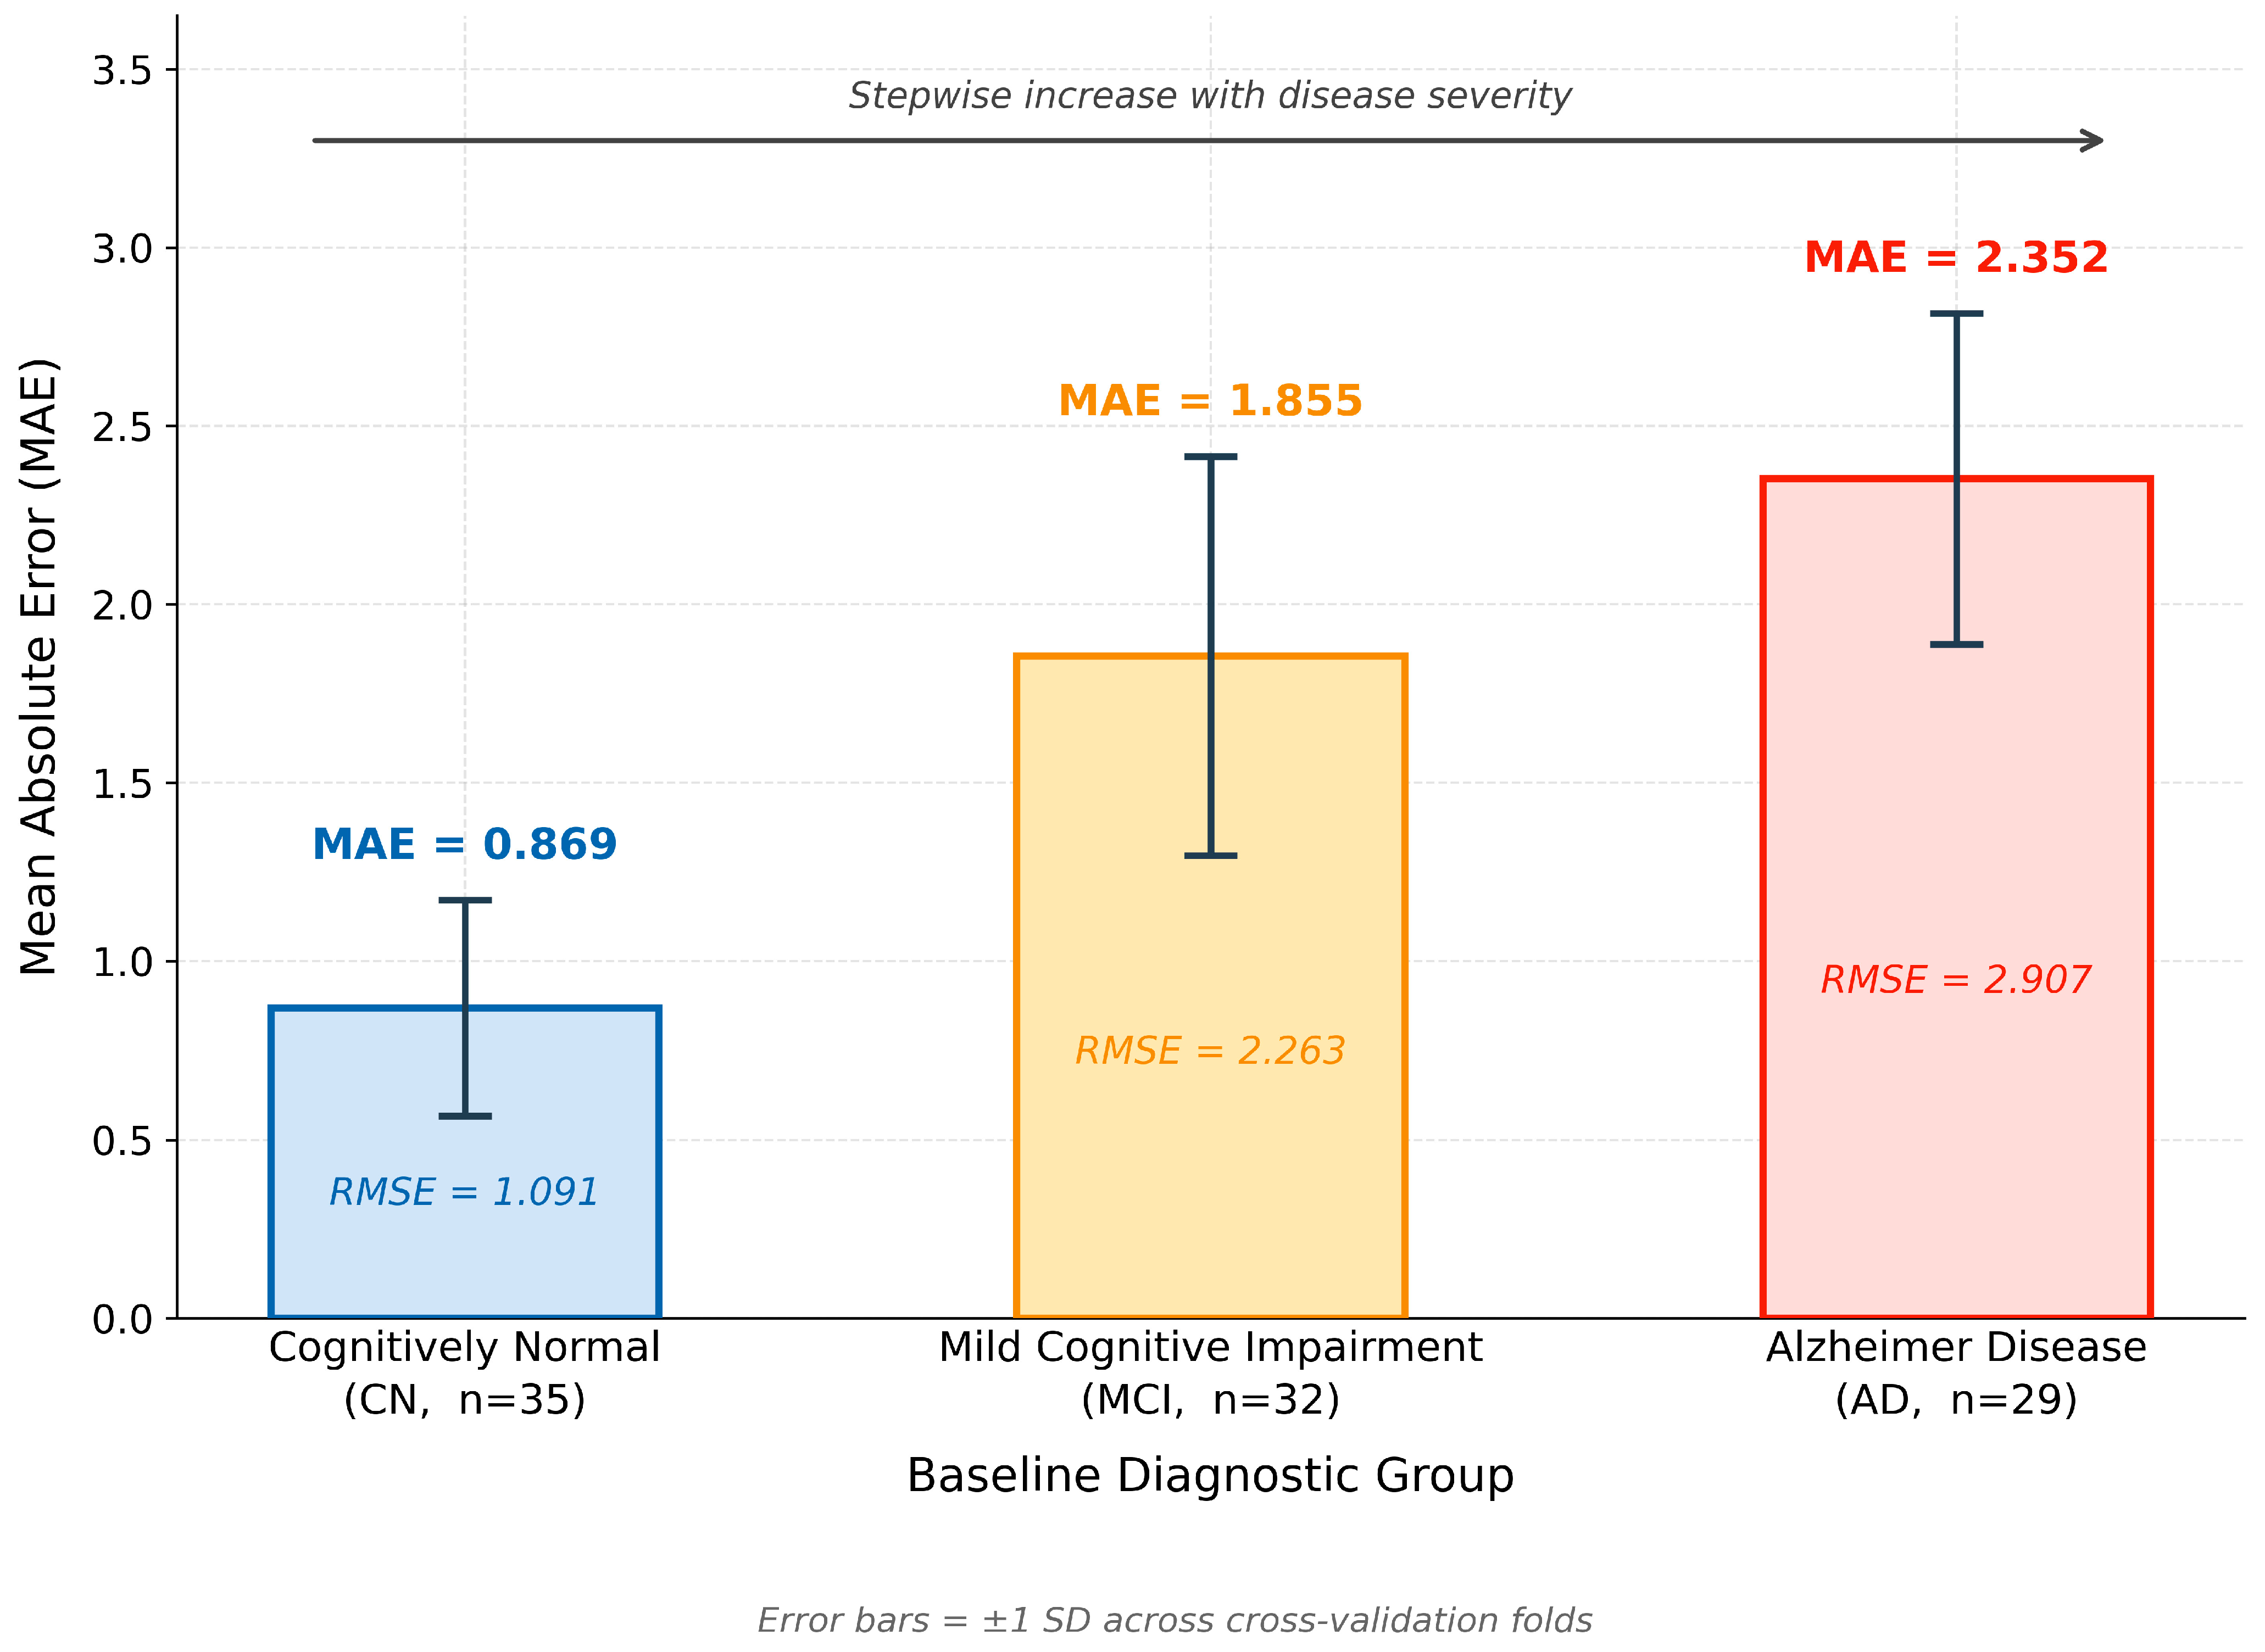
| Cognitively Normal (CN) | 35 | 0.869 ± 0.302 | 1.091 ± 0.389 | Best accuracy; lowest outcome variance; most relevant for early intervention |
| Mild Cognitive Impairment (MCI) | 32 | 1.855 ± 0.559 | 2.263 ± 0.623 | Moderate accuracy; high trajectory heterogeneity; primary clinical target group |
| Alzheimer’s Disease (AD) | 29 | 2.352 ± 0.464 | 2.907 ± 0.665 | Reduced accuracy; highest biological heterogeneity of cognitive trajectories |
| Model | MAE | R2 | Interpretation |
|---|---|---|---|
| A: Six probes only (baseline) | 1.271 | 0.385 | Discovery baseline; transcriptomic signal only |
| B: Cell-type scores only (MCP-counter) | 1.503 | 0.124 | Substantially weaker—composition does not equal transcription |
| C: Six probes + cell types (joint model) | 1.232 | 0.437 | Marginal gain; all six probes retained with unchanged directional coefficients |
| Gene | ADNI-GO Coef. | Expected Direction | ANM Spearman r | p-Value | Interpretation |
|---|---|---|---|---|---|
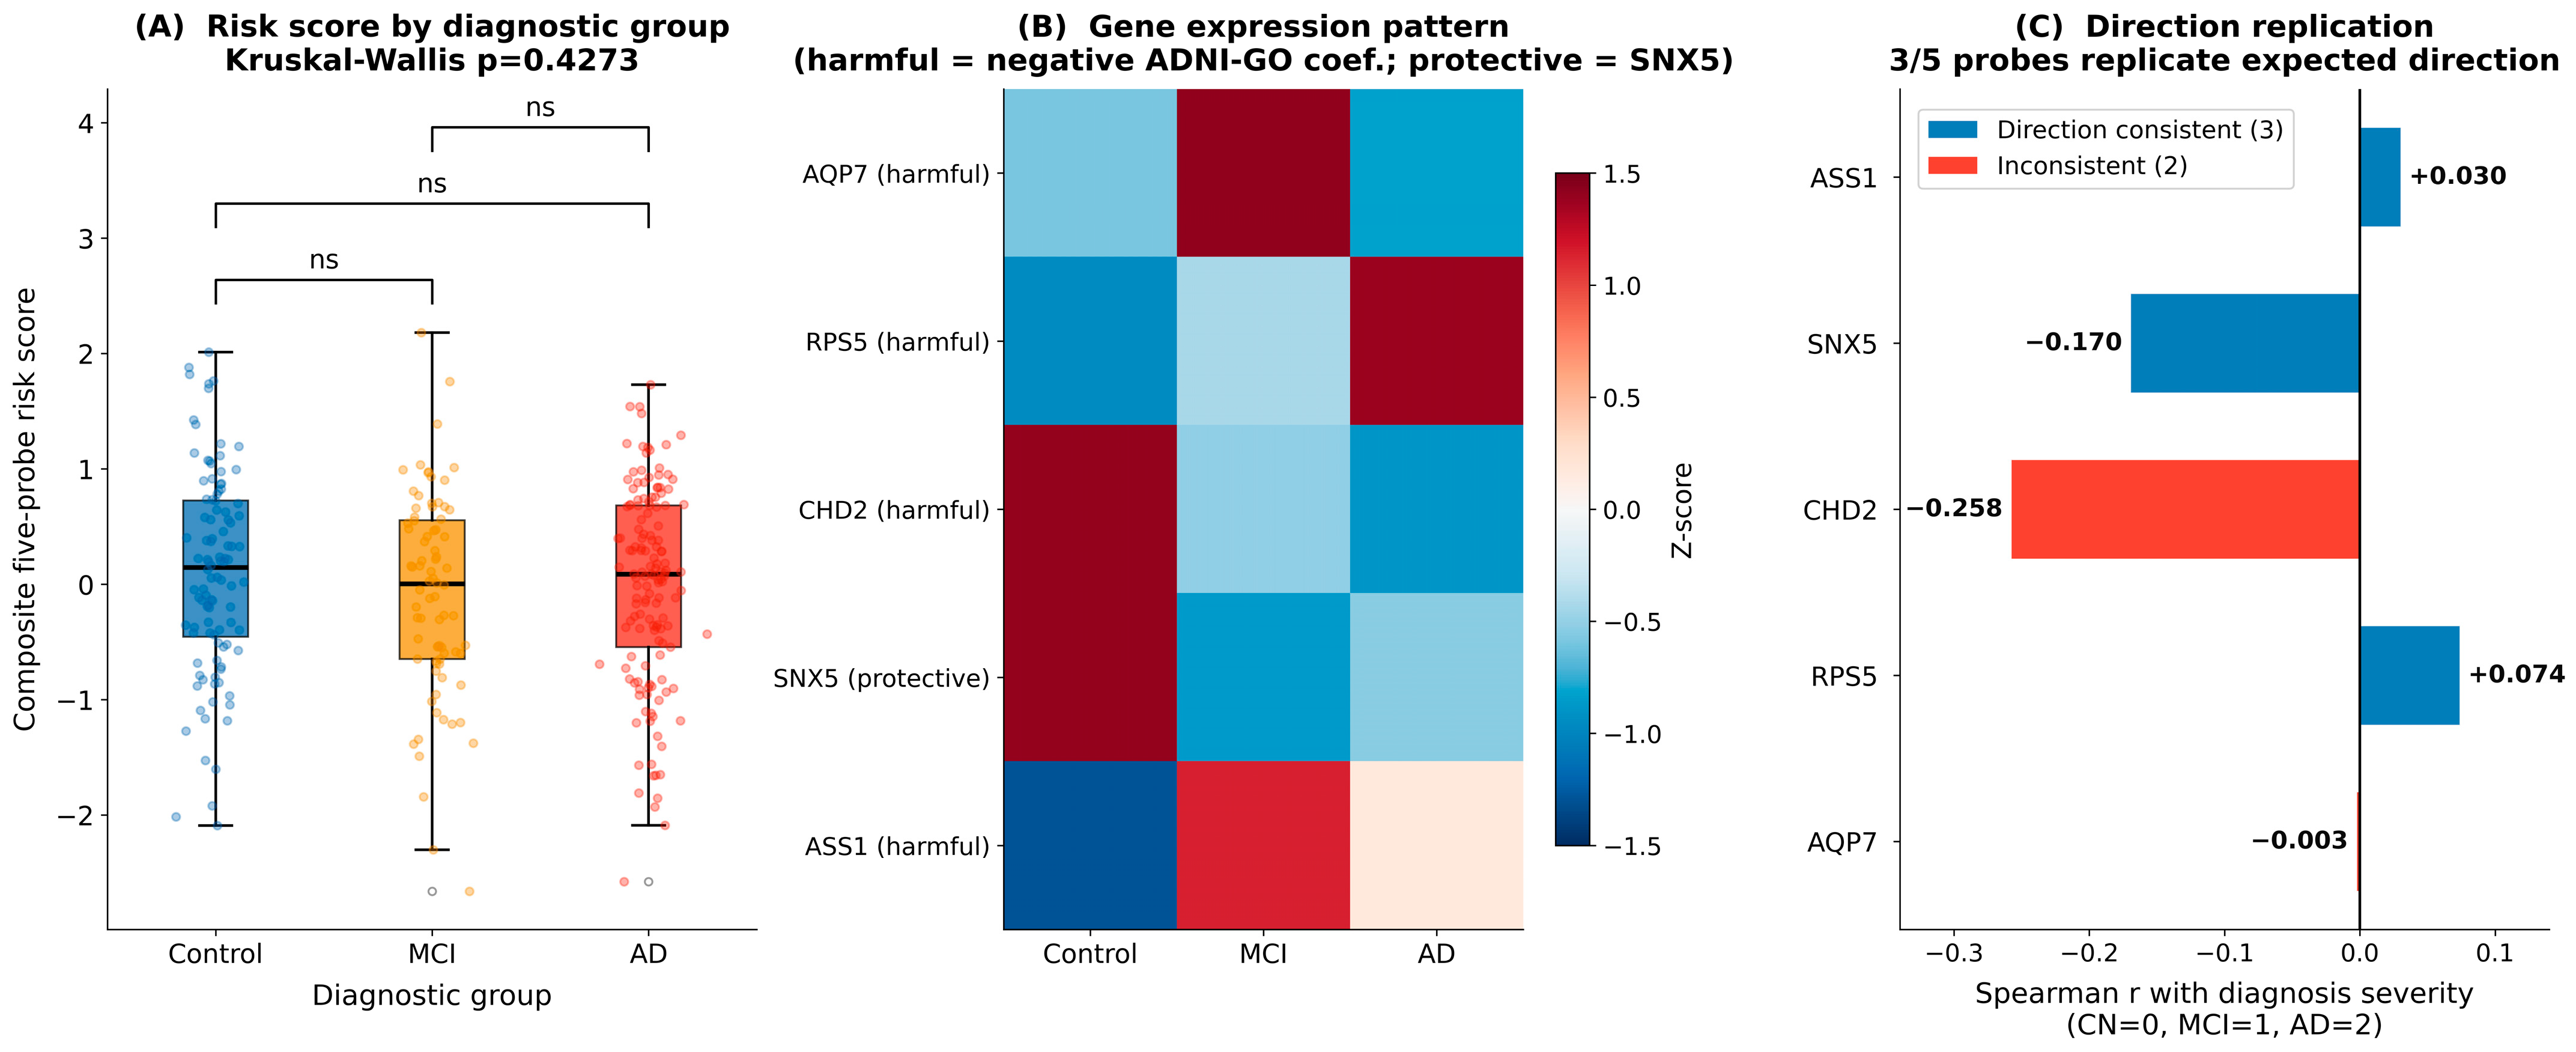
| AQP7 | −0.598 | up CN to AD | −0.003 | 0.964 | Longitudinal-specific; flat cross-sectionally-confirms trajectory predictor |
| RPS5 | −0.447 | up CN to AD | +0.074 | 0.181 | Trend in correct direction; not significant cross-sectionally |
| ASS1 | −0.328 | up CN to AD | +0.030 | 0.583 | No cross-sectional association detected in AddNeuroMed |
| CHD2 | −0.293 | up CN to AD | −0.258 | <0.001 | Significant but reversed-state vs. trajectory distinction (see Discussion) |
| SNX5 | +0.441 | down CN to AD | −0.170 | 0.002 | Replicated retromer hypothesis validated cross-platform, cross-continent |
| Gene/Score | Expected vs. AB42 | Observed r | p-Value | Direction | Interpretation |
|---|---|---|---|---|---|
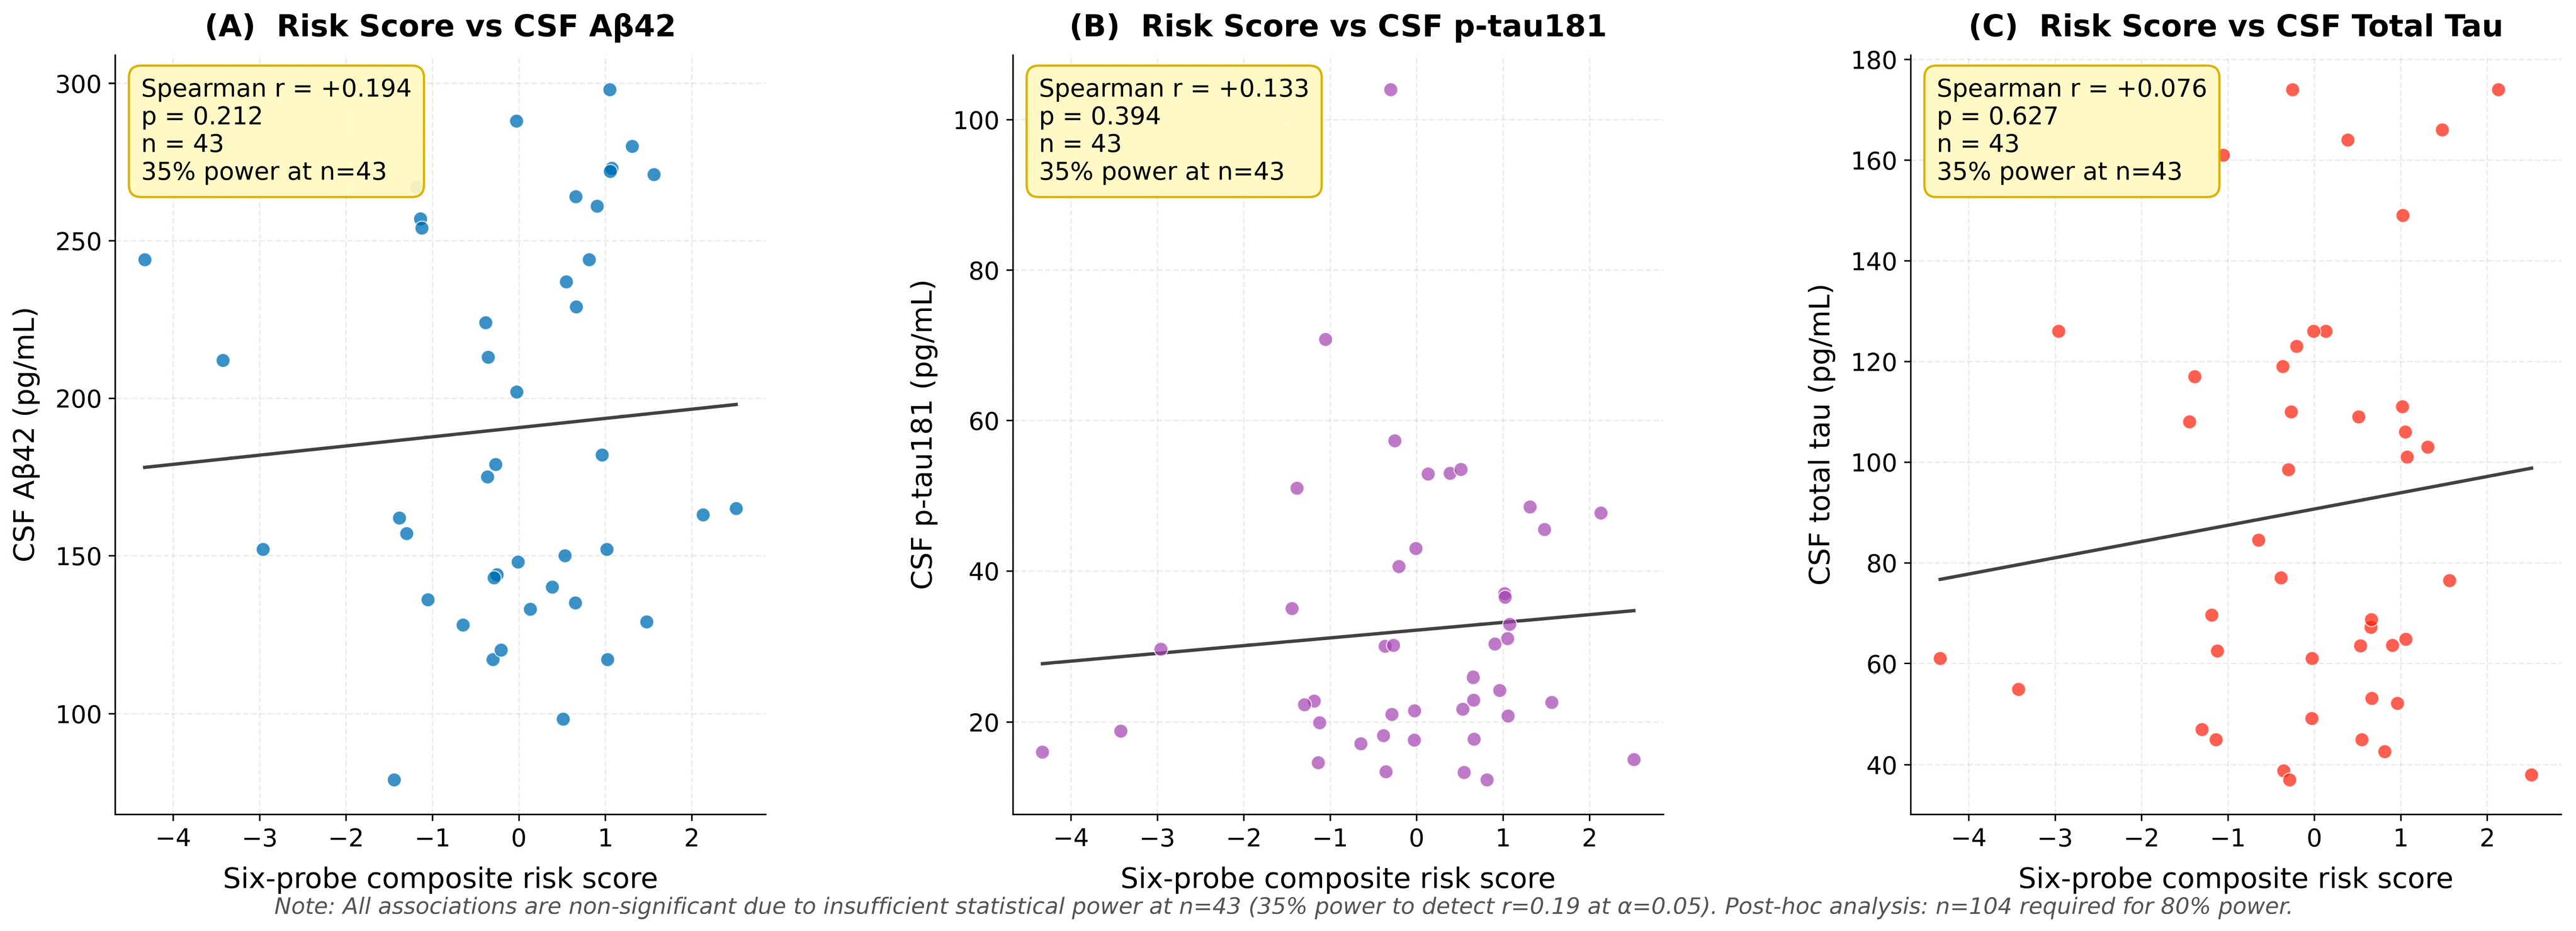
| Risk score (composite) | Negative | +0.194 | 0.211 | No | Underpowered (n = 43; 35% power); n = 104 needed for 80% power |
| AQP7 (harmful) | Negative | −0.186 | 0.232 | Yes | Directional trend consistent with glymphatic–metabolic hypothesis |
| RPS5 (harmful) | Negative | +0.193 | 0.215 | No | No association; underpowered; requires larger CSF sub-cohort |
| ASS1 (harmful) | Negative | +0.059 | 0.705 | No | No association detected; underpowered |
| CHD2 (harmful) | Negative | −0.180 | 0.249 | Yes | Directional trend consistent with chromatin–amyloid interaction |
| SNX5 (protective) | Positive | +0.181 | 0.246 | Yes | Directional trend consistent with retromer–amyloid clearance hypothesis |
| Dataset | n | MAE | R2 | Pearson r | Spearman ρ | Note |
|---|---|---|---|---|---|---|
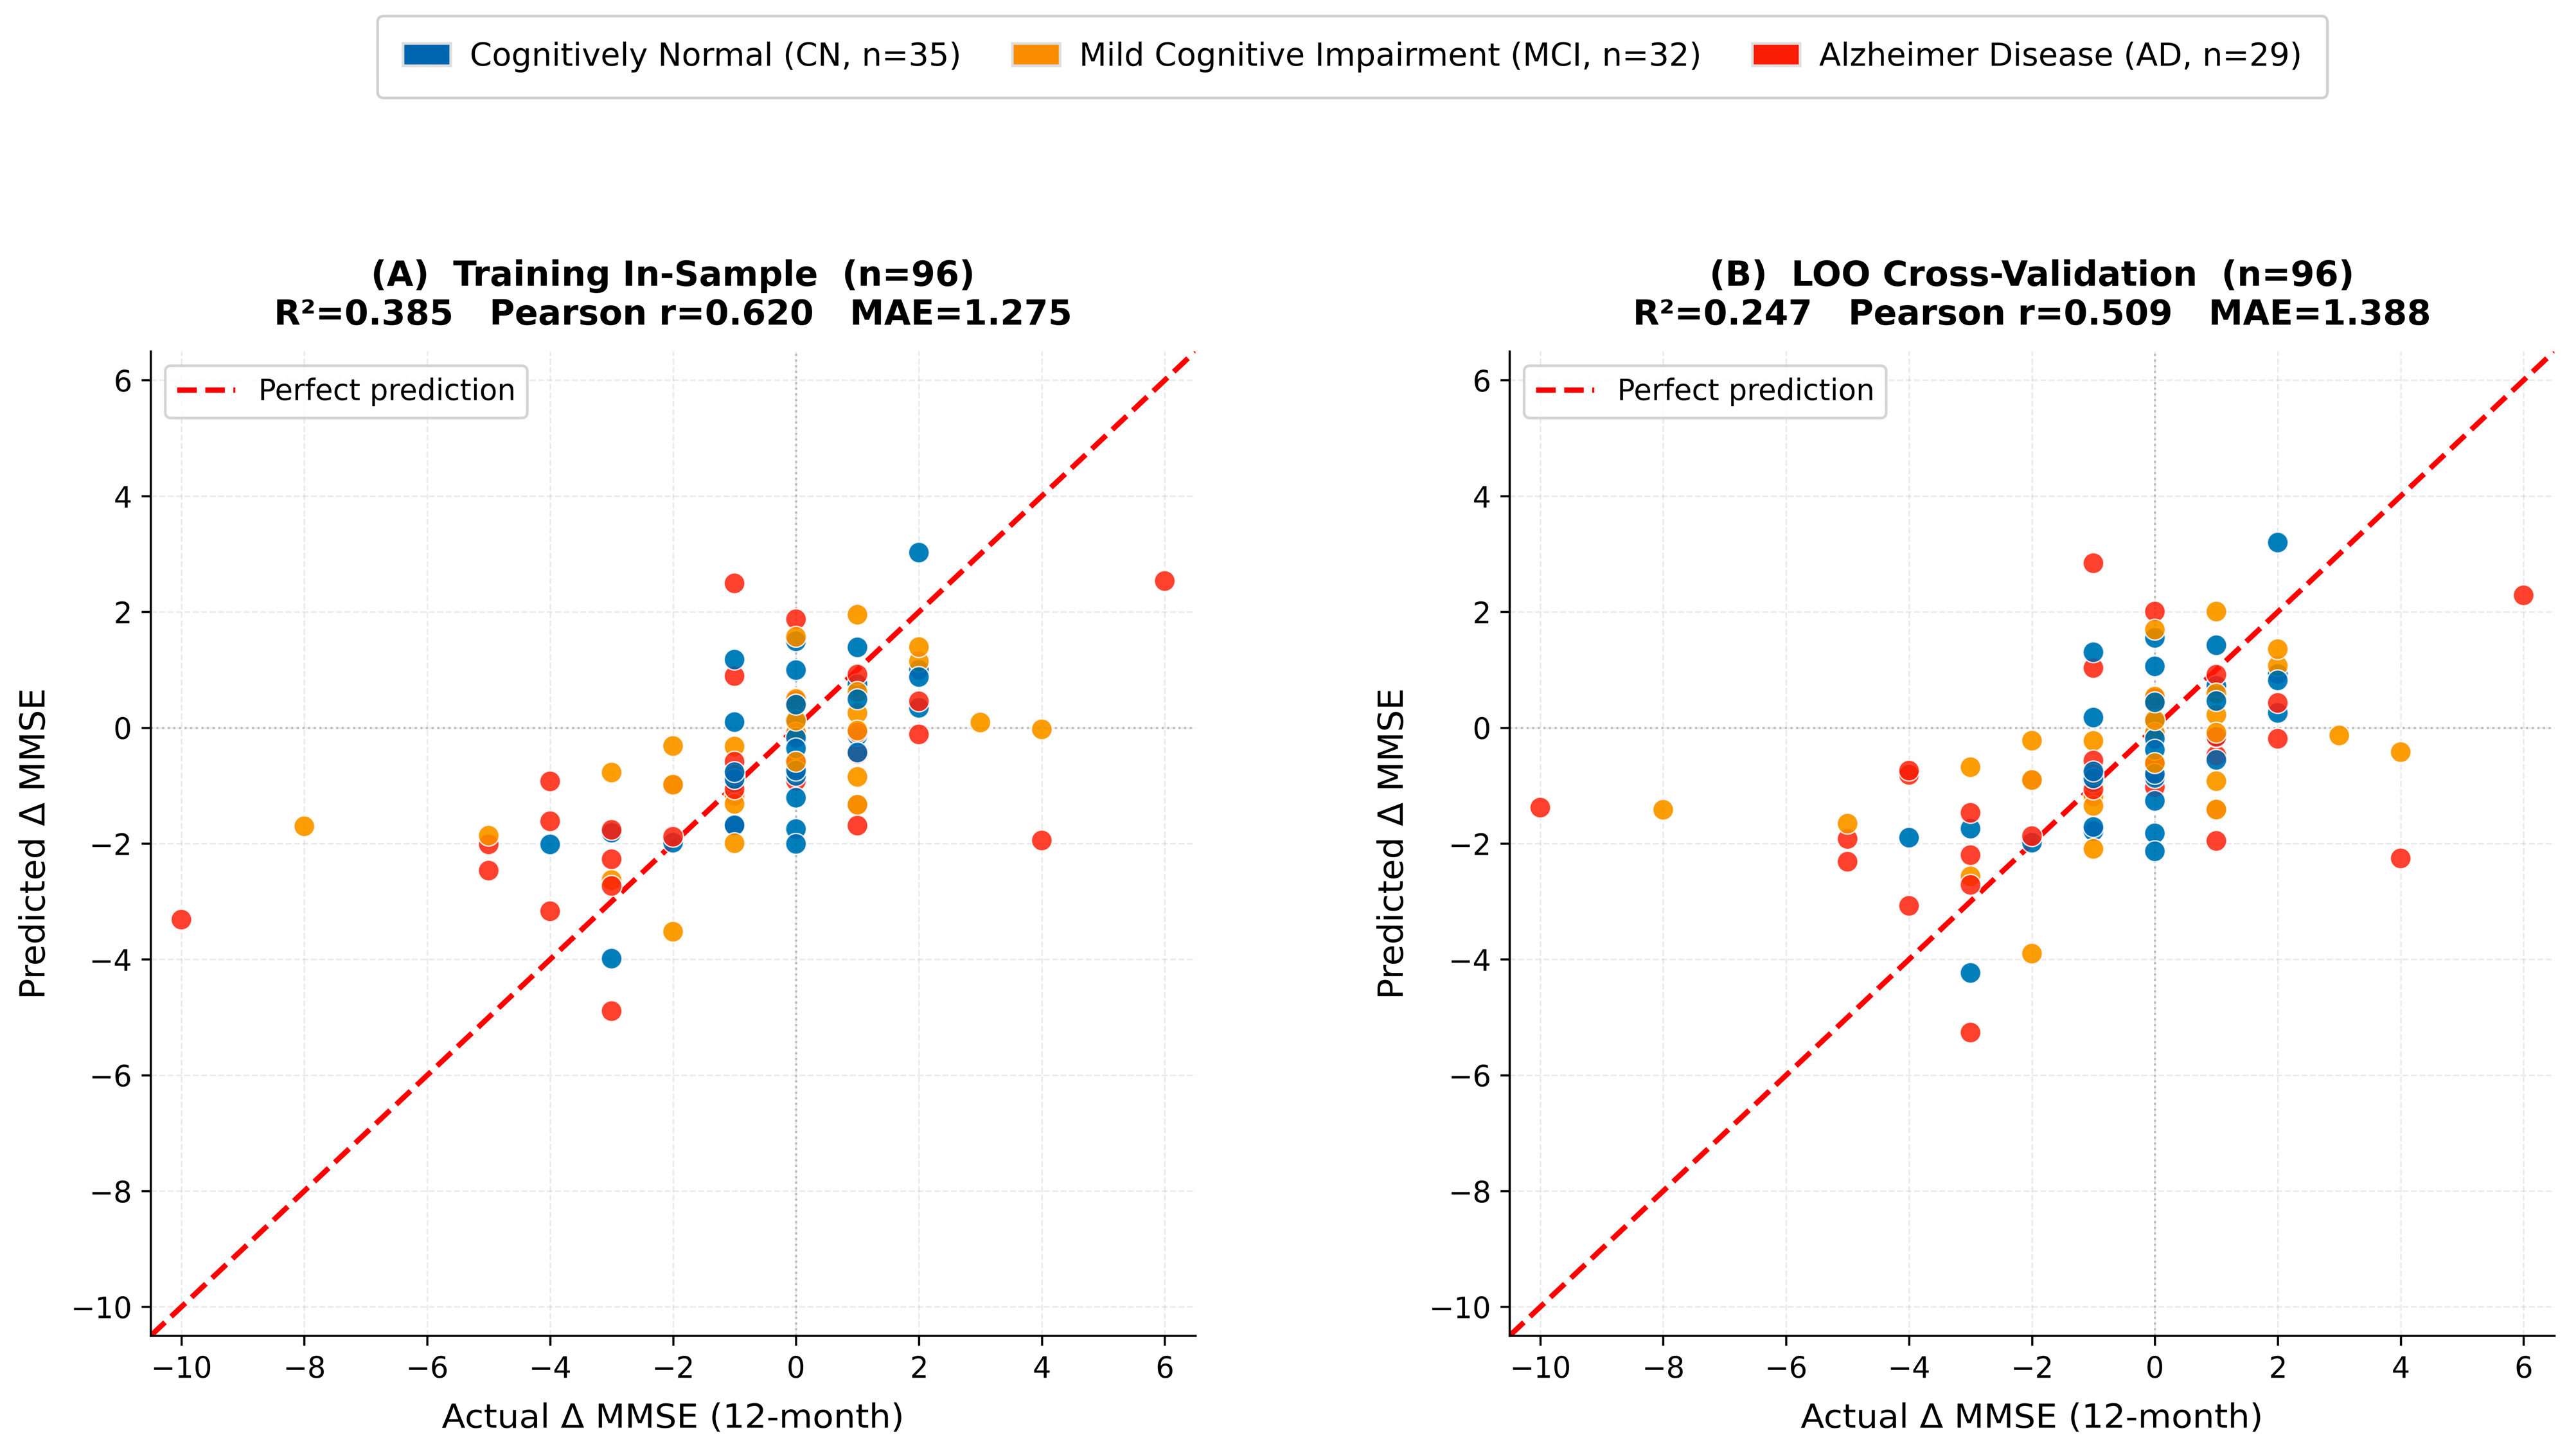
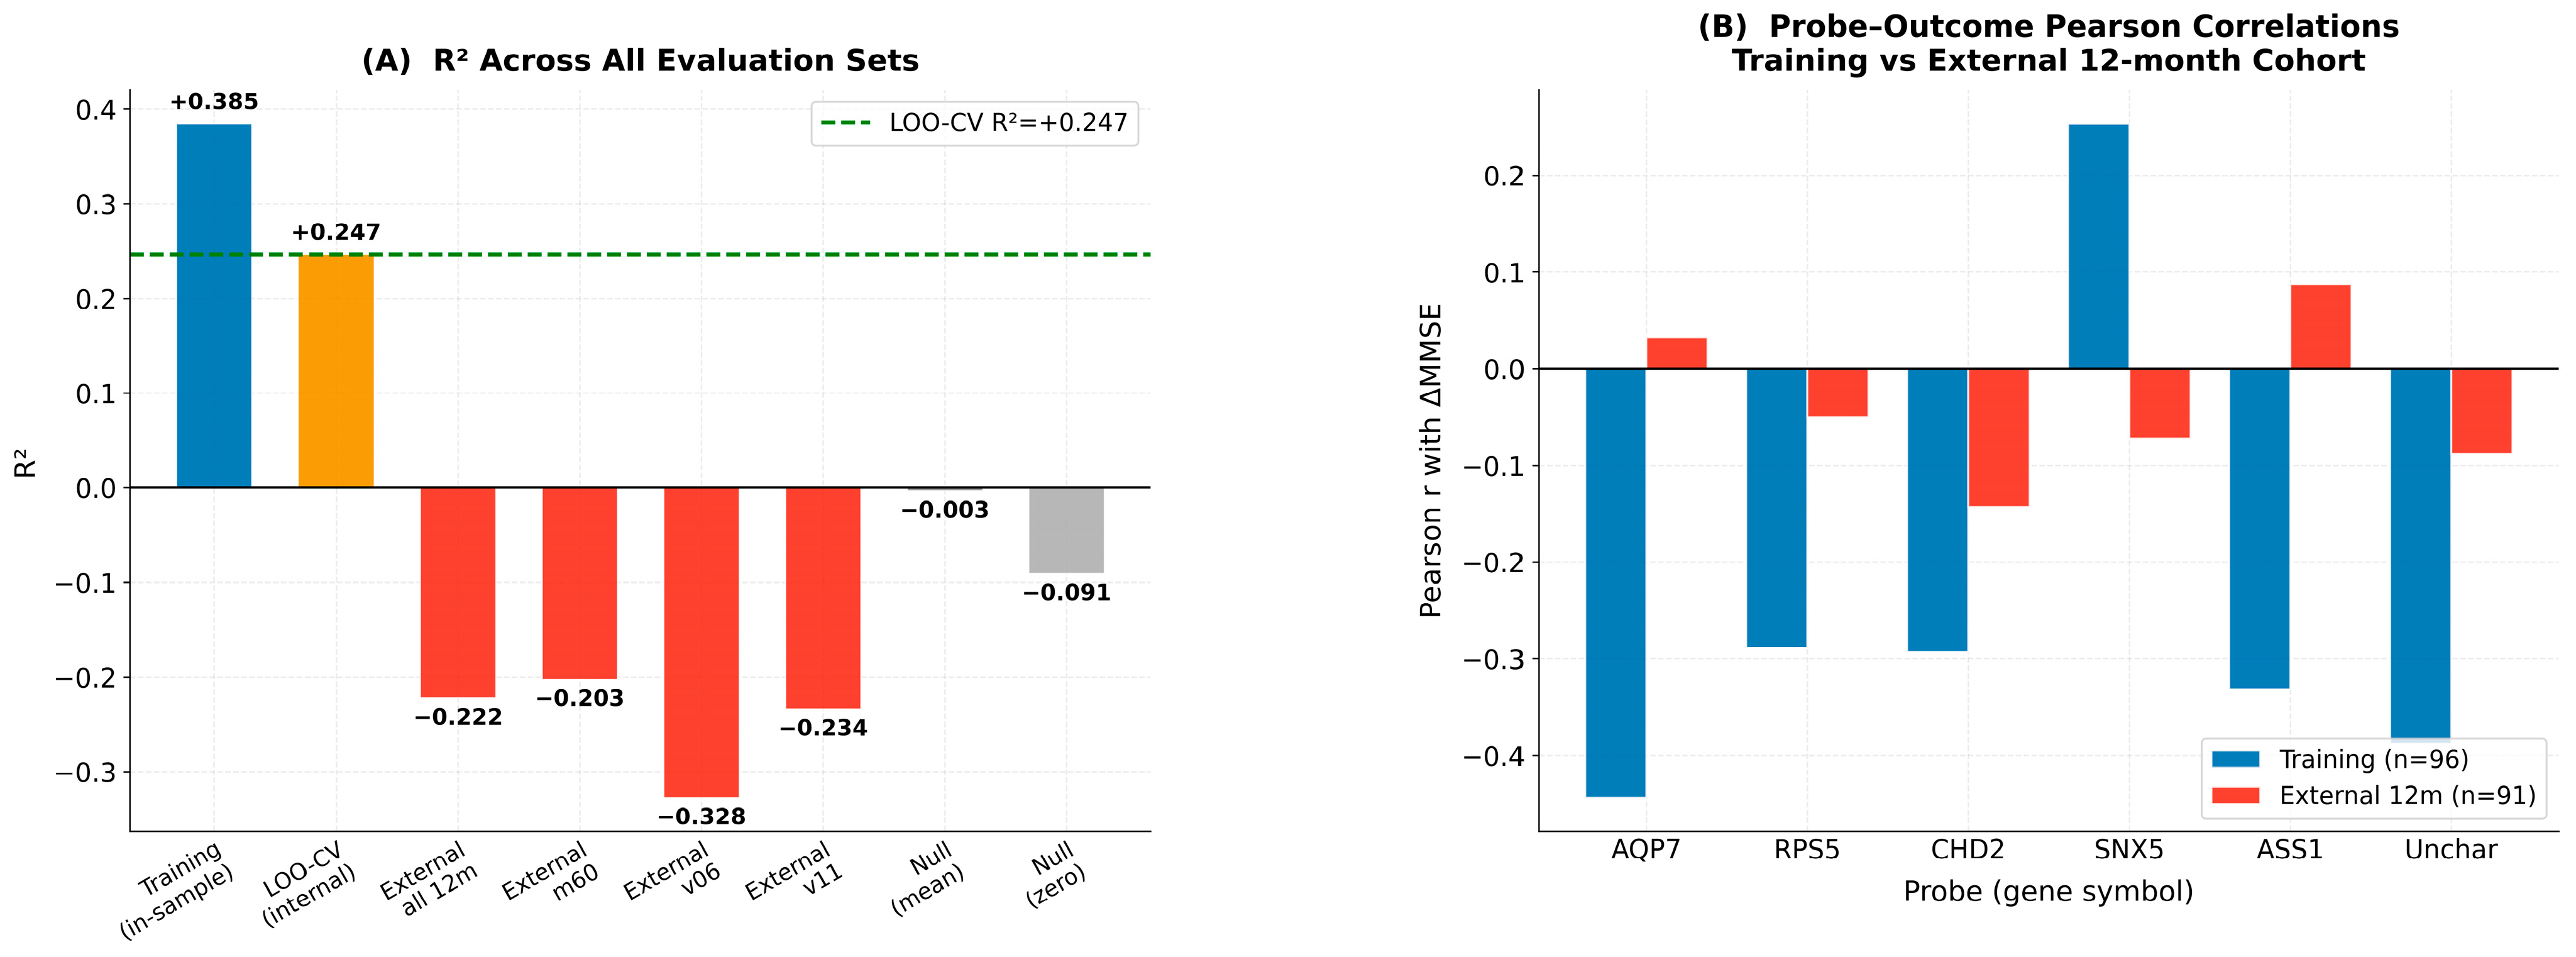
| Training (in-sample) | 96 | 1.275 | +0.385 | +0.620 | +0.654 | In-sample training performance |
| LOO cross-validation | 96 | 1.388 | +0.247 | +0.509 | +0.591 | Primary internal validation metric |
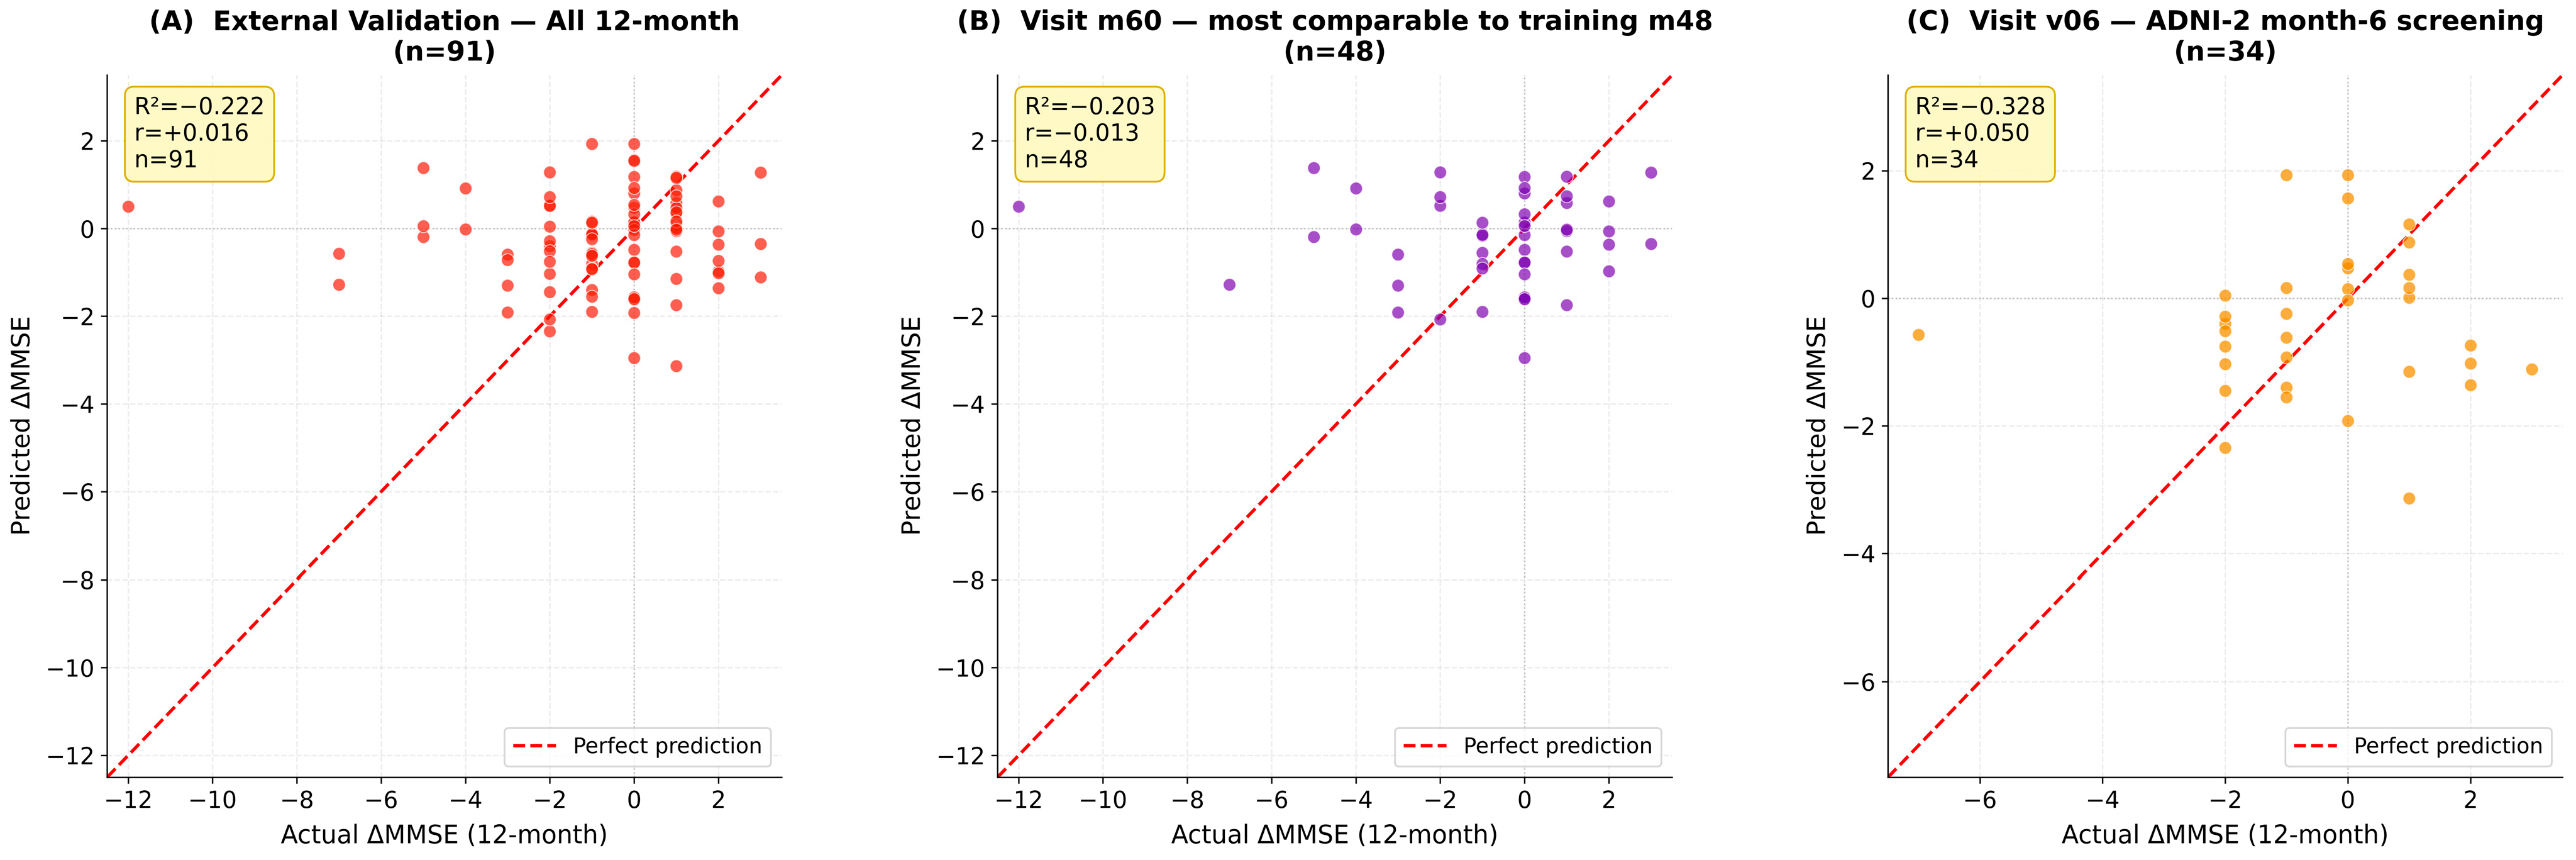
| External—all 12 m | 91 | 1.740 | −0.222 | +0.016 | +0.097 | Primary external validation |
| External—m60 (month 60) | 48 | 1.917 | −0.203 | −0.013 | +0.073 | Most comparable to training m48 |
| External—v06 (month 6) | 34 | 1.515 | −0.328 | +0.050 | +0.110 | ADNI-2 first screening visit |
| External—v11 (month 11) | 9 | 1.643 | −0.234 | +0.368 | +0.434 | n < 10; insufficient for inference |
| Null: predict training mean | 91 | 1.627 | −0.003 | — | — | Constant predictor benchmark |
| Null: predict zero | 91 | 1.571 | −0.091 | — | — | No-change benchmark |
| Feature | Wang et al. 2024 [15] | Chen et al. 2025 [11] | Meng et al. 2024 [34] | This Study |
|---|---|---|---|---|
| What was being predicted? | Whether a participant has AD versus normal cognition (cross-sectional) | AD or MCI diagnosis at a single time point | Which UK Biobank participants would progress rapidly (classification) | How much each participant’s MMSE score would change over the next 12 months (continuous, longitudinal) |
| How features were chosen | SHAP rankings followed by manual curation | Co-expression network modules | Graph neural network learned from population data | PyImpetus Markov Blanket—run four times across two thresholds and two seeds; only probes appearing every time were kept |
| What the model can explain? | Global SHAP importance scores | Module-level associations with phenotypes | Population-level graph patterns | Exact per-probe SHAP contribution for every individual prediction, with dependence plots showing how each gene’s effect varies across its expression range |
| Were blood cell proportions checked? | No | No | No | Yes—MCP-counter scores for seven immune populations tested in three models; all six probes retained after correction |
| Was the signature tested in a second cohort on a different platform? | No | No | No | Yes—five probes mapped by gene symbol into AddNeuroMed (Illumina HumanHT-12, n = 329); SNX5 replicated (p = 0.002) |
| Is there a usable prediction tool? | No | No | No | Yes—Streamlit web app with real-time sliders, risk stratification, and SHAP bar chart; no installation needed |
| How was performance reported? | Classification AUC | Correlation between modules and cognitive/imaging phenotypes | Population-level classification metrics | LOOCV R2 = 0.247, MAE = 1.388; outperforms the full 49,410-probe model by 14.9% in MAE |
| Is the code available? | Partial | No | No | Full pipeline (Steps 1–7), trained model, and prediction app at https://github.com/SAH-ML/pyimpetus-shap-ad, accessed on 1 June 2026. |
Disclaimer/Publisher’s Note: The statements, opinions and data contained in all publications are solely those of the individual author(s) and contributor(s) and not of MDPI and/or the editor(s). MDPI and/or the editor(s) disclaim responsibility for any injury to people or property resulting from any ideas, methods, instructions or products referred to in the content. |
© 2026 by the authors. Licensee MDPI, Basel, Switzerland. This article is an open access article distributed under the terms and conditions of the Creative Commons Attribution (CC BY) license.
Share and Cite
Syed, A.H.; Alhayyani, S. An Exploratory Six-Probe Blood RNA Signature for Predicting 12-Month Cognitive Decline Along the Alzheimer’s Disease Continuum: An Interpretable Machine Learning Study. Diagnostics 2026, 16, 2078. https://doi.org/10.3390/diagnostics16132078
Syed AH, Alhayyani S. An Exploratory Six-Probe Blood RNA Signature for Predicting 12-Month Cognitive Decline Along the Alzheimer’s Disease Continuum: An Interpretable Machine Learning Study. Diagnostics. 2026; 16(13):2078. https://doi.org/10.3390/diagnostics16132078
Chicago/Turabian StyleSyed, Asif Hassan, and Sultan Alhayyani. 2026. "An Exploratory Six-Probe Blood RNA Signature for Predicting 12-Month Cognitive Decline Along the Alzheimer’s Disease Continuum: An Interpretable Machine Learning Study" Diagnostics 16, no. 13: 2078. https://doi.org/10.3390/diagnostics16132078
APA StyleSyed, A. H., & Alhayyani, S. (2026). An Exploratory Six-Probe Blood RNA Signature for Predicting 12-Month Cognitive Decline Along the Alzheimer’s Disease Continuum: An Interpretable Machine Learning Study. Diagnostics, 16(13), 2078. https://doi.org/10.3390/diagnostics16132078