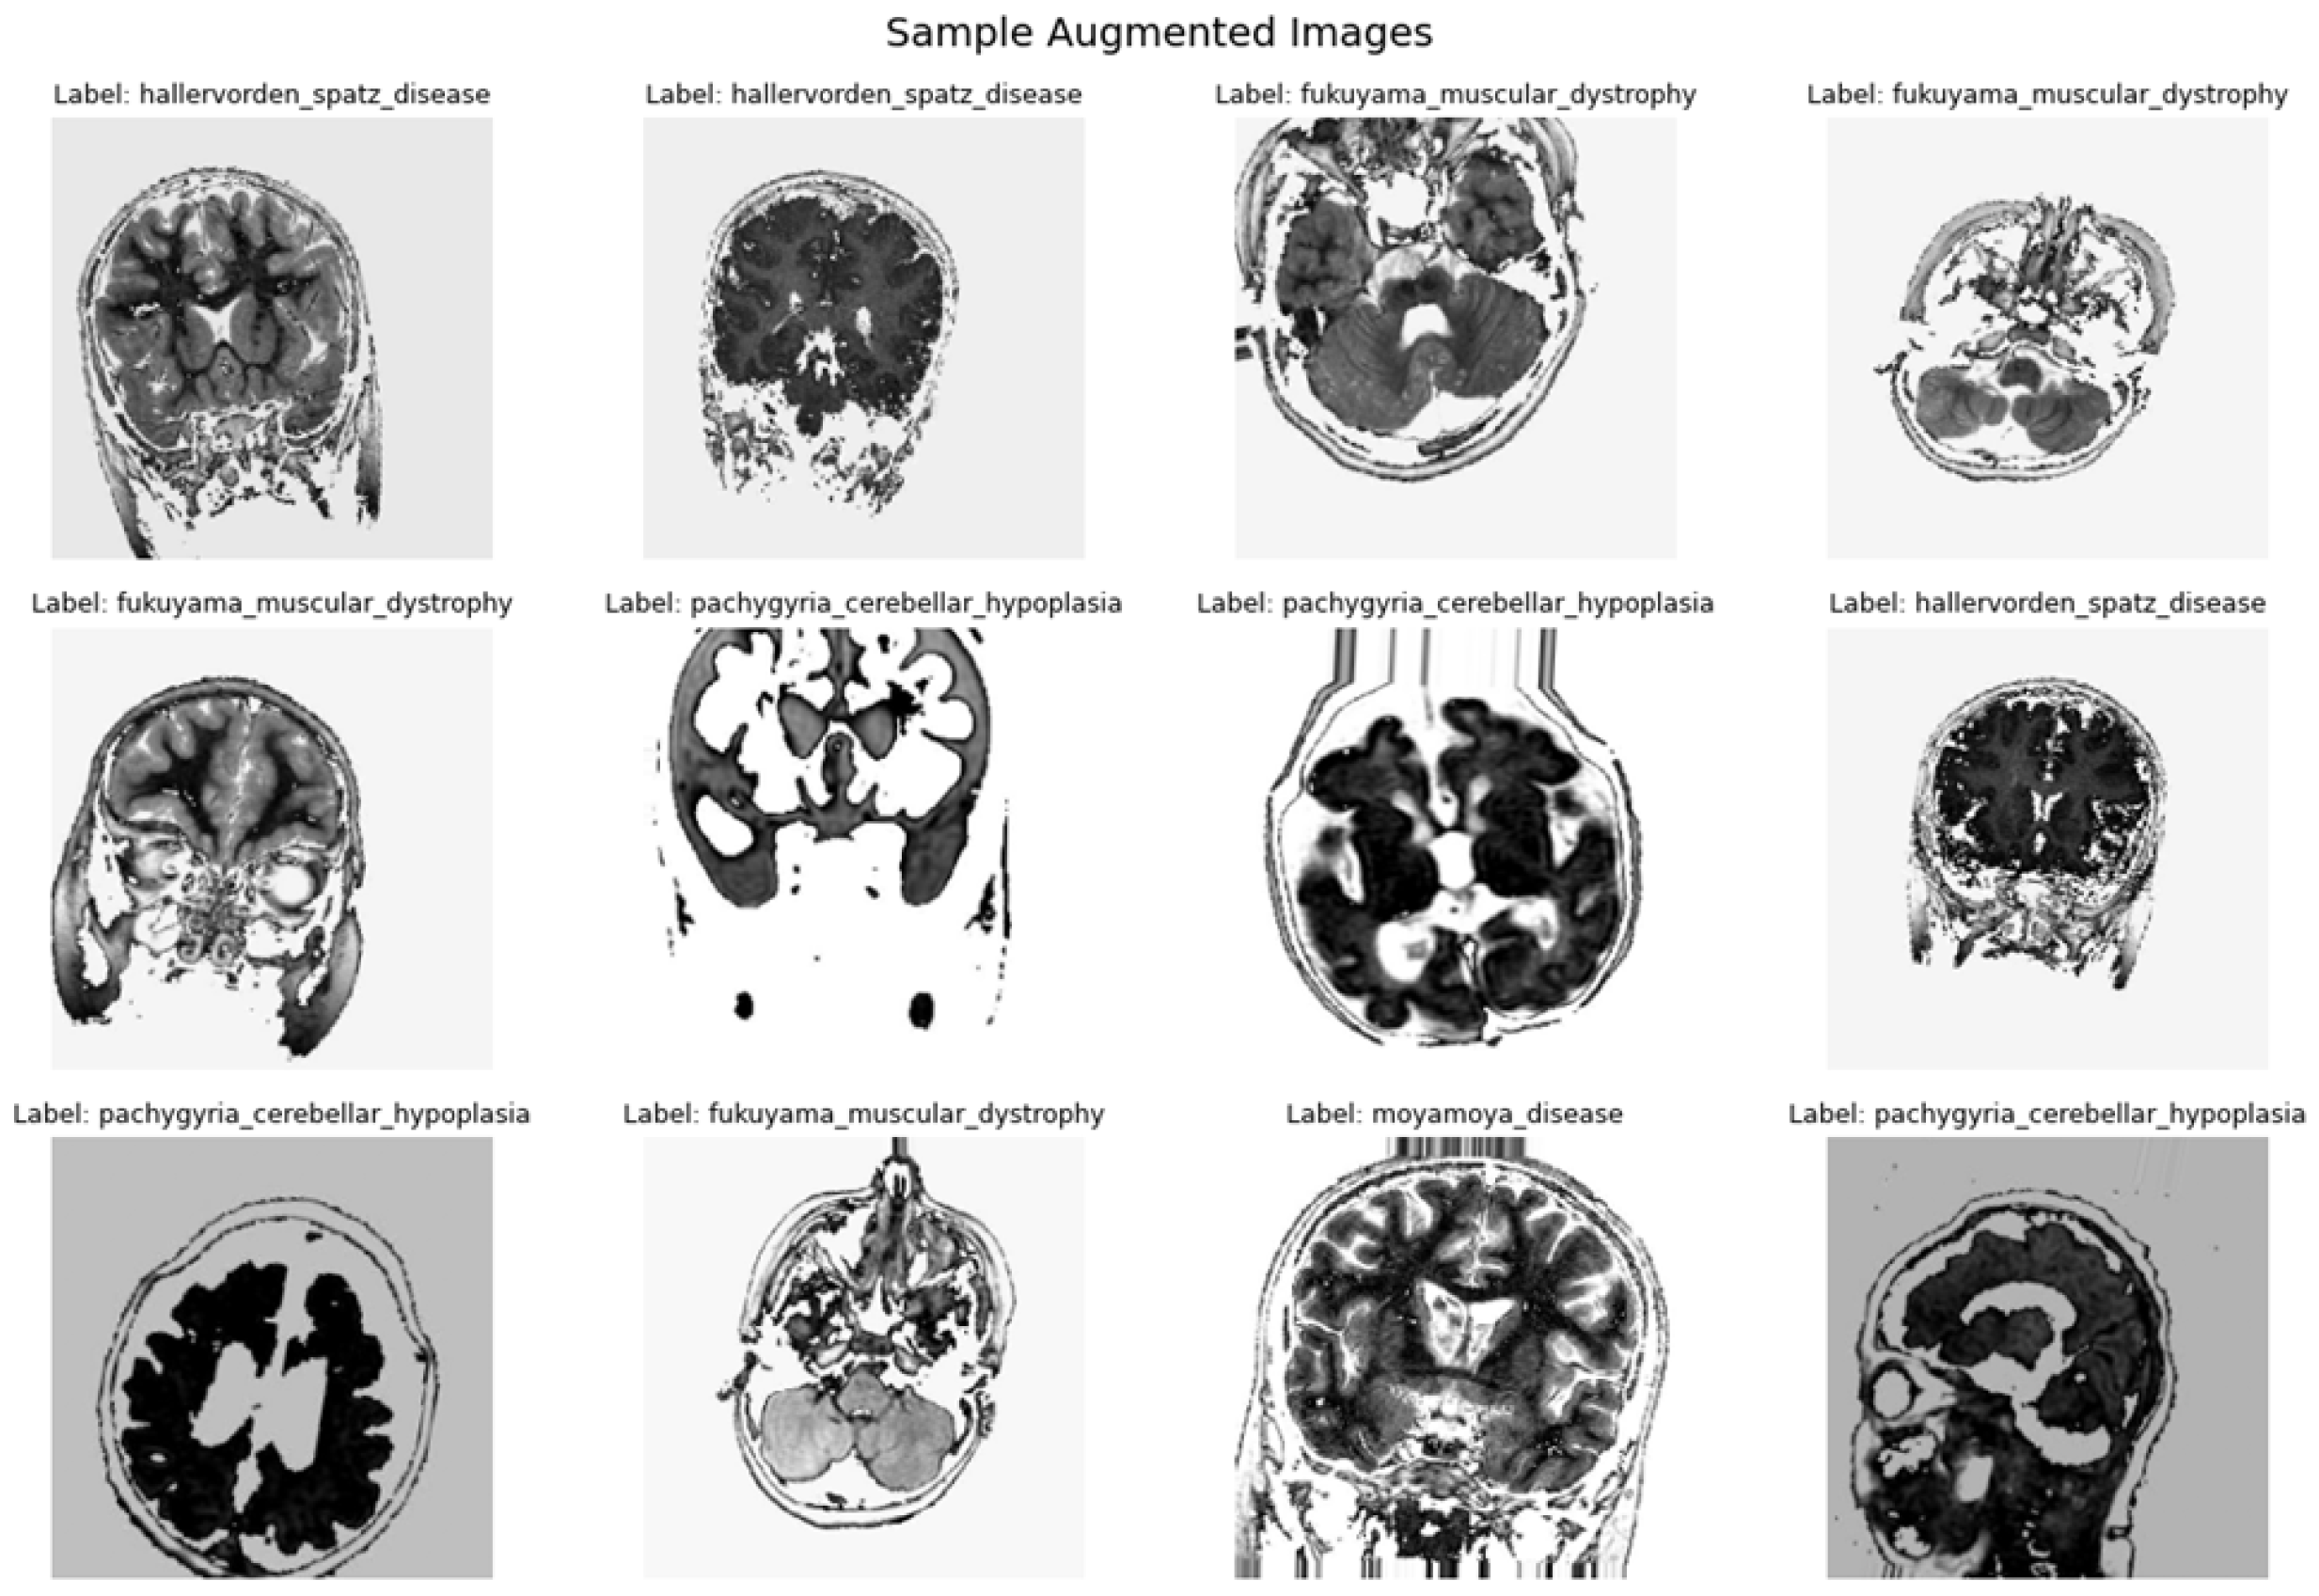
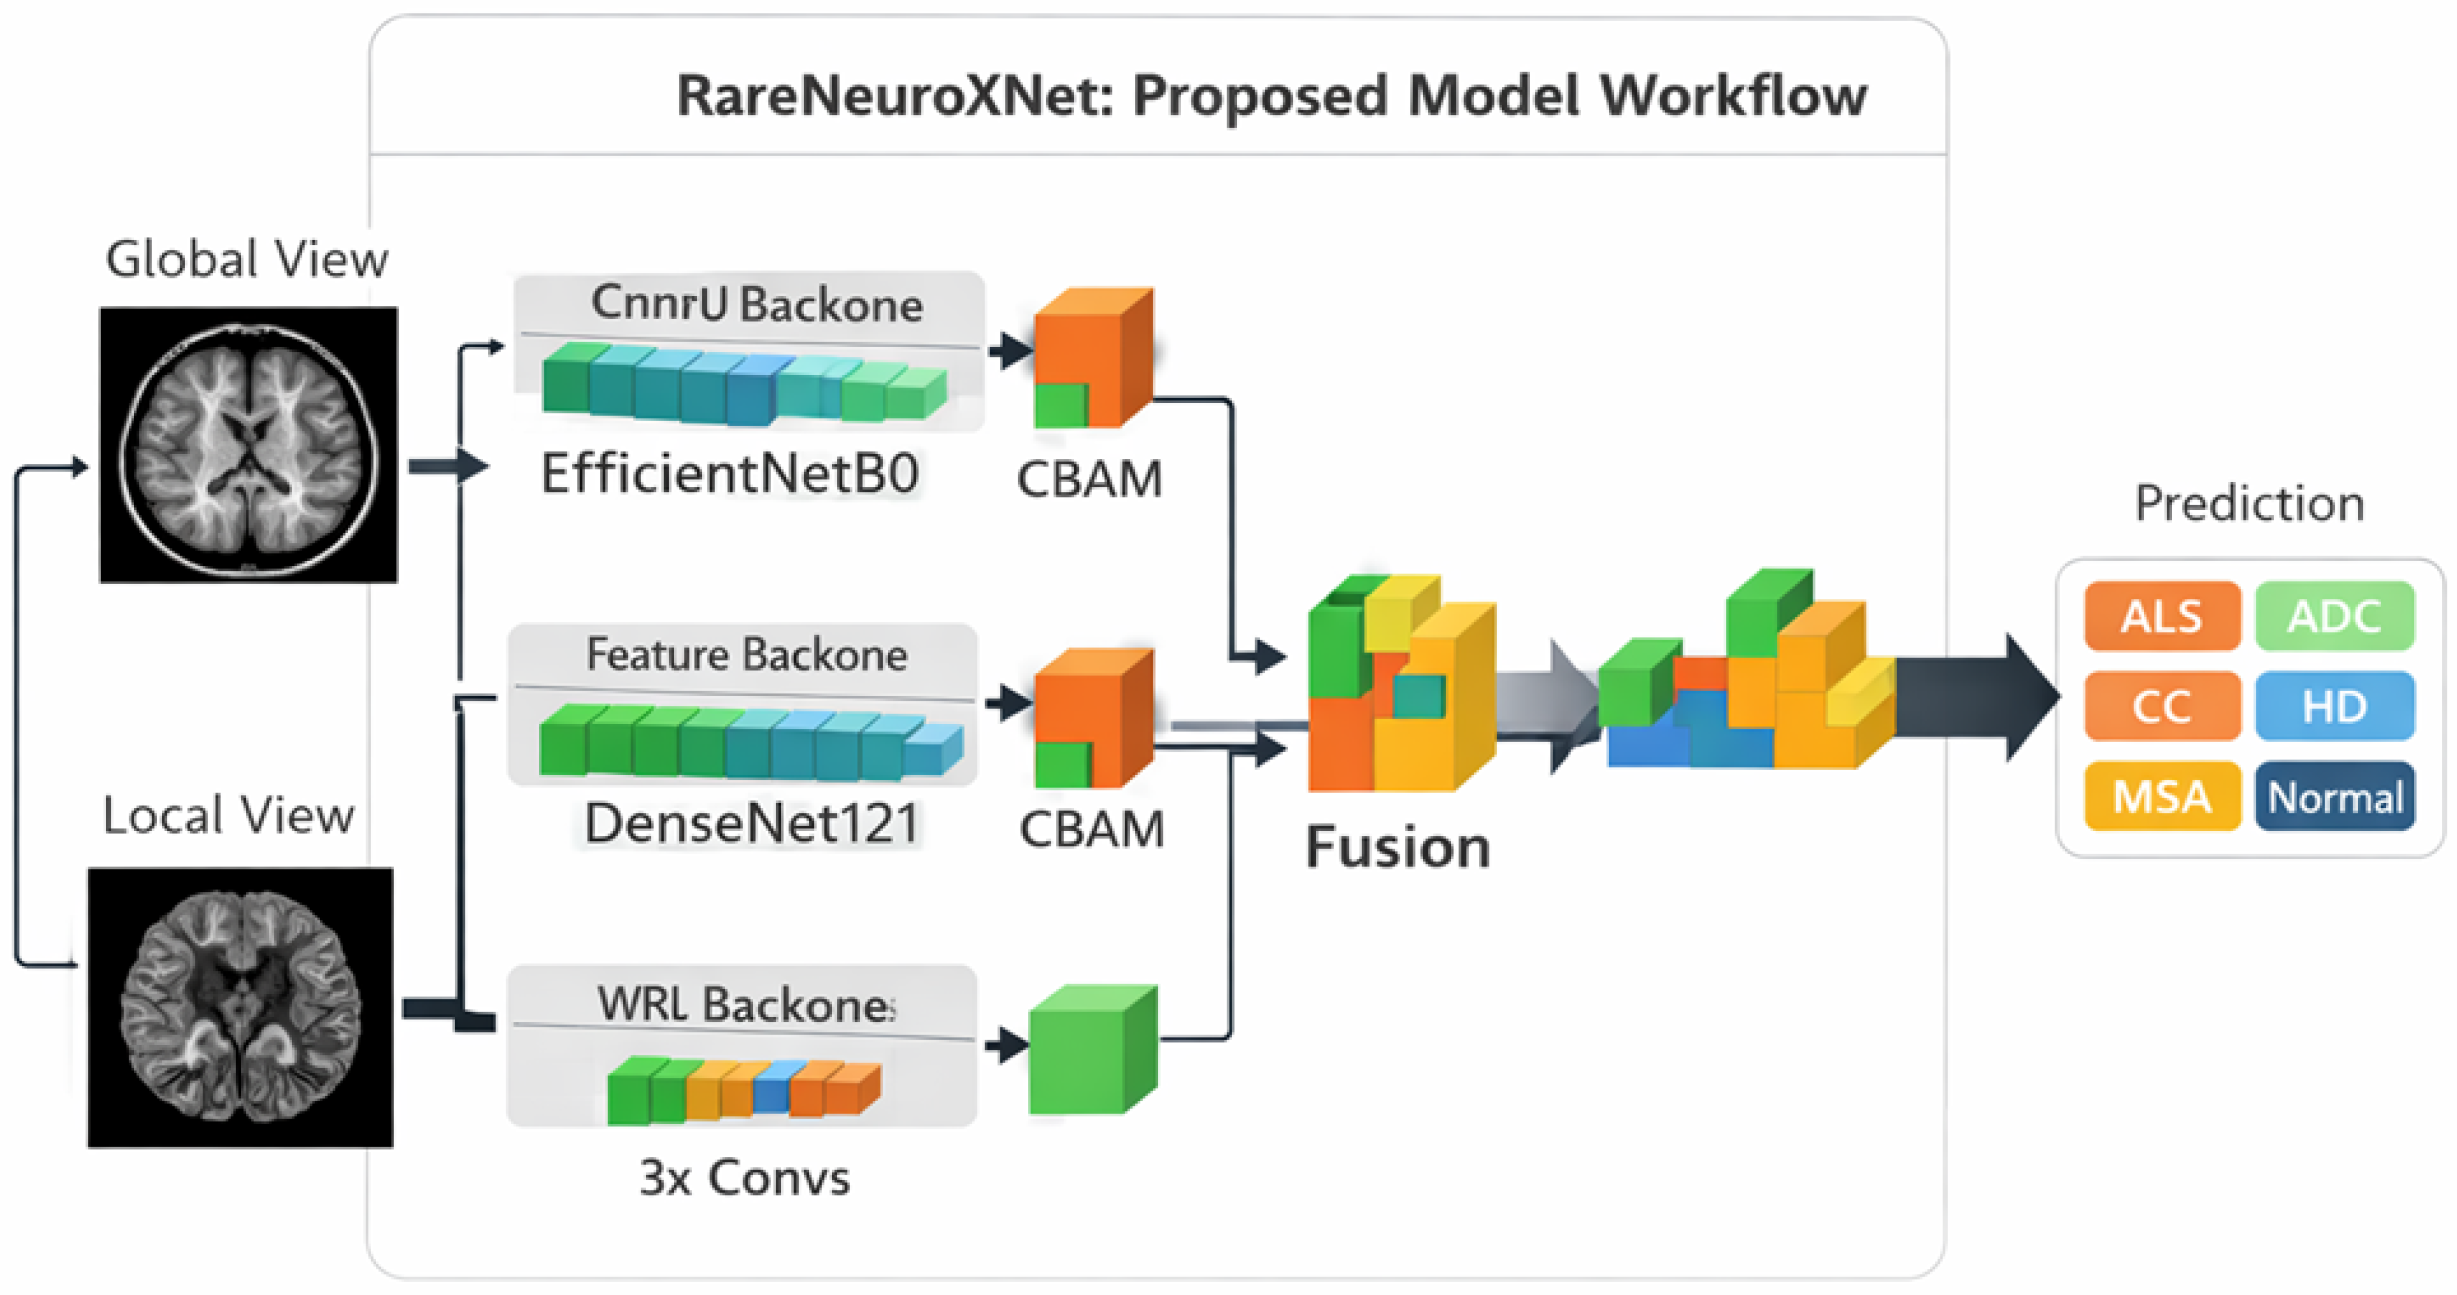
The results are shown in five parts. First, internal cross-validation metrics of classification, discrimination, and calibration are provided for RareNeuroXNet. Secondly, visualization is provided for fold-wise behavior using training curves, confusion matrix, ROC curves, PR curves, reliability diagrams, and confidence histograms. Third, the MCND experiment is described as a cross-dataset neurological MRI experiment, rather than as the same-task external validation. The contribution of each model component will be analyzed using ablation analysis as the fourth analysis. The model interpretability and comparative performance are evaluated through the use of Grad-CAM and baseline internal comparisons of the model with standard architectures.
Complete patient-level identifiers were not available, and it would not be possible to rule out exact patient-level leakage. Furthermore, the fact that there are some duplicate or near-duplicate MRI images in the partitions is still a drawback of the public dataset. Thus, the reported results are not intended as an independent patient-level diagnostic performance but are benchmark results only to be interpreted at the image level.
4.2. Evaluation Protocol and Leakage Control
To separate internal validation from final testing, the original training and validation partitions were combined to form a development set of 1700 images. Five-fold stratified cross-validation was then applied only within this development set. In each fold, the model was trained on four development folds and validated on the remaining fold. The independent test set of 300 images was kept fixed and was not used during folding generation, model training, hyperparameter selection, or calibration fitting. This design avoids direct use of test images during cross-validation and preserves a hold-out set for final evaluation.
However, the public dataset does not provide complete patient-level or subject-level identifiers. Therefore, strict subject-level separation between training, validation, and test partitions could not be verified. This is an important limitation because multiple MRI slices or visually similar images from the same subject may be correlated, and their presence across different partitions could inflate performance estimates. Consequently, the reported results should be interpreted as image-level internal benchmark performance on the available curated dataset rather than definitive evidence of patient-level or clinical generalization. Future studies should use datasets with patient identifiers so that all slices from the same subject remain within a single fold or partition.
The design of this evaluation was chosen to ensure internal stability evaluation while holding back the final hold-out testing. To evaluate the model’s consistency when trained and validated with different subsets of the development set, five-fold cross-validation was performed. Five-fold cross-validation was conducted for consistency across different training/validation partitions, and the independent test set was used to assess the model. Apart from that, ablation analysis, baseline comparison, calibration metrics, Grad-CAM visualization, and MCND cross-dataset benchmarking were performed to assess the model on multiple fronts. Since no full patient-level identifiers were provided, however, the design should be seen as an image-level benchmark protocol and not the entire clinical validation protocol.
4.4. Results
Table 3 shows the fold-wise cross-validation results for the main curated rare neurological disease set using RareNeuroXNet. The model has demonstrated high classification results across all the five folds, with the accuracy, macro precision, macro recall, macro F1 score, and weighted F1 score being in the range of 0.98 to 1.00. The best results were found in Folds 2 and 5, with most classification metrics at 1.00, and the lowest in Fold 3, with most classification metrics being around 0.98. Even with this slight decrease, however, the difference between folds was not large, meaning the model was consistent across the different partitions of the development set. The calibration results also showed a high level of reliability in the probability estimates, with very low expected calibration error (ECE) values ranging from 0.00 to 0.01 and negative log-likelihood (NLL) values ranging from 0.01 to 0.05. These values indicate that the model’s predictions were consistent with the actual results for most of the cases. The NLL value was highest in Fold 3, but still low, and was consistent with the slightly lower classification performance in Fold 3.
Hence, the cross-validation outcomes show that RareNeuroXNet performed well in terms of discriminating the classes and calibrating it on all fivefold. Internal benchmark results, however, need to be treated with caution, as they are curated, balanced, and evaluated at the image level, and there are no complete patient-level identifiers. Thus, the subject-level independence could not be fully verified, and correlated images, duplicate or near-duplicate samples, or subject overlap between folds cannot be completely ruled out. Therefore, good classification and calibration performance near the tops of the current curated benchmark should be taken as an indicator that high image-level separability exists within the curated benchmark and not necessarily as proof of patient-level or clinical generalization.
Table 4 shows the cross-validation performance measures’ mean and standard deviation of RareNeuroXNet. The model had good and stable classification accuracy with a mean accuracy of 0.9924 ± 0.0061. Macro F1-score and weighted F1-score were also very high at 0.9924 ± 0.0061, showing almost balanced performance across the different classes and that the model was not heavily relying on majority class predictions. This low standard deviation also demonstrates consistency across the five folds of cross-validation in the model’s performance. The discrimination scores were also extremely high, with a macro one-vs-rest ROC-AUC of 0.9998 ± 0.0002 and a macro-PR-AUC of 0.9992 ± 0.0007 in the considered benchmark, showing high class separability. Furthermore, the calibration metrics exhibited good reliability with ECE = 0.0052 ± 0.0029 and NLL = 0.0276 ± 0.0159, meaning the predicted probabilities were well calibrated within the image-level benchmark class labels observed. The variability was slightly larger in NLL than in ECE, but these were very low, and this confirmed the probabilistic reliability of the model. The results of these strong findings should be interpreted with caution, as the data set is curated, balanced, and evaluated at the image level, and full patient identifiers are not available. So, it could not be fully confirmed that all the subjects were independent of each other, and there is a possibility of duplicate or near-duplicate images, correlated slices, or subject overlap across partitions. The reported scores must be interpreted, therefore, as evidence of good performance against the internal benchmark within the current data set, not as evidence of patient level or clinical generalization.
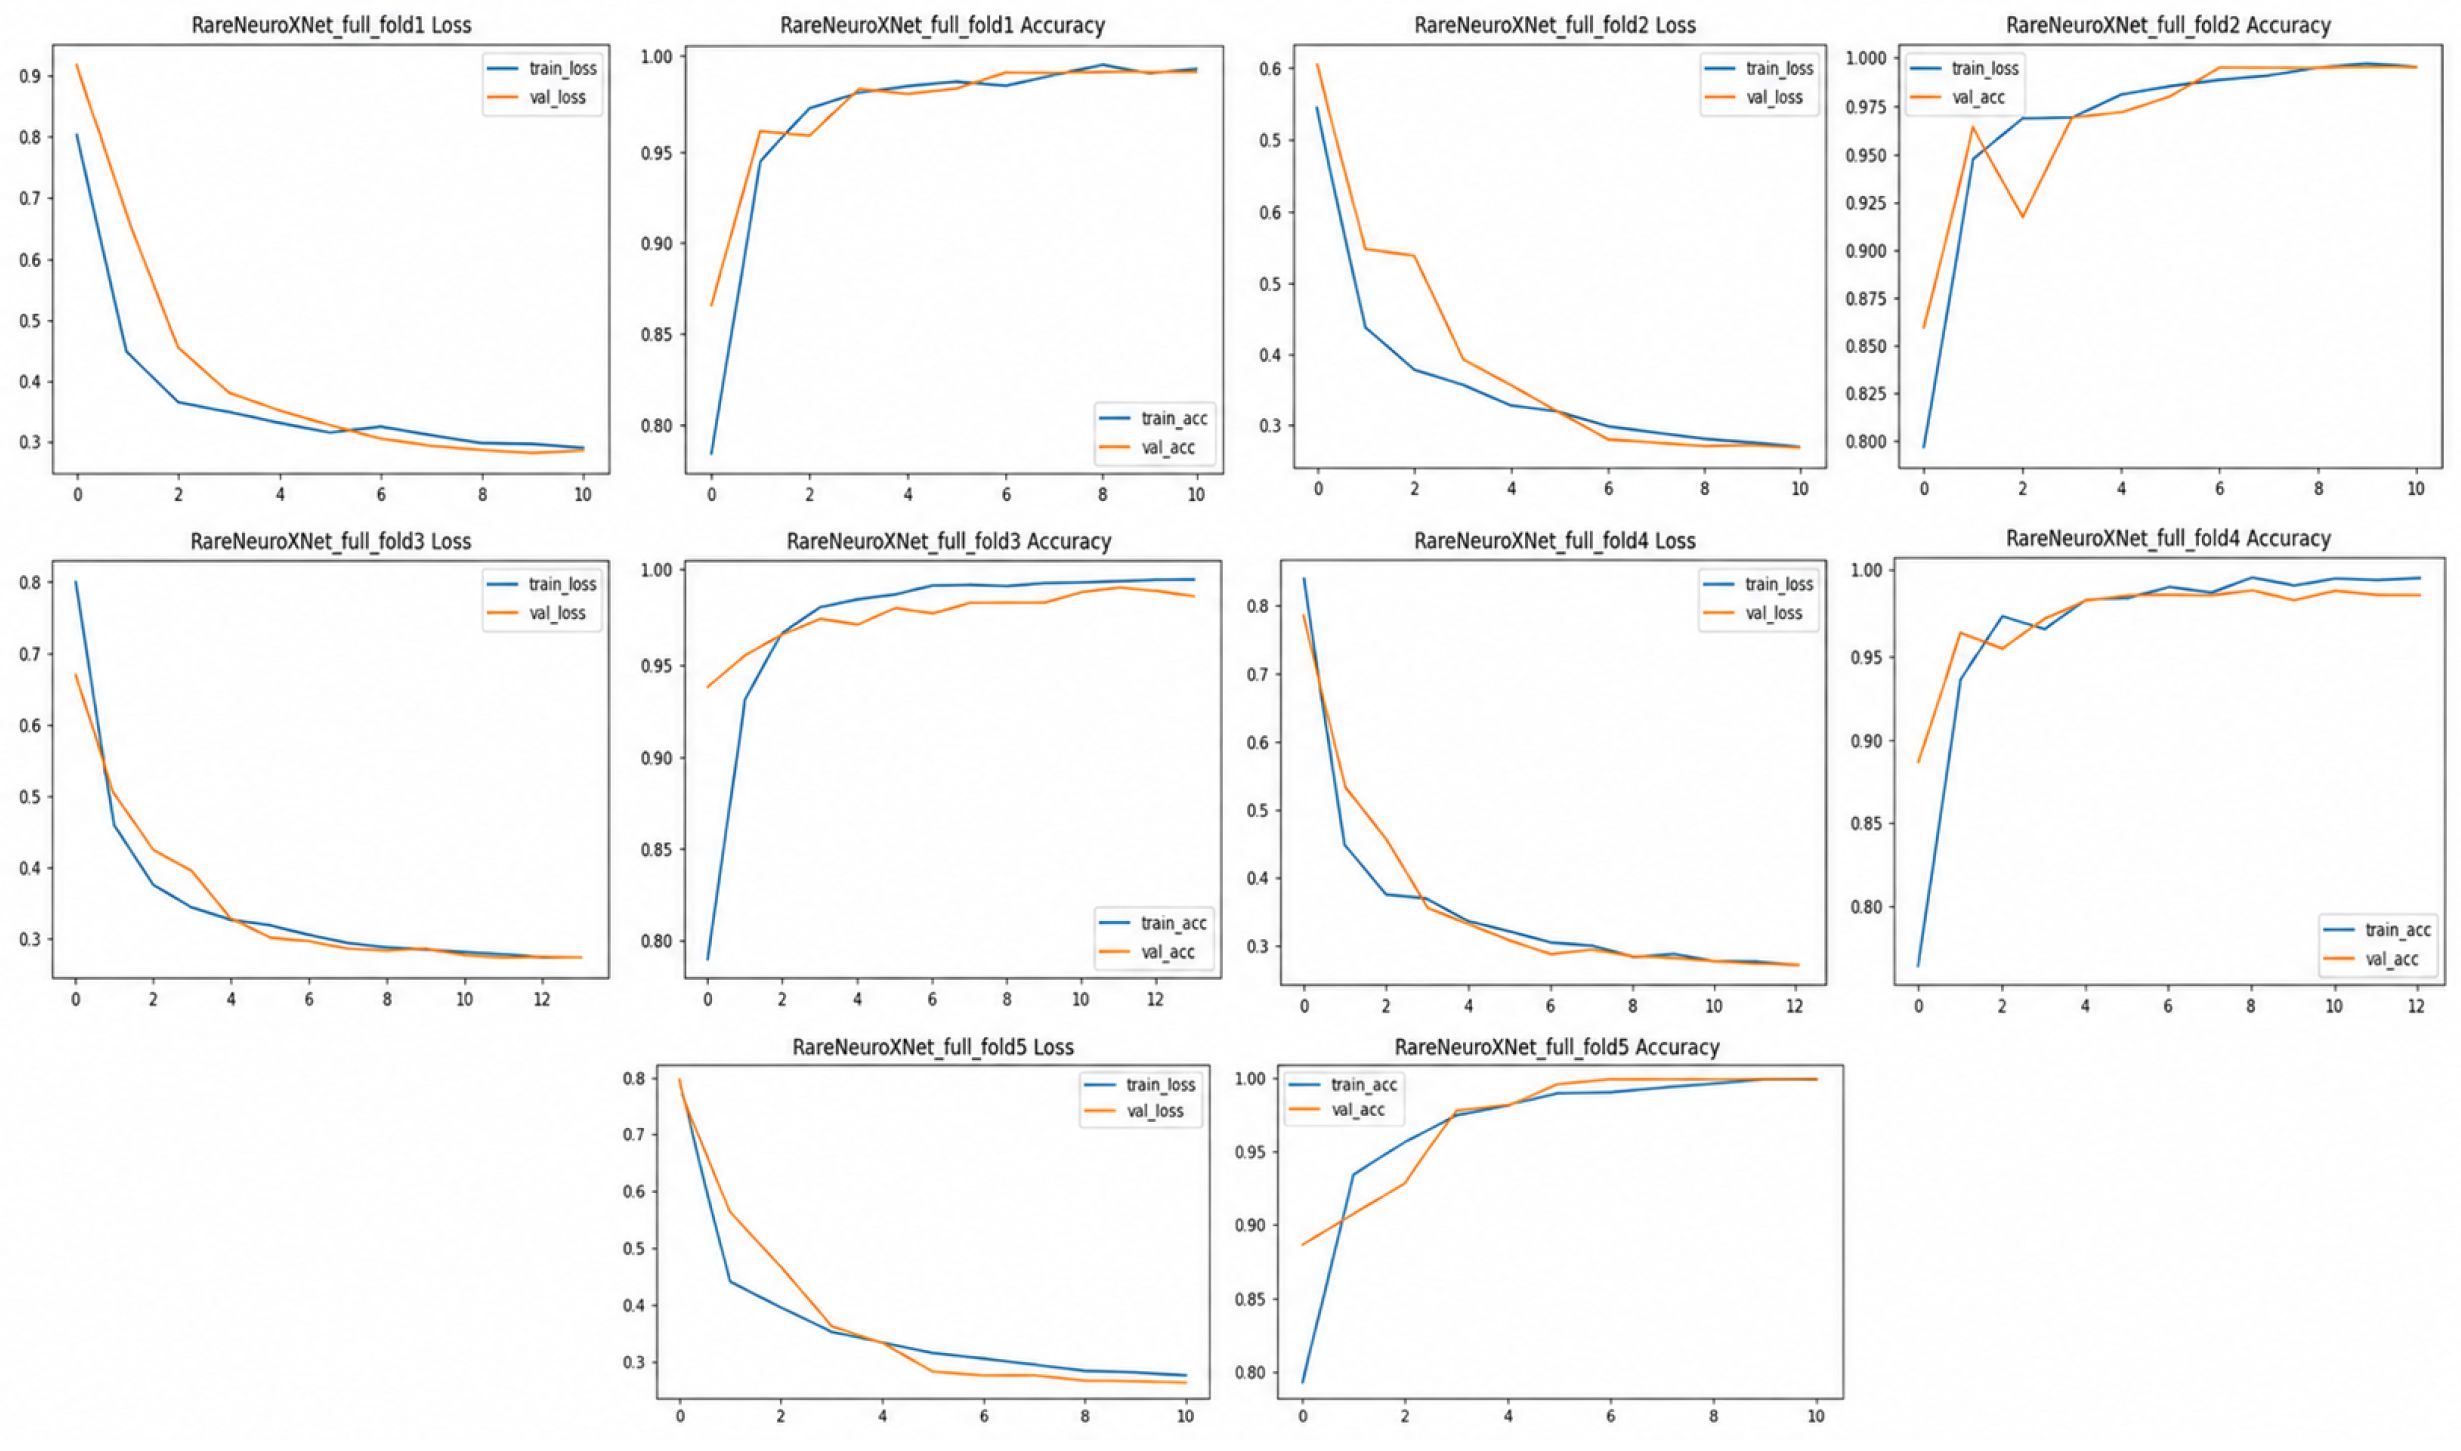
The training and validation curves with accuracy/loss are shown for RareNeuroXNet across the five folds of cross-validation in
Figure 3. In general, the loss curves gradually decrease with each epoch of training, and the accuracy curves quickly improve in the initial epochs and converge toward high accuracy, indicating that the model is optimized well and achieves consistent convergence across the folds. In most folds, the training curve does not differ drastically from the validation curve, indicating consistent learning behavior that shows no pronounced difference between the training and validation performance. But the curves should be interpreted with caution, as it is possible that the curve is overfitting, learning something from the patients alone, or that it is influenced by correlated-image effects, as complete patient-level identifiers are not available. The convergence of Fold2 appears to be particularly rapid, and the convergence of the other folds also occurs in a smooth manner with slight fluctuations at the epoch level, indicating the stability of the training procedure within the evaluated image-level benchmark.
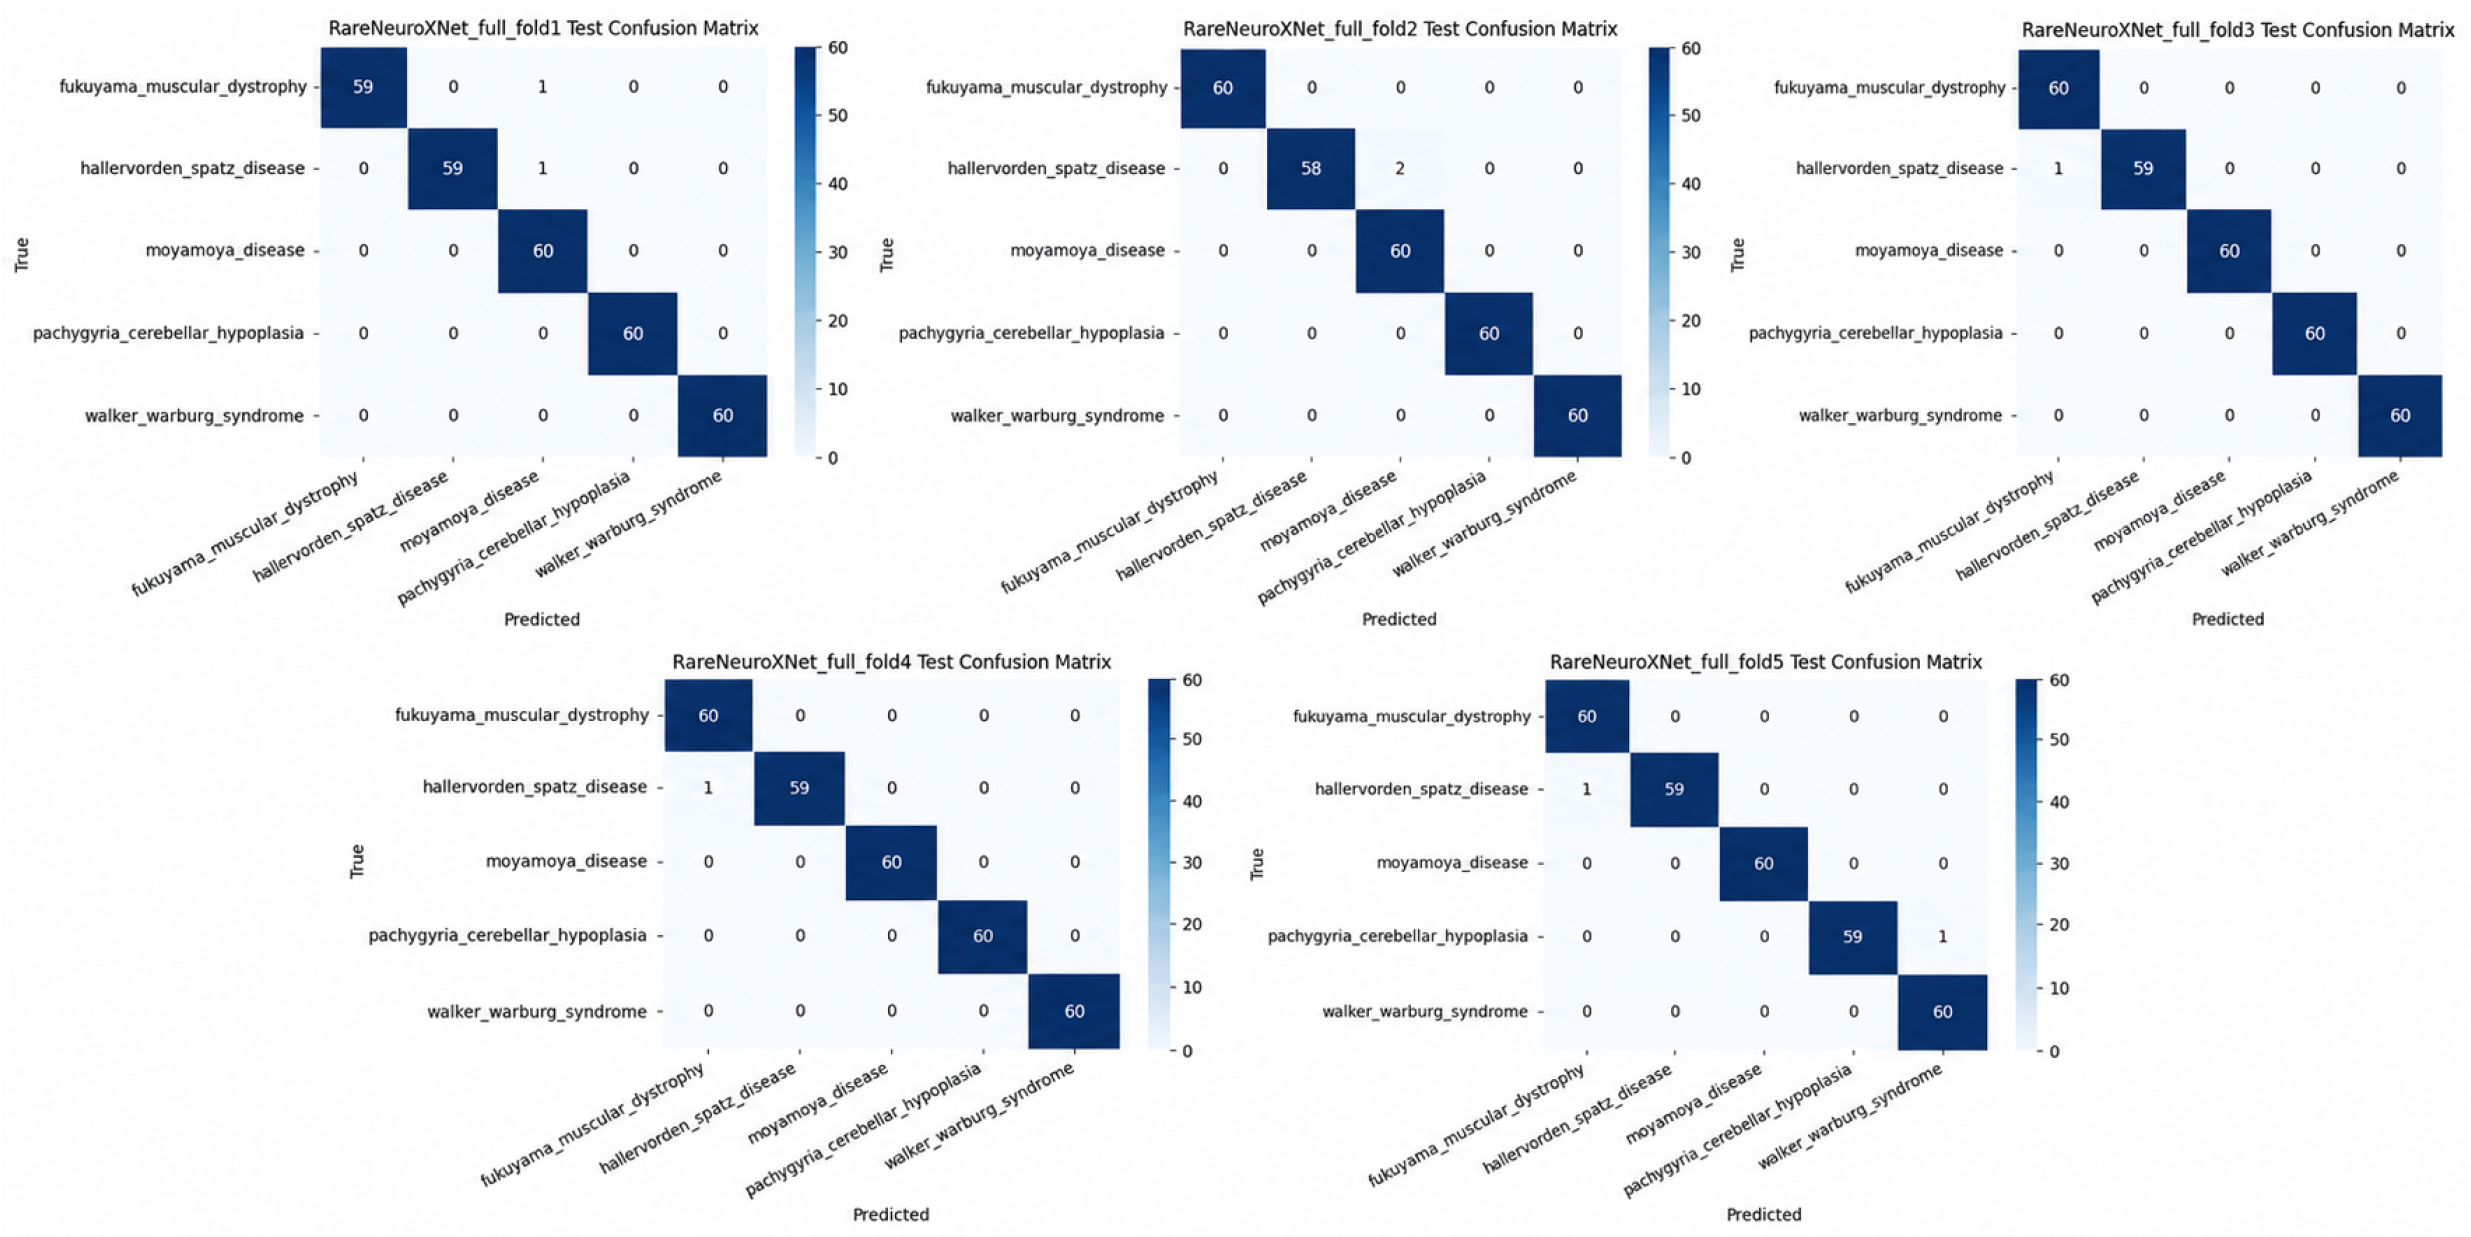
The confusion matrices of RareNeuroXNet are shown in
Figure 4 for the five cross-validation folds. Accordingly, most of the predictions were focused on the main diagonal of the matrices, meaning that the model could correctly classify most samples from the five rare neurological disease classes: Fukuyama muscular dystrophy, Hallervorden-Spatz disease, Moyamoya disease, pachygyria with cerebellar hypoplasia, and Walker-Warburg syndrome. The off-diagonal errors along the folds are limited in number and are primarily the confusion between similar-appearing disease classes (Hallervorden–Spatz disease and Fukuyama muscular dystrophy) or sometimes between different disease classes (Moyamoya disease and Walker–Warburg syndrome). The overall confusion matrix presents a picture of good internal discriminative performance of the model on the curated image-level benchmark, which, however, should be interpreted with caution due to the lack of external generalization and patient-level independence.
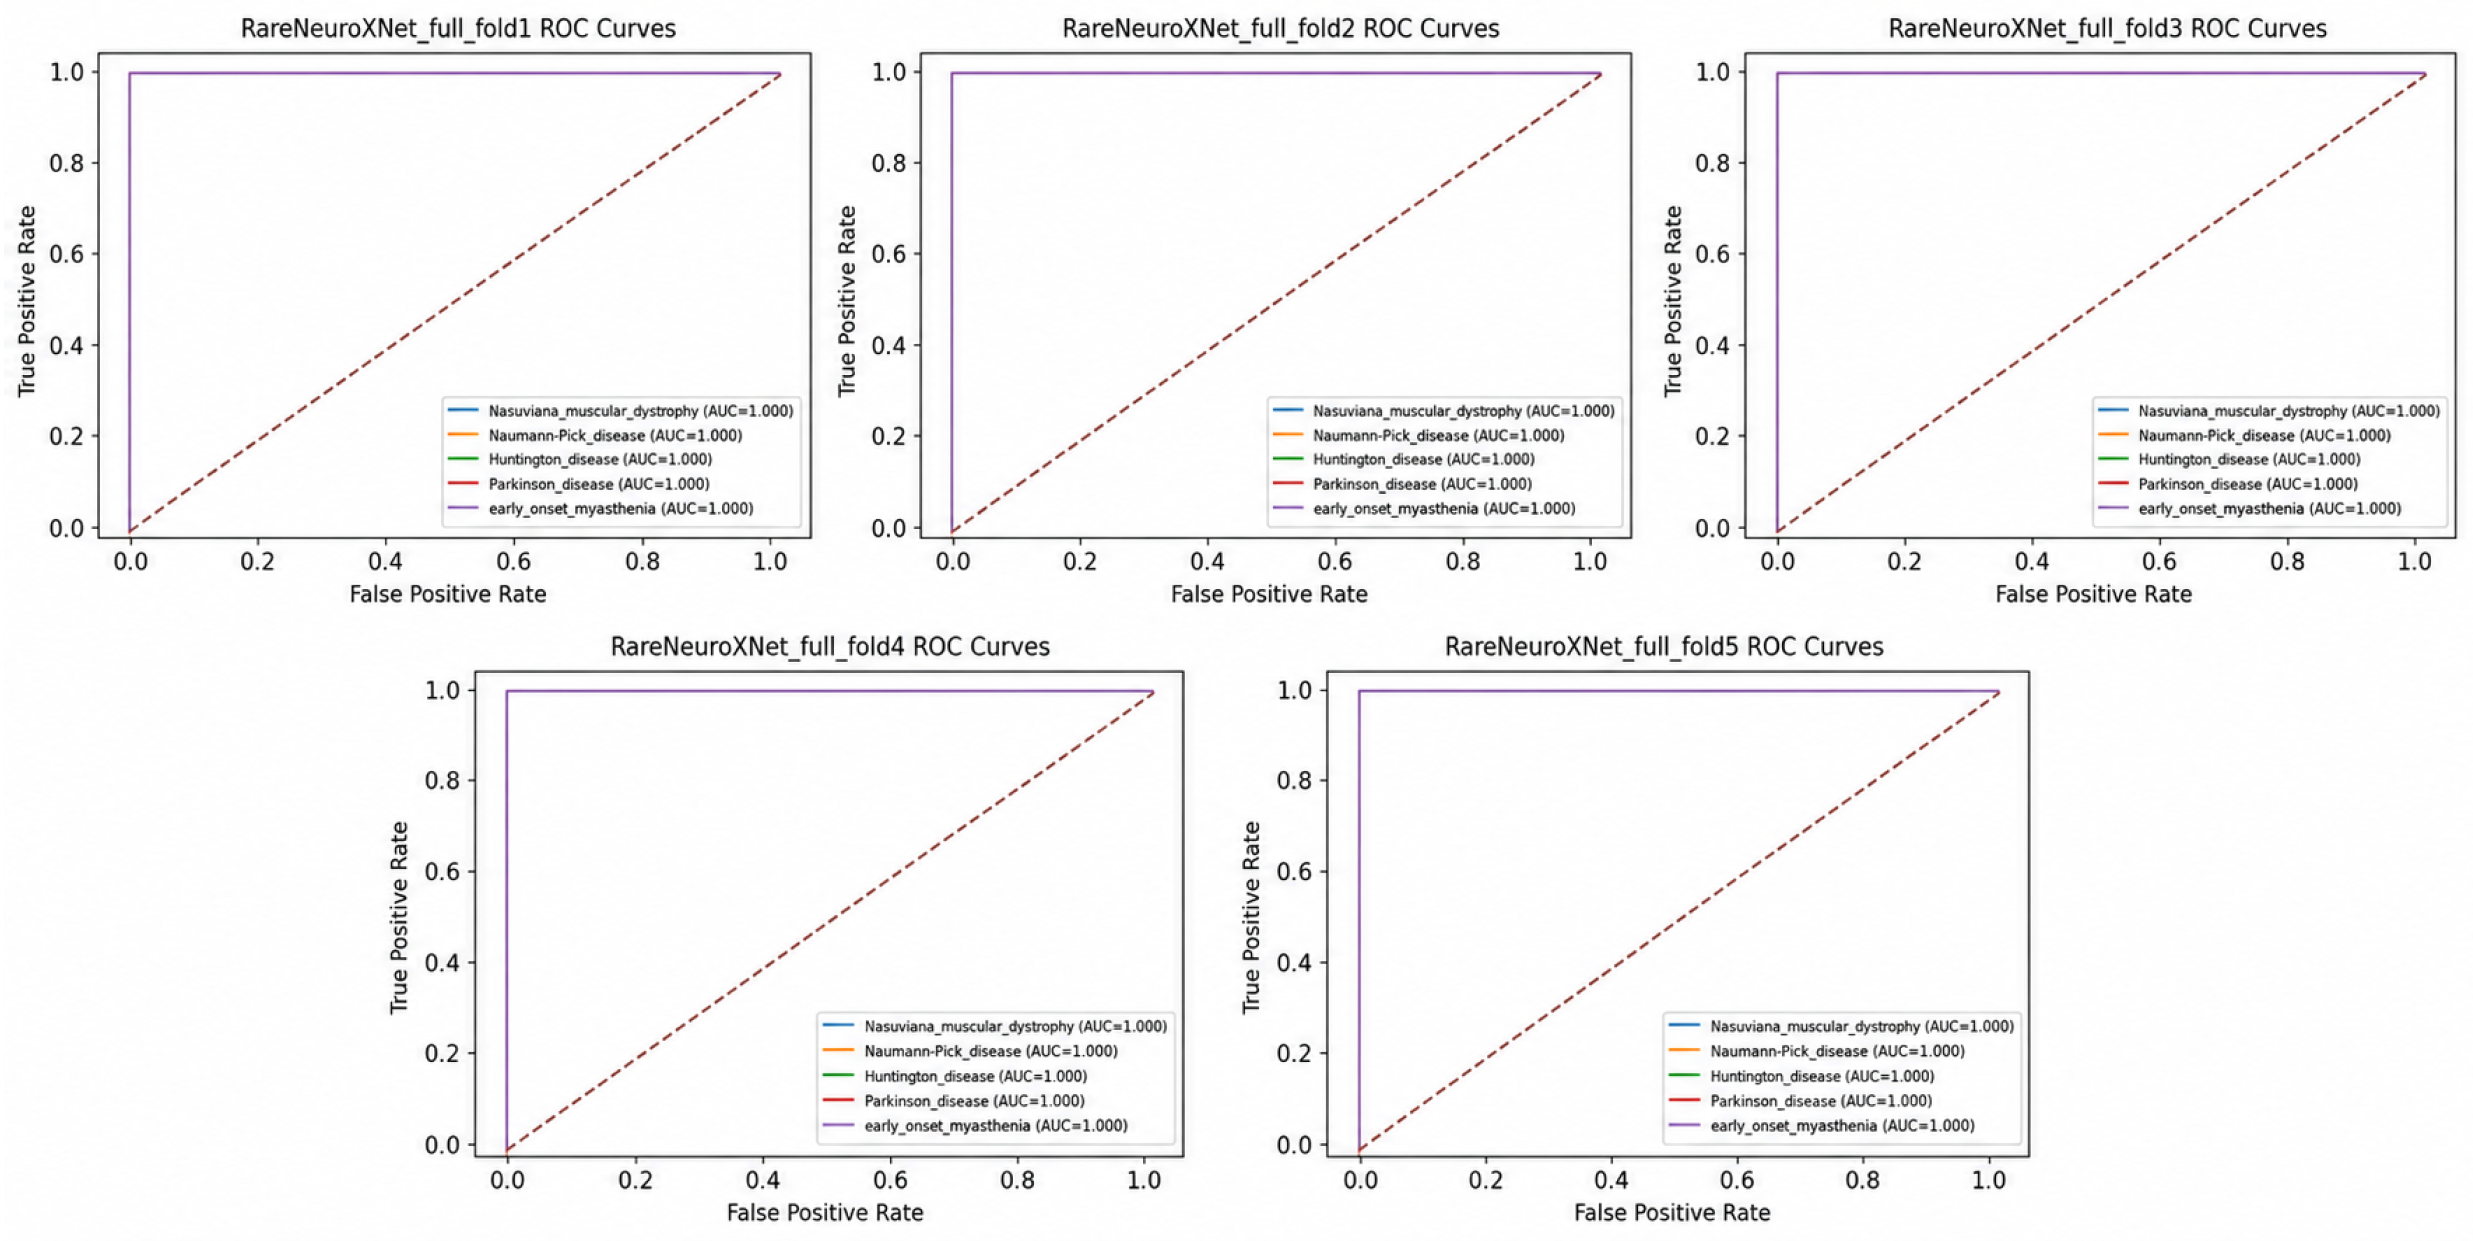
The ROC curves of RareNeuroXNet on the 5 cross-validation folds are plotted in
Figure 5. The curves of the five rare neurological disease classes are located near the top left of the plots, which suggests that the discrimination of each class from the rest of evaluated classes in the benchmark is good. The class-wise AUC values are nearly 1.00 across the folds, indicating that the models learned display a good separability between the selected categories of diseases. The fold-wise variation is small, and the shape of the ROC is close to an ideal shape in most of the folds. The model shows good internal discriminative performance with these results; however, the near-perfect ROC performance should not be viewed as the model’s ability to generalize its performance at the patient or external level without further validation.
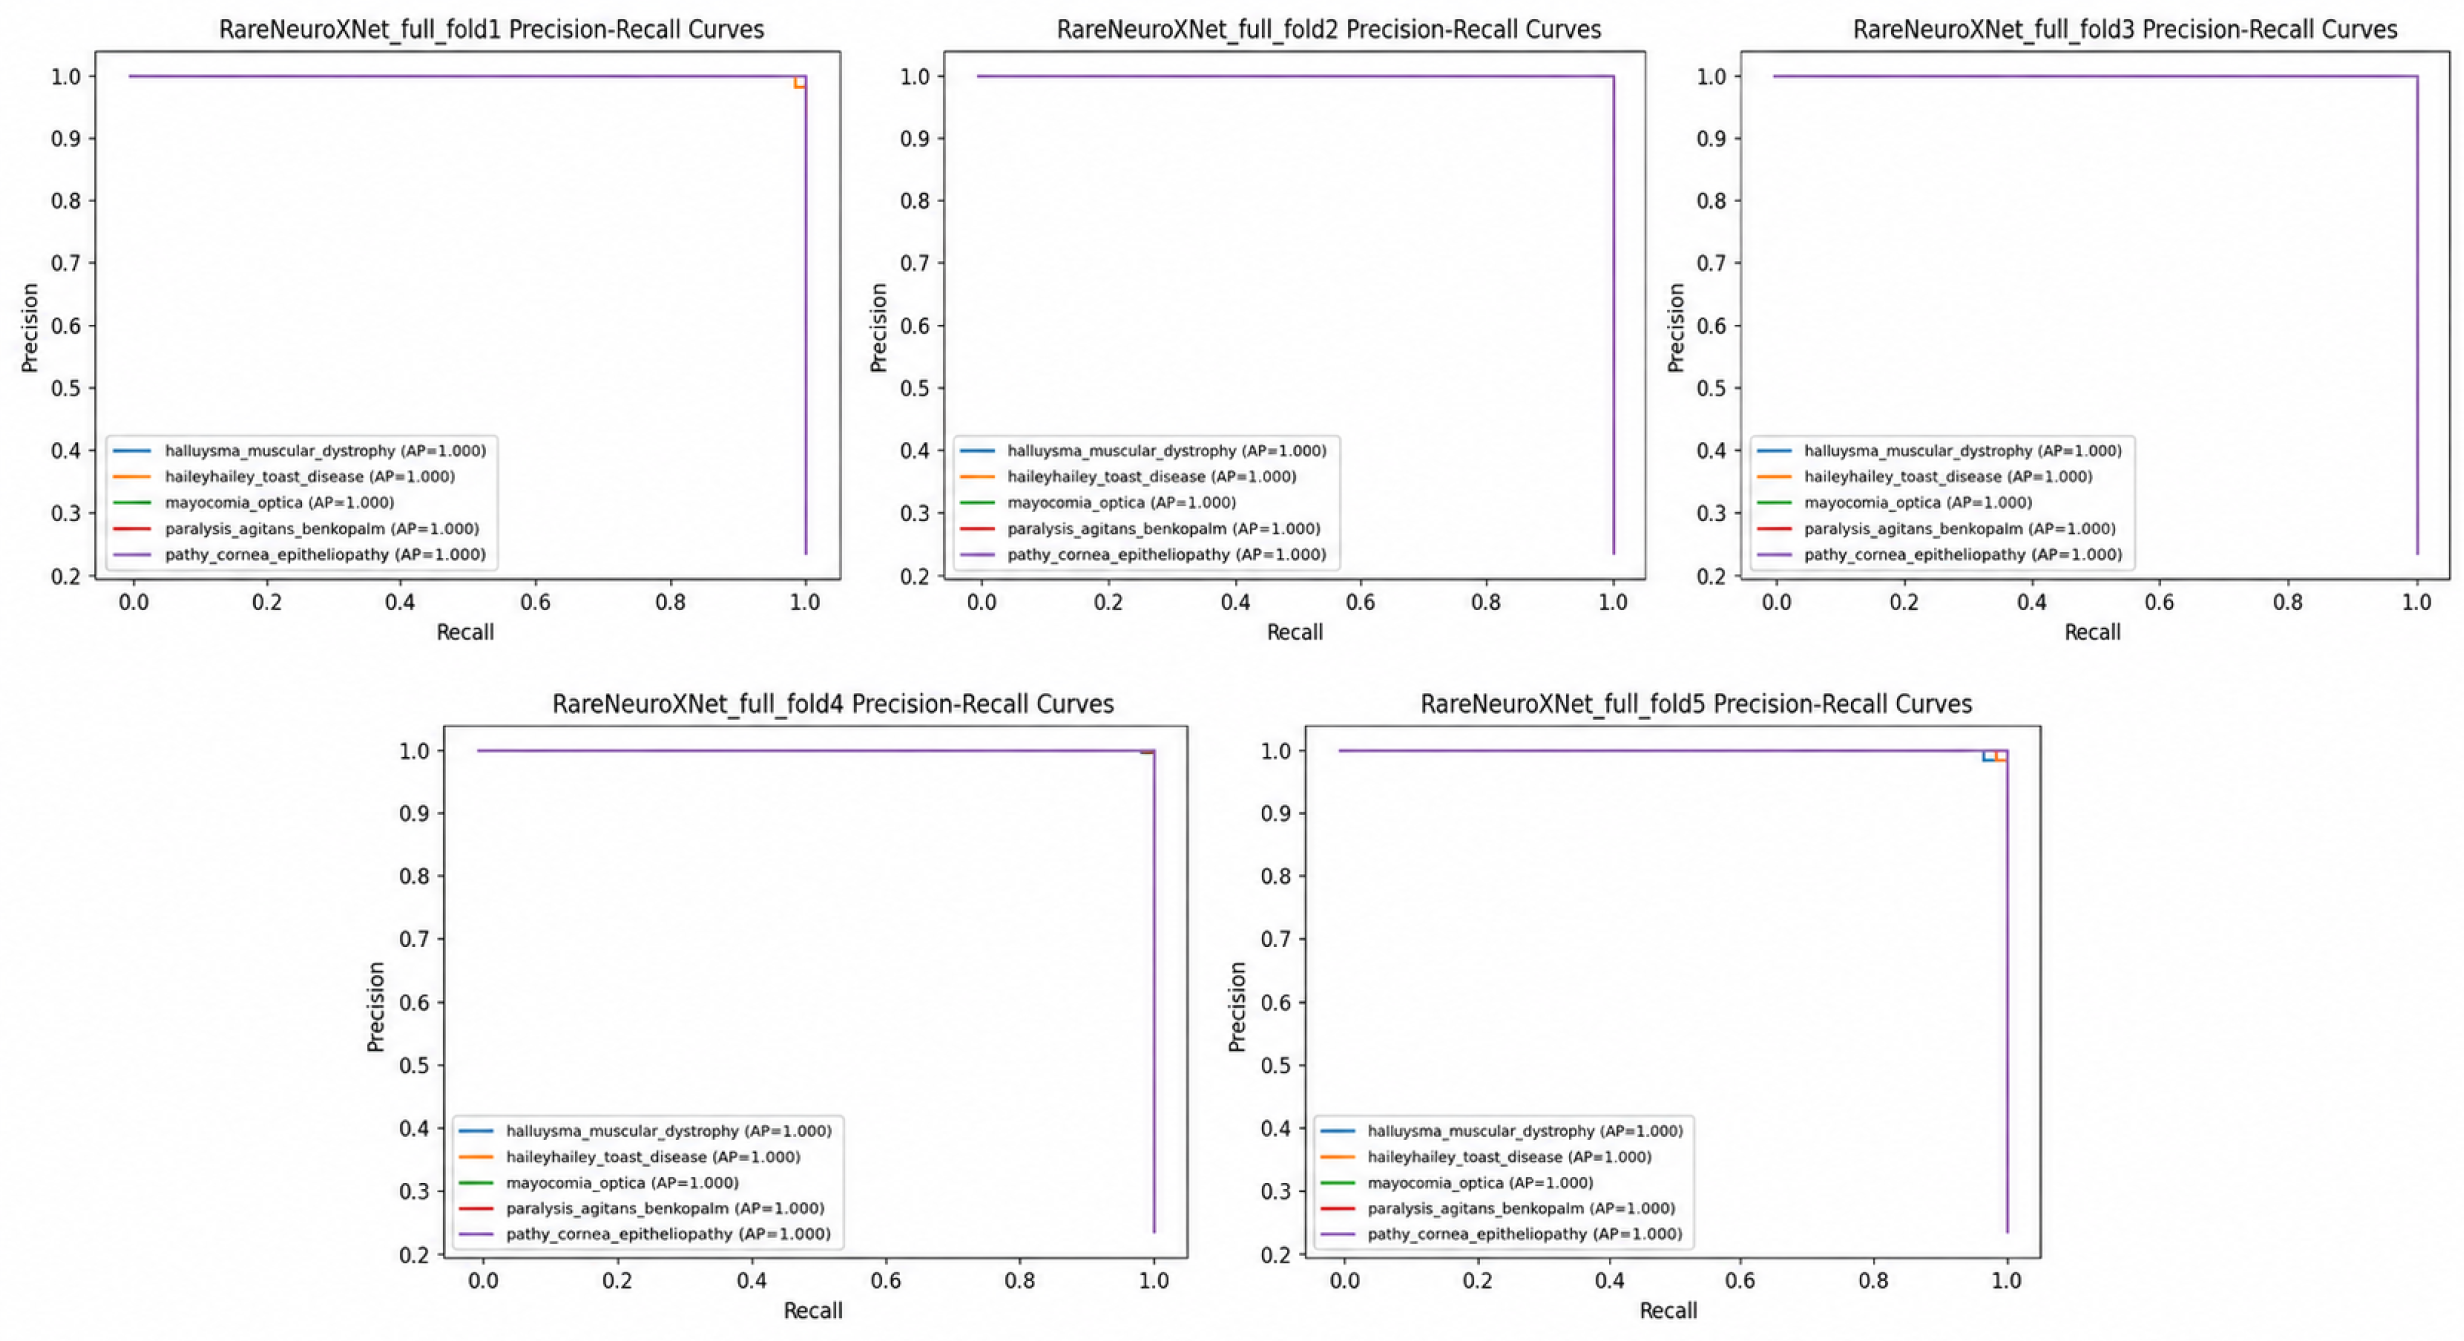
We report the precision–recall curves of RareNeuroXNet in the five cross-validation folds in
Figure 6. Curves of the five rare neurological disease classes are grouped around the upper right corner of the plots, meaning high precision and recall in the image-level test benchmark. Average precision scores are nearly 1.00 for all folds, indicating good positive predictive value for the selected classes. The fold-wise PR curves are, however, very similar, thus confirming the internal stability of the learned representations. Like the ROC results, the near-perfect pattern of PRs should be used with caution, as the dataset is curated and balanced, and independence of patients and external validation using the same tasks are required to assess generalizability.
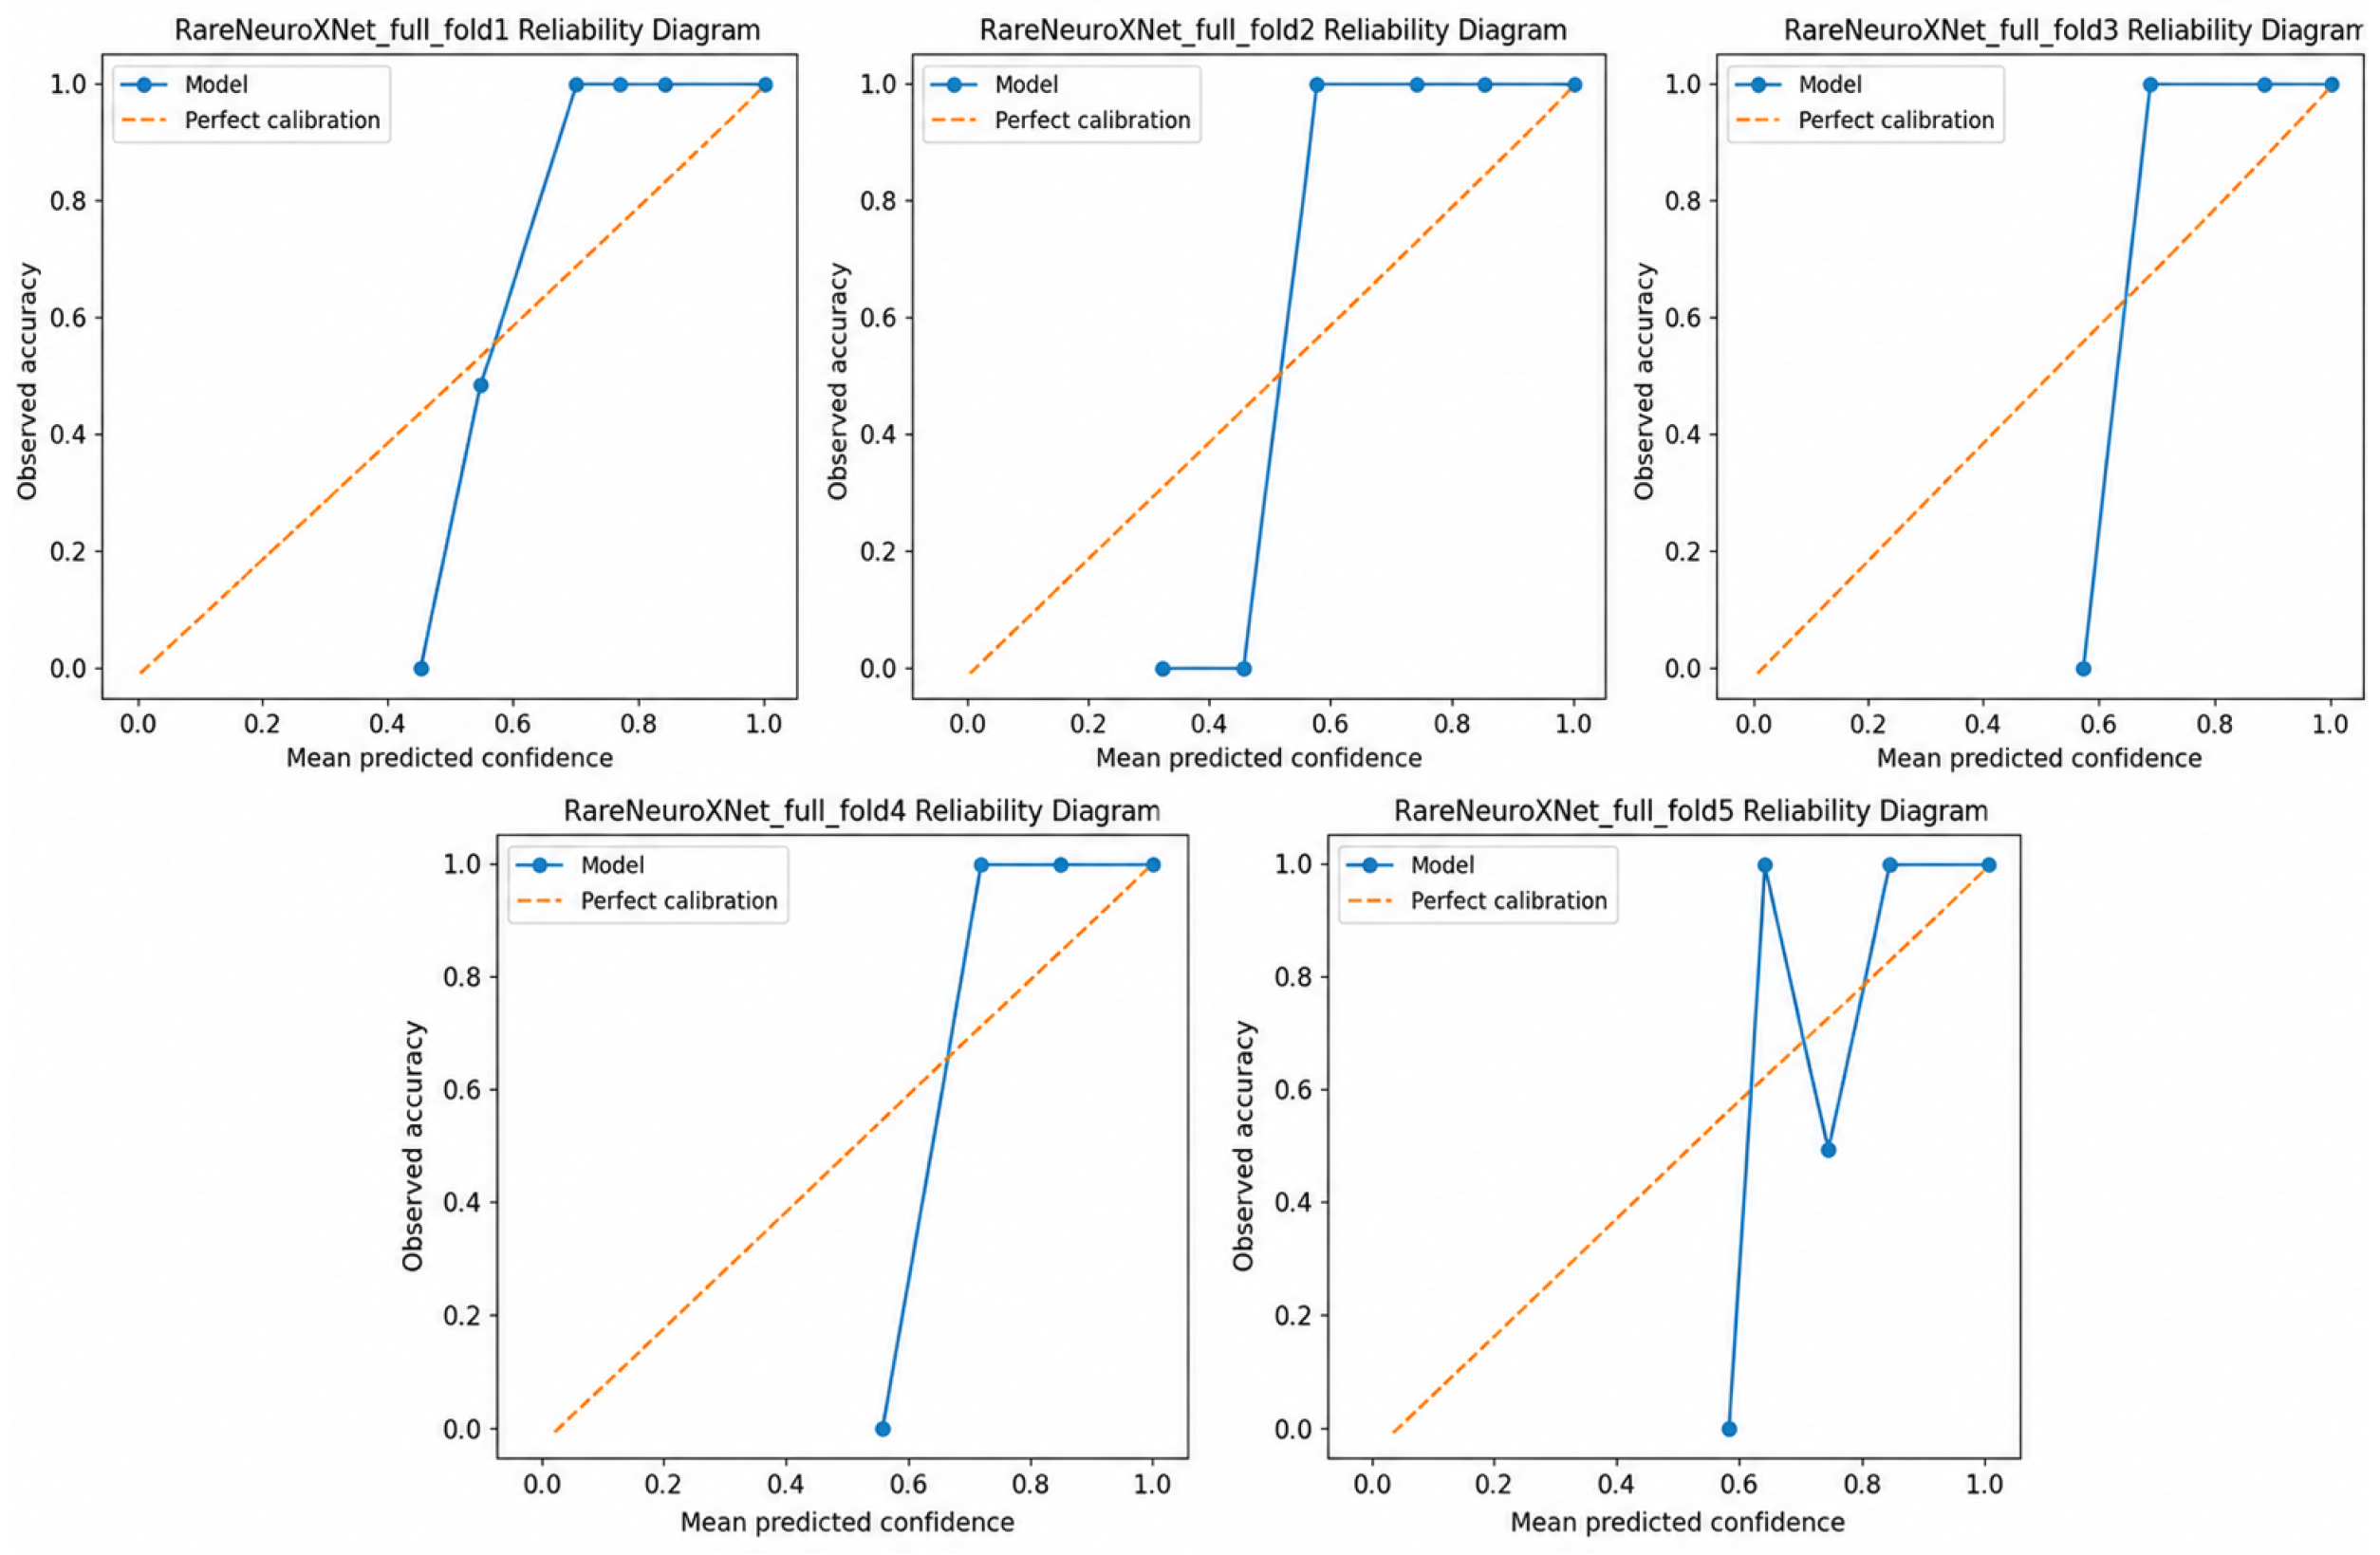
The reliability diagrams of RareNeuroXNet are displayed for the 5 folds of cross-validation in
Figure 7. These plots are graphs of the degree of confidence that the model gives versus the accuracy of that model; the ideal calibration is represented by a diagonal line. The overall shape of the curves is not that far off from the reference line, especially within the regions of high confidence, suggesting that the probabilities predicted by the curves are generally in line with actual results. There is a minor deviation in some folds, particularly in the mid-confidence ranges, but the pattern of calibration is consistent with the low ECE values found in the quantitative results. The results indicate that the probability calibration at the image level is good within the benchmark set for the current study but may need to be recalibrated using independent patient-level and external datasets, as confidence intervals can shift in different domains.
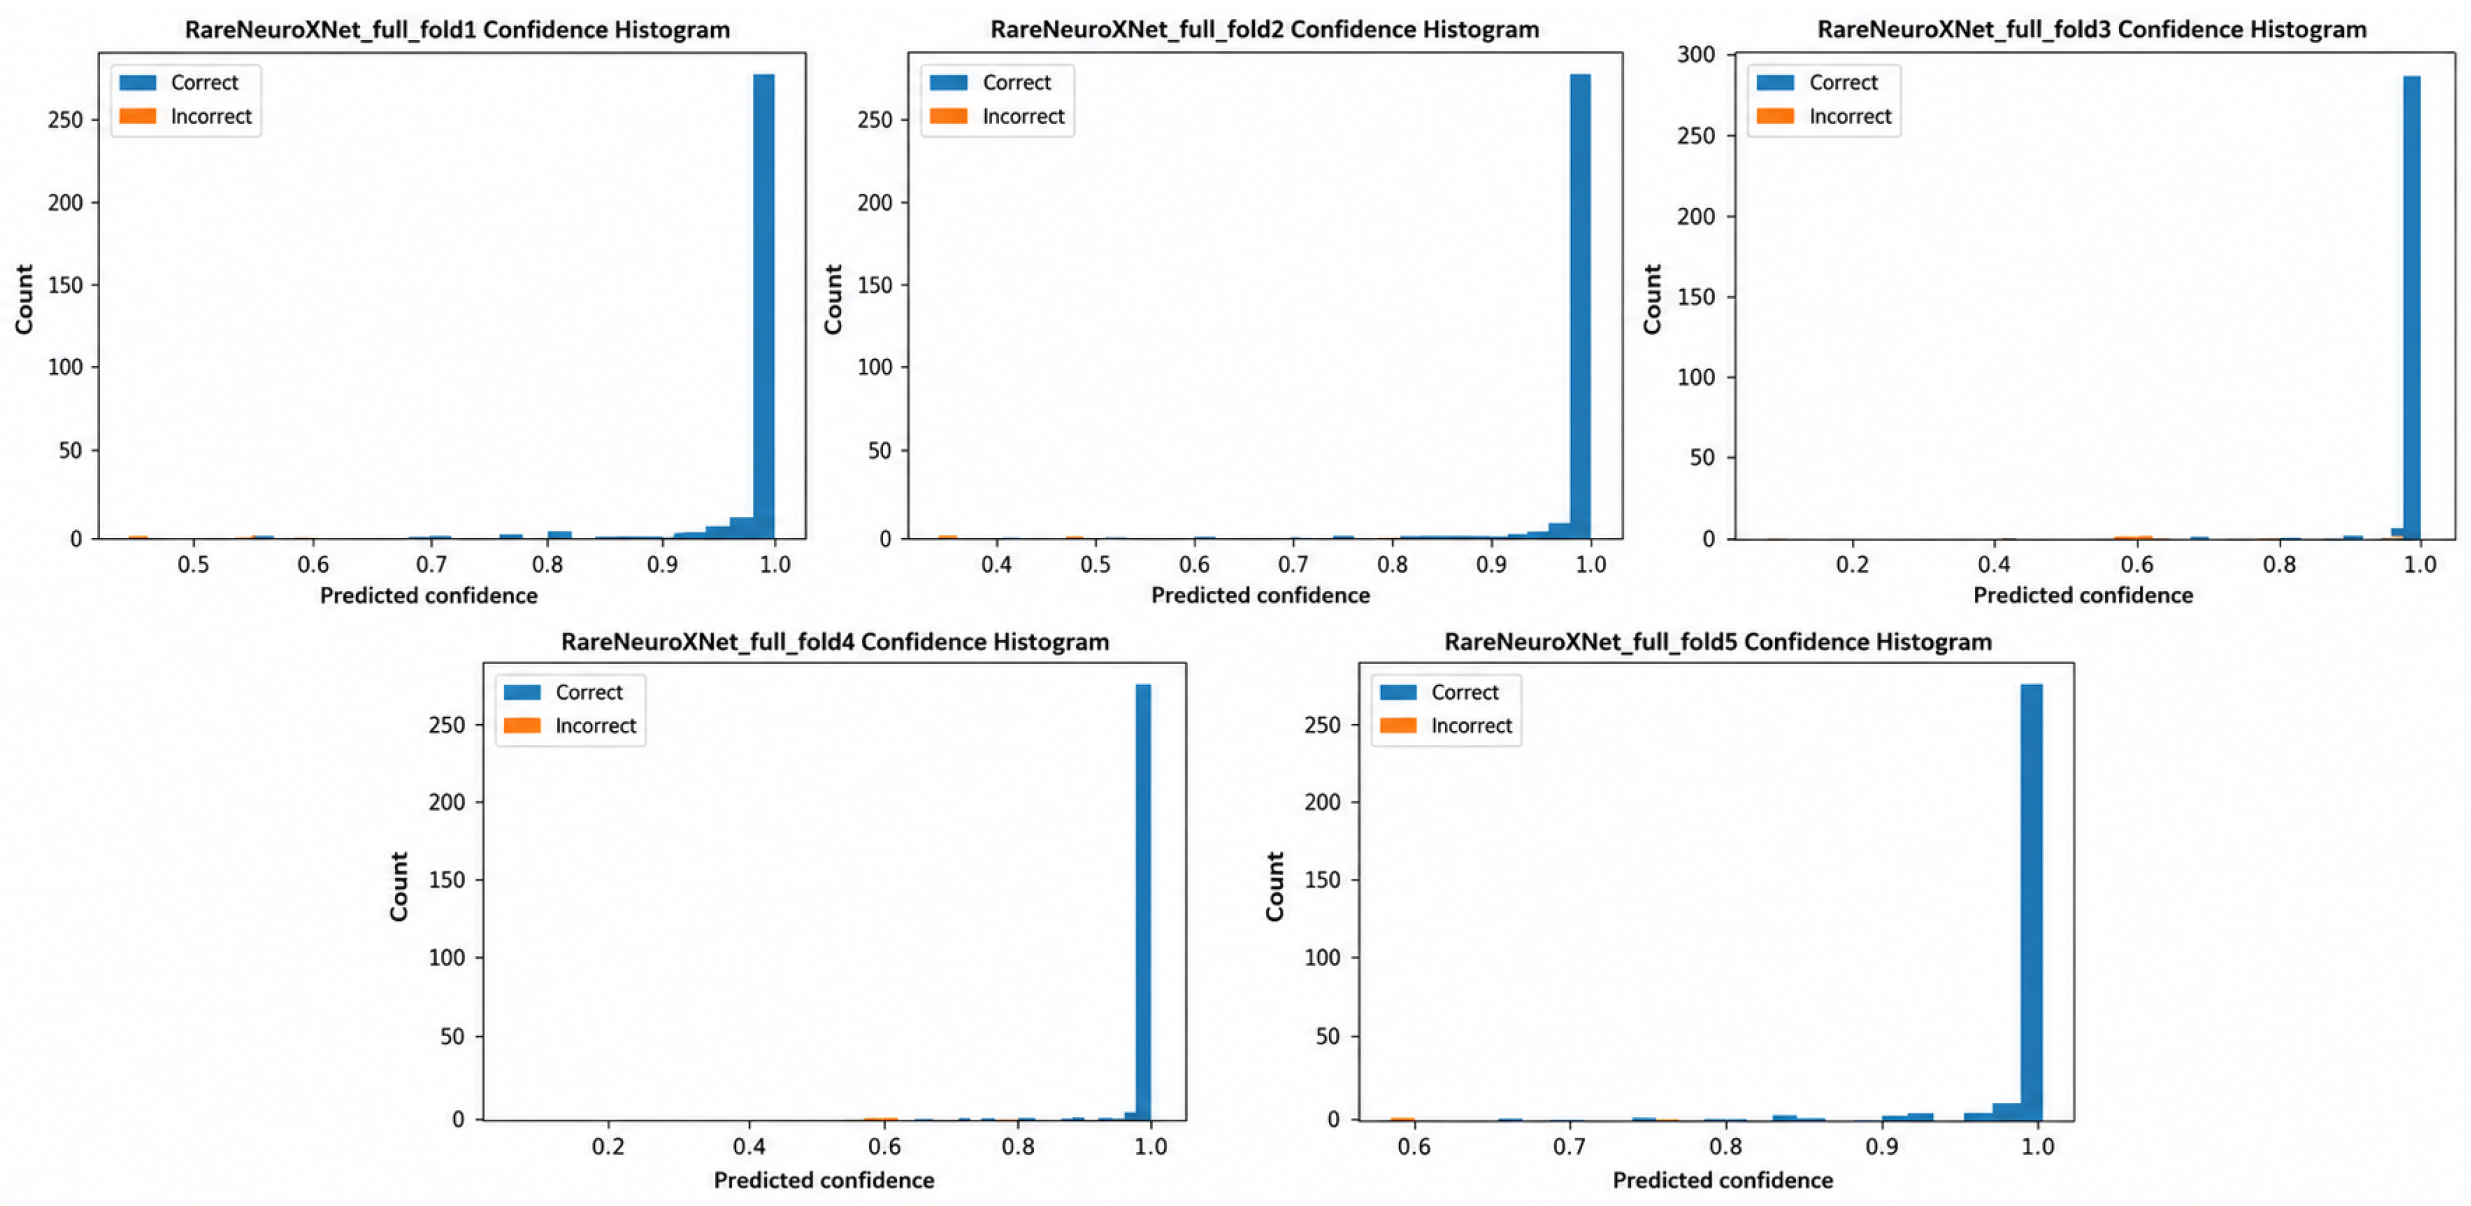
The distribution of prediction confidence for correct and incorrect classifications is shown in the confidence histograms of RareNeuroXNet across the five folds of the cross-validation, presented in
Figure 8. In most folds, most of the predictions fall within only a small portion of the high-confidence range, and these predictions are predominantly correct, suggesting high model confidence in correct classifications in the assessed benchmark. There are not many wrong predictions in the output, and they fall randomly in the lower or middle confidence intervals. The reliability diagrams and low calibration errors are consistent with this pattern and imply a good level of confidence behavior on the curated image-level dataset. Calibration and confidence reliability should be tested on independent external data sets but may vary depending on imaging conditions and patient population and should be evaluated accordingly.
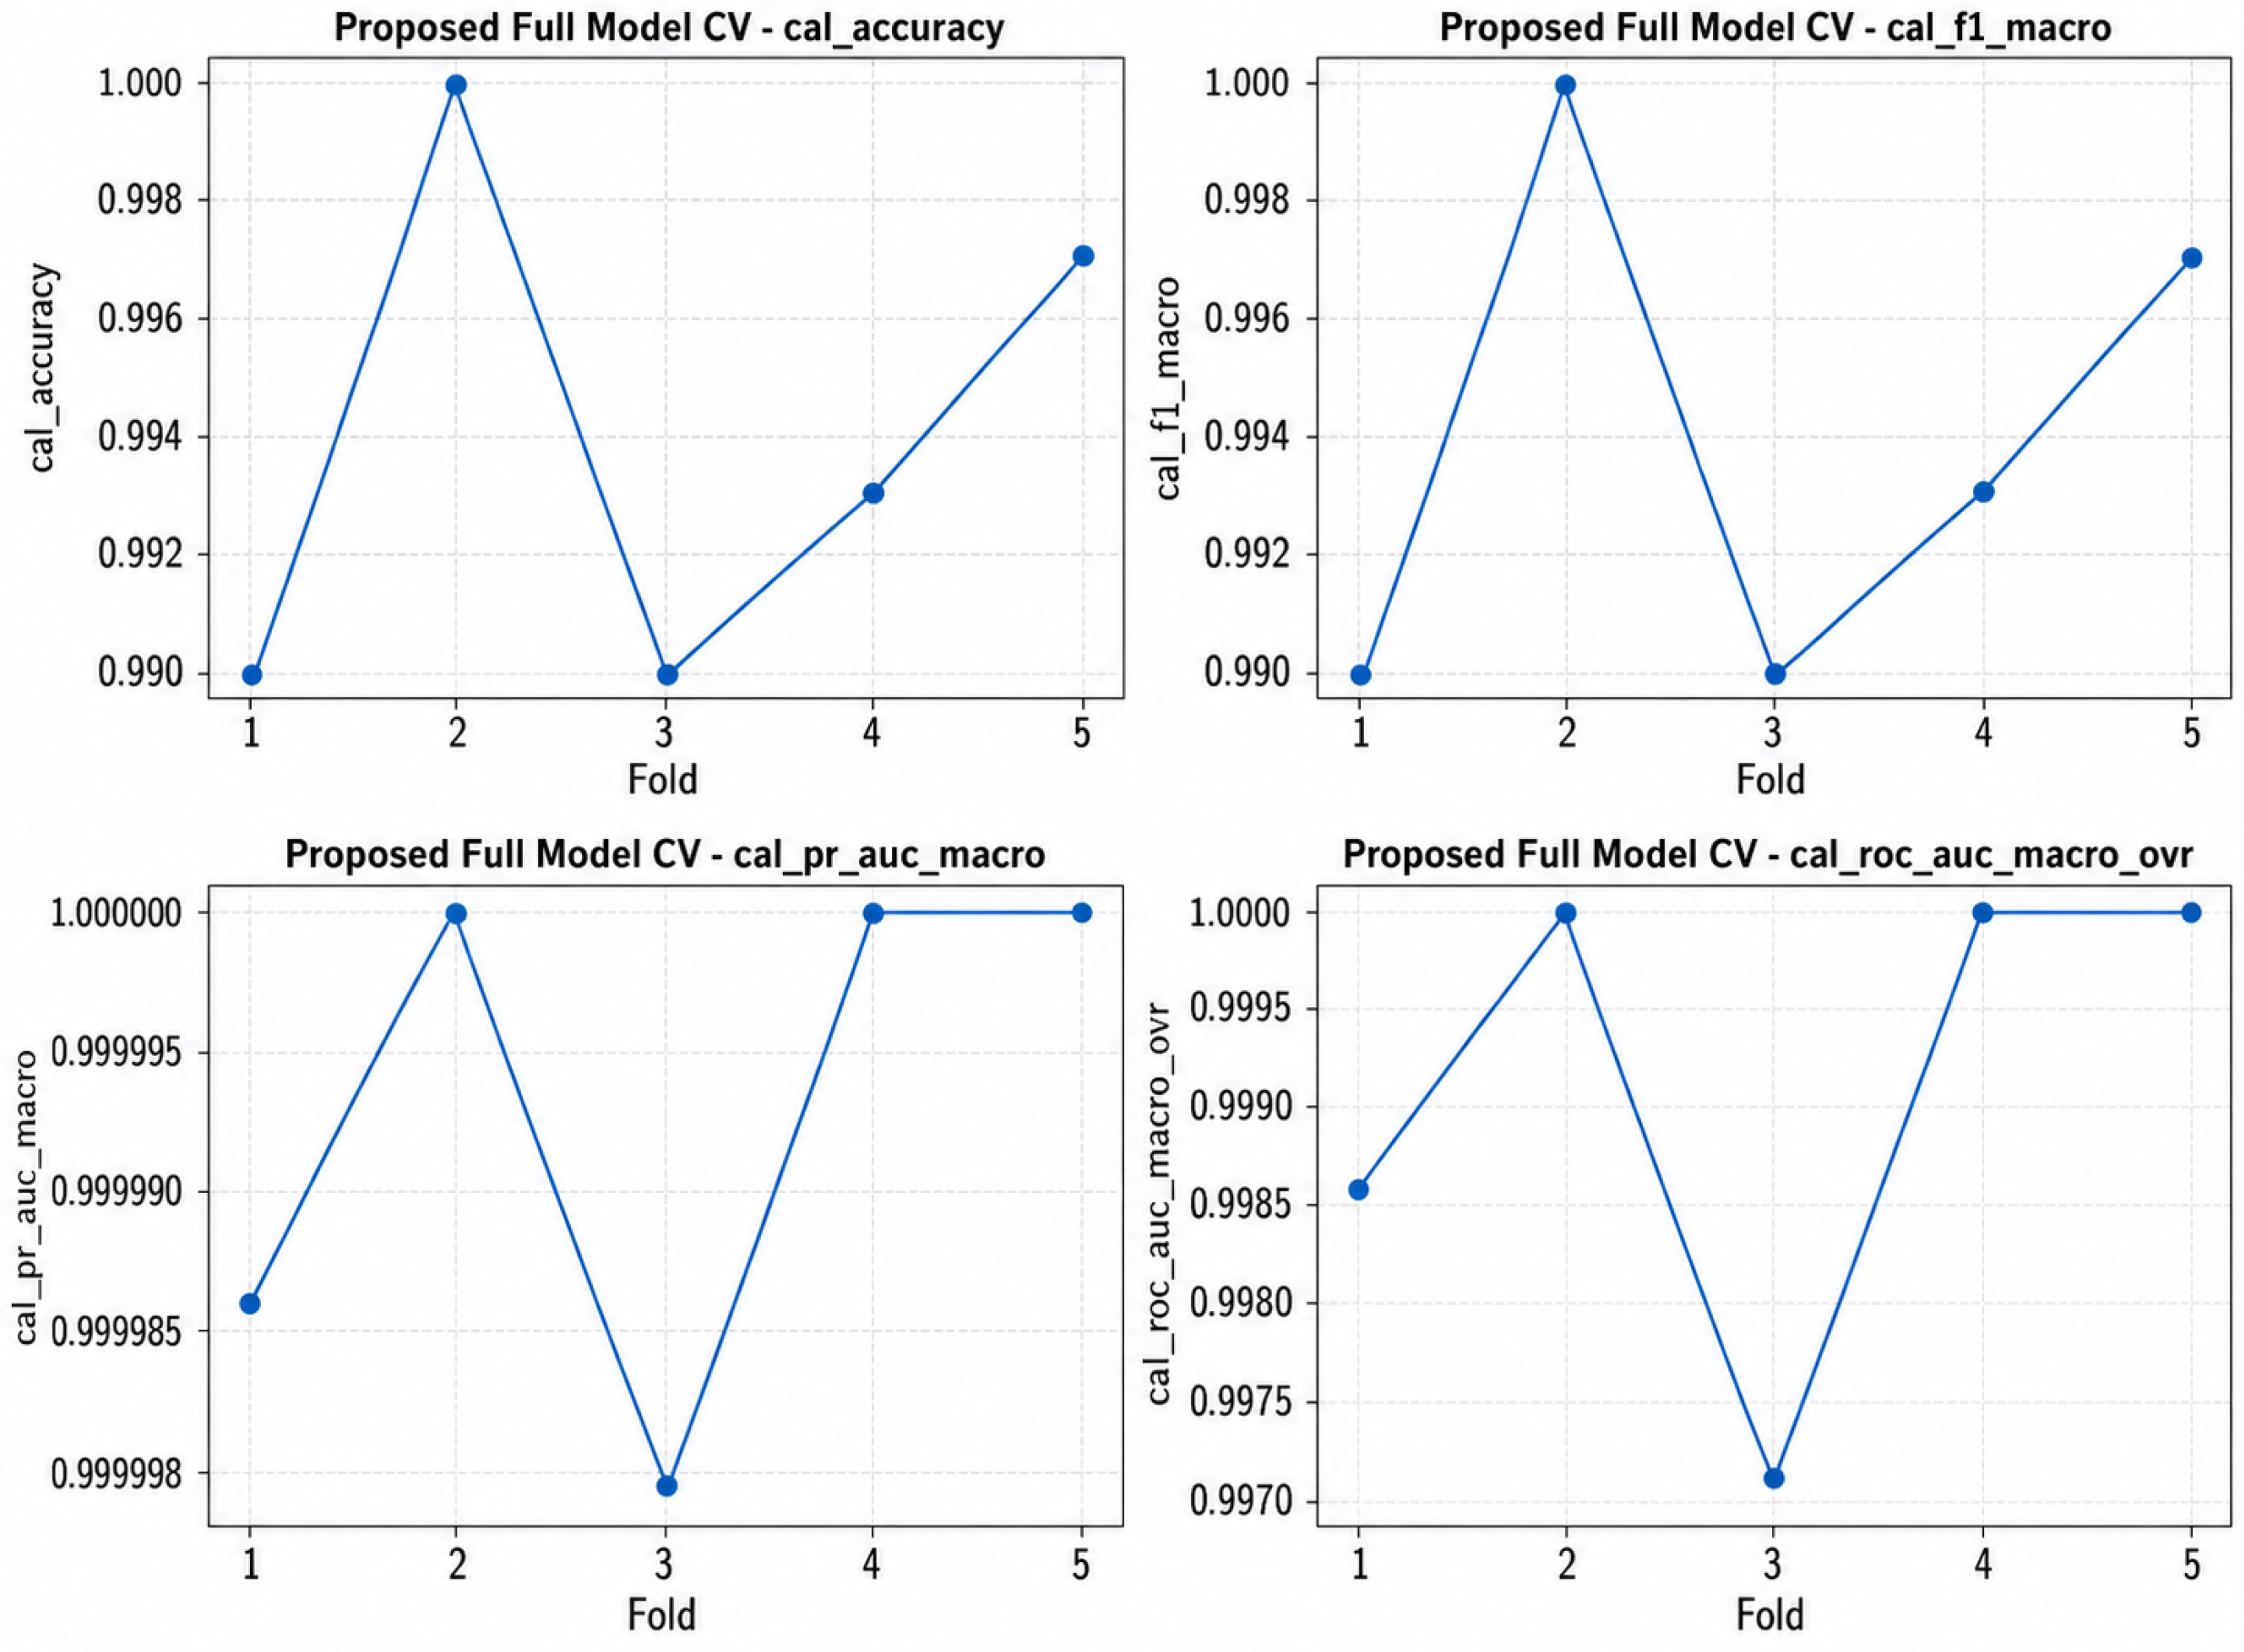
The cross-validation results are summarized in
Figure 9, which shows the performance of RareNeuroXNet based on four different calibration metrics: accuracy, macro F1 score, macro-AU PR, and macro-AU ROC. The calibrated accuracy and macro F1-score are consistently high across all folds with only slight fluctuations, suggesting consistent internal performance of the evaluated image-level benchmark. The AUPR and AUROC curves are also relatively flat across the folds, indicating good class separability and precision–recall performance of the selected rare neurological disease classes. Fold 2 has the highest values, and the other folds have similar high performance. These results provide evidence of the internal stability of RareNeuroXNet over all cross-validation splits, but the results should not be interpreted as proof of wide clinical generalization without patient-level separation and independent external validation.
MCND Cross-Dataset Benchmark Results
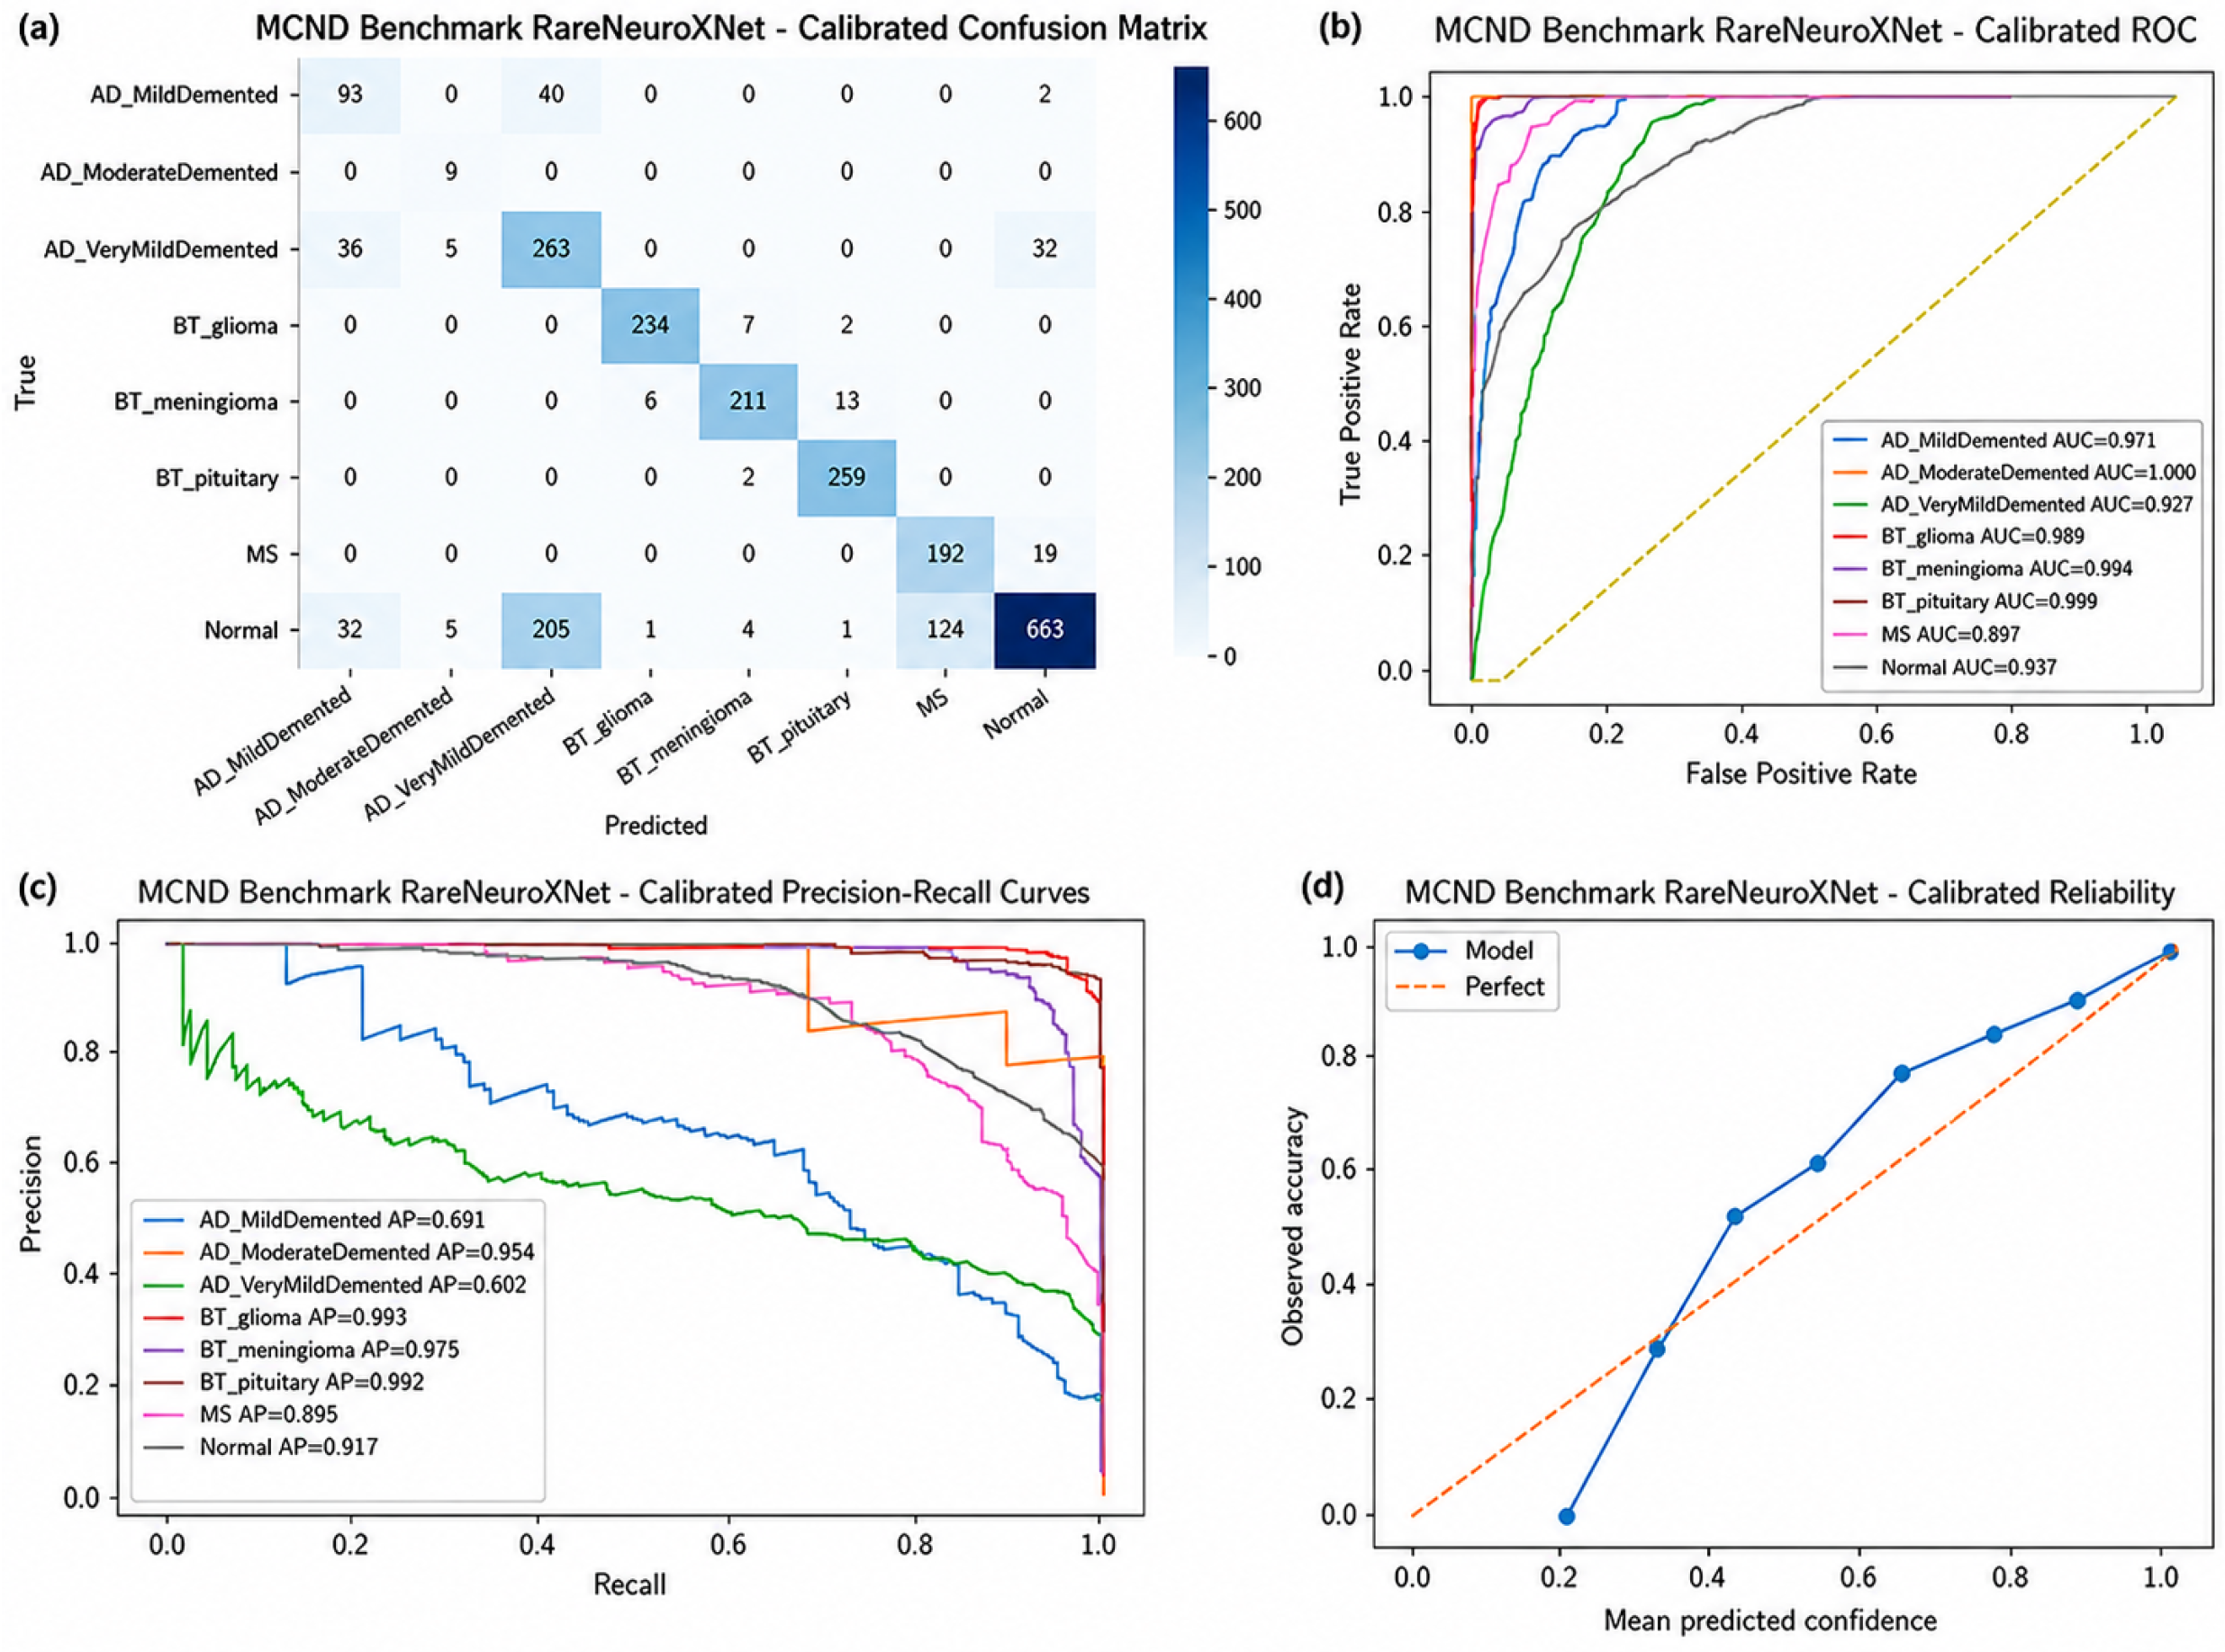
The results of the calibrated performance of RareNeuroXNet on the MCND cross-dataset neurological MRI benchmark are shown in
Figure 10. The eight MCND classes are AD-mild demented, AD-moderate demented, AD-very mild demented, BT-glioma, BT-meningioma, BT-pituitary, MS, and normal; and the corresponding confusion matrix is shown in Panel (a). The one-vs.-rest ROC curves are plotted in (b), the precision–recall curves in (c), and the reliability diagram in (d), which shows the agreement between the predicted confidence and the actual accuracy. These plots show classification behavior, class separability, PP (positive predictive) performance, and calibration quality for an alternative neurological MRI classification task. The performance of RareNeuroXNet is discriminatory in several classes with high ROC-AUC and average precision values as exhibited in the MCND benchmark, especially for the brain tumor classes BT-glioma, BT-meningioma, and BT-pituitary. A high diagonal performance is also observed in the confusion matrix for these classes of tumors and for the normal class. There is, however, some confusion that can be observed in the Alzheimer’s classes, with lower precision-recall scores for certain classes of AD, particularly in the AD-MildDemented, AD-VeryMildDemented, and Normal classes. This means that the performance of the model is different for the different disease groups and that classes that differ visually and clinically continue to be a challenge. The results do not constitute same-task external validation, as MCND does not include the five rare neurological disease classes of the primary experiment.
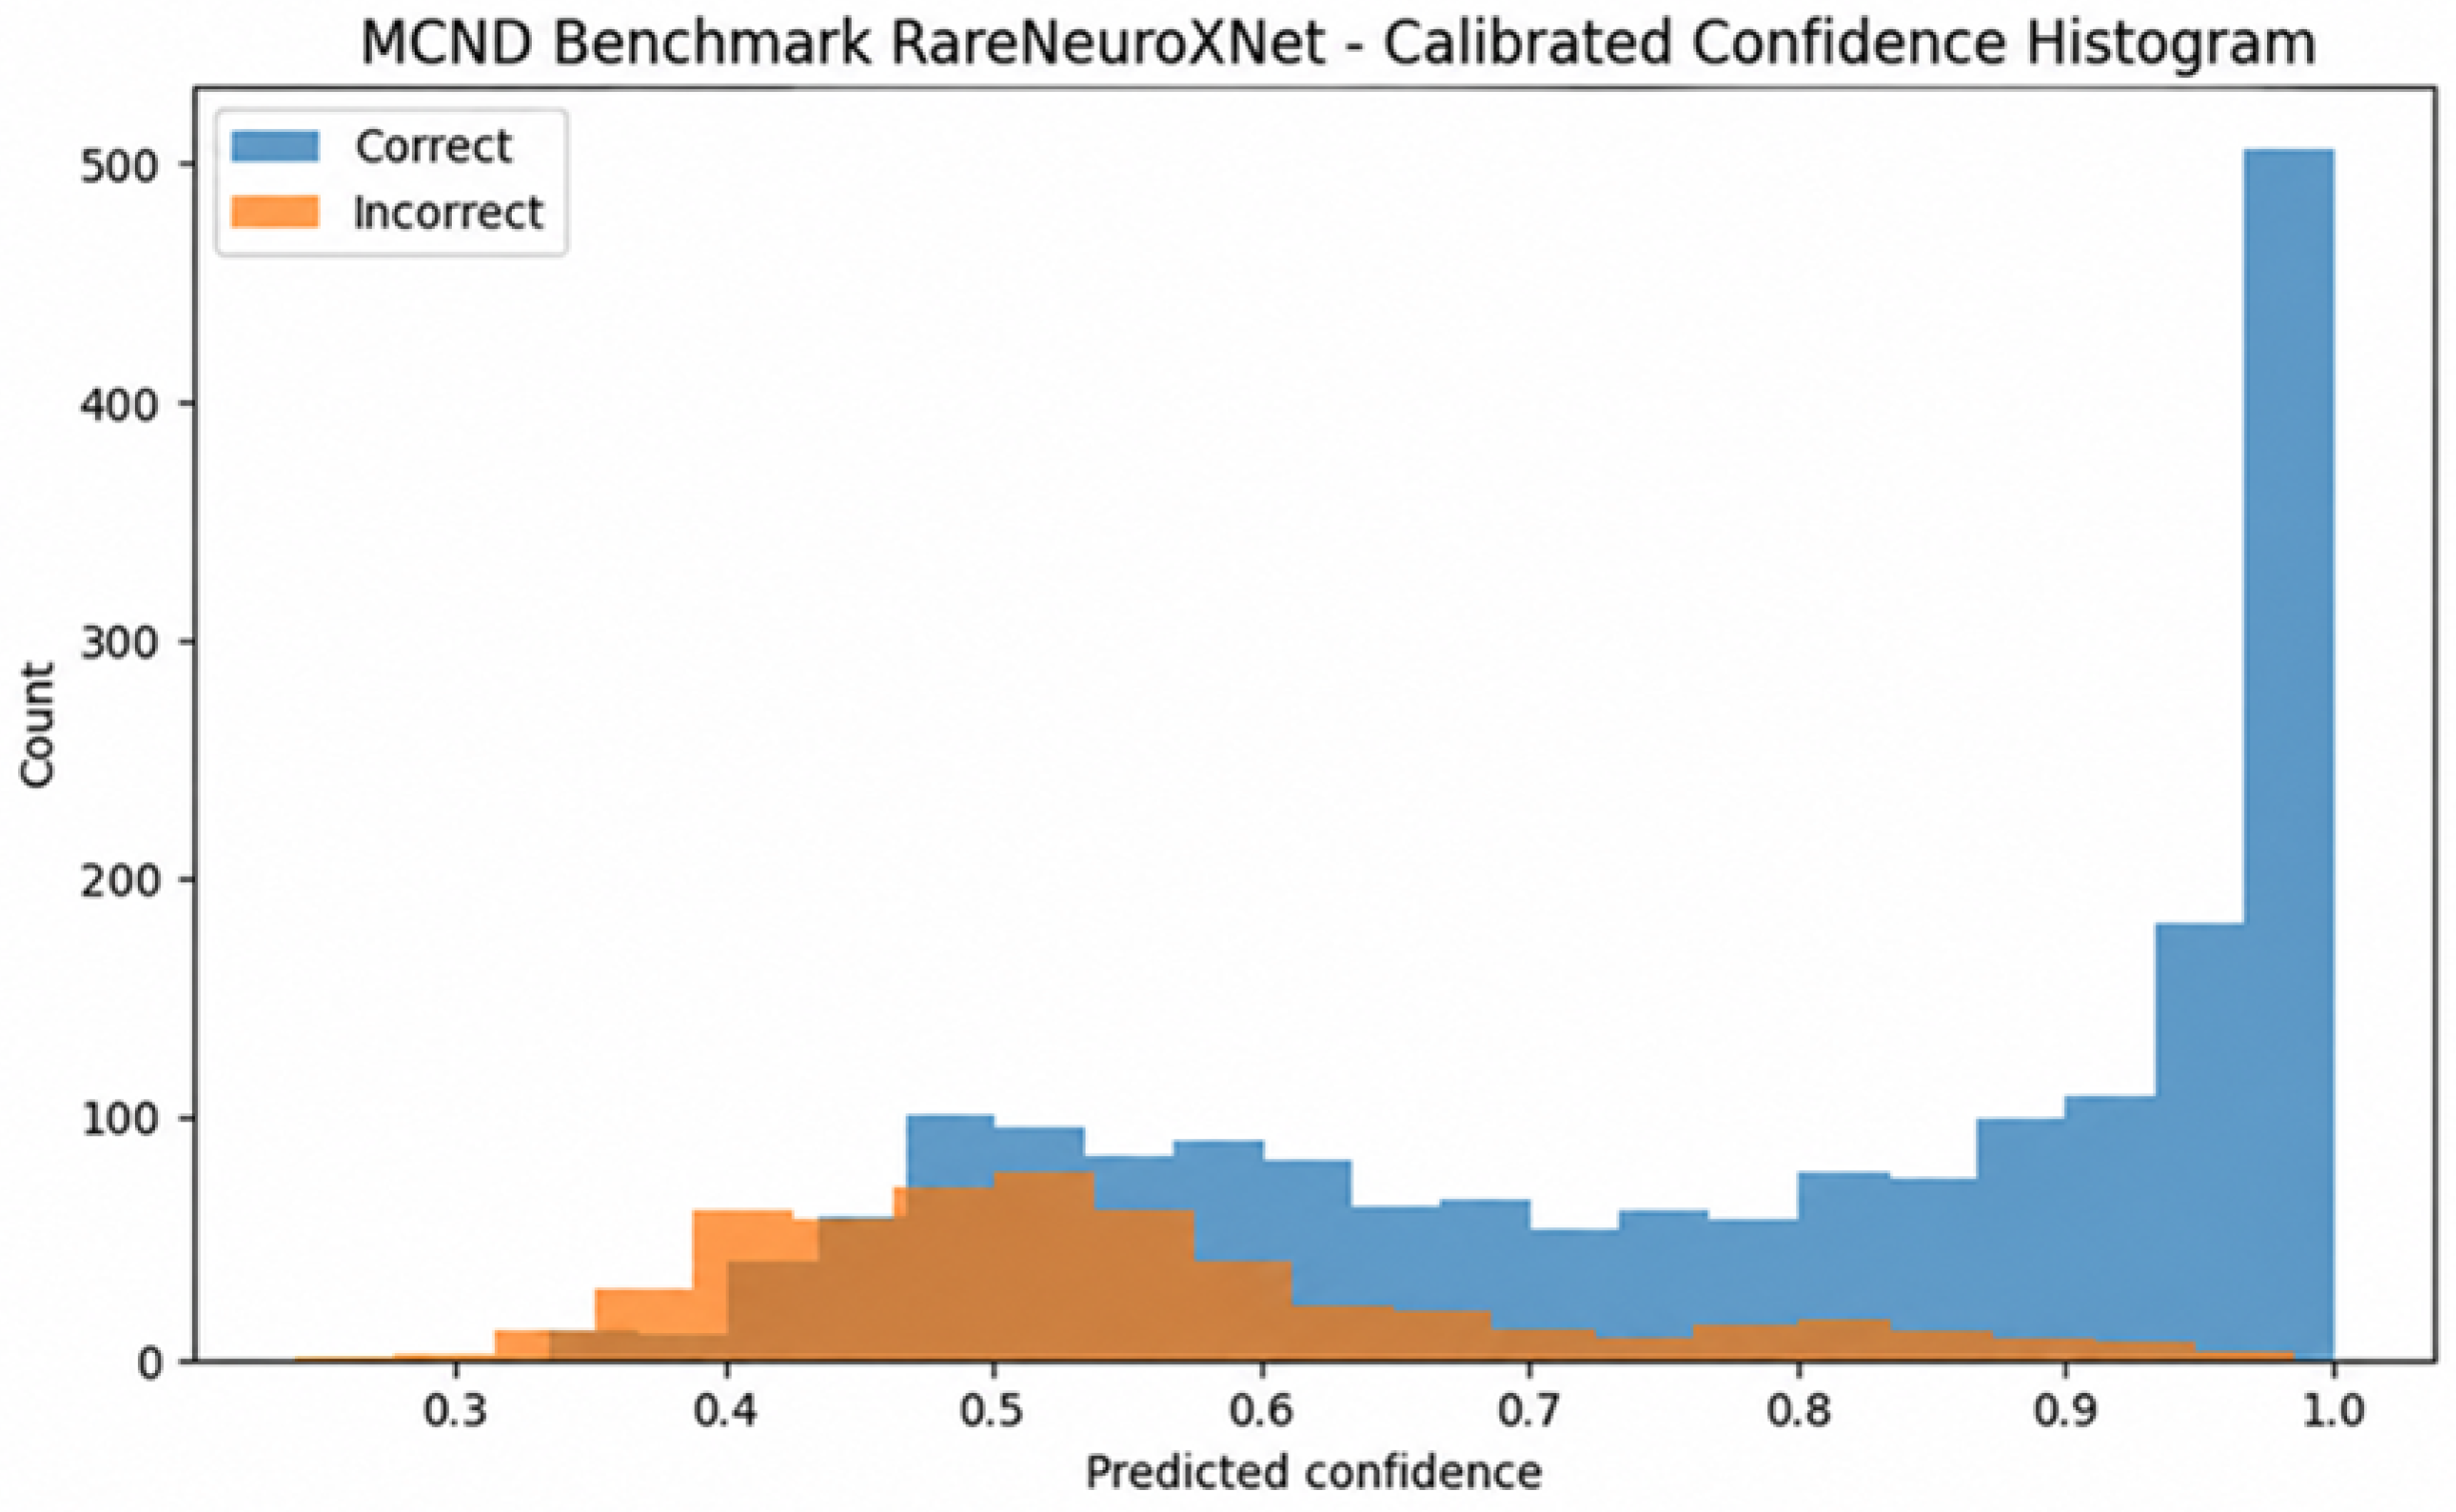
The calibrated confidence histogram of RareNeuroXNet on the MCND dataset is shown in
Figure 11, where the calibrated confidence distribution of correct predictions is compared with the distribution of the incorrect predictions. The majority of correct predictions are clustered in the high prediction confidence level, particularly near the high confidence level values, suggesting that most of the model’s high prediction confidence levels are assigned to the correctly classified MCND samples. Those predictions that are wrong, on the other hand, tend to be more concentrated in the lower-to-mid level of the range, especially at the 0.4–0.6 level, which indicates greater uncertainty for many misclassified observations. This pattern suggests good confidence behavior, as the model is typically more confident in the correct prediction and less confident in errors. Some of these mispredictions, however, at relatively high confidence levels indicate that calibration was not perfect and that overconfident errors are still possible in cross-dataset settings that are heterogeneous. Thus, the confidence behavior needs to be reevaluated in independent rare neurological disease cohorts of the same task type prior to clinical application.
4.5. Ablation Study
Table 5 shows the ablation results of RareNeuroXNet after performing ablation on the original model and four variants, which are noFFT, noCBAM, weightedFusion, and noLocal, respectively. All the above values were excellent in the full model, in which accuracy, precision, recall, and F1-score were 0.99 with ROC-AUC and PR-AUC values of 1.00 and also having favorable calibration with ECE of 0.01 and NLL of 0.03. The test results showed that the full RareNeuroXNet configuration achieves the highest classification accuracy, discriminative power, and probabilistic confidence. The weightedFusion variant obtained slightly lower but still high accuracy, precision, recall, and F1-score values of 0.98, with the ROC-AUC and PR-AUC values of 1.00 demonstrating that other fusion strategies might also be effective to fuse the branch-specific representations. The accuracy and F1-score decreased to 0.97 and 0.96, respectively, when both the FFT branch and the CBAM module were removed, and both variants showed ROC-AUC and PR-AUC values near 1.00, suggesting that the model resulted in good class separation even without these auxiliary components. Thus, FFT and CBAM seem to offer valuable refinement and incremental performance benefit over and above being the only boosters for model performance. Conversely, when the local branch was removed, the noLocal variant had a significant drop in accuracy, precision, recall, F1-score, ROC-AUC, and PR-AUC (0.35, 0.38, 0.35, 0.31, 0.73, and 0.43, respectively). The calibration metrics also became very poor; ECE went up to 0.06 and NLL to 1.43 with unreliable prediction confidence in the absence of local discriminative features. The overall ablation tells that all components help the final model, with the biggest impact being the local branch for the performance and the supportive refinements being the FFT and CBAM. But the improvement is not significantly different between the full, noFFT, noCBAM, and weightedFusion variants, so these improvements should be interpreted cautiously and confirmed through additional fold-wise statistical comparisons and larger independent datasets.
4.5.1. Fold-Wise Statistical Comparison of Ablation Variants
Table 6 provides a summary of the mean and standard deviation for the fivefold cross-validation results of the full RareNeuroXNet model, its ablation variants, and the DenseNet121 baseline (local-only model). The full model of the RareNeuroXNet demonstrated the highest image-level benchmark accuracy (0.9924 ± 0.0061) and macro-F1 score (0.9924 ± 0.0061), showing high classification performance and stable performance across folds. It was also the best-performing model in terms of discrimination, with a macro ROC-AUC score of 0.9998 ± 0.0002 and a macro PR-AUC score of 0.9992 ± 0.0007. Ablation variants and the baseline model performed poorly in terms of calibration, achieving ECE of 0.0074 ± 0.0013 and 0.0079 ± 0.0023, respectively, and NLL of 0.0428 ± 0.0313 and 0.0466 ± 0.0228, respectively, indicating that they made poorer predictions of the true probabilities associated with the underlying image-level labels.
Based on the results and the ablation, it can be seen that the local branch mainly affects the performance of the model. The removal of the local branch resulted in the most significant loss of accuracy (0.3412), macro-F1 (0.2779), ROC-AUC (0.6665), and PR-AUC (0.3610). The noLocal variant also exhibited the poorest calibration and ranked as the variant with the highest ECE (0.1077) and NLL (1.5574). The results indicate that the most discriminative information is contained in the evaluated benchmark in the fine-grained local MRI features. On the other hand, the removal of the FFT branch resulted in a less significant performance drop, with the noFFT variant obtaining a higher accuracy of 0.9206 and a higher macro-F1 of 0.9200. Likewise, the removal of CBAM had a more definite effect on performance than the removal of FFT, particularly in calibration, where ECE has deteriorated to 0.0661 and NLL to 0.3471. Thus, FFT and CBAM are described here as components of refinement in support of, but not on their own contributing to, the dominant role of the standard. The overall performance of the model was evaluated using DenseNet121 as the local-only baseline, which showed that the complex multi-view model outperforms the DenseNet121 model in terms of classification, discrimination, and calibration performance, substantiating the benefits of the larger multi-view model while affirming the most significant contribution made by the local branch.
Table 7 reports the five-fold cross-validation results of the complete RareNeuroXNet model, its ablation variants, and the DenseNet121 local-only baseline. The full model achieved consistently high image-level performance in all folds, with accuracy between 0.9853 and 1.0000 and macro-F1 between 0.9851 and 1.0000. It also exhibited very high discrimination scores with ROC-AUC and PR-AUC of 0.9998 and 0.9992, respectively, and low calibration errors across folds with ECE between 0.0000 and 0.0100 and NLL between 0.0100 and 0.0500.
The performance drop of the ablation variants was found to be different from the full model. The relatively competitive classification and discrimination ability of the noFFT variant showed that the loss of the frequency branch led to a slight (but not significant) degradation. The noCBAM variant demonstrated a more pronounced decrease in accuracy, macro-F1, PR-AUC, and calibration quality, indicating that attention-based feature refinement helps to create model stability and quality. The results of the weighted fusion variant were also competitive, although it was inferior to the full model in most folds. The noLocal variant had the largest loss of accuracy (0.2794–0.3794) and macro-F1 (0.2100–0.3440), with significantly lower ROC-AUC and PR-AUC values and significantly higher NLL values. It affirms the local branch has the highest predictive power in terms of the model’s discriminative power. The classification, discrimination, and calibration performance of the full RareNeuroXNet model showed statistically significant improvement for all folds compared with the DenseNet121 local-only baseline model. In general, the results obtained by the fold-wise approach support the effectiveness of the multi-view design and suggest that the principal performance contributor is the local branch and that FFT and CBAM are primarily providing refining support within the examined image-level benchmark.
The paired fold-wise statistical comparison of the full model RareNeuroXNet with each ablation variant is shown in
Table 8 for the five-fold cross-validation setup. The mean difference was obtained by subtracting the corresponding variant from the full model. As such, positive scores for Accuracy and F1-macro suggest that the complete model performs better at classification; negative scores for ECE and NLL suggest that the complete model performs better at calibration, as lower scores are desired for these measures. The paired
t-test results indicate that the full RareNeuroXNet model significantly outperforms all variants of the ablation model, as well as the local-only baseline model DenseNet121, for the classification and calibration metrics reported. The full model outperformed noFFT in terms of accuracy and F1-macro and outperformed noFFT and the model without the FFT branch in terms of ECE and NLL, respectively, demonstrating useful, complementary frequency-domain information from the FFT branch. Likewise, for no CBAM, the results were significantly better in the performance and calibration metrics, reflecting the effectiveness of attention-based feature refinement in CBAM. The full model also outperformed the model with weighted fusion, as this experiment demonstrated that the fusion strategy used achieved a better overall balance between classification performance and calibration. The largest differences were noted for the noLocal variant, where the local branch was removed, resulting in significant reductions of accuracy and F1-macro and significant losses of calibration. This validates that the local branch is the major contributor to RareNeuroXNet performance. The full model, compared to DenseNet121 local-only, also achieved significant gains in accuracy, F1-macro, ECE, and NLL, demonstrating that the wider multi-view design is beneficial beyond a single local backbone. The Wilcoxon
p-values were still at 0.0625, however, which is likely due to the few folds included; statistical results must be interpreted with caution and are considered supportive rather than definitive evidence of patient-level clinical superiority.
4.5.2. Grad-CAM Visual Explainability
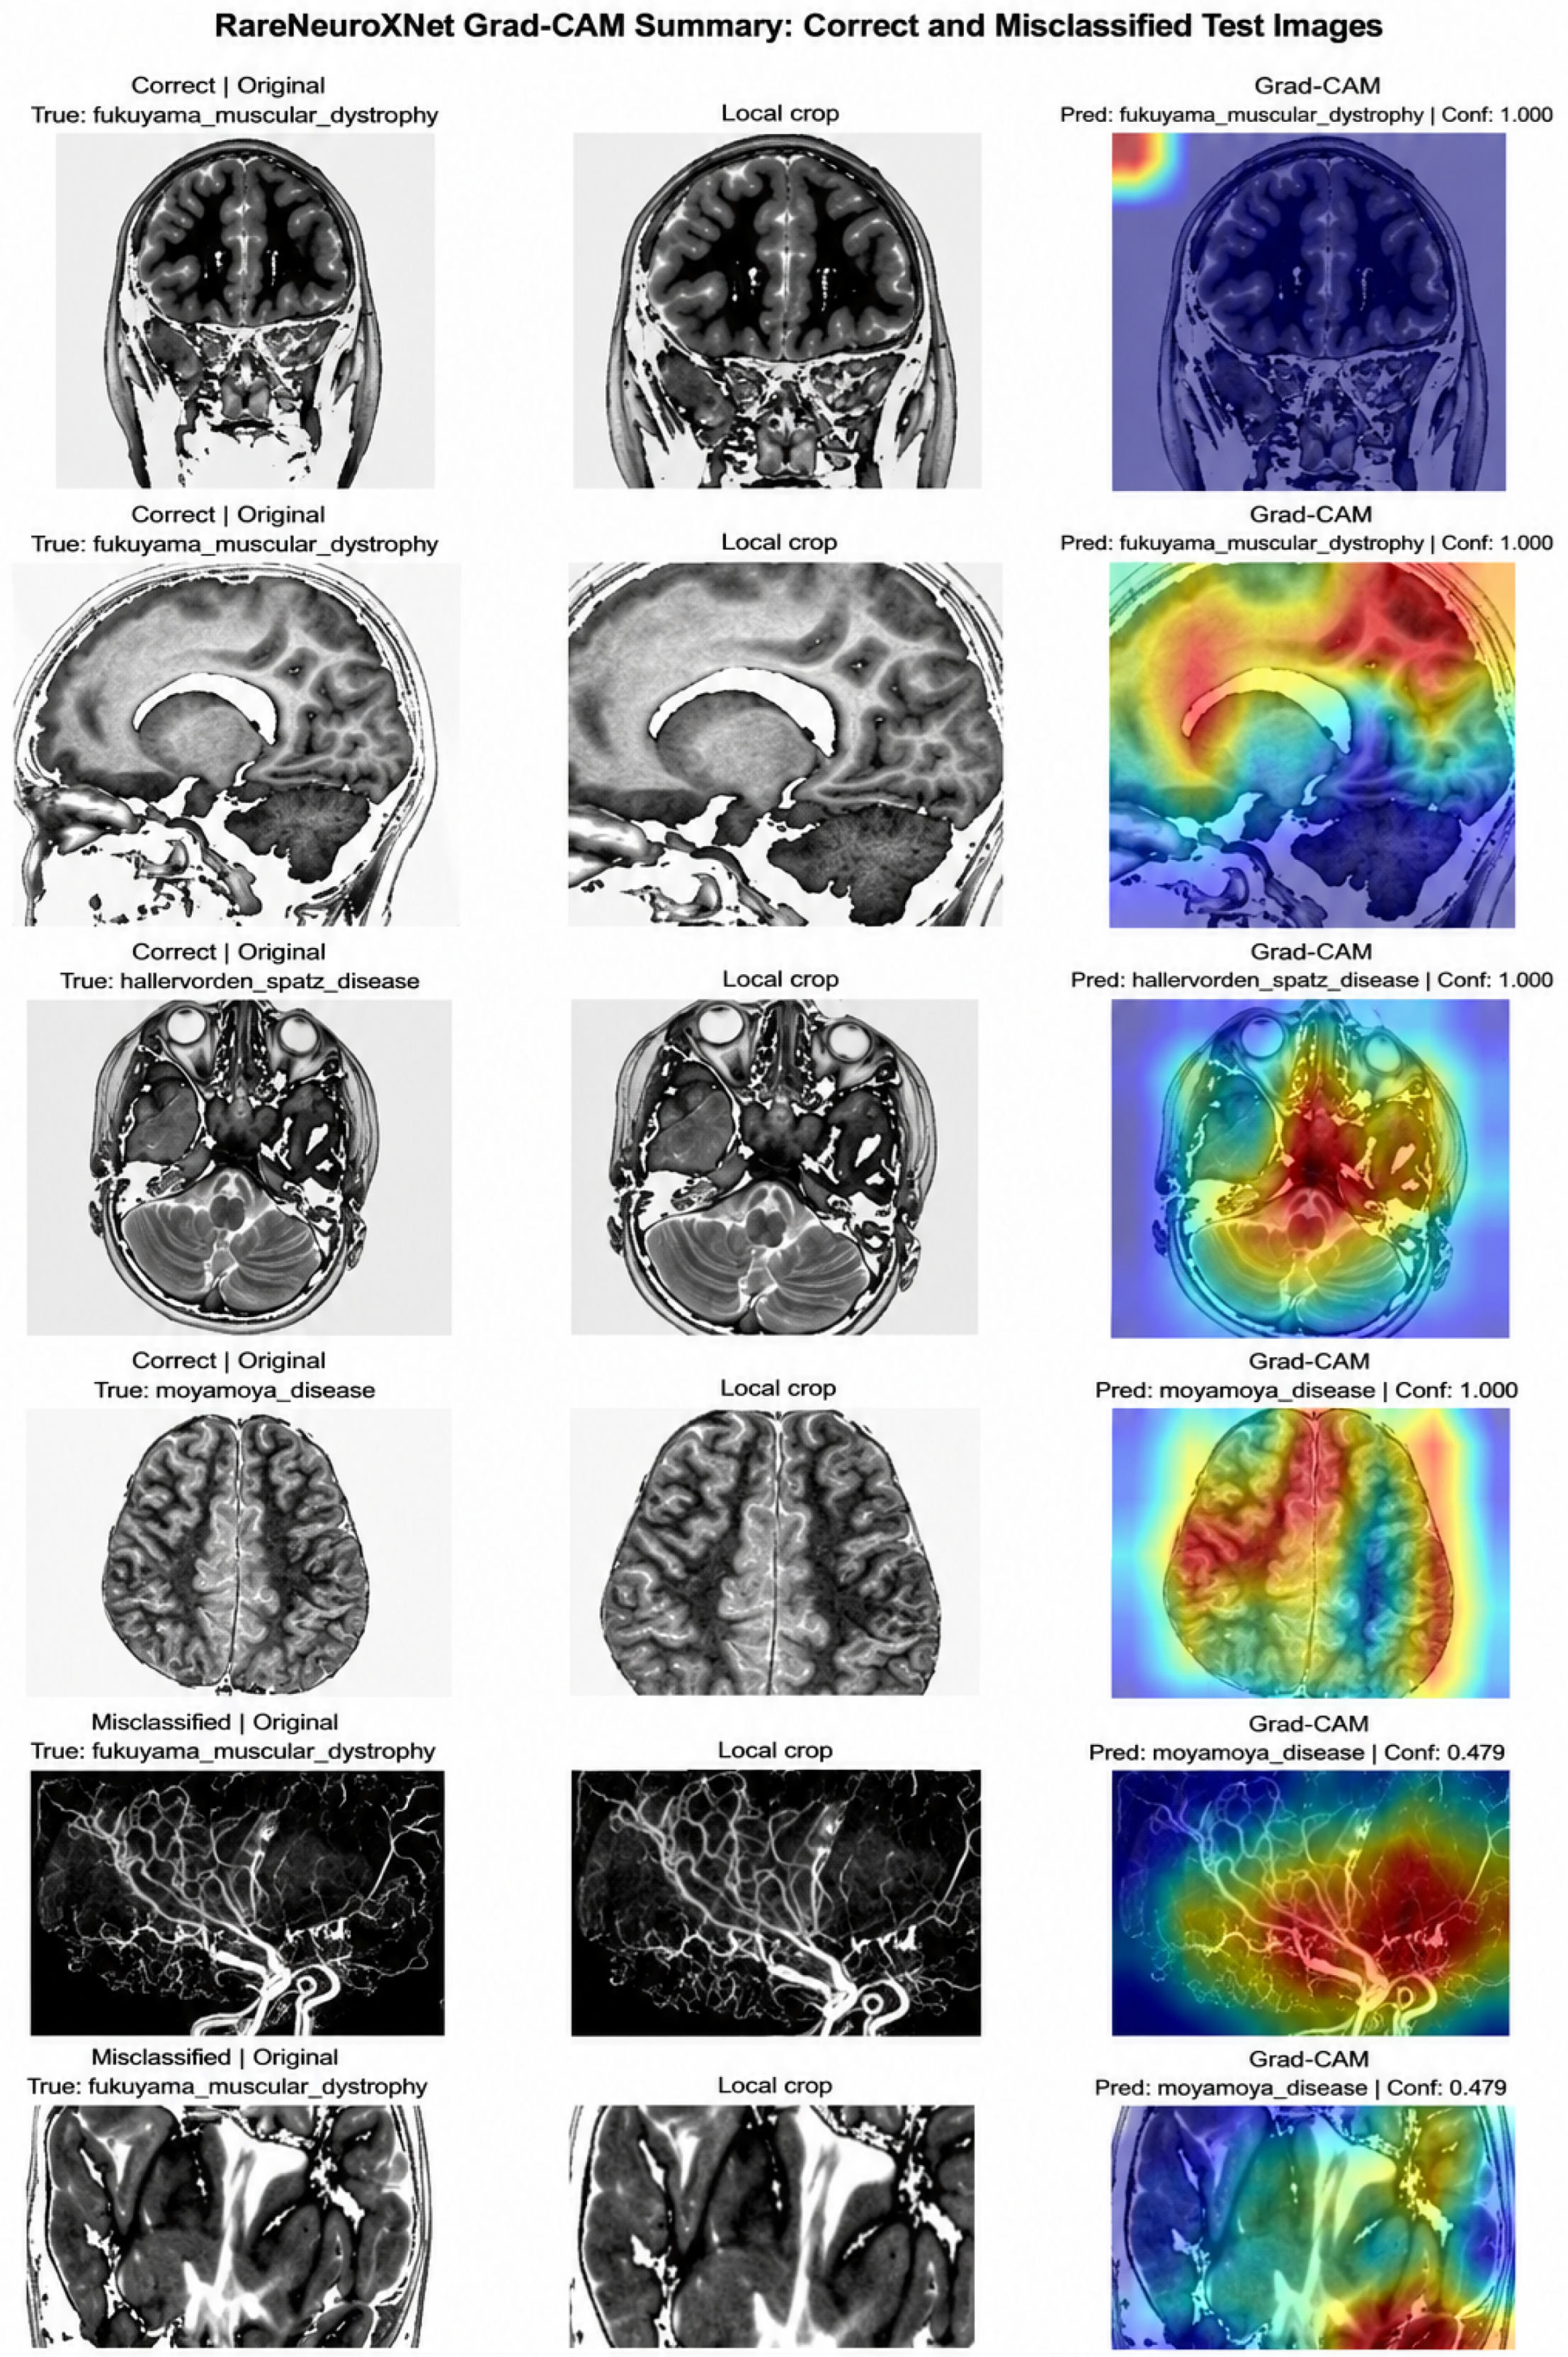
Grad-CAM was used to provide qualitative insight into the decision behavior of RareNeuroXNet. Heatmaps were generated for representative correctly classified and misclassified test images by backpropagating class-specific gradients to the final convolutional feature maps. The purpose was to examine whether the model relied on localized intracranial regions rather than non-informative areas such as image borders, background, skull regions, or preprocessing artifacts. As shown in
Figure 12, correctly classified examples generally highlighted structurally informative brain regions, supporting the importance of local feature learning observed in the ablation study. In contrast, the misclassified example showed a more diffuse activation pattern and lower prediction confidence, suggesting greater uncertainty in the model decision. Although these visualizations provide useful interpretability evidence, Grad-CAM remains qualitative and does not confirm clinical correctness. Future work should include expert radiological review and complementary explainability methods such as saliency maps or occlusion sensitivity.
Figure 12 shows representative visualizations of Grad-CAM for correct and incorrect predictions of the proposed model RareNeuroXNet on the test set. Each row presents the original MRI image, the local image cropped by the local branch, and the Grad-CAM heatmap applied to the cropped image. Examples are correctly classified cases of Fukuyama muscular dystrophy, Hallervorden–Spatz disease, and Moyamoya disease, as well as a misclassified case in which an image of Fukuyama muscular dystrophy was classified as Moyamoya disease. The warmer colors represent areas that were more strongly affiliated with the predicted class, and the cooler colors represent lower affiliation.
The visualizations from the Grad-CAM method give qualitative information about the decision-making process employed by RareNeuroXNet. For the well-classed examples, the heatmaps typically focus on the local intracranial regions and structurally informative brain areas and not just on the image borders and/or background regions. This is consistent with the ablation results, which demonstrated the most important part of the model for the local branch. The highlighted areas differ in anatomical view and disease classes, indicating that the model relies on small-scale structural and textural detail for its prediction. For instance, the examples correctly classified as Hallervorden–Spatz and Moyamoya demonstrate focus on the center of the image or the area relevant to the disease, whereas the local crop assists in highlighting the brain area of interest instead of the background of the image. The misclassified example exhibits more irregular behavior: although the model is still able to mark out salient anatomical regions, the focus is less concentrated and partially in anatomical regions that more or less clearly correspond to the actual class-specific pattern. It also has a lower CV than the correctly classified examples, indicating more uncertainty. Overall, the number aligns with the potential interpretability of the proposed local-feature learning strategy; however, Grad-CAM is still a qualitative tool and should be used with caution. The areas of interest should be reviewed by an expert radiologist to confirm the presence of clinically significant disease patterns.
4.5.3. Baseline Comparison
A variant of the standard architecture was also proposed, and several baseline models were trained with the same dataset partition, input resolution, augmentation strategy, optimizer settings, and evaluation protocol to assess whether the proposed multi-branch design offers a meaningful advantage over the standard architectures. EfficientNetB0, DenseNet121, ResNet50, local-crop-only DenseNet121, and ViT-small transformer baselines were used. This comparison allows RareNeuroXNet to be compared to conventional CNN backbones, as well as to architecture relying on attention, while maintaining the same experimental conditions. The same metrics—accuracy, macro F1 score, macro AUROC, macro AUPR, ECE, and NLL—were used to evaluate all models.
The internal baseline comparison was performed on the curated rare neurologic disease MRI dataset using the same evaluation protocol, and the results are presented in
Table 9. RareNeuroXNet outperformed the other models compared in terms of accuracy, macro-F1, macro-AUC, macro-AUPR, ECE, and NLL with values of 0.992380, 0.992360, 0.999780, 0.999240, 0.005220, and 0.027560, respectively, which shows that it has strong discriminative performance and good reliability in making probabilistic predictions. DenseNet121 local-only was the closest competing model, achieving an accuracy of 0.989400, macro-F1 of 0.989380, macro-AUC of 0.999300, and macro-AUPR of 0.998380. The ablation results demonstrate that the local branch has the most significant impact on the performance of DenseNet121, which fits with the small gap of RareNeuroXNet and DenseNet121 local-only in the local-only setting. The DenseNet121 model achieved a high accuracy of 0.976667, a macro-F1 score of 0.976638, a macro-AUC of 0.989847, and a macro-AUPR of 0.989402 as well, demonstrating the effectiveness of DenseNet-based representations for this task. EfficientNetB0 and ViT-Small Transformer, however, achieved significantly lower performance scores with accuracies of 0.346667 and 0.250000, respectively, and macro-F1 of 0.345708 and 0.166961, respectively. These less favorable results could be caused by a lack of compatibility of these architectures with the current dataset features or with the training setup or with the distribution of the features of the images in the dataset. In total,
Table 6 indicates that DenseNet121 local-only is not far behind RareNeuroXNet of the full multi-branch architecture, suggesting this considerable local contribution to predictive performance. Hence, the roles played by the global or FFT branches need to be taken with a pinch of salt, and the small gap between RareNeuroXNet and DenseNet121 local-only requires fold-wise paired statistical testing before being declared as a clear statistical superiority.
4.5.4. Paired Cross-Validation Comparison with the DenseNet121 Local-Only Baseline
Table 10 shows the performance of RareNeuroXNet, that compared with DenseNet121, the local-only baseline model, with the same five-fold cross-validation methodology. The classification and discrimination results for both models were very good, with the mean values being slightly higher for RareNeuroXNet. RareNeuroXNet obtained an accuracy, macro-F1, weighted-F1, precision macro, and recall macro of 0.9924 ± 0.0061, while DenseNet121 local-only obtained an accuracy, macro-F1, weighted-F1, precision macro and recall macro of 0.9894 ± 0.0045, 0.9896 ± 0.0044, and 0.9894 ± 0.0045, respectively. The discrimination metrics followed the same trend, with RareNeuroXNet achieving a macro-AUC of 0.9998 ± 0.0002 and a macro-AUPR of 0.9992 ± 0.0007, compared with 0.9993 ± 0.0008 and 0.9984 ± 0.0017 for DenseNet121 local-only, respectively. The results indicate that using the proposed multi-branch architecture along with local, global, and frequency-aware representations leads to a slight boost in classification accuracy and class separability. The calibration metrics also favored RareNeuroXNet, which achieved a lower ECE of 0.0052 ± 0.0029 and a lower NLL of 0.0276 ± 0.0159, compared with 0.0096 ± 0.0042 and 0.0460 ± 0.0146 for DenseNet121 local-only. This means that RareNeuroXNet had more accurate probability estimates and more accurate confidence calibration on all folds. Overall, the comparison revealed that RareNeuroXNet performed best on the mean of classification, discrimination, and calibration values, but DenseNet121 local-only was still a competitive baseline. Thus, the improvement of the complete RareNeuroXNet design is to be taken in the light of the strength of a good local feature extractor, not as a large performance increase, and the slight differences observed should be interpreted in the context of fold-wise paired statistical tests to assess whether these differences are statistically significant.
The paired fold-wise statistical comparison of RareNeuroXNet and a local-only baseline (DenseNet121) over the same five folds of cross-validation is reported in
Table 11. The mean difference was defined as RareNeuroXNet – DenseNet121 local-only; therefore, positive values indicate higher classification performance for RareNeuroXNet, whereas negative values for ECE and NLL indicate lower calibration error and uncertainty for RareNeuroXNet. RareNeuroXNet achieved slightly higher mean values for the main classification metrics, improving accuracy from 0.9894 to 0.9924, macro-F1 from 0.9894 to 0.9924, weighted-F1 from 0.9894 to 0.9924, precision macro from 0.9896 to 0.9924, and recall macro from 0.9894 to 0.9924. The discrimination metrics also showed the same trend, with a rise from macro-AUC = 0.9993 to 0.9998, and macro-AUPR = 0.9984 to 0.9992. The improvements were modest, however, with the classification metric improvements being around 0.0028–0.0030, the macro-AUC improvement being around 0.0005, and the macro-AUPR improvement being around 0.0009. All
p-values for accuracy, macro-F1, macro-AUC, macro-AUPR, weighted-F1, precision macro, and recall macro were greater than 0.05 for the paired
t-test and Wilcoxon signed-rank test, and the results did not turn out to be statistically significant across the five folds. RareNeuroXNet, on the other hand, indicated more improvements in terms of calibration metrics. The ECE decreased from 0.0096 to 0.0052, with a mean difference of −0.0044, and NLL decreased from 0.0460 to 0.0276, with a mean difference of −0.0185. These negative differences are good for RareNeuroXNet, as they reflect a lower probability of calibration error and lower prediction uncertainty. Both the ECE and the NLL exhibited statistically significant differences with the local-only baseline, with
p = 0.0416 and
p = 0.0369, respectively, indicating better calibration. In both cases, however, Wilcoxon
p-values of 0.1250 were not statistically significant.
Table 8 shows that RareNeuroXNet, overall, had slightly superior mean classification, discrimination, and calibration performance compared to DenseNet121 local only, and the mean improvement in classification was small but non-statistically significant. The greatest benefit seen from RareNeuroXNet was during calibration, in support of the usefulness of the proposed multi-branch architecture for probabilistic reliability and in line with DenseNet121 local-only being a good baseline. These results should be interpreted with caution, as there are few folds, and they must be confirmed with larger datasets and external validation cohorts.
4.6. Discussion
The experimental results indicate that RareNeuroXNet achieved strong performance within a controlled image-level benchmark for rare neurological disease MRI classification. The classification results of the model were high and stable throughout the fivefold cross-validation experiments, with the accuracy, macro precision, macro recall, macro F1 score, and weighted F1 score ranging from 0.98 to 1.00. This stability was further confirmed by the mean cross-validation results, which showed that the accuracy of RareNeuroXNet was 0.9924 ± 0.0061, the macro F1-score was 0.9924 ± 0.0061, and the weighted F1-score was 0.9924 ± 0.0061. Also, there was high class separability for the ROC and PR analyses with macro AUROC and macro AUPR values of 0.9998 ± 0.0002 and 0.9992 ± 0.0007, respectively. These results indicate that the proposed multi-branch architecture is able to obtain highly discriminative image-level representation learning from the curated rare neurological MRI dataset.
But the near-perfect in-house performance must be interpreted cautiously. The main data set is curated, balanced, and evaluated at the image level. The input MRI data can be significantly different in terms of scanner make, acquisition protocol, field strength, image quality, slice selection, disease stage, and patient population. Furthermore, the public data set was not complete and did not contain full patient identifiers, and strict patient-level separation was not fully confirmed. Hence, it is possible to have an inflated performance estimate if correlated images, duplicate images, or almost identical images for the same subject are spread over multiple folds. Therefore, the reported results are to be viewed as a measure and index of good internal image-level benchmark performance and not as definitive evidence of patient-level or clinical generalization.
One good thing about this evaluation is that it consisted not just of the usual classification metrics, but also of probability-based reliability analysis. RareNeuroXNet achieved low calibration error, with an ECE of 0.0052 ± 0.0029 and an NLL of 0.0276 ± 0.0159. The values in the table indicate that the confidence estimates given by the model were well in line with the observed class labels in the evaluated benchmark. This is crucial since the goal of a medical image classification model is not only to correctly predict the class but to produce meaningful confidence estimation as well. However, calibration is susceptible to domain shift, and confidence behavior might shift if the model is deployed to images that were collected from a different institution, scanner, or protocol. So, recalibration and validation on the external patient level and multi-center datasets are still required prior to clinical translation.
The ablation analysis allowed us to gain insights into the relative contribution of the architectural components. The best accuracy, precision, recall, and F1 were obtained with the full RareNeuroXNet model, with accuracy, precision, recall, and F1 scores of 0.99 and ROC-AUC and PR-AUC scores of 1.00. The accuracy and F1-score dropped to 0.97 and 0.96, respectively, after removing the FFT branch and CBAM branch, respectively. The accuracy, precision, recall, and F1-score for the weighted fusion variant were competitive, at 0.98. The results indicate that FFT and CBAM can be helpful refinement and incremental improvements. Removal of the local branch, however, resulted in a significant drop in accuracy of 0.35, an F1 score of 0.31, an ROC AUC of 0.73, and a PR AUC of 0.43. The no-local variant also had weaker calibration, with calibration ECE rising to 0.06 and NLL rising to 1.43. The results validate that the local branch is the most powerful part of RareNeuroXNet for this tested dataset, whereas the global and FFT branches contribute comparatively less.
This is corroborated by the internal baseline comparison. Overall, RareNeuroXNet achieved the highest accuracy (0.992380), macro-F1 (0.992360), macro-AUC (0.999780), and macro-AUPR (0.999240) among all the models. DenseNet121 local-only was the closest competing model, achieving an accuracy of 0.989400, macro-F1 of 0.989380, macro-AUC of 0.999300, and macro-AUPR of 0.998380. It again validates that DenseNet-based local feature extraction is highly informative in the selected rare classes of neurological diseases and in agreement with the ablation result, which showed that the local branch is the major contributor. DenseNet121 had excellent results, while ResNet50 had moderate-to-good results. However, some widely used architectures were not as effective as EfficientNetB0 and the ViT-Small Transformer in the given context of images and their training, highlighting the fact that not every architecture is appropriate.
The paired statistical comparison of the local-only models RareNeuroXNet and DenseNet121 indicated slightly higher mean values for accuracy, macro-F1, macro-AUC, macro-AUPR, weighted-F1, precision macro, and recall macro for RareNeuroXNet. For instance, DenseNet121 local-only achieved an accuracy of 0.9894, while RareNeuroXNet obtained an accuracy of 0.9924, and the difference between the two means and standard mean difference was 0.0030. When measured by the main classification and discrimination measures, however, the paired t-test and Wilcoxon signed-rank test did not reveal any statistically significant differences. This suggests that the classification improvement is rather small relative to the strong local-only baseline model and should not be exaggerated. As a comparison, the ECE of RareNeuroXNet reduced from 0.0096 to 0.0052, and the NLL decreased from 0.0460 to 0.0276. The paired t-test showed significant differences for ECE but not for NLL, while the Wilcoxon test did not confirm significance for either. The most consistent benefit of RareNeuroXNet seems to be increased probabilistic reliability, rather than an increased rate of correct classification.
To serve as a complementary neurological MRI benchmark, the MCND dataset was used. MCND is not an external validation set applied on the same set of rare neurological disease classes as the same task, as it comprises several different stages of Alzheimer’s disease, brain tumor classes, multiple sclerosis, and normal cases. It should thus be understood as an extra mode of evaluation and not as external validation. The MCND results revealed that the performance of the model was different for different classes of disease, with better performance for certain classes, and errors were made between similar or related classes in terms of visual similarity or clinical symptoms. This confirms that cross-dataset benchmarking is useful and highlights the need for same-task, independent external validation with other rare neurological disease cohorts.
Grad-CAM visual explanation was added to obtain qualitative understanding of the image regions that are important for model predictions. The obtained heatmaps were mostly localized in the brain areas and were structurally informative, indicating the significance of local feature learning found in the ablation analysis. But Grad-CAM is still a qualitative explanation technique that cannot judge clinical correctness by itself. Therefore, the highlighted areas should be assessed by radiology specialists to identify if they are associated with clinically relevant disease patterns. Further research should also include other complementary explainability techniques like saliency maps, occlusion sensitivity, attention visualization, and expert-guided region validation.
However, there are some restrictions in input representation and dataset design. RareNeuroXNet currently focuses on 2D MRI images instead of 3D MRI volumes. This is a design style that is suitable for the public data set that is available, but the clinical neurological diagnosis may be based on volumetric context, the distribution of lesions across slices, and multimodal MRI imaging sequences like T1, T2, and FLAIR. The fixed center crop in the local branch should also be interpreted with care, since spatial regularities according to the dataset could appear if images are, e.g., aligned or preprocessed in the same way. In the future, the authors would like to compare center cropping to brain-mask-guided crops, random local crops, artifact-controlled preprocessing, and 3D multimodal architectures.
In summary, RareNeuroXNet is a potentially promising controlled benchmark-based system for brain MRI image-level classification of rare neurological diseases. Advantages of using it are the incorporation of global, local, and frequency domain representations; calibration-aware evaluation; visual explanations using Grad-CAM; and ablation evidence of the importance of local feature modeling. However, patient-level splitting, duplicate and near-duplicate image filtering, same-task external multi-center validation, reporting confidence intervals, repeated fold-wise ablation testing, and expert-validated explainability would be needed for stronger conclusions. Additionally, future studies should also test RareNeuroXNet through a thorough evaluation protocol on a patient-level scale as compared to larger transformer-based and/or foundation-model approaches.