1. Introduction
HSCT is an established therapy for hematologic malignancies and bone marrow failure syndromes, improving survival in conditions such as multiple myeloma, lymphomas, and leukemias [
1]. However, HSCT is associated with a substantial cardiovascular burden related to cumulative cardiotoxic therapies, high-dose conditioning regimens, systemic inflammation, endothelial injury, and marked hemodynamic stress during the peri-transplant period [
2,
3,
4,
5]. Current ESC cardio-oncology guidelines therefore identify HSCT recipients as a high-risk population requiring structured cardiovascular surveillance [
6].
Early cardiovascular complications, including arrhythmias, heart failure, and subclinical ventricular dysfunction, contribute to post-transplant morbidity, particularly within the first months after HSCT [
7,
8,
9,
10,
11]. Although long-term cardiotoxicity is well described, early cardiac remodeling during the 3–6-month post-transplant period remains poorly characterized. Previous studies have largely relied on conventional markers such as left ventricular ejection fraction (LVEF) and circulating biomarkers [
12,
13,
14,
15,
16]. The cardiovascular effects observed during the peri-transplant period are multifactorial and include direct myocardial injury related to conditioning regimens, systemic inflammatory activation, endothelial dysfunction, and significant hemodynamic fluctuations due to volume shifts, anemia, and infection risk. The peri-transplant period generally refers to the interval spanning conditioning therapy through the early post-transplant phase, typically encompassing the first weeks to months after HSCT, when these factors are most pronounced.
Therefore, we performed a prospective multimodal cardiac evaluation using ECG and comprehensive echocardiography before transplantation and at early follow-up (3–6 months) to characterize compartment-specific cardiac remodeling after HSCT and explore disease-specific adaptation patterns.
2. Materials and Methods
2.1. Study Design and Population
This single-center prospective observational cohort study evaluated early structural and functional cardiac remodeling over 3–6 months in adult patients with hematologic malignancies undergoing HSCT at a tertiary academic center. All participants underwent baseline transthoracic echocardiography (TTE) and 12-lead ECG prior to transplantation, with repetition of the same protocol at 3–6 months post-transplant.
2.2. Eligibility Criteria and Study Cohort
Eligible patients were ≥18 years with histologically or cytologically confirmed hematologic malignancy, preserved baseline LVEF (≥50%), and complete baseline and follow-up TTE and ECG data. Patients were excluded if they had inadequate TTE image quality, prior HSCT, or baseline LVEF <50%. No patients with known infiltrative cardiomyopathies, including cardiac amyloidosis, were identified in the study cohort. These conditions were not present among included patients and are recognized as potential confounders of myocardial structural and functional assessments. Patients followed at external centers were not included as complete follow-up echocardiographic data at the predefined time points could not be consistently obtained, which was required for standardized paired analysis.
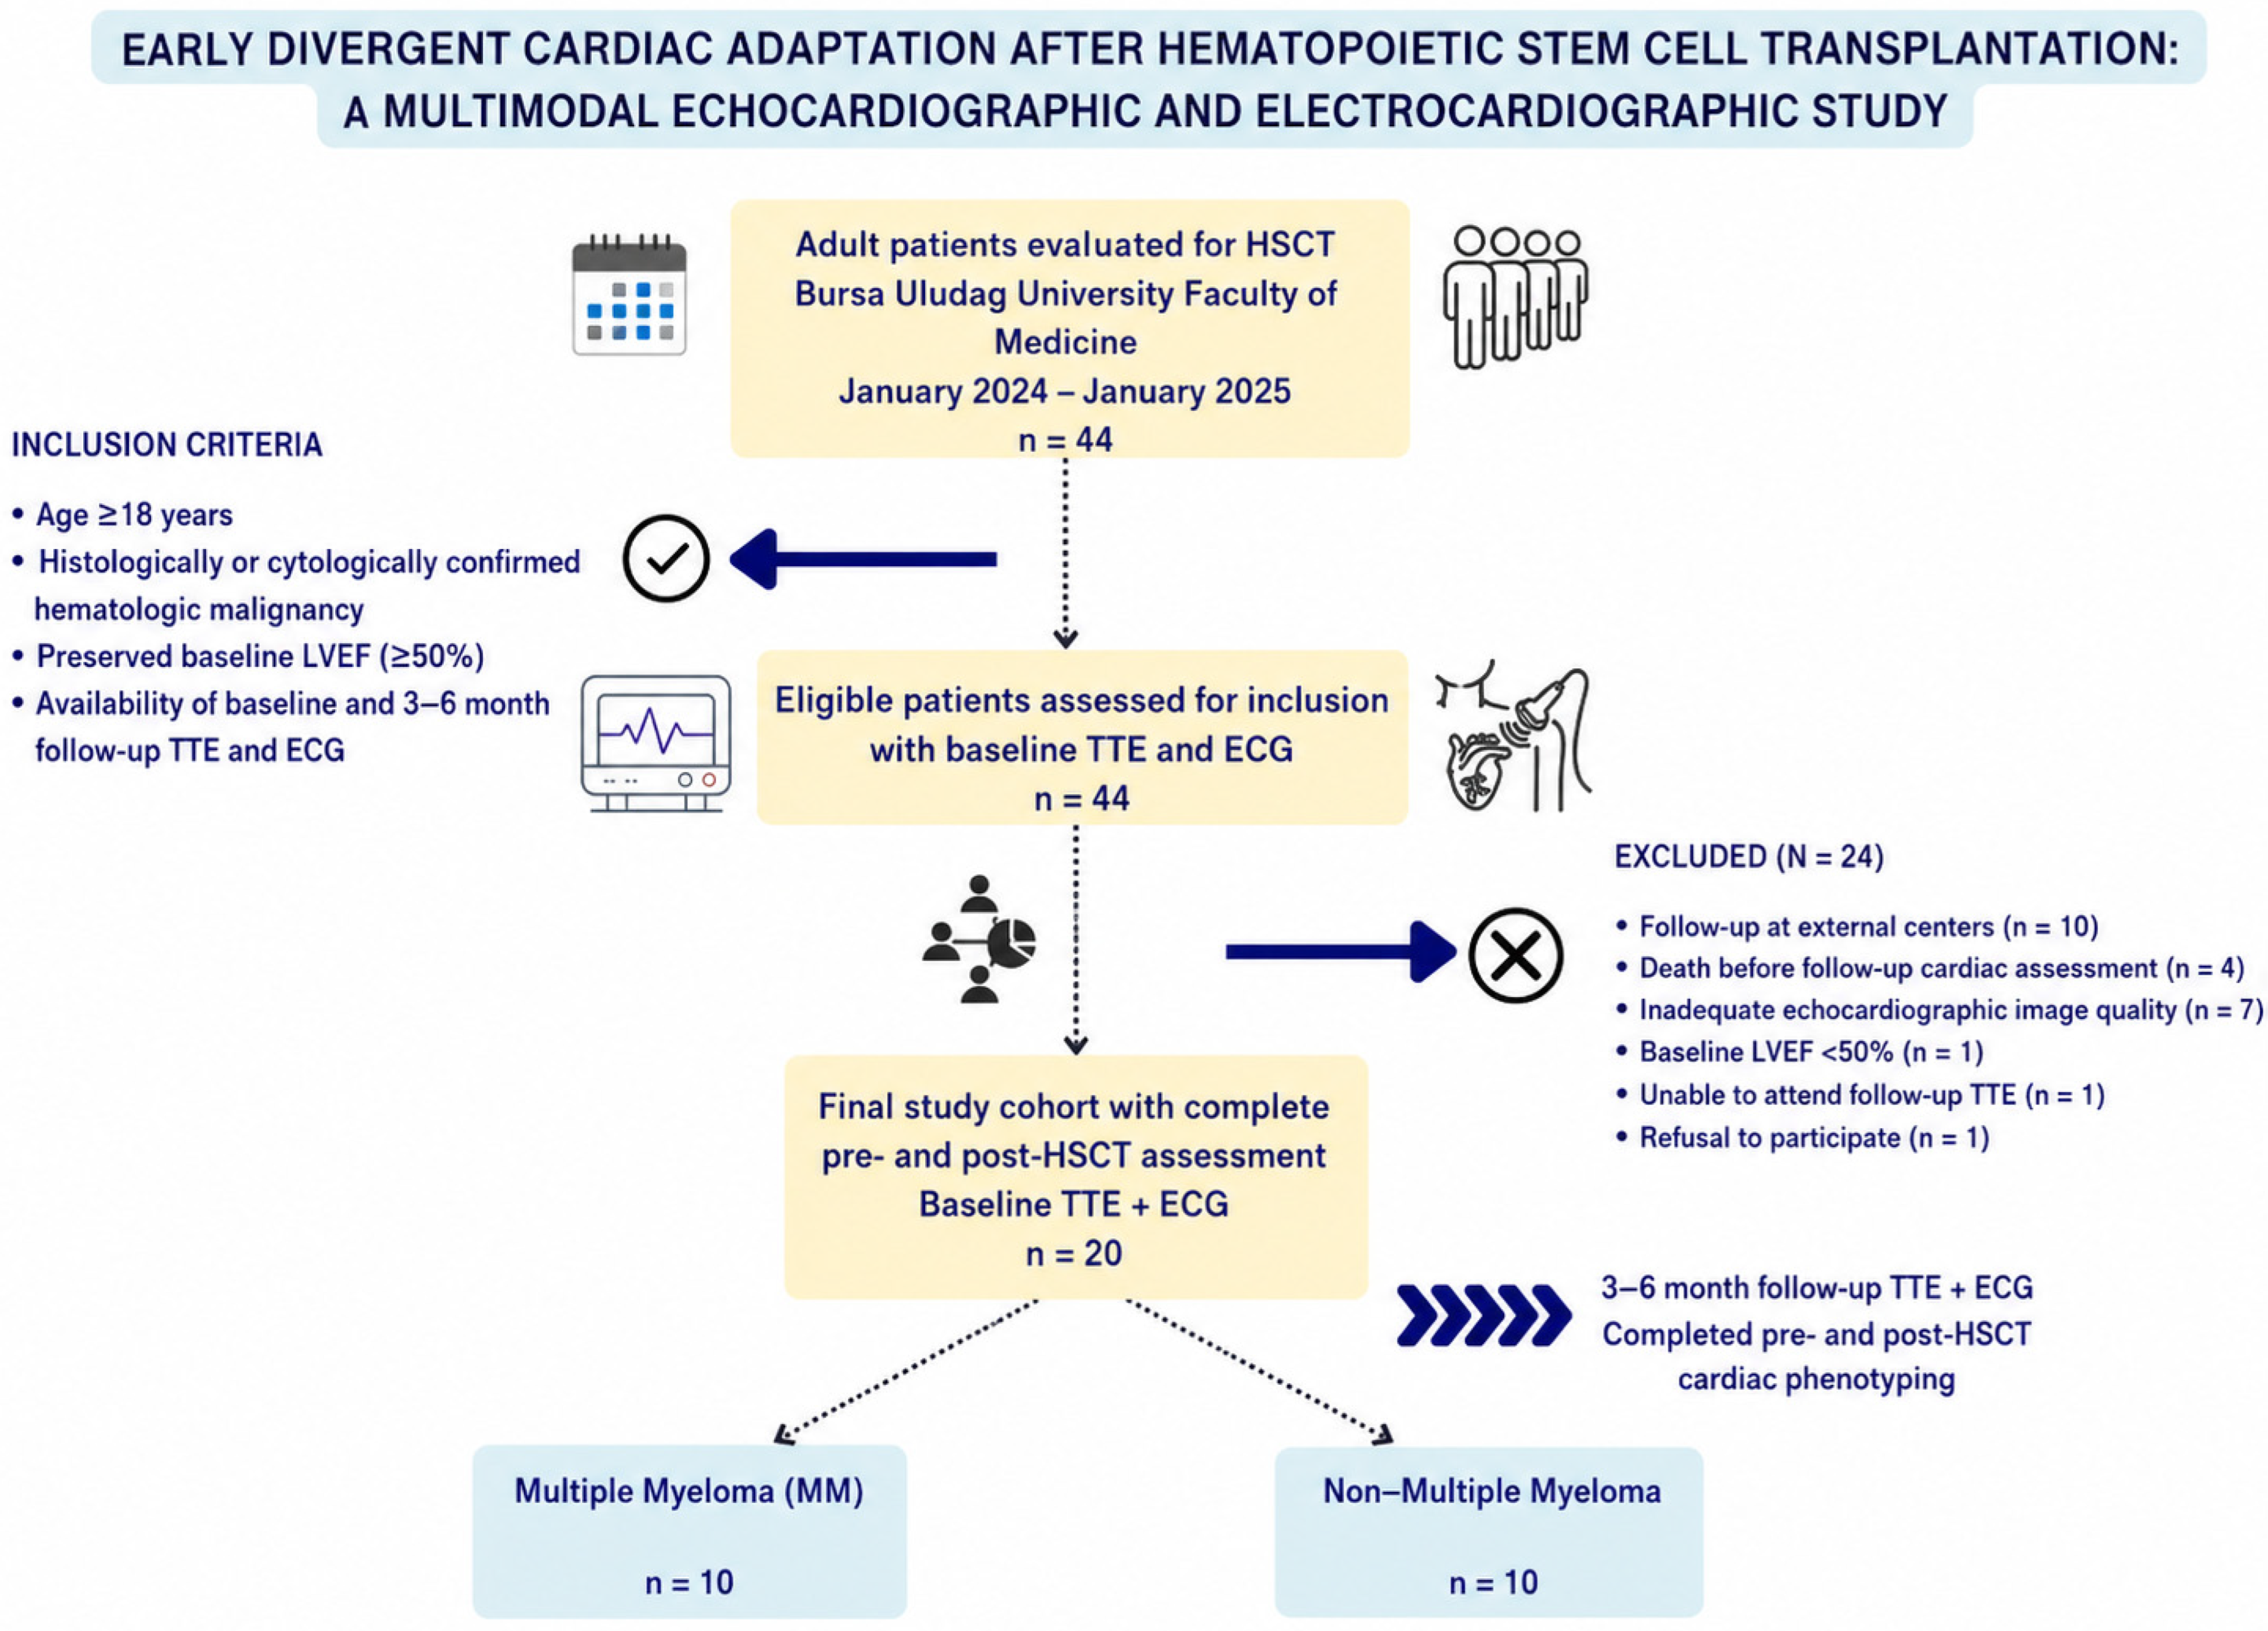
Between January 2024 and January 2025, 44 consecutive adults were screened for HSCT. Twenty-four patients were excluded due to follow-up at external centers (n = 10), death before follow-up (n = 4), baseline LVEF < 50% (n = 1), inability to attend follow-up imaging (n = 1), refusal to participate (n = 1), or inadequate image quality (n = 7). The final cohort comprised 20 patients with complete paired echocardiographic and ECG assessments (
Figure 1).
2.3. Ethics and Consent
The study protocol was approved by the Bursa Uludag University Faculty of Medicine’s Ethics Committee (Approval No: 2023-27/49) Bursa, Türkiye and conducted in accordance with the Declaration of Helsinki. Written informed consent was obtained from all participants. Analyses were performed on anonymized imaging and ECG data.
2.4. Transplant Conditioning and Post-Transplant Management
Conditioning regimens were selected according to hematologic diagnosis and institutional protocols: busulfan–cyclophosphamide for acute leukemia undergoing allogeneic HSCT, BEAM for lymphoma, and high-dose melphalan (200 mg/m2) for MM undergoing autologous HSCT.
Post-transplant granulocyte-colony stimulating factor was routinely initiated on day +5 in autologous HSCT recipients. In allogeneic HSCT, graft-versus-host disease prophylaxis consisted of cyclosporine-A and methotrexate, according to standard practice.
2.5. Transthoracic Echocardiographic Assessment
TTE examinations were performed using a GE Vivid E95 system (GE Healthcare, Horten, Norway) with a phased-array transducer under standardized resting conditions. Baseline imaging was obtained immediately before HSCT and repeated at 3–6 months, using an identical protocol in accordance with ASE and EACVI recommendations [
17].
Standard two-dimensional, M-mode, Doppler, and speckle-tracking datasets were acquired in the left lateral decubitus position and stored in DICOM format. Speckle-tracking analyses were performed at frame rates of 60–90 frames/s using vendor-independent software (TOMTEC Imaging Systems, Munich, Germany).
LVEF was calculated using the biplane Simpson method. LV dimensions, wall thickness, relative wall thickness, and geometry indices were derived from parasternal long-axis views. LV mass was calculated using ASE-corrected and Penn convention formulas with indexed values. GLS was assessed from apical two-, three-, and four-chamber views, including myocardial-layer strain when tracking quality permitted [
18].
All echocardiographic analyses were performed by experienced cardiologists using a standardized acquisition and post-processing protocol, with offline analysis and careful verification of tracking quality. While these measures reduce variability, intra- and inter-observer variability cannot be entirely excluded, particularly for deformation imaging techniques.
2.6. Left Atrial Strain Analysis
LA mechanics were assessed using speckle-tracking echocardiography according to EACVI/ASE recommendations. LA endocardial borders were traced in apical four- and two-chamber views, with automated tracking visually inspected and manually adjusted when necessary. Strain curves were R-wave-gated with zero reference at LV end-diastole, and reservoir, conduit, and contraction strain parameters were derived using standardized methodologies [
19].
2.7. Right Heart and Additional Functional Assessment
RV function was evaluated using fractional area change, RV free-wall longitudinal strain when feasible, and lateral tricuspid annular tissue Doppler velocities (S′, e′, a′), according to guideline recommendations [
18,
19]. Right atrial dimensions were measured using standard views. All analyses were performed by two experienced cardiologists blinded to clinical diagnosis and study time-point.
2.8. Echocardiographic Post-Processing
Strain and volumetric measurements were generated using automated contour detection with manual adjustments to ensure accurate endocardial delineation. Only segments with adequate tracking were included in the analysis.
2.9. Electrocardiographic Assessment
Standard 12-lead ECGs were recorded at 25 mm/s and 10 mm/mV in the supine resting position before HSCT and at 3–6-month follow-up. Heart rate, P-wave duration, PR interval, QRS duration, QT/QTc, RV5 and SV1 amplitudes, and Sokolow–Lyon index were obtained from automated measurements and independently verified by two blinded cardiologists (
Figure 1).
2.10. Statistical Analysis
Continuous variables were tested for normality using the Shapiro–Wilk test. As variables were non-normally distributed, descriptive statistics are presented as median (minimum–maximum). Baseline comparisons between the MM (n = 10) and non-MM (n = 10) groups were performed using the Mann–Whitney U test, with effect sizes reported as rank-biserial correlation coefficients (r) and interpreted as small (≥0.10), medium (≥0.30), or large (≥0.50).
Within-group longitudinal changes between pre-transplant (Pre) and 3–6-month post-transplant (Post) evaluations were assessed using the Wilcoxon signed-rank test. To evaluate the main effects of Time (Pre vs. Post), Group (MM vs. non-MM), and Time × Group interaction effects on echocardiographic and ECG parameters, a non-parametric factorial analysis was performed using the aligned rank transform (ART) procedure implemented in the ARTool package in R (version 4.3.2). Effect sizes were reported as partial eta squared (ηp2) and interpreted as small (0.01), medium (0.06), or large (0.14).
To control for cumulative Type I error across multidimensional imaging variables, parameters were grouped into eight predefined physiological domains, and a Benjamini–Hochberg false discovery rate (FDR) correction was applied within each domain. Associations between structural and electrical remodeling were assessed using delta change values (Δ = Post − Pre) and Spearman’s rank correlation.
Data management and descriptive analyses were performed in IBM SPSS Statistics version 26.0, while domain-corrected longitudinal and interaction analyses were conducted in R (version 4.3.2). Two-sided p < 0.05 (or FDR-adjusted q < 0.05) was considered statistically significant.
3. Results
3.1. Study Population and Statistical Approach
Baseline demographic, clinical, and transplant-related characteristics of the cohort are summarized in
Table 1. Clinical, ECG, and TTE data obtained at baseline (pre-transplant) and early follow-up (3–6 months) from MM and non-MM participants (n = 20) were analyzed. As variables were non-normally distributed, data are presented as median (minimum–maximum). To control for multiple comparisons, a domain-based Benjamini–Hochberg false discovery rate (FDR) correction was applied for longitudinal analyses (
Table 1,
Table 2,
Table 3 and
Table 4).
3.2. Baseline Characteristics
At baseline, the MM group showed longer ECG P-wave duration (p = 0.041; r = 0.46), lower RV FAC (p = 0.041; r = 0.46), and lower stroke index (p = 0.023; r = 0.51) compared with the non-MM group. Diastolic indices also differed, with higher septal and lateral a′ velocities but a lower lateral e′/a′ ratio in the MM group (all p < 0.05), suggesting distinct pre-transplant atrial–ventricular coupling.
3.3. Within-Group Changes
3.3.1. Multiple Myeloma
In the MM group, BMI decreased (p = 0.024) and ECG RV5–SV1 voltage increased during follow-up (p = 0.047). Myocardial GLS in the apical two-chamber view changed significantly (p = 0.013), whereas conventional systolic indices showed modest deterioration with reduced EF (A4C) and increased automated end-systolic volume index (both p = 0.047).
LA mechanics showed the most prominent changes, with reductions in LA reservoir and contractile strain (both p = 0.013). Decreases were also observed in septal a′ velocity, lateral S′ velocity, and RV lateral a′ velocity (all p < 0.05).
3.3.2. Non–Multiple Myeloma
In the non-MM group, significant reductions in LVIDd and LVIDs suggested geometric remodeling without global systolic deterioration. Regional deformation analysis showed significant changes in myocardial GLS in the apical four- and three-chamber views (both p < 0.05). Tissue Doppler analysis revealed reductions in lateral e′ velocity (p = 0.009) and the lateral e′/a′ ratio (p = 0.047), indicating early impairment of diastolic relaxation.
3.4. Longitudinal Analysis
3.4.1. Time × Group Interaction
After FDR correction, a significant interaction persisted only for the lateral e′/a′ ratio (p = 0.003; q = 0.031; ηp2 = 0.40), indicating a differential diastolic response between MM and non-MM groups.
3.4.2. Main Effects
Significant temporal changes included decreases in BMI (p = 0.008; q = 0.025) and changes in myocardial deformation parameters, particularly AutoGLS in A2C and A4C views (both q < 0.05). LA reservoir and contractile strain rates also showed significant temporal changes (q = 0.008).
For the main effect of group, persistent differences were observed in ECG P-wave duration (q = 0.043) and RV FAC (q = 0.049).
3.5. Correlation Analysis
Spearman’s correlation analysis showed no significant associations between ΔRV5+SV1 voltage and changes in LV mass across multiple calculation methods (all
p > 0.70). Further results are provided in
Supplementary Tables S1 and S2.
4. Discussion
4.1. Electrical–Structural Dissociation: ECG Voltage and Left Ventricular Mass
Following HSCT, within-group analyses demonstrated a modest but significant increase in surface ECG voltage, most prominently reflected by higher RV5+SV1 amplitude in the MM subgroup. This raised the question of whether post-transplant voltage augmentation reflects structural myocardial regression, particularly reduced LV mass, or an electrical phenomenon independent of macroscopic remodeling [
7,
20].
To investigate this, we examined the relationship between ECG voltage changes and multiple echocardiographic LV mass formulations and indexing strategies. Despite the consistent numerical increase in ECG voltage, no correlation was observed between ΔRV5+SV1 voltage and cube-derived, body surface area-indexed, height-indexed, or Penn-derived LV mass across the cohort, including both MM and non-MM subgroups [
7].
Although a modest reduction in indexed LV mass was observed at the group level, this decrease occurred alongside a significant decline in BMI. This parallel change suggests that post-transplant catabolic and anthropometric alterations may affect indexed geometric measurements rather than represent true regression of myocardial mass.
Changes in ECG voltage showed no meaningful association with LV dimensions, wall thickness, global systolic performance, or myocardial deformation parameters.
Taken together, these observations indicate a dissociation between electrical findings and structural myocardial characteristics following HSCT. In other words, the early increase in ECG voltage does not appear to reflect changes in macroscopic ventricular geometry.
Previous investigations have also reported a weak relationship between surface ECG voltage and true LV mass, emphasizing that voltage changes should be interpreted cautiously, and not assumed to represent structural myocardial recovery [
7,
21].
Collectively, these observations suggest that early post-transplant ECG voltage augmentation likely reflects transient functional adaptation related to loading conditions, systemic inflammation, and autonomic changes rather than structural myocardial remodeling [
4,
5,
21,
22,
23].
4.2. Left Atrial Mechanics After HSCT
Initial within-group comparisons revealed modest pre–post differences in several LA deformation parameters, predominantly in the MM subgroup. These included reductions in LASr ED, LAScd ED, and LASr AC, suggesting a potential early modulation of atrial functional phases after HSCT.
When longitudinal modeling was performed—including the effects of Group, Time, and Group × Time interaction with FDR correction—only LASr ED maintained a significant main effect of time, while the remaining atrial deformation indices no longer reached statistical significance. This suggests that the paired changes observed in the preliminary analyses were not consistently maintained in the multivariable longitudinal framework.
LA volumes and indexed LA volumes remained largely unchanged throughout follow-up, and no significant interaction between group and time was identified for either structural or deformation-related parameters. Overall, this pattern points to a selective atrial response in which attenuation of end-diastole-referenced LA reservoir strain appears to be the most consistent signal, rather than evidence of global atrial dysfunction or structural remodeling.
Previous cardio-oncology studies have described LA reservoir strain as a sensitive indicator of early cardiovascular stress, frequently preceding detectable atrial enlargement or overt diastolic dysfunction. In patients undergoing HSCT, alterations in atrial strain have been attributed mainly to transient changes in loading conditions, myocardial–atrial coupling, and systemic inflammatory responses, rather than to permanent atrial structural remodeling [
5,
10,
13,
17,
24].
4.3. Diastolic Parameters: Selective and Heterogeneous Changes
Initial within-group comparisons identified pre–post differences in several tissue Doppler–derived parameters following HSCT—most notably, reductions in septal a′ and septal S′ velocities in the MM subgroup. Considering the contribution of these velocities to late diastolic filling, these observations warranted further evaluation using longitudinal modeling.
When the analysis incorporated the effects of Group, Time, and Group × Time interaction with FDR correction, neither septal a′ nor septal S′ maintained a significant main effect of time, and no consistent interaction pattern emerged. Among the conventional diastolic indices, only the lateral e′/a′ ratio showed a significant Group × Time interaction.
Other established indicators of elevated LV filling pressure—including the E/e′ ratio, transmitral inflow velocities, deceleration time, and LA volume indices—did not show meaningful changes during follow-up.
The observed alterations in a′ velocity and e′/a′ ratio occurred without changes in LA size, transmitral flow patterns, or filling pressure surrogates, arguing against overt diastolic dysfunction in the early post-transplant period. Instead, these findings suggest selective modulation of late diastolic mechanics, likely reflecting a transient shift in the contribution of atrial contraction to ventricular filling.
Within current guideline frameworks, isolated tissue Doppler changes without structural or hemodynamic abnormalities should be interpreted cautiously. Accordingly, the FDR-sensitive alterations observed in our cohort most likely represent early functional adaptations of diastolic filling dynamics rather than clinically meaningful diastolic dysfunctions after HSCT [
4,
5,
6,
11,
15,
25].
4.4. Left Ventricular Systolic and Myocardial Deformation: Divergent Patterns by Disease Subtype
The comparison between MM and non-MM groups was chosen to explore potential differences in early post-HSCT cardiac adaptation across clinically distinct transplant populations with different disease characteristics and treatment exposures. Analyses of LV systolic performance and myocardial deformation revealed divergent response patterns between patients with multiple myeloma (MM) and those with non-MM diagnoses, suggesting disease- and exposure-related myocardial adaptation in the early post-HSCT period.
In within-group analyses, MM patients showed modest reductions in visually derived EF (A4C) and an increase in end-systolic volume index; however, these changes did not persist after longitudinal modeling with multiple testing correction. No significant Time or Group × Time effects were observed for biplane EF, stroke volume, or end-diastolic volume indices. In contrast, myocardial deformation analysis demonstrated numerical improvement in myocardial-layer GLS in the apical two-chamber view, indicating subtle modulation of myocardial contractile mechanics rather than progressive systolic dysfunction or structural remodeling [
16,
20,
21,
22].
The non-MM subgroup showed a different response pattern characterized by reductions in LV internal diameters together with worsening myocardial-layer GLS in the apical four- and three-chamber views. These deformation changes were accompanied by reductions in lateral e′ velocity and the lateral e′/a′ ratio, while EF, LV volumes, and filling pressure indices remained stable, supporting the presence of subclinical myocardial vulnerability rather than overt systolic or diastolic dysfunction. The non-MM group was heterogeneous and included patients with different hematologic malignancies and conditioning regimens, which may have influenced the observed subgroup patterns. Therefore, these findings should be interpreted cautiously, particularly given the limited sample size and potential differences in treatment-related cardiotoxic exposure. Given the heterogeneous cardiotoxic exposure in the non-MM subgroup, including prior chemotherapy, this deformation-predominant pattern likely reflects early treatment-related myocardial susceptibility. Similar findings have been reported in lymphoma and other non-MM populations, where myocardial deformation abnormalities occur despite preserved EF [
5,
6,
14,
26].
Overall, these findings demonstrate a dissociation between conventional systolic indices and myocardial deformation after HSCT, highlighting the incremental value of strain imaging for detecting subtle myocardial responses not captured by LVEF alone [
20,
21,
22].
4.5. Right Ventricular Structure and Function After HSCT
Evaluation of RV structure and function demonstrated subtle and heterogeneous changes after HSCT, predominantly affecting tissue Doppler and deformation-derived indices rather than conventional global RV parameters. Initial within-group analyses showed mild reductions in lateral tricuspid annular a′ and S′ velocities and RV FAC, particularly in the non-MM subgroup, while RV longitudinal strain parameters showed only modest attenuation.
When longitudinal modeling accounted for the effects of Group, Time, and their interaction with FDR correction, most RV-related parameters—including TAPSE, RV free-wall strain, and RV four-chamber longitudinal strain—did not show a significant temporal effect. RV FAC appeared to reflect a baseline subgroup difference rather than a longitudinal decline, with lower values observed in the non-MM subgroup irrespective of HSCT-related temporal changes. No meaningful Group × Time interaction was identified for RV indices.
Measures of right heart structure, including RV chamber dimensions and right atrial size, remained largely unchanged during follow-up. This stability argues against the presence of overt RV remodeling or progressive right-sided dysfunction in the early post-transplant phase. Overall, the observed pattern points to relatively limited and predominantly subclinical RV involvement following HSCT.
The lower RV functional indices seen in the non-MM subgroup may therefore be related to underlying myocardial susceptibility associated with prior cardiotoxic treatments rather than representing a direct effect of transplantation itself, a concept that aligns with observations reported in recent cardio-oncology literature [
5,
9,
14,
20,
23].
From a cardio-oncology perspective, echocardiography represents a first-line imaging modality not only for detecting early functional abnormalities but also as a part of a structured diagnostic pathway. In cases with abnormal or inconclusive findings, further multimodality imaging may be required to characterize structural abnormalities, including masses or other pathologies.
5. Study Limitations
This study has several limitations. The small sample size (n = 20), derived from a single center, limits statistical power and generalizability, particularly for subgroup analyses. The findings should be interpreted with caution, considered exploratory and hypothesis-generating, and require confirmation in larger multicenter studies with longer follow-up. Second, cardiac evaluation was performed at only two predefined time points, preventing assessment of longer-term trajectories and reversibility of observed changes.
Third, invasive hemodynamic data, cardiopulmonary exercise testing, and systematic biomarker profiling were unavailable, limiting physiological correlation with imaging findings. Fourth, heterogeneity in prior cardiotoxic treatment exposure represents a potential confounder. Finally, deformation and tissue Doppler indices are load-dependent, and variability related to peri-transplant volume status and systemic conditions cannot be excluded. These findings should therefore be interpreted as evidence of functional adaptation rather than definitive structural injury.
6. Conclusions
In this prospective multimodal evaluation, early cardiac remodeling after HSCT was characterized by heterogeneous, compartment-selective, and predominantly functional adaptations rather than uniform structural deterioration. Electrical alterations, including increased ECG voltage, were uncoupled from LV mass, geometry, and global systolic performance, indicating early electrical–structural dissociation. These findings suggest early subclinical cardiac changes after HSCT, characterized by heterogeneous and compartment-specific patterns. However, given the small sample size and short follow-up, the results should be considered exploratory and require validation in larger studies.
The most consistent imaging signal was attenuation of LA reservoir strain in the absence of atrial enlargement or elevated filling pressures, suggesting early modulation of atrial–ventricular coupling rather than overt diastolic dysfunction.
Myocardial responses differed by disease subtype: MM patients showed relative stabilization or numerical improvement in deformation indices, whereas non-MM patients exhibited subclinical reductions in LV deformation and selected RV functional parameters, consistent with increased myocardial vulnerability related to prior cardiotoxic exposure.
These findings highlight the limitations of EF-based surveillance and support the incremental value of integrated multiparametric imaging, particularly strain analysis, for detecting early subclinical cardiac adaptation after HSCT.
Future longitudinal multicenter studies are needed to clarify the prognostic significance and long-term implications of these early compartment-specific cardiac changes.
Supplementary Materials
The following supporting information can be downloaded at:
https://www.mdpi.com/article/10.3390/diagnostics16101423/s1, Supplementary Table S1: Full Between-Group Comparison of Pre-HSCT Clinical, Electrocardiographic, and Echocardiographic Parameters in Multiple Myeloma andNon–Multiple Myeloma Patients, Supplementary Table S2: Full Longitudinal Analysis of Clinical and Echocardiographic Parameters in Multiple Myeloma and Non–Multiple Myeloma Patients: Main Effects of Time, Group, and Time × Group Interaction (ART Model).
Author Contributions
Conceptualization, Ç.A., F.Ç.H. and D.Y.; methodology, Ç.A., F.Ç.H. and D.Y.; software, G.O.; formal analysis, G.O.; investigation, F.Ç.H., V.O., F.O. and N.M.; data curation, F.Ç.H. and N.M.; writing—original draft preparation, Ç.A., F.Ç.H. and Z.K.; writing—review and editing, Ç.A., F.O., V.O. and D.Y.; visualization, Z.K. and N.M.; supervision, Ç.A. and D.Y.; project administration, Ç.A. All authors have read and agreed to the published version of the manuscript.
Funding
This research received no external funding.
Institutional Review Board Statement
The study protocol was approved by the Bursa Uludag University Faculty of Medicine Ethics Committee (Approval No: 2023-27/49-12 December 2023) and conducted in accordance with the Declaration of Helsinki. Written informed consent was obtained from all participants. Analyses were performed on anonymized imaging and ECG data.
Informed Consent Statement
Informed consent was obtained from all subjects involved in the study.
Data Availability Statement
The datasets generated and analyzed during the current study are available from the corresponding author on reasonable request, in accordance with participant confidentiality and institutional regulations.
Conflicts of Interest
The authors declare no conflicts of interest.
Abbreviations
| ECG | Electrocardiography |
| HSCT | Hematopoietic stem cell transplantation |
| TTE | Transthoracic echocardiography |
| LV | Left ventricle/left ventricular |
| RV | Right ventricle/right ventricular |
| LA | Left atrium/left atrial |
| GLS | Global longitudinal strain |
| FAC | Fractional area change |
| LVEF | Left ventricular ejection fraction |
References
- Copelan, E.A. Hematopoietic Stem-Cell Transplantation. N. Engl. J. Med. 2006, 354, 1813–1826. [Google Scholar] [CrossRef] [PubMed]
- Armenian, S.H.; Lacchetti, C.; Barac, A.; Carver, J.; Constine, L.S.; Denduluri, N.; Dent, S.; Douglas, P.S.; Durand, J.B.; Ewer, M.; et al. Prevention and Monitoring of Cardiac Dysfunction in Survivors of Adult Cancers: American Society of Clinical Oncology Clinical Practice Guideline. J. Clin. Oncol. 2017, 35, 893–911. [Google Scholar] [CrossRef]
- Lenneman, C.G.; Sawyer, D.B. Cardio-Oncology: An Update on Cardiotoxicity of Cancer-Related Treatment. Circ. Res. 2016, 118, 1008–1020. [Google Scholar] [CrossRef]
- Majhail, N.S.; Rizzo, J.D.; Lee, S.J.; Aljurf, M.; Atsuta, Y.; Bonfim, C.; Burns, L.J.; Chaudhri, N.; Davies, S.; Okamoto, S.; et al. Recommended Screening and Preventive Practices for Long-Term Survivors after Hematopoietic Cell Transplantation. Bone Marrow Transplant. 2012, 47, 337–341. [Google Scholar] [CrossRef]
- Gent, D.; Saif, M.; Dobson, R.; Armeni, P.; Chowdhury, A.; Herrmann, J.; Lenneman, C.G.; Lyon, A.R.; Moslehi, J.; Neilan, T.G.; et al. Cardiovascular Disease After Hematopoietic Stem Cell Transplantation in Adults: JACC: CardioOncology State-of-the-Art Review. JACC Cardio Oncol. 2024, 6, 475–495. [Google Scholar] [CrossRef]
- Lyon, A.R.; López-Fernández, T.; Couch, L.S.; Asteggiano, R.; Aznar, M.C.; Bergler-Klein, J.; Boriani, G.; Cardinale, D.; Cordoba, R.; Cosyns, B.; et al. 2022 ESC Guidelines on Cardio-Oncology Developed in Collaboration with the European Hematology Association (EHA), the European Society for Therapeutic Radiology and Oncology (ESTRO) and the International Cardio-Oncology Society (IC-OS). Eur. Heart J. 2022, 43, 4229–4361. [Google Scholar] [CrossRef]
- Ohmoto, A.; Fuji, S. Cardiac Complications Associated with Hematopoietic Stem-Cell Transplantation. Bone Marrow Transplant. 2021, 56, 2637–2643. [Google Scholar] [CrossRef]
- Chow, E.J.; Mueller, B.A.; Baker, K.S.; Cushing-Haugen, K.L.; Flowers, M.E.; Martin, P.J.; Friedman, D.L.; Lee, S.J. Cardiovascular Hospitalizations and Mortality among Recipients of Hematopoietic Stem Cell Transplantation. Ann. Intern. Med. 2011, 155, 21–32. [Google Scholar] [CrossRef]
- Zhao, Y.; He, R.; Oerther, S.; Zhou, W.; Vosough, M.; Hassan, M. Cardiovascular Complications in Hematopoietic Stem Cell Transplanted Patients. J. Pers. Med. 2022, 12, 1797. [Google Scholar] [CrossRef] [PubMed]
- Rotz, S.J.; Ryan, T.D.; Jodele, S.; Jefferies, J.L.; Lane, A.; Pate, A.; Hirsch, R.; Hlavaty, J.; Levesque, A.E.; Taylor, M.D.; et al. The Injured Heart: Early Cardiac Effects of Hematopoietic Stem Cell Transplantation in Children and Young Adults. Bone Marrow Transplant. 2017, 52, 1171–1179. [Google Scholar] [CrossRef] [PubMed]
- Poręba, M.; Gać, P.; Usnarska-Zubkiewicz, L.; Pilecki, W.; Kuliczkowski, K.; Mazur, G.; Gonerska, M.; Sobieszczańska, M.; Poręba, R. Evaluation of the Impact of Treatment with Hematopoietic Stem Cells Transplantation (HSCT) on Biochemical Markers of Heart Function and Novel Electrocardiographic Markers of Repolarization in Patients with Hematological Malignancies. Med. Oncol. 2018, 35, 162. [Google Scholar] [CrossRef] [PubMed]
- Piña, P.; Lorenzatti, D.; Pellikka, P.A.; Shah, N.; Slipczuk, L. Prognostic Value of Left Atrial Strain in Multiple Myeloma. Eur. J. Intern. Med. 2023, 114, 150–153. [Google Scholar] [CrossRef]
- Thomas, L.; Marwick, T.H.; Popescu, B.A.; Donal, E.; Badano, L.P. Left Atrial Structure and Function, and Left Ventricular Diastolic Dysfunction: JACC State-of-the-Art Review. J. Am. Coll. Cardiol. 2019, 73, 1961–1977. [Google Scholar] [CrossRef]
- Javadi, N.; Bismee, N.N.; Abbas, M.T.; Scalia, I.G.; Pereyra, M.; Baba Ali, N.; Attaripour Esfahani, S.; Awad, K.; Farina, J.M.; Ayoub, C.; et al. Left Atrial Strain: State of the Art and Clinical Implications. J. Pers. Med. 2024, 14, 1093. [Google Scholar] [CrossRef] [PubMed]
- Chen, C.; Nishtala, A.; Li, E.; Schultz, W.M.; Baldridge, A.S.; Groenendyk, J.W.; Lee, D.C.; Shah, S.J.; Burt, R.K.; Freed, B.H. The Effect of Hematopoietic Stem Cell Transplantation on Cardiac Mechanics in Systemic Sclerosis. Int. J. Cardiovasc. Imaging 2025, 41, 879–887. [Google Scholar] [CrossRef] [PubMed]
- Lang, R.M.; Badano, L.P.; Mor-Avi, V.; Afilalo, J.; Armstrong, A.; Ernande, L.; Flachskampf, F.A.; Foster, E.; Goldstein, S.A.; Kuznetsova, T.; et al. Recommendations for Cardiac Chamber Quantification by Echocardiography in Adults: An Update from the American Society of Echocardiography and the European Association of Cardiovascular Imaging. J. Am. Soc. Echocardiogr. 2015, 28, 1–39.e14. [Google Scholar] [CrossRef] [PubMed]
- Badano, L.P.; Kolias, T.J.; Muraru, D.; Abraham, T.P.; Aurigemma, G.; Edvardsen, T.; D’Hooge, J.; Donal, E.; Fraser, A.G.; Marwick, T.; et al. Standardization of Left Atrial, Right Ventricular, and Right Atrial Deformation Imaging Using Two-Dimensional Speckle Tracking Echocardiography: A Consensus Document of the EACVI/ASE/Industry Task Force to Standardize Deformation Imaging. Eur. Heart J.—Cardiovasc. Imaging 2018, 19, 591–600. [Google Scholar] [CrossRef]
- Muraru, D.; Haugaa, K.; Donal, E.; Stankovic, I.; Voigt, J.U.; Petersen, S.E.; Popescu, B.A.; Marwick, T.H. Right Ventricular Longitudinal Strain in the Clinical Routine: A State-of-the-Art Review. Eur. Heart J.—Cardiovasc. Imaging 2022, 23, 898–912. [Google Scholar] [CrossRef]
- Keramida, K.; Farmakis, D. Right Ventricular Involvement in Cancer Therapy-Related Cardiotoxicity: The Emerging Role of Strain Echocardiography. Heart Fail. Rev. 2021, 26, 1189–1193. [Google Scholar] [CrossRef]
- Bacharova, L. Electrocardiography–Left Ventricular Mass Discrepancies in Left Ventricular Hypertrophy: Electrocardiography Imperfection or Beyond Perfection? J. Electrocardiol. 2009, 42, 593–596. [Google Scholar] [CrossRef]
- Bianchi, G.; Zhang, Y.; Comenzo, R.L. AL Amyloidosis: Current Chemotherapy and Immune Therapy Treatment Strategies: JACC: CardioOncology State-of-the-Art Review. JACC Cardio Oncol. 2021, 3, 467–487. [Google Scholar] [CrossRef] [PubMed]
- Wechalekar, A.D.; Fontana, M.; Quarta, C.C.; Liedtke, M. AL Amyloidosis for Cardiologists: Awareness, Diagnosis, and Future Prospects: JACC: CardioOncology State-of-the-Art Review. JACC Cardio Oncol. 2022, 4, 427–441. [Google Scholar] [CrossRef] [PubMed]
- Jarasunas, J.; Aidietis, A.; Aidietiene, S. Left Atrial Strain—An Early Marker of Left Ventricular Diastolic Dysfunction in Patients with Hypertension and Paroxysmal Atrial Fibrillation. Cardiovasc. Ultrasound 2018, 16, 29. [Google Scholar] [CrossRef] [PubMed]
- Nagueh, S.F.; Smiseth, O.A.; Appleton, C.P.; Byrd, B.F., III; Dokainish, H.; Edvardsen, T.; Flachskampf, F.A.; Gillebert, T.C.; Klein, A.L.; Lancellotti, P.; et al. Recommendations for the Evaluation of Left Ventricular Diastolic Function by Echocardiography: An Update from the American Society of Echocardiography and the European Association of Cardiovascular Imaging. J. Am. Soc. Echocardiogr. 2016, 29, 277–314. [Google Scholar] [CrossRef]
- Thavendiranathan, P.; Poulin, F.; Lim, K.D.; Plana, J.C.; Woo, A.; Marwick, T.H. Use of Myocardial Strain Imaging by Echocardiography for the Early Detection of Cardiotoxicity in Patients During and After Cancer Chemotherapy: A Systematic Review. J. Am. Coll. Cardiol. 2014, 63, 2751–2768. [Google Scholar] [CrossRef]
- Paolisso, P.; Foà, A.; Magnani, I.; Bergamaschi, L.; Graziosi, M.; Angeli, F.; Chiti, C.; Fabrizio, M.; Rinaldi, A.; Stefanizzi, A.; et al. Development and Validation of a Diagnostic Echocardiographic Mass Score in the Approach to Cardiac Masses. JACC Cardiovasc. Imaging 2022, 15, 2010–2012. [Google Scholar] [CrossRef]
| Disclaimer/Publisher’s Note: The statements, opinions and data contained in all publications are solely those of the individual author(s) and contributor(s) and not of MDPI and/or the editor(s). MDPI and/or the editor(s) disclaim responsibility for any injury to people or property resulting from any ideas, methods, instructions or products referred to in the content. |




 ,
,