Machine Learning in Predicting Cardiac Events for ESRD Patients: A Framework for Clinical Decision Support


 and
and
Abstract
1. Introduction
2. Materials and Methods
2.1. Data Collection
2.2. Data Analysis
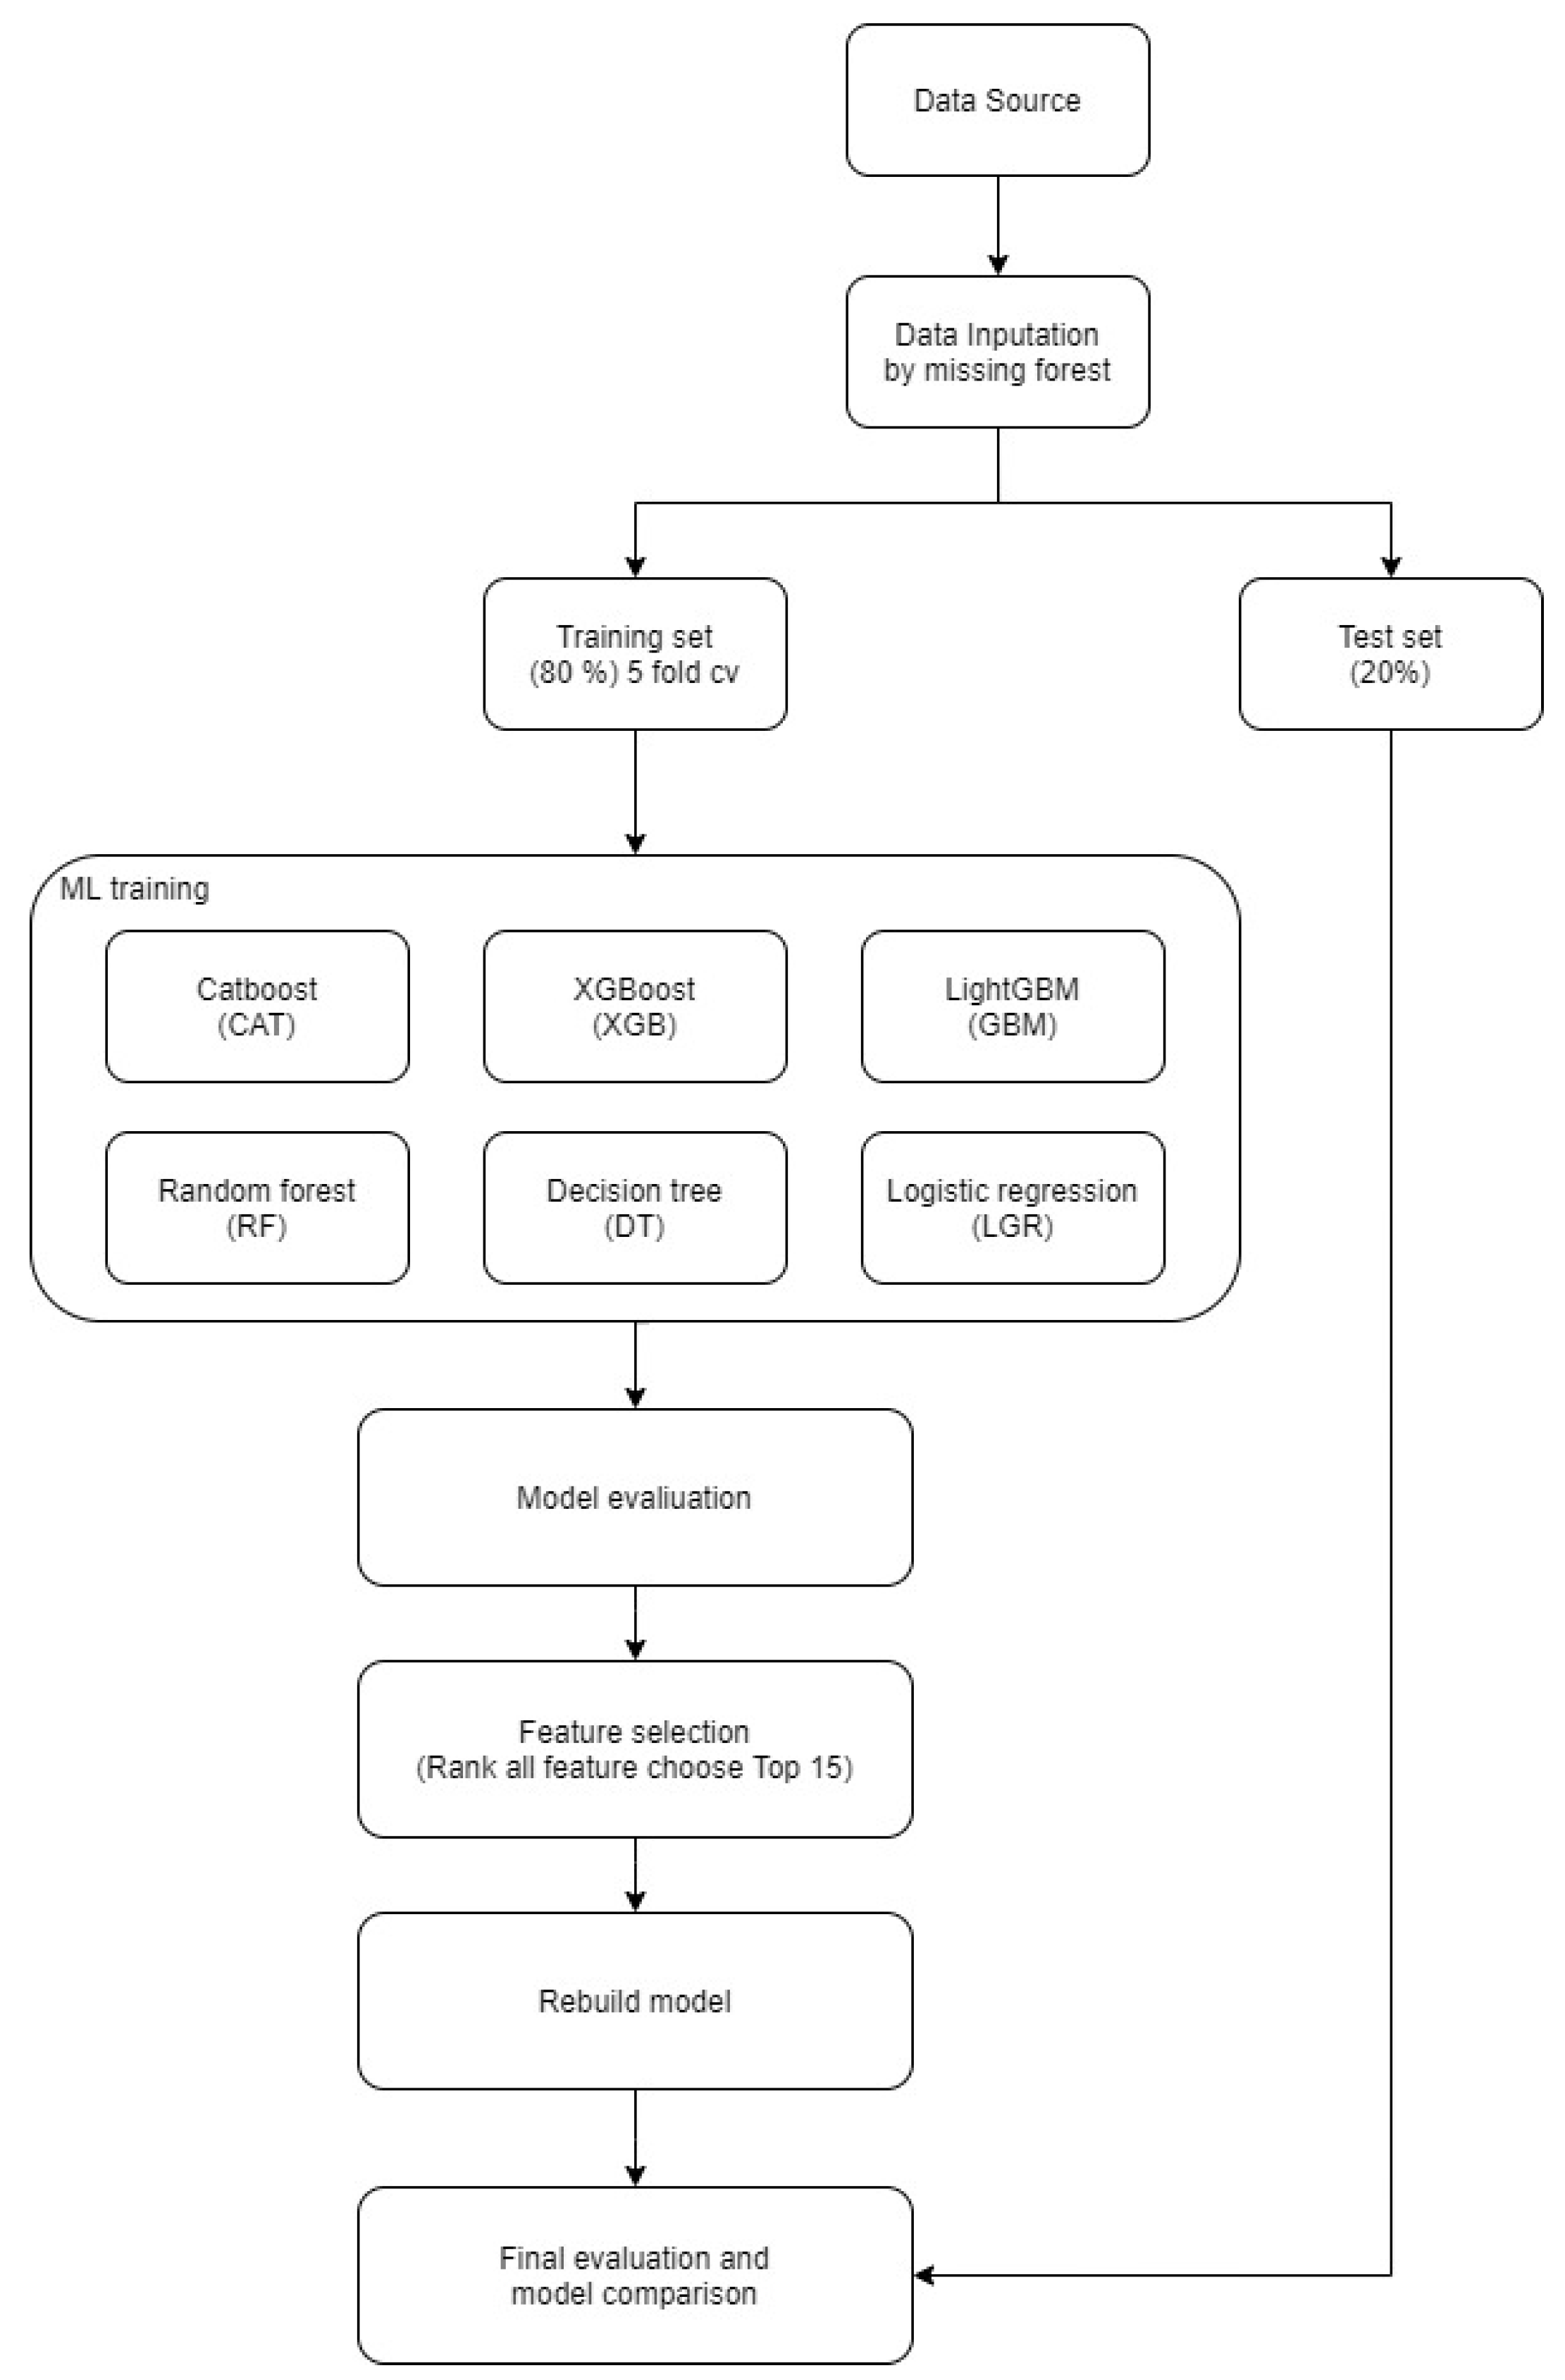
2.3. Data Preparation and Imputation
2.4. Variable Encoding and Expansion
2.5. Data Segmentation
2.6. Model Building and Validation Phase 1
2.7. Model Refinement and Variable Selection Phase 2
3. Results
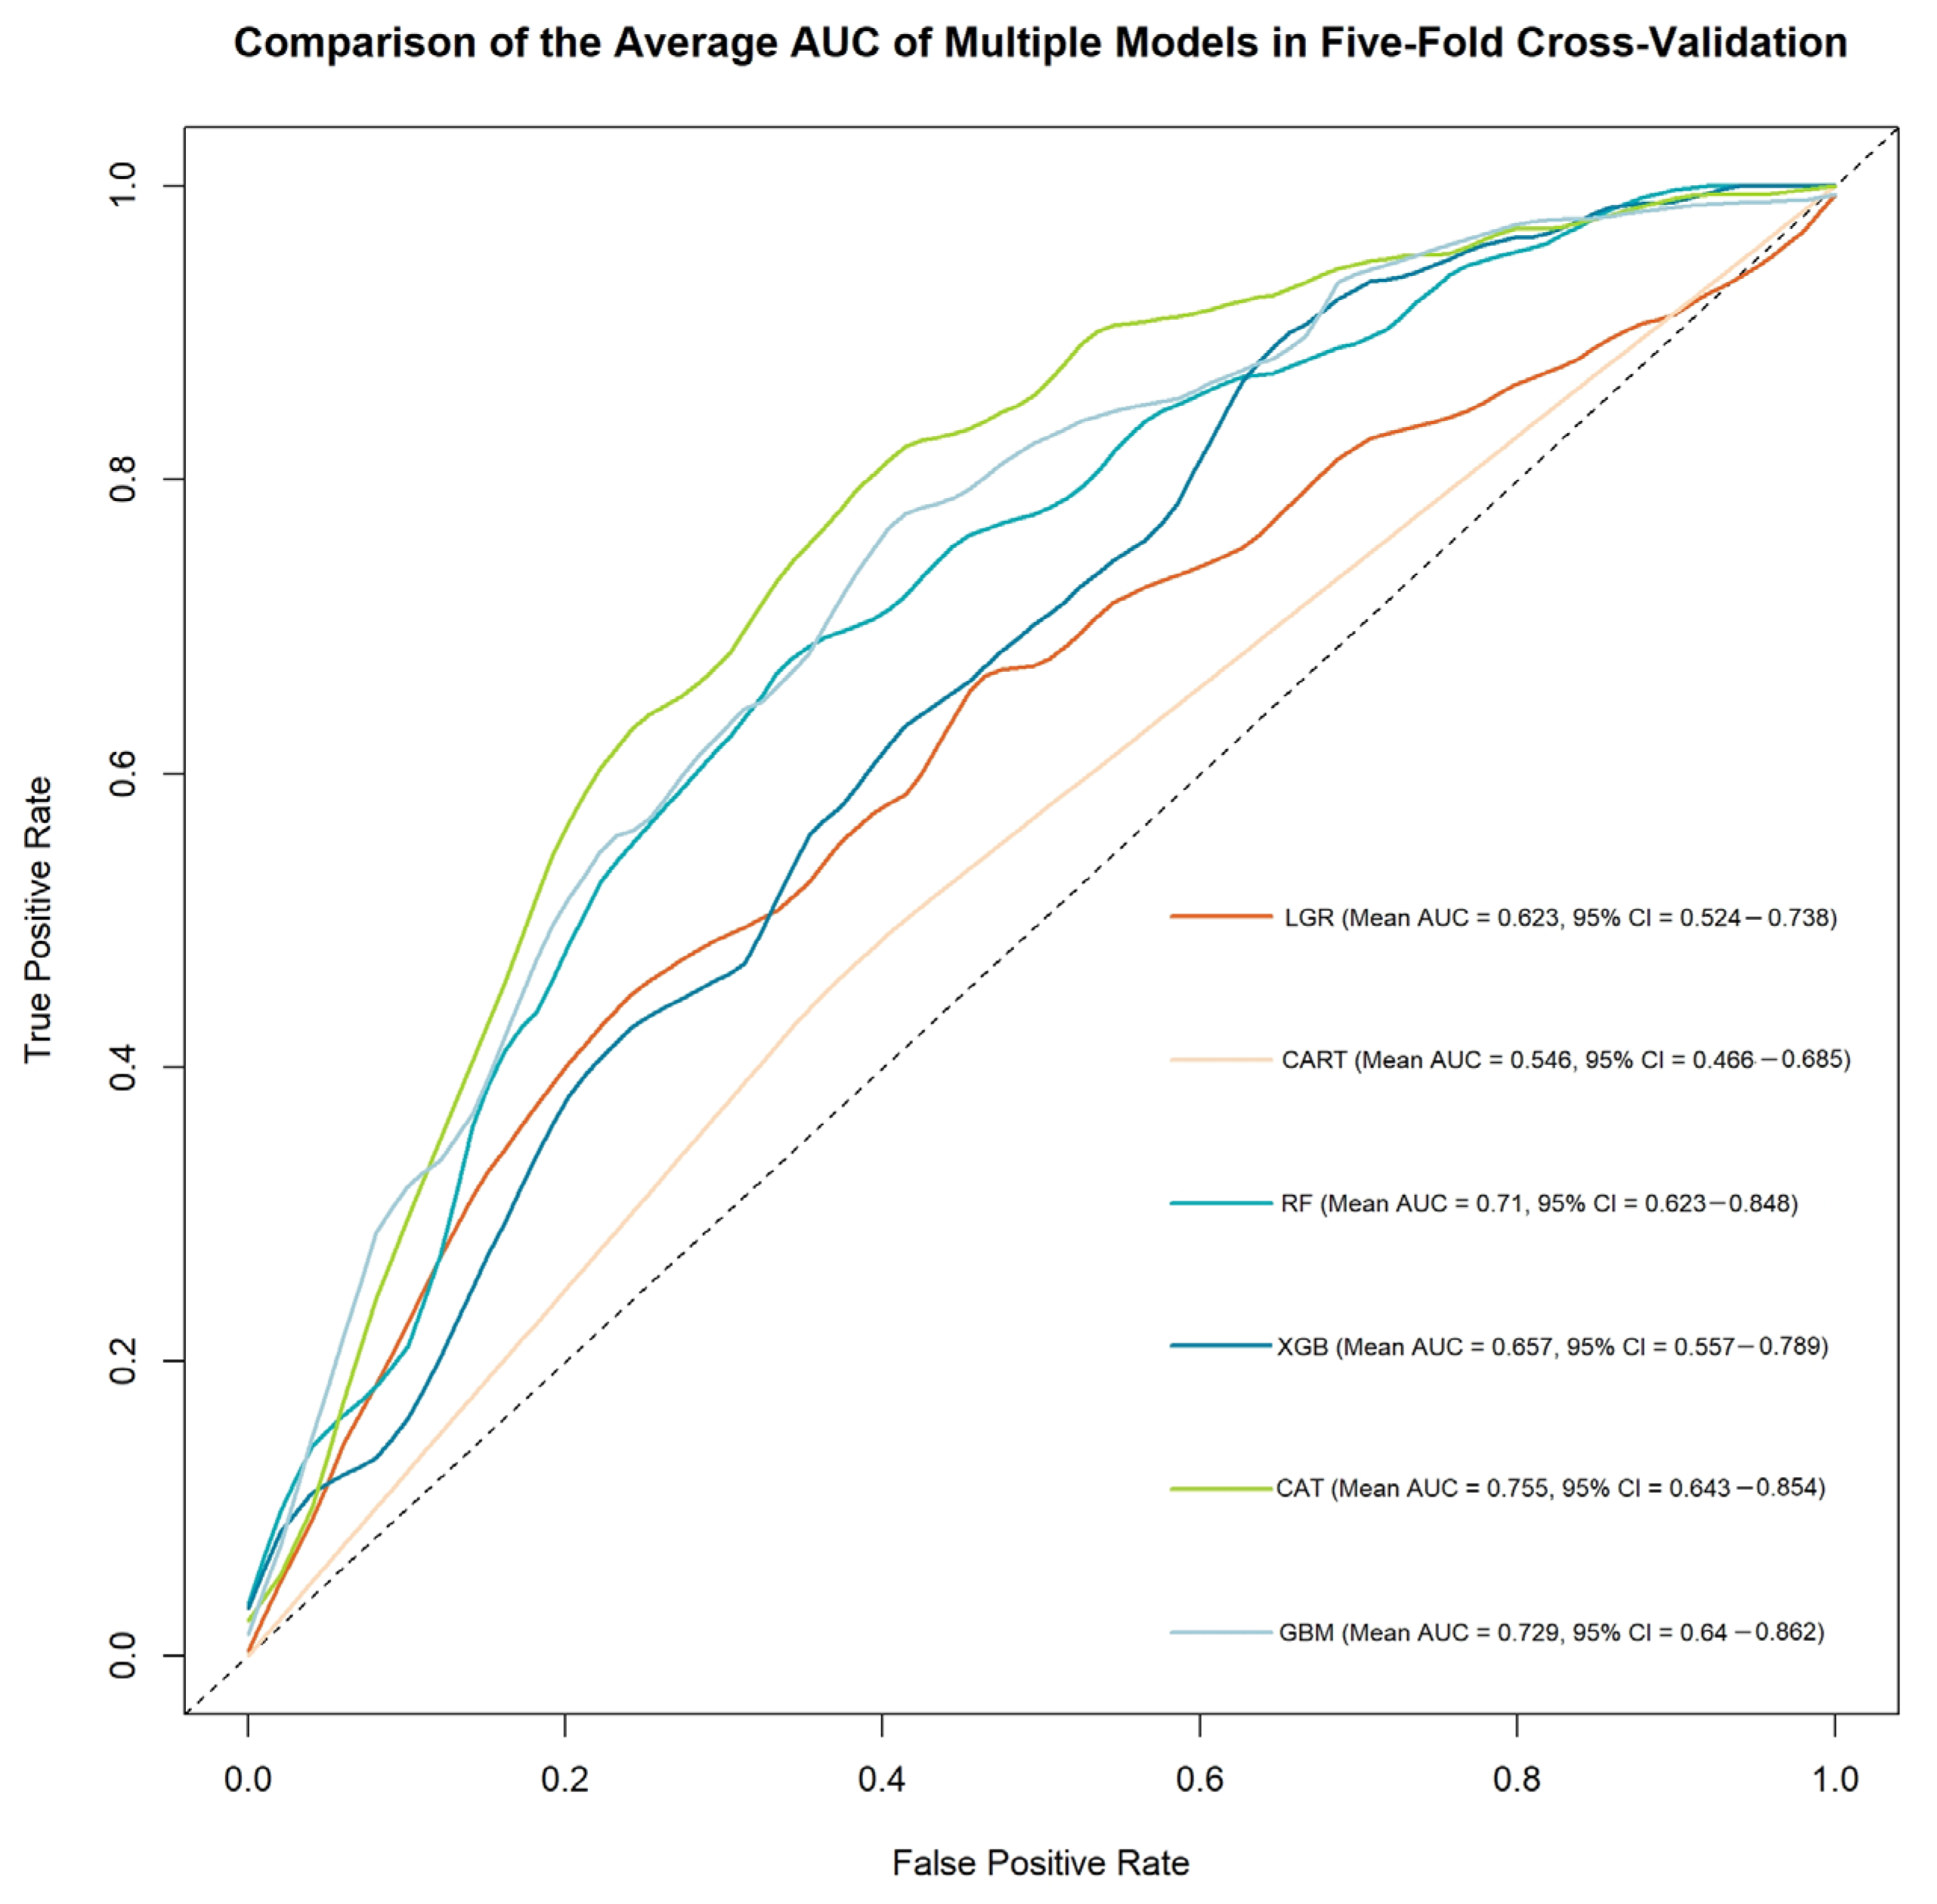
3.1. Phase 1
3.2. Phase 2
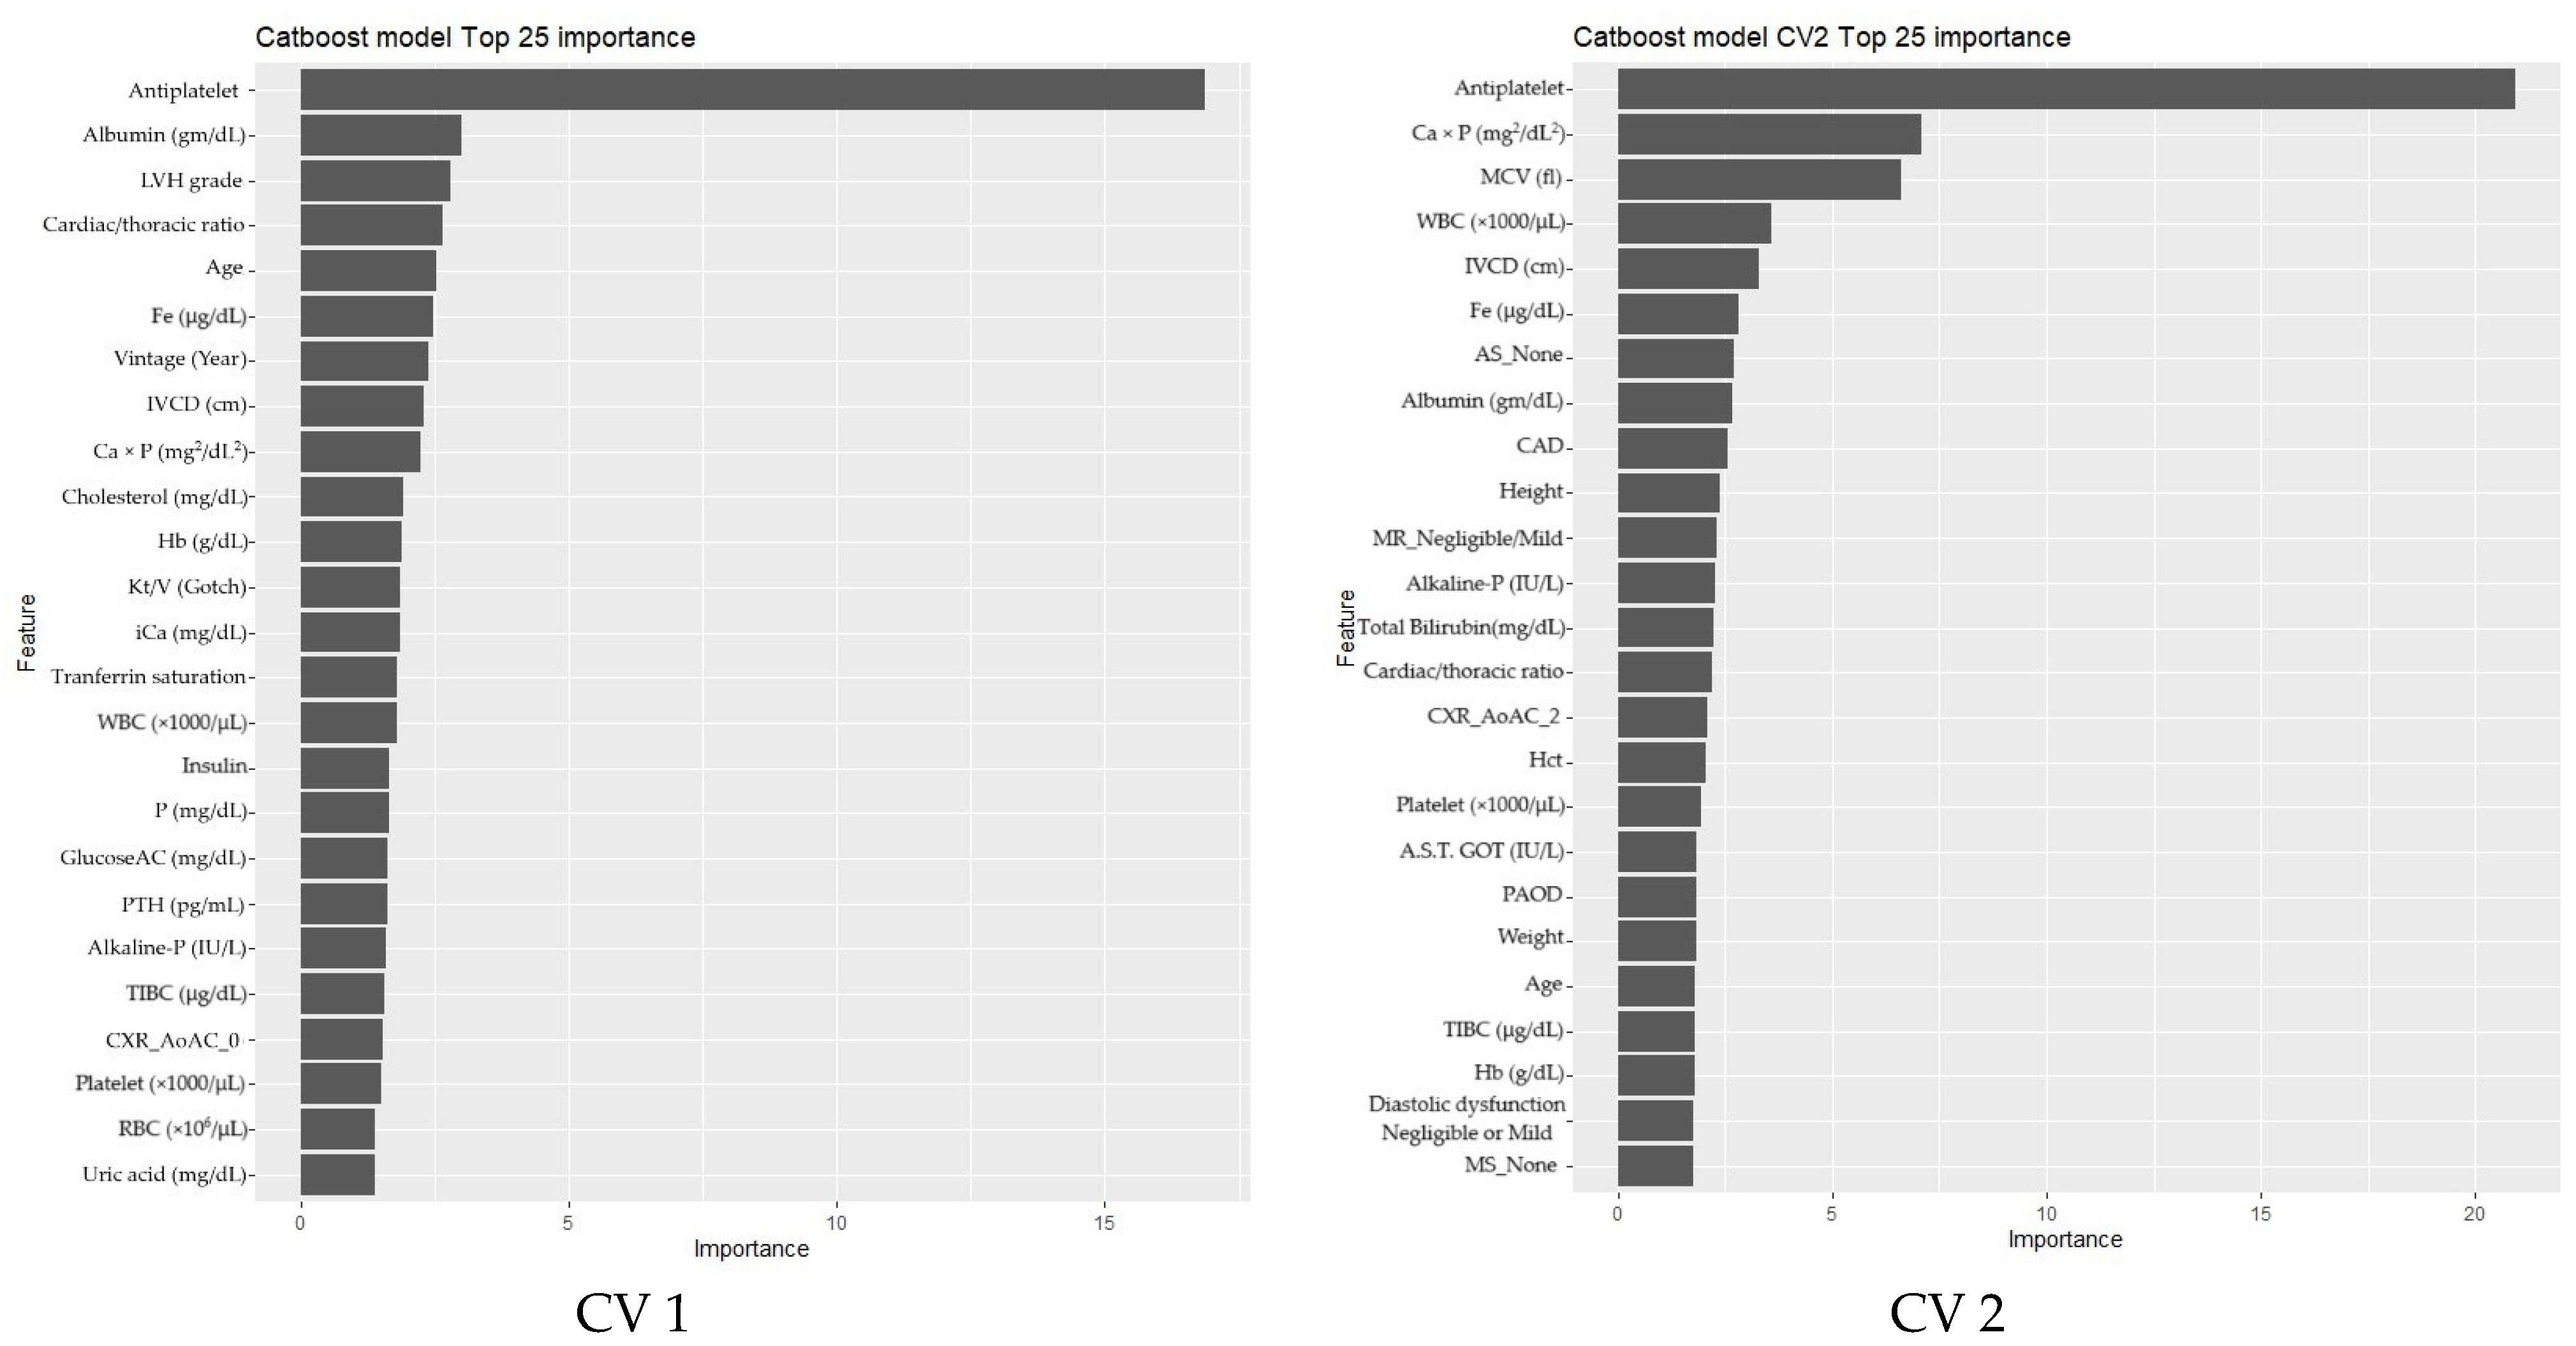
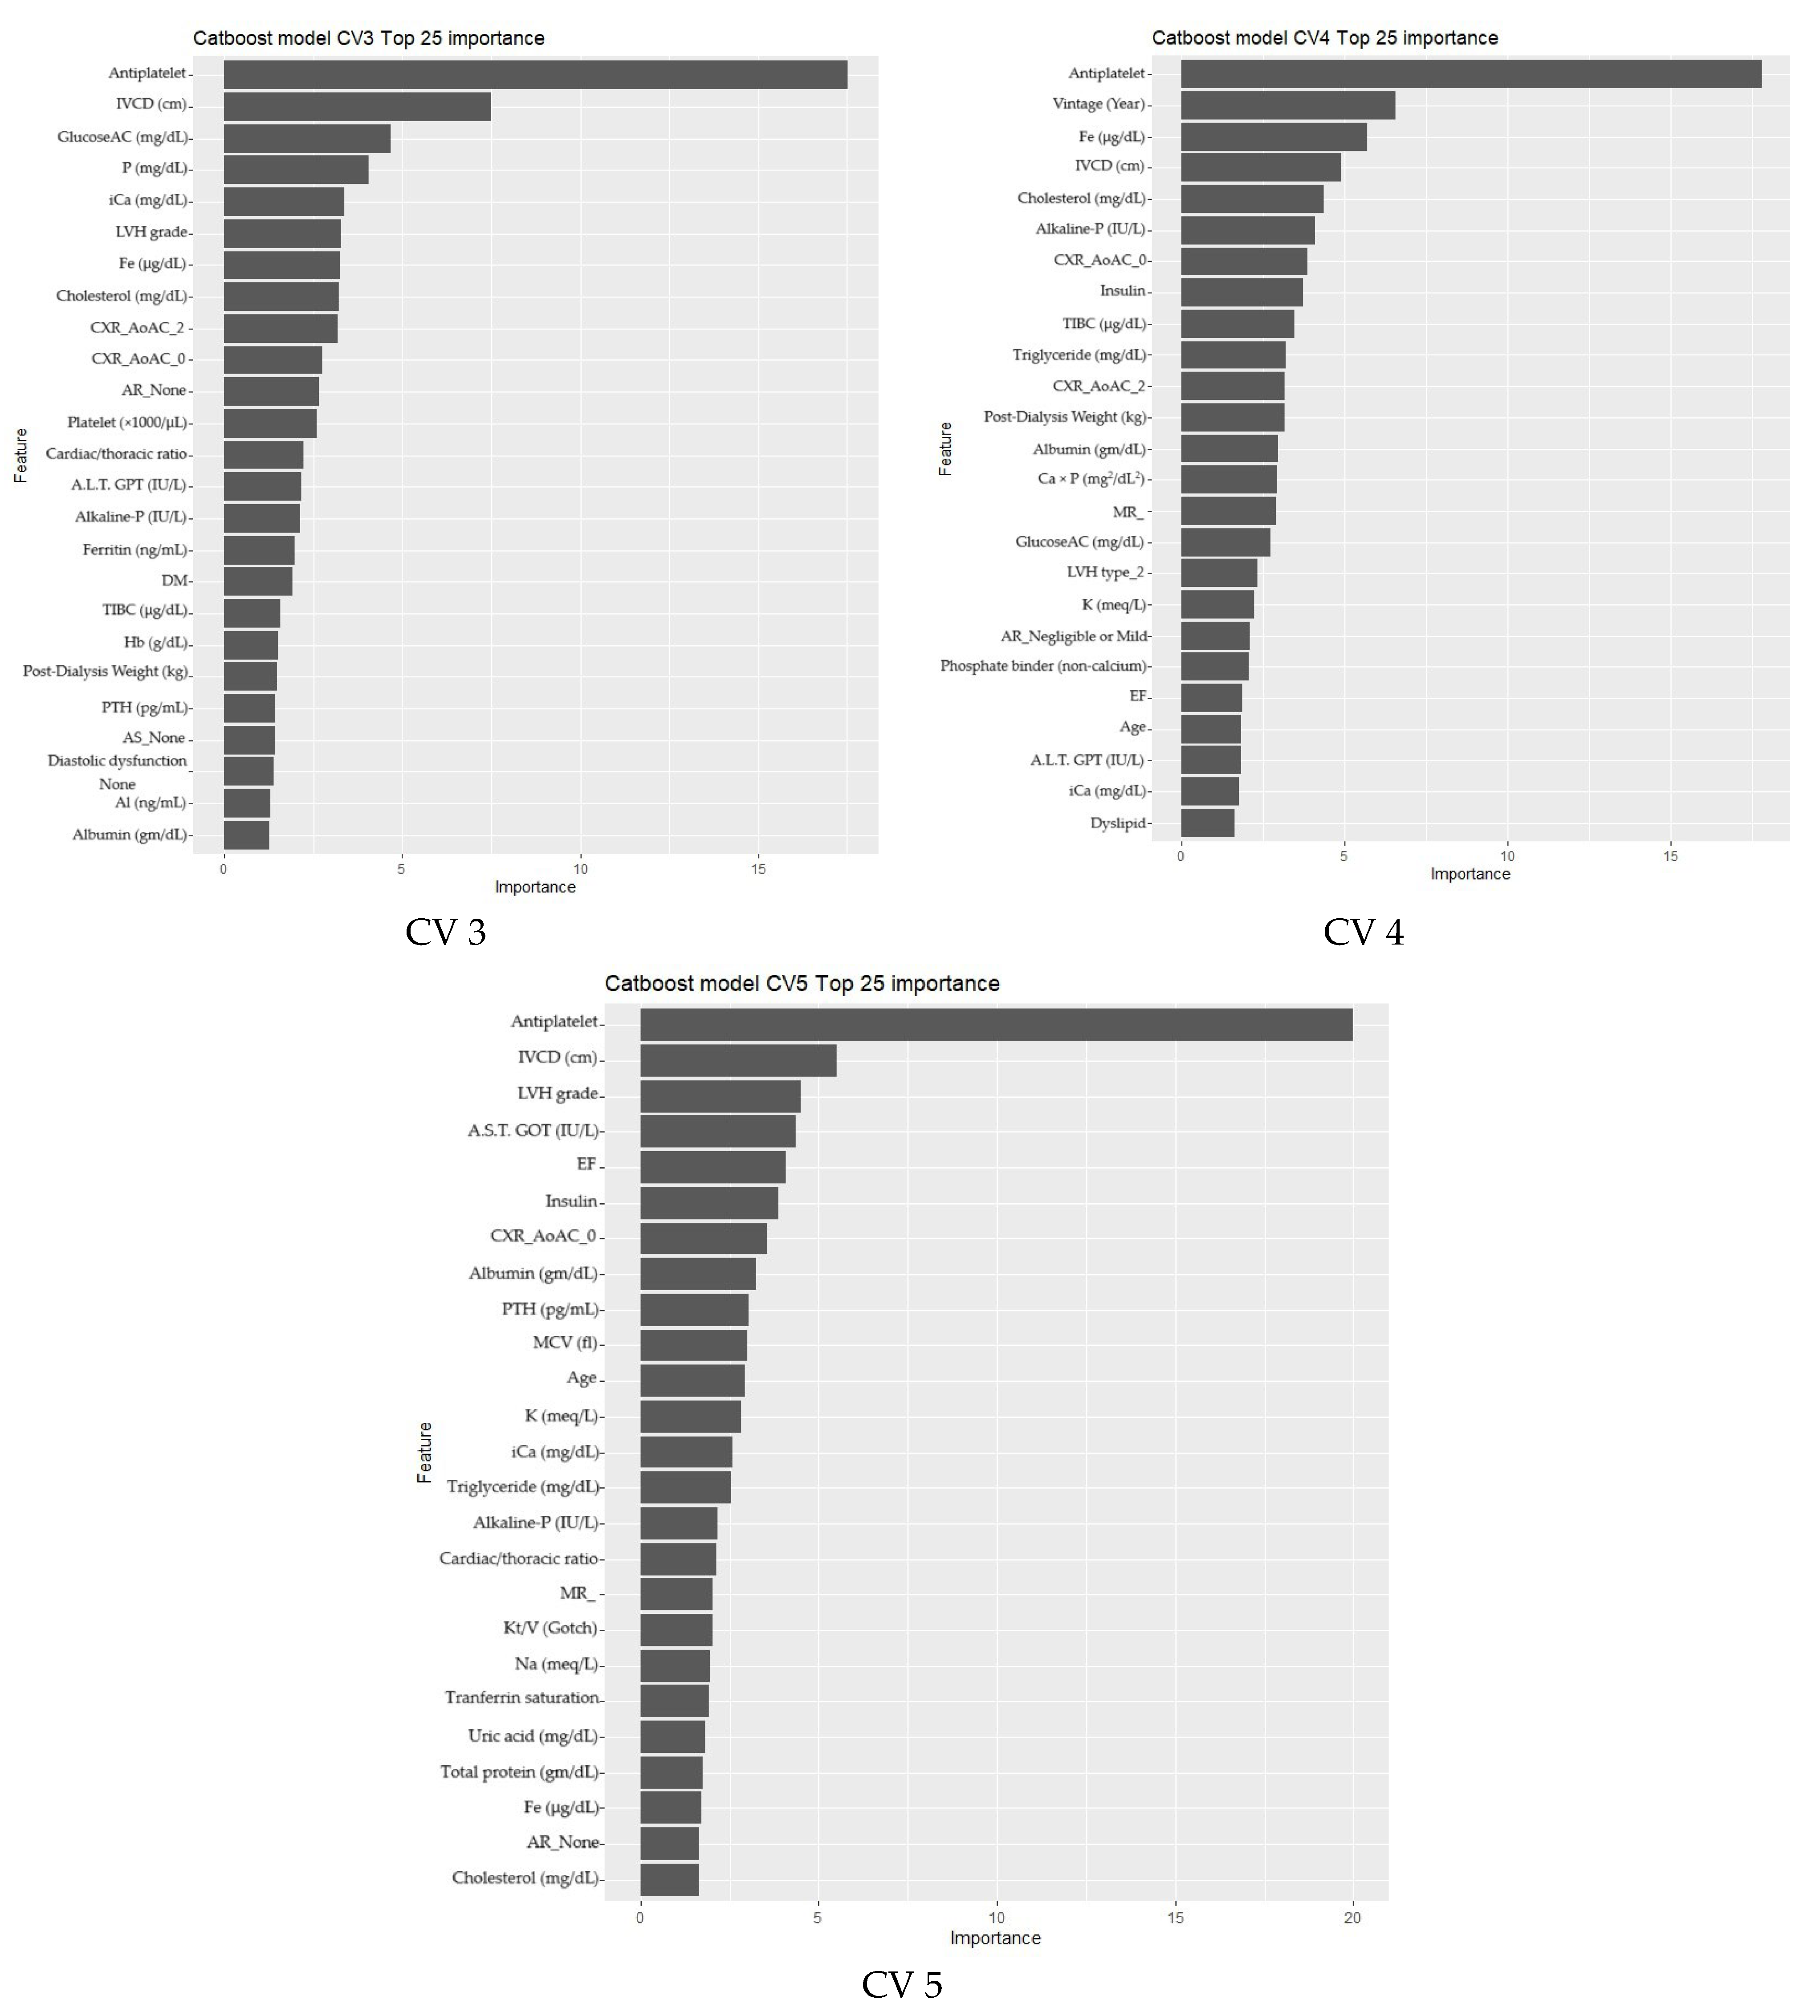
Feature Selection and Model Refinement
3.3. Model Evaluation Summary
4. Discussion
4.1. Clinical Implications
4.2. Limitations and Generalizability
4.3. Future Directions
5. Conclusions
Author Contributions
Funding
Institutional Review Board Statement
Informed Consent Statement
Data Availability Statement
Conflicts of Interest
Abbreviations
| LGR | Logistic Regression |
| CART | Decision Tree |
| SVM | Support Vector Machine |
| RF | Random Forest |
| XGB | XGBoost |
| CatB | CatBoost |
| NB | Naive Bayes |
| ANN | Artificial neural network |
| DNN | Deep neural networks |
| KNN | K-Nearest Neighbor |
| ESRD | End-stage renal disease |
| MACE | Major adverse cardiac event |
| SHAP | SHapley Additive exPlanations |
| AUC | Area under receiver operator characteristic curve |
| AV cal | Aortic valve calculation |
| AS | Aortic stenosis |
| LVH | Left ventricular hypertrophy |
| EF | Ejection fraction |
| IVCD | Inferior vena cava diameter |
| DM | Diabetes mellitus |
| CAD | Coronary artery disease |
| AMI | Acute myocardial infarction |
| PAOD | Peripheral arterial occlusion disease |
| HF | Heart failure |
| Hb | Hemoglobin |
| Ca × P | Calcium-phosphate product in blood |
| CXR_AoAC | Chest X-ray for aortic arch calcification |
| CTR | Cardiacthoracic ratio |
| RI/ACEI/ARB | Renin inhibitor/angiotensin-converting enzyme inhibitors/angiotensin receptor blocker |
| EHR | Electronic health record |
| ECG | Electrocardiogram |
Appendix A

| Study | Dataset | Methodology | Proposed Model | Evaluation Metrics | Results |
|---|---|---|---|---|---|
| A machine learning-based approach for predicting the outbreak of cardiovascular diseases in patients on dialysis. | Italian dataset (Istituto di Fisiologia Clinica); American dataset (NIDDK repository). | SVM with RBF kernel, optimized using GridSearch. | Nonlinear SVC with RBF kernel. | Accuracy | 95.25% (Italian); 92.15% (American). |
| Utilizing dynamic treatment information for MACE prediction of acute coronary syndrome. | 2930 ACS patient samples with 232 static and 2194 dynamic features. | Bidirectional recurrent neural network (RNN) on EHR data. | Dynamic, Boosted-RMTM RNN-based deep learning model. | AUC Accuracy | 0.713. 0.764. |
| Rest scan does not improve automatic machine learning prediction of major adverse coronary events after high-speed myocardial perfusion imaging. | 2619 patients undergoing high-speed SPECT imaging. | Machine learning using clinical and imaging variables from stress and rest scans. | Not mentioned. | AUC | 0.81. |
| Design of 1-year mortality forecast at hospital admission: a machine learning approach. | Retrospective dataset from EHR from Hospital La Fe with 36 features. | SVM, KNN, gradient boosting, RF, and multilayer perceptron. | Gradient boosting classifier (best performer). | AUC | 0.911. |
| Sensitivity | 0.858. | ||||
| Specificity | 0.807. | ||||
| Prediction of hidden coronary artery disease using machine learning in patients with acute ischemic stroke. | 1710 patients in training set, 348 in validation. | Build 2 models for any CAD and obstructive CAD. | XGB (any CAD); LGR (obstructive CAD). | AUC | 0.763; 0.714. |
| Real-time AI prediction for major adverse cardiac events in emergency department patients with chest pain. | 85,254 ED patients with chest pain from 3 hospitals. | RF, LGR, SVC, and KNN. | RF model integrated with HIS. | AUC | AMI < 1 mo: (0.915); mortality < 1 mo (0.999). |
| Exploring the feasibility of machine learning to predict risk stratification within 3 months in chest pain patients with suspected NSTE-ACS. | NSTE-ACS chest pain patients from Beijing Anzhen Emergency Chest Pain Center and Beijing Bo’ai Hospital. | Five classifiers including NB, LGR, Linear SVC, etc. | NB, LGR, and Linear SVC. | AUC | 0.88–0.98. |
| Accuracy | 0.8–1. | ||||
| Precision | 0.8–1. | ||||
| Recall | 0.8–1. | ||||
| F-measure | 0.8–1. | ||||
| Machine learning-based cardiovascular event prediction for percutaneous coronary intervention. | 986 PCI patients (clinical features). | XGB, LightGBM, NN, and SVM. | LightGBM. | AUC | 0.73 |
| F1 Score | 0.86. | ||||
| A soft voting ensemble classifier for early prediction and diagnosis of occurrences of major adverse cardiovascular events for STEMI and NSTEMI. | Korea Acute Myocardial Infarction Registry (KAMIR) (11,189 patient). | Soft voting ensemble combining RF, Extra Tree, gradient boosting, and SVE with five-fold cv. | Soft voting ensemble (SVE). | AUC | 0.994–0.996 |
| Accuracy | 0.888–0.909 | ||||
| Deep learning-based prediction model of occurrences of major adverse cardiac events during 1-year follow-up after hospital discharge in patients with AMI using knowledge mining. | Korea Acute Myocardial Infarction Registry; 10,813 AMI patients. | DNN, GBM, and GLM; hyperparameter tuning via grid search. | DNN. | AUC | 0.94–0.96. |
| Machine learning-based risk prediction for major adverse cardiovascular events. | 128,000 admissions of 29,262 patients were included in the MACE group. | GLM, RF, GBM, and LDA hyperparameter tuning via grid search. | RF (best performer). | AUC | 0.88. |
| Machine learning to predict long-term cardiac-relative prognosis in patients with extra-cardiac vascular disease. | 636 patients with IS, TIA, and/or PAD; clinical and CCTA data. | ML with automated feature selection; compared to MDI, SIS, SSS, and FRS. | Unnamed ML model. | AUC | 0.92. |
| Prediction of adverse cardiac events in emergency department patients with chest pain using machine learning for variable selection | 702 patients with non-traumatic chest pain at Singapore ED | RF for feature selection, geometric distance-based ML scoring | ML scoring model | AUC | 3 variables: 0.812. |
| Sensitivity | 0.828. | ||||
| Specificity | 0.634. | ||||
| Evidential MACE prediction of acute coronary syndrome using electronic health records. | 2930 ACS patient samples (clinical EHR data). | Hybrid model using Rough Set Theory (RST) + Dempster–Shafer Theory (DST) integrating ML outputs. | Evidential Ensemble Model (RST + DST). | AUC: | 0.715. |
| Utilizing Chinese admission records for MACE prediction of acute coronary syndrome. | 2930 ACS patient admission records from a Chinese hospital. | Hybrid of rule-based NLP + CRFs for feature extraction; ML classifiers applied SVM, RF, NB, and L1-LGR. | RF (best performer). | AUC | 0.72. |
| MACE prediction of acute coronary syndrome via boosted resampling classification using electronic medical records. | 2930 ACS patient EMRs with 268 features. | Boosting with over-sampling and under-sampling to balance MACE data. | Boosted resampling classifier. | AUC | 0.672. |
| Incremental value of machine learning for risk prediction in tetralogy of Fallot. | 25 rTOF patient reviews by 5 ACHD experts. | Comparison between ML and expert clinical risk scoring. | Unnamed ML model. | AUC | AGE ≥ 20 0.85; AGE < 20 0.98. |
| Machine learning models to predict major adverse cardiovascular events after orthotopic liver transplantation: a cohort study. | 1459 OLT patients. | RF, SVM, XGB, and LGR. | XGB (best performer). | AUC | 0.71 (0.63–0.79). |
| Using machine learning techniques to predict MACE in very young acute coronary syndrome patients. | 492 patients aged under 40 with coronary angiography. | Machine learning models (SVM, NB, MLP, LDA, RF, LassoLGR, L1LGR, and L2LGR). | RF (best performer). | AUC | 0.79 (0.69–0.88). |
| A stacking ensemble prediction model for the occurrences of major adverse cardiovascular events in patients with acute coronary syndrome on imbalanced data. | Korea Acute Myocardial Infarction Registry (KAMIR-NIH). | 7 ML models (LGR, SVM, KNN, DT, RF, XGBt, and AdaB) as base learners + stacking ensemble. | Stacking ensemble with SMOTETomek. | AUC | 0.9863. |
| Accuracy | 0.9862. | ||||
| F1-score | 0.9862. | ||||
| A Deep-Learning Neural Network-Based Predictive System for the Occurrence of Major Adverse Cardiovascular Events (MACE) in Patients with Acute Myocardial Infarction | KAMIR-IV dataset, 11,189 AMI patients | DNN, SMOTE for data imbalance, hyperparameter tuning via grid search | DNN-based prediction system | Accuracy | 0.9835. |
| AUC | 0.9943. | ||||
| Machine learning for major adverse cardiac events prediction in patients with acute coronary syndrome: ADDICT-ICCU study. | ADDICT-ICCU registry (1499 ACS patients; 39 centers in France). | XGB for feature selection; RF for prediction; compared to TIMI, GRACE, and traditional models. | ML-based model (XGB + RF). | AUC | 0.96. |
| Machine learning for early prediction of major adverse cardiovascular events after first percutaneous coronary intervention in patients With AMI. | 1531 AMI patients post-PCI; 1362 patients followed up. | ANN, KNN, SVM, RF, and LGR 7-fold CV. | ANN. | AUC | 0.8049. |
| Accuracy | 0.8052. | ||||
| F1-score | 0.7947. |
Appendix B
| Overall (n = 412) | MACE | p-Value | ||
|---|---|---|---|---|
| Never Occurred (n = 242) | Occurred (n = 170) | |||
| Age (mean (SD)) | 69.19 (12.14) | 67.96 (12.59) | 70.94 (11.29) | 0.014 |
| Gender = Female (%) | 192 (46.6) | 122 (50.4) | 70 (41.2) | 0.08 |
| Vintage (Year) (mean (SD)) | 8.18 (7.25) | 8.83 (7.81) | 7.25 (6.29) | 0.029 |
| Height (mean (SD)) | 161.76 (8.51) | 161.84 (8.86) | 161.65 (8.02) | 0.832 |
| Weight (mean (SD)) | 60.13 (13.27) | 60.47 (13.51) | 59.66 (12.95) | 0.54 |
| AVA = Artificial Fistula (%) | 57 (13.8) | 31 (12.8) | 26 (15.3) | 0.566 |
| Location of AVA (%) | 0.837 | |||
| Left Forearm | 306 (74.3) | 177 (73.1) | 129 (75.9) | |
| Left Upper Arm | 56 (13.6) | 36 (14.9) | 20 (11.8) | |
| Right Forearm | 34 (8.3) | 20 (8.3) | 14 (8.2) | |
| Right Upper Arm | 16 (3.9) | 9 (3.7) | 7 (4.1) | |
| AV cal (%) | 196 (62.6) | 106 (56.1) | 90 (72.6) | 0.005 |
| AR (%) | 0.142 | |||
| - | 101 (24.5) | 56 (23.1) | 45 (26.5) | |
| None | 178 (43.2) | 115 (47.5) | 63 (37.1) | |
| Negligible or Mild | 125 (30.3) | 68 (28.1) | 57 (33.5) | |
| Moderate | 8 (1.9) | 3 (1.2) | 5 (2.9) | |
| AS (%) | 0.029 | |||
| - | 101 (24.5) | 56 (23.1) | 45 (26.5) | |
| None | 277 (67.2) | 172 (71.1) | 105 (61.8) | |
| Negligible or Mild | 22 (5.3) | 12 (5.0) | 10 (5.9) | |
| Moderate | 11 (2.7) | 2 (0.8) | 9 (5.3) | |
| Severe | 1 (0.2) | 0 (0.0) | 1 (0.6) | |
| MV cal = 1 (%) | 125 (39.9) | 67 (35.4) | 58 (46.8) | 0.06 |
| MR (%) | 0.117 | |||
| - | 101 (24.5) | 56 (23.1) | 45 (26.5) | |
| None | 62 (15.0) | 44 (18.2) | 18 (10.6) | |
| Negligible or Mild | 194 (47.1) | 116 (47.9) | 78 (45.9) | |
| Moderate | 46 (11.2) | 22 (9.1) | 24 (14.1) | |
| Severe | 9 (2.2) | 4 (1.7) | 5 (2.9) | |
| MS (%) | 0.737 | |||
| - | 101 (24.5) | 56 (23.1) | 45 (26.5) | |
| None | 305 (74.0) | 182 (75.2) | 123 (72.4) | |
| Negligible or Mild | 5 (1.2) | 3 (1.2) | 2 (1.2) | |
| Moderate | 1 (0.2) | 1 (0.4) | 0 (0.0) | |
| Diastolic dysfunction (%) | 0.628 | |||
| - | 102 (24.8) | 56 (23.1) | 46 (27.1) | |
| None | 187 (45.4) | 109 (45.0) | 78 (45.9) | |
| Negligible or Mild | 106 (25.7) | 66 (27.3) | 40 (23.5) | |
| Moderate | 15 (3.6) | 9 (3.7) | 6 (3.5) | |
| Severe | 2 (0.5) | 2 (0.8) | 0 (0.0) | |
| LVH (%) | 237 (79.3) | 135 (74.6) | 102 (86.4) | 0.02 |
| LVH grade (mean (SD)) | 1.97 (1.23) | 1.82 (1.27) | 2.21 (1.13) | 0.007 |
| LVH type (%) | 0.024 | |||
| 1 | 131 (43.8) | 72 (39.8) | 59 (50.0) | |
| 2 | 106 (35.5) | 63 (34.8) | 43 (36.4) | |
| 3 | 28 (9.4) | 24 (13.3) | 4 (3.4) | |
| 4 | 34 (11.4) | 22 (12.2) | 12 (10.2) | |
| EF(%) (mean (SD)) | 67.20 (12.10) | 68.65 (11.16) | 65.04 (13.13) | 0.012 |
| IVCD (cm) (mean (SD)) | 1.50 (0.43) | 1.44 (0.43) | 1.62 (0.41) | 0.003 |
| Comorbidities | ||||
| DM (%) | 198 (48.1) | 99 (40.9) | 99 (58.2) | 0.001 |
| HTN (%) | 332 (80.6) | 187 (77.3) | 145 (85.3) | 0.057 |
| Dyslipid (%) | 220 (53.4) | 130 (53.7) | 90 (52.9) | 0.956 |
| CAD (%) | 173 (42.0) | 87 (36.0) | 86 (50.6) | 0.004 |
| AMI (%) | 12 (2.9) | 3 (1.2) | 9 (5.3) | 0.035 |
| CVA (%) | 10 (2.4) | 4 (1.7) | 6 (3.5) | 0.372 |
| PAOD (%) | 111 (26.9) | 53 (21.9) | 58 (34.1) | 0.008 |
| HF (%) | 91 (22.1) | 44 (18.2) | 47 (27.6) | 0.031 |
| COPD (%) | 38 (9.2) | 22 (9.1) | 16 (9.4) | 1 |
| LC = 0 (%) | 412 (100.0) | 242 (100.0) | 170 (100.0) | NA |
| Malignancy (%) | 41 (10.0) | 27 (11.2) | 14 (8.2) | 0.419 |
| Arrhythmia (%) | 46 (11.2) | 25 (10.3) | 21 (12.4) | 0.629 |
| Amputation (%) | 0.026 | |||
| 0 | 405 (98.3) | 241 (99.6) | 164 (96.5) | |
| 1.1 | 2 (0.5) | 1 (0.4) | 1 (0.6) | |
| 1.2 | 5 (1.2) | 0 (0.0) | 5 (2.9) | |
| Total protein (gm/dL) (mean (SD)) | 6.78 (0.53) | 6.80 (0.51) | 6.76 (0.57) | 0.45 |
| Albumin (gm/dL) (mean (SD)) | 3.86 (0.38) | 3.92 (0.33) | 3.78 (0.42) | <0.001 |
| A.S.T. GOT (IU/L) (mean (SD)) | 16.44 (10.05) | 15.85 (6.93) | 17.29 (13.26) | 0.153 |
| A.L.T. GPT (IU/L) (mean (SD)) | 12.67 (11.68) | 12.26 (7.17) | 13.24 (16.07) | 0.407 |
| Alkaline-P (IU/L) (mean (SD)) | 76.59 (40.74) | 73.48 (39.83) | 81.03 (41.72) | 0.064 |
| Total Bilirubin (mg/dL) (mean (SD)) | 0.54 (0.22) | 0.53 (0.22) | 0.55 (0.22) | 0.449 |
| Cholesterol (mg/dL) (mean (SD)) | 156.28 (37.50) | 159.12 (35.11) | 152.23 (40.43) | 0.066 |
| Triglyceride (mg/dL) (mean (SD)) | 142.82 (110.09) | 150.46 (119.93) | 131.94 (93.60) | 0.093 |
| GlucoseAC (mg/dL) (mean (SD)) | 115.47 (54.92) | 112.51 (52.44) | 119.69 (58.18) | 0.192 |
| WBC (×1000/μL) (mean (SD)) | 6.91 (1.94) | 6.92 (2.04) | 6.91 (1.81) | 0.947 |
| RBC (×106/μL) (mean (SD)) | 3.33 (0.54) | 3.36 (0.55) | 3.28 (0.52) | 0.123 |
| Hb (g/dL) (mean (SD)) | 10.38 (1.44) | 10.50 (1.44) | 10.19 (1.42) | 0.029 |
| Hct (%) (mean (SD)) | 31.11 (4.30) | 31.43 (4.32) | 30.65 (4.24) | 0.072 |
| MCV (fl) (mean (SD)) | 94.06 (7.59) | 94.11 (7.80) | 94.00 (7.32) | 0.881 |
| Platelet (×1000/μL) (mean (SD)) | 192.60 (58.63) | 195.76 (55.65) | 188.10 (62.52) | 0.192 |
| Fe (μg/dL) (mean (SD)) | 74.89 (33.08) | 76.93 (32.43) | 71.99 (33.87) | 0.136 |
| TIBC (μg/dL) (mean (SD)) | 241.33 (48.68) | 242.40 (46.26) | 239.79 (52.02) | 0.593 |
| Ferritin (ng/mL) (mean (SD)) | 537.89 (277.02) | 532.43 (248.82) | 545.66 (313.44) | 0.634 |
| Tranferrin saturation (%) (mean (SD)) | 31.35 (12.91) | 32.20 (13.25) | 30.14 (12.36) | 0.112 |
| Al (ng/mL) (mean (SD)) | 6.86 (3.96) | 6.84 (3.94) | 6.89 (3.99) | 0.891 |
| Post-Dialysis Weight (kg) (mean (SD)) | 60.21 (13.27) | 60.47 (13.43) | 59.82 (13.07) | 0.625 |
| Uric acid (mg/dL) (mean (SD)) | 6.32 (1.60) | 6.34 (1.64) | 6.29 (1.54) | 0.725 |
| Na (meq/L) (mean (SD)) | 138.01 (3.10) | 138.20 (2.95) | 137.74 (3.30) | 0.132 |
| K (meq/L) (mean (SD)) | 4.63 (0.68) | 4.69 (0.64) | 4.56 (0.72) | 0.066 |
| iCa (mg/dL) (mean (SD)) | 4.56 (0.51) | 4.55 (0.51) | 4.58 (0.52) | 0.56 |
| P (mg/dL) (mean (SD)) | 5.13 (1.35) | 5.02 (1.25) | 5.28 (1.47) | 0.051 |
| Kt/V (Gotch) (mean (SD)) | 1.38 (0.19) | 1.39 (0.20) | 1.35 (0.19) | 0.05 |
| PTH (pg/mL) (mean (SD)) | 311.25 (313.97) | 289.04 (273.17) | 342.86 (362.78) | 0.087 |
| Ca × P (mg2/dL2) (mean (SD)) | 46.88 (13.21) | 45.81 (12.66) | 48.45 (13.86) | 0.048 |
| CXR_AoAC (%) | <0.001 | |||
| 0 | 120 (31.4) | 90 (40.5) | 30 (18.8) | |
| 1 | 83 (21.7) | 49 (22.1) | 34 (21.2) | |
| 2 | 107 (28.0) | 49 (22.1) | 58 (36.2) | |
| 3 | 72 (18.8) | 34 (15.3) | 38 (23.8) | |
| Cardiac/thoracic ratio (%) (mean (SD)) | 0.52 (0.07) | 0.51 (0.06) | 0.53 (0.07) | <0.001 |
| Medication | ||||
| DDP-4 inhibitor (%) | 104 (25.2) | 54 (22.3) | 50 (29.4) | 0.129 |
| TZD (%) | 16 (3.9) | 7 (2.9) | 9 (5.3) | 0.326 |
| SU (%) | 46 (11.2) | 25 (10.3) | 21 (12.4) | 0.629 |
| MEGLITINIDES (%) | 39 (9.5) | 19 (7.9) | 20 (11.8) | 0.244 |
| Alpha-glucose inhibitor (%) | 11 (2.7) | 1 (0.4) | 10 (5.9) | 0.002 |
| Insulin (%) | 85 (20.6) | 33 (13.6) | 52 (30.6) | <0.001 |
| GLP-1 (%) | 1 (0.2) | 0 (0.0) | 1 (0.6) | 0.859 |
| Statin (%) | 137 (33.3) | 73 (30.2) | 64 (37.6) | 0.139 |
| Fibrate (%) | 11 (2.7) | 5 (2.1) | 6 (3.5) | 0.551 |
| CCB (%) | 232 (56.3) | 131 (54.1) | 101 (59.4) | 0.336 |
| RI/ACEI/ARB (%) | 217 (52.7) | 117 (48.3) | 100 (58.8) | 0.046 |
| B-blocker (%) | 211 (51.2) | 118 (48.8) | 93 (54.7) | 0.276 |
| Vasodilator (%) | 94 (22.8) | 55 (22.7) | 39 (22.9) | 1 |
| Alpha-blocker (%) | 46 (11.2) | 29 (12.0) | 17 (10.0) | 0.638 |
| Antiplatelet (%) | 199 (48.3) | 82 (33.9) | 117 (68.8) | <0.001 |
| Anti-coagulants (%) | 20 (4.9) | 8 (3.3) | 12 (7.1) | 0.13 |
| Phosphate binders (calcium) (%) | 242 (58.7) | 149 (61.6) | 93 (54.7) | 0.196 |
| Calcitriol (%) | 173 (42.0) | 104 (43.0) | 69 (40.6) | 0.703 |
| Phosphate binder (non-calcium) (%) | 93 (22.6) | 50 (20.7) | 43 (25.3) | 0.323 |
| Interdyalytic hypotension (%) | 315 (76.5) | 186 (76.9) | 129 (75.9) | 0.911 |
| No of hypotension episodes (mean (SD)) | 5.41 (3.26) | 5.46 (3.21) | 5.34 (3.33) | 0.706 |
Appendix C
| Hyperparameters | Setting |
|---|---|
| colsample_bytree | 0.8 |
| subsample | 0.8 |
| booster | gbtree |
| max_depth | 10 |
| eta | 0.1 |
| eval_metric | auc |
| eval_metric | error |
| objective | binary: logistic |
| gamma | 0.01 |
| lambda | 2 |
| min_child_weight | 1 |
| Feature | Racy |
|---|---|
| iterations | 1000 |
| thread_count | 10 |
| border_count | 32 |
| depth | 8 |
| eval_metric | AUC |
| loss_function | Logloss |
| objective | binary:logistic |
| logging_level | Silent |
| l2_leaf_reg | 2 |
| random_seed | 123 |
| learning_rate | 0.001 |
| Feature | Racy |
|---|---|
| num_leaves | 3 |
| thread_count | 10 |
| nthread | 1 |
| metric | auc |
| metric | binary_error |
| objective | binary |
| min_data | 1 |
| learning_rate | 0.1 |
References
- Mezzatesta, S.; Torino, C.; De Meo, P.; Fiumara, G.; Vilasi, A. A machine learning-based approach for predicting the outbreak of cardiovascular diseases in patients on dialysis. Comput. Methods Programs Biomed. 2019, 177, 9–15. [Google Scholar] [CrossRef] [PubMed]
- Therneau, T.; Atkinson, B.; Ripley, B.; Ripley, M.B. Package ‘rpart’. 2015. Available online: http://cran.ma.ic.ac.uk/web/packages/rpart/rpart.pdf (accessed on 20 April 2016).
- Breiman, L. Random forests. Mach. Learn. 2001, 45, 5–32. [Google Scholar] [CrossRef]
- Chen, T.; He, T.; Benesty, M.; Khotilovich, V.; Tang, Y.; Cho, H.; Chen, K.; Mitchell, R.; Cano, I.; Zhou, T. Xgboost: Extreme Gradient Boosting. R Package Version 0.4-2. 2015. Available online: https://cran.r-project.org/web/packages/xgboost/vignettes/xgboost.pdf (accessed on 18 April 2025).
- Prokhorenkova, L.; Gusev, G.; Vorobev, A.; Dorogush, A.V.; Gulin, A. CatBoost: Unbiased boosting with categorical features. Adv. Neural Inf. Process. Syst. 2018, 31, 1–11. [Google Scholar]
- Dorogush, A.V.; Ershov, V.; Gulin, A. CatBoost: Gradient boosting with categorical features support. arXiv 2018, arXiv:1810.11363. [Google Scholar]
- Ke, G.; Meng, Q.; Finley, T.; Wang, T.; Chen, W.; Ma, W.; Ye, Q.; Liu, T.-Y. Lightgbm: A highly efficient gradient boosting decision tree. Adv. Neural Inf. Process. Syst. 2017, 30, 1–9. [Google Scholar]
- Sharma, S.; Farrington, K.; Kozarski, R.; Christopoulos, C.; Niespialowska-Steuden, M.; Moffat, D.; Gorog, D.A. Impaired thrombolysis: A novel cardiovascular risk factor in end-stage renal disease. Eur. Heart J. 2013, 34, 354–363. [Google Scholar] [CrossRef]
- AlJaroudi, W.; Koneru, J.; Iqbal, F.; Aggarwal, H.; Heo, J.; Iskandrian, A.E. Left ventricular mechanical dyssynchrony by phase analysis of gated single photon emission computed tomography in end-stage renal disease. Am. J. Cardiol. 2010, 106, 1042–1047. [Google Scholar] [CrossRef]
- Malik, D.; Mittal, B.; Sood, A.; Sharma, A.; Parmar, M.; Kaur, K.; Bahl, A. Evaluation of left ventricular mechanical dyssynchrony with phase analysis in end-stage renal disease patients with normal gated SPECT-MPI. World J. Nucl. Med. 2019, 18, 238–243. [Google Scholar] [CrossRef]
- Gowdak, L.H.W.; de Paula, F.J.; César, L.A.M.; Martinez Filho, E.E.; Ianhez, L.E.; Krieger, E.M.; Ramires, J.A.F.; de Lima, J.J.G. Screening for significant coronary artery disease in high-risk renal transplant candidates. Coron. Artery Dis. 2007, 18, 553–558. [Google Scholar] [CrossRef]
- Feuchtner, G.; Kerber, J.; Burghard, P.; Dichtl, W.; Friedrich, G.; Bonaros, N.; Plank, F. The high-risk criteria low-attenuation plaque< 60 HU and the napkin-ring sign are the most powerful predictors of MACE: A long-term follow-up study. Eur. Heart J. -Cardiovasc. Imaging 2017, 18, 772–779. [Google Scholar]
- Landray, M.J.; Emberson, J.R.; Blackwell, L.; Dasgupta, T.; Zakeri, R.; Morgan, M.D.; Ferro, C.J.; Vickery, S.; Ayrton, P.; Nair, D. Prediction of ESRD and death among people with CKD: The Chronic Renal Impairment in Birmingham (CRIB) prospective cohort study. Am. J. Kidney Dis. 2010, 56, 1082–1094. [Google Scholar] [CrossRef] [PubMed]
- Duan, H.; Sun, Z.; Dong, W.; Huang, Z. Utilizing dynamic treatment information for MACE prediction of acute coronary syndrome. BMC Med. Inform. Decis. Mak. 2019, 19, 5. [Google Scholar] [CrossRef] [PubMed]
- Betancur, J.A.; Otaki, Y.; Fish, M.; Lemley, M.; Dey, D.; Tamarappoo, B.; Germano, G.; Berman, D.; Slomka, P. Rest scan does not improve automatic machine learning prediction of major adverse coronary events after high speed myocardial perfusion imaging. J. Am. Coll. Cardiol. 2017, 69, 1590. [Google Scholar] [CrossRef]
- Blanes-Selva, V.; Ruiz-García, V.; Tortajada, S.; Benedí, J.-M.; Valdivieso, B.; García-Gómez, J.M. Design of 1-year mortality forecast at hospital admission: A machine learning approach. Health Inform. J. 2021, 27, 1460458220987580. [Google Scholar] [CrossRef]
- Heo, J.; Yoo, J.; Lee, H.; Lee, I.H.; Kim, J.-S.; Park, E.; Kim, Y.D.; Nam, H.S. Prediction of hidden coronary artery disease using machine learning in patients with acute ischemic stroke. Neurology 2022, 99, e55–e65. [Google Scholar] [CrossRef]
- Zhang, P.-I.; Hsu, C.-C.; Kao, Y.; Chen, C.-J.; Kuo, Y.-W.; Hsu, S.-L.; Liu, T.-L.; Lin, H.-J.; Wang, J.-J.; Liu, C.-F. Real-time AI prediction for major adverse cardiac events in emergency department patients with chest pain. Scand. J. Trauma Resusc. Emerg. Med. 2020, 28, 93. [Google Scholar] [CrossRef]
- Zheng, Z.C.; Wei, Y.; Nian, W.; Jiang, B.; Peng, C.; Hui, A.; Xiao, W.; Nie, S.P. Exploring the Feasibility of Machine Learning to Predict Risk Stratification Within 3 Months in Chest Pain Patients with Suspected NSTE-ACS. Biomed. Environ. Sci. 2023, 36, 625–634. [Google Scholar]
- Zhou, Y.; Zhu, R.; Chen, X.; Xu, X.; Wang, Q.; Jiang, L.; Zhu, J.; Wu, J.; Yan, H.; Zhang, L. Machine learning-based cardiovascular event prediction for percutaneous coronary intervention. J. Am. Coll. Cardiol. 2019, 73, 127. [Google Scholar] [CrossRef]
- Sherazi, S.W.A.; Bae, J.-W.; Lee, J.Y. A soft voting ensemble classifier for early prediction and diagnosis of occurrences of major adverse cardiovascular events for STEMI and NSTEMI during 2-year follow-up in patients with acute coronary syndrome. PLoS ONE 2021, 16, e0249338. [Google Scholar] [CrossRef]
- Kim, Y.J.; Saqlian, M.; Lee, J.Y. Deep learning–based prediction model of occurrences of major adverse cardiac events during 1-year follow-up after hospital discharge in patients with AMI using knowledge mining. Pers. Ubiquitous Comput. 2022, 26, 259–267. [Google Scholar] [CrossRef]
- Schrempf, M.; Kramer, D.; Jauk, S.; Veeranki, S.P.; Leodolter, W.; Rainer, P.P. Machine learning based risk prediction for major adverse cardiovascular events. In Navigating Healthcare Through Challenging Times; IOS Press: Amsterdam, The Netherlands, 2021; pp. 136–143. [Google Scholar]
- Lin, G.; Liu, Q.; Chen, Y.; Zong, X.; Xi, Y.; Li, T.; Yang, Y.; Zeng, A.; Chen, M.; Liu, C. Machine learning to predict long-term cardiac-relative prognosis in patients with extra-cardiac vascular disease. Front. Cardiovasc. Med. 2021, 8, 771504. [Google Scholar] [CrossRef] [PubMed]
- Liu, N.; Koh, Z.X.; Goh, J.; Lin, Z.; Haaland, B.; Ting, B.P.; Ong, M.E.H. Prediction of adverse cardiac events in emergency department patients with chest pain using machine learning for variable selection. BMC Med. Inform. Decis. Mak. 2014, 14, 75. [Google Scholar] [CrossRef] [PubMed]
- Hu, D.; Dong, W.; Lu, X.; Duan, H.; He, K.; Huang, Z. Evidential MACE prediction of acute coronary syndrome using electronic health records. BMC Med. Inform. Decis. Mak. 2019, 19, 61. [Google Scholar] [CrossRef]
- Hu, D.; Huang, Z.; Chan, T.-M.; Dong, W.; Lu, X.; Duan, H. Utilizing Chinese admission records for MACE prediction of acute coronary syndrome. Int. J. Environ. Res. Public Health 2016, 13, 912. [Google Scholar] [CrossRef]
- Huang, Z.; Chan, T.-M.; Dong, W. MACE prediction of acute coronary syndrome via boosted resampling classification using electronic medical records. J. Biomed. Inform. 2017, 66, 161–170. [Google Scholar] [CrossRef]
- Huang, Z.; Dong, W. Adversarial MACE prediction after acute coronary syndrome using electronic health records. IEEE J. Biomed. Health Inform. 2018, 23, 2117–2126. [Google Scholar] [CrossRef]
- Ishikita, A.; McIntosh, C.; Roche, S.L.; Barron, D.J.; Oechslin, E.; Benson, L.; Nair, K.; Lee, M.M.; Gritti, M.N.; Hanneman, K. Incremental value of machine learning for risk prediction in tetralogy of Fallot. Heart 2024, 110, 560–568. [Google Scholar] [CrossRef]
- Jain, V.; Bansal, A.; Radakovich, N.; Sharma, V.; Khan, M.Z.; Harris, K.; Bachour, S.; Kleb, C.; Cywinski, J.; Argalious, M. Machine learning models to predict major adverse cardiovascular events after orthotopic liver transplantation: A cohort study. J. Cardiothorac. Vasc. Anesth. 2021, 35, 2063–2069. [Google Scholar] [CrossRef]
- Juan-Salvadores, P.; Veiga, C.; Jiménez Díaz, V.A.; Guitián González, A.; Iglesia Carreño, C.; Martínez Reglero, C.; Baz Alonso, J.A.; Caamaño Isorna, F.; Romo, A.I. Using machine learning techniques to predict MACE in very young acute coronary syndrome patients. Diagnostics 2022, 12, 422. [Google Scholar] [CrossRef]
- Karnik, J.A.; Young, B.S.; Lew, N.L.; Herget, M.; Dubinsky, C.; Lazarus, J.M.; Chertow, G.M. Cardiac arrest and sudden death in dialysis units. Kidney Int. 2001, 60, 350–357. [Google Scholar] [CrossRef]
- Chao, C.-T.; Liao, M.-T.; Wu, C.-K. Combinations of valvular calcification and serum alkaline phosphatase predict cardiovascular risk among end-stage kidney disease patients. IJC Heart Vasc. 2024, 54, 101505. [Google Scholar] [CrossRef] [PubMed]
- Bleyer, A.; Hartman, J.; Brannon, P.; Reeves-Daniel, A.; Satko, S.; Russell, G. Characteristics of sudden death in hemodialysis patients. Kidney Int. 2006, 69, 2268–2273. [Google Scholar] [CrossRef] [PubMed]
- Chao, C.-T.; Liao, M.-T.; Wu, C.-K. Left ventricular hypertrophy geometry and vascular calcification co-modify the risk of cardiovascular mortality in patients with end-stage kidney disease: A retrospective cohort study. J. Atheroscler. Thromb. 2023, 30, 1242–1254. [Google Scholar] [CrossRef] [PubMed]
- Alqahtani, F.; Almustafa, A.; Shah, K.; Akram, Y.; Abbasi, D.; Rattan, R.; Subrayappa, N.; Alkhouli, M.; Munir, M.B. Sudden cardiac arrest in end-stage renal disease patients on dialysis: A nationwide study. Pacing Clin. Electrophysiol. 2018, 41, 1467–1475. [Google Scholar] [CrossRef]
- Wu, C.-K.; Yar, N.; Kao, Z.-K.; Chuang, M.-T.; Chang, T.-H. High Inferior Vena Cava Diameter with High Left Ventricular End Systolic Diameter as a Risk Factor for Major Adverse Cardiovascular Events, Cardiovascular and Overall Mortality among Chronic Hemodialysis Patients. J. Clin. Med. 2022, 11, 5485. [Google Scholar] [CrossRef]
- Liao, M.-T.; Chao, C.-T.; Wu, C.-K. Association of aortic arch and aortic valve calcifications with cardiovascular risk in patients on maintenance hemodialysis. Front. Cardiovasc. Med. 2022, 9, 1053265. [Google Scholar] [CrossRef]
- Ikizler, T.A.; Burrowes, J.D.; Byham-Gray, L.D.; Campbell, K.L.; Carrero, J.-J.; Chan, W.; Fouque, D.; Friedman, A.N.; Ghaddar, S.; Goldstein-Fuchs, D.J. KDOQI clinical practice guideline for nutrition in CKD: 2020 update. Am. J. Kidney Dis. 2020, 76, S1–S107. [Google Scholar] [CrossRef]
- Stekhoven, D.J.; Bühlmann, P. MissForest—non-parametric missing value imputation for mixed-type data. Bioinformatics 2012, 28, 112–118. [Google Scholar] [CrossRef]
- Gholamy, A.; Kreinovich, V.; Kosheleva, O. Why 70/30 or 80/20 relation between training and testing sets: A pedagogical explanation. Int. J. Intell. Technol. Appl. Stat. 2018, 11, 105–111. [Google Scholar]
- Kuhn, M. Building predictive models in R using the caret package. J. Stat. Softw. 2008, 28, 1–26. [Google Scholar] [CrossRef]
- Hosmer, D.W., Jr.; Lemeshow, S.; Sturdivant, R.X. Applied Logistic Regression; John Wiley & Sons: Hoboken, NJ, USA, 2013. [Google Scholar]
- Nassar, A.P., Jr.; Mocelin, A.O.; Nunes, A.L.B.; Giannini, F.P.; Brauer, L.; Andrade, F.M.; Dias, C.A. Caution when using prognostic models: A prospective comparison of 3 recent prognostic models. J. Crit. Care 2012, 27, 423.e1–423.e7. [Google Scholar] [CrossRef]
- Lundberg, S.M.; Lee, S.-I. A unified approach to interpreting model predictions. In Proceedings of the 31st International Conference on Neural Information Processing Systems, Long Beach, CA, USA, 4–9 December 2017; pp. 4768–4777. [Google Scholar]
- Antoniadi, A.M.; Du, Y.; Guendouz, Y.; Wei, L.; Mazo, C.; Becker, B.A.; Mooney, C. Current challenges and future opportunities for XAI in machine learning-based clinical decision support systems: A systematic review. Appl. Sci. 2021, 11, 5088. [Google Scholar] [CrossRef]
- Molnar, C. Interpretable Machine Learning; Lulu.com: Morrisville, NC, USA, 2020. [Google Scholar]

| Overall (n = 412) | MACE | p-Value | ||
|---|---|---|---|---|
| Never Occurred (n = 242) | Occurred (n = 170) | |||
| Age (mean (SD)) | 69.19 (12.14) | 67.96 (12.59) | 70.94 (11.29) | 0.014 |
| Gender = Female (%) | 192 (46.6) | 122 (50.4) | 70 (41.2) | 0.08 |
| Vintage (Year) (mean (SD)) | 8.18 (7.25) | 8.83 (7.81) | 7.25 (6.29) | 0.029 |
| AV cal (%) | 196 (62.6) | 106 (56.1) | 90 (72.6) | 0.005 |
| AS (%) | 0.029 | |||
| - | 101 (24.5) | 56 (23.1) | 45 (26.5) | |
| None | 277 (67.2) | 172 (71.1) | 105 (61.8) | |
| Negligible or Mild | 22 (5.3) | 12 (5.0) | 10 (5.9) | |
| Moderate | 11 (2.7) | 2 (0.8) | 9 (5.3) | |
| Severe | 1 (0.2) | 0 (0.0) | 1 (0.6) | |
| LVH (%) | 237 (79.3) | 135 (74.6) | 102 (86.4) | 0.02 |
| LVH grade (mean (SD)) | 1.97 (1.23) | 1.82 (1.27) | 2.21 (1.13) | 0.007 |
| LVH type (%) | 0.024 | |||
| 1 | 131 (43.8) | 72 (39.8) | 59 (50.0) | |
| 2 | 106 (35.5) | 63 (34.8) | 43 (36.4) | |
| 3 | 28 (9.4) | 24 (13.3) | 4 (3.4) | |
| 4 | 34 (11.4) | 22 (12.2) | 12 (10.2) | |
| EF(%) (mean (SD)) | 67.20 (12.10) | 68.65 (11.16) | 65.04 (13.13) | 0.012 |
| IVCD (cm) (mean (SD)) | 1.50 (0.43) | 1.44 (0.43) | 1.62 (0.41) | 0.003 |
| Comorbidities | ||||
| DM (%) | 198 (48.1) | 99 (40.9) | 99 (58.2) | 0.001 |
| CAD (%) | 173 (42.0) | 87 (36.0) | 86 (50.6) | 0.004 |
| AMI (%) | 12 (2.9) | 3 (1.2) | 9 (5.3) | 0.035 |
| PAOD (%) | 111 (26.9) | 53 (21.9) | 58 (34.1) | 0.008 |
| HF (%) | 91 (22.1) | 44 (18.2) | 47 (27.6) | 0.031 |
| Amputation (%) | 0.026 | |||
| 0 | 405 (98.3) | 241 (99.6) | 164 (96.5) | |
| 1.1 | 2 (0.5) | 1 (0.4) | 1 (0.6) | |
| 1.2 | 5 (1.2) | 0 (0.0) | 5 (2.9) | |
| Albumin (gm/dL) (mean (SD)) | 3.86 (0.38) | 3.92 (0.33) | 3.78 (0.42) | <0.001 |
| Hb (g/dL) (mean (SD)) | 10.38 (1.44) | 10.50 (1.44) | 10.19 (1.42) | 0.029 |
| Ca × P (mg2/dL2) (mean (SD)) | 46.88 (13.21) | 45.81 (12.66) | 48.45 (13.86) | 0.048 |
| CXR_AoAC (%) | <0.001 | |||
| 0 | 120 (31.4) | 90 (40.5) | 30 (18.8) | |
| 1 | 83 (21.7) | 49 (22.1) | 34 (21.2) | |
| 2 | 107 (28.0) | 49 (22.1) | 58 (36.2) | |
| 3 | 72 (18.8) | 34 (15.3) | 38 (23.8) | |
| Cardiac/thoracic ratio (%) (mean (SD)) | 0.52 (0.07) | 0.51 (0.06) | 0.53 (0.07) | <0.001 |
| Medication | ||||
| alpha-glucose inhibitor (%) | 11 (2.7) | 1 (0.4) | 10 (5.9) | 0.002 |
| Insulin (%) | 85 (20.6) | 33 (13.6) | 52 (30.6) | <0.001 |
| RI/ACEI/ARB (%) | 217 (52.7) | 117 (48.3) | 100 (58.8) | 0.046 |
| Antiplatelet (%) | 199 (48.3) | 82 (33.9) | 117 (68.8) | <0.001 |
| ML Method | Accuracy | Kappa | Sensitivity | Specificity | Precision | F1 | AUC (95% CI) |
|---|---|---|---|---|---|---|---|
| LGR | 0.633 | 0.264 | 0.635 | 0.631 | 0.569 | 0.584 | 0.623 (0.524–0.738) |
| CART | 0.558 | 0.092 | 0.476 | 0.616 | 0.465 | 0.47 | 0.546 (0.466–0.685) |
| RF | 0.706 | 0.399 | 0.665 | 0.735 | 0.648 | 0.652 | 0.71 (0.623–0.848) |
| XGB | 0.626 | 0.285 | 0.812 | 0.496 | 0.536 | 0.638 | 0.657 (0.557–0.789) |
| CatB | 0.728 | 0.456 | 0.765 | 0.703 | 0.651 | 0.7 | 0.755 (0.643–0.854) |
| lightGBM | 0.711 | 0.41 | 0.671 | 0.74 | 0.672 | 0.655 | 0.729 (0.64–0.862) |
| Reference | |||
|---|---|---|---|
| Non-MACE | MACE | ||
| Prediction | Non-MACE | 33 | 5 |
| MACE | 15 | 29 | |
| Ranking | Feature | Score |
|---|---|---|
| 1 | Antiplatelet | 565 |
| 2 | LVH.grade | 542 |
| 3 | CXR_AoAC_0 | 531 |
| 4 | IVCD (cm) | 526 |
| 5 | Age | 518 |
| 6 | P (mg/dL) | 506 |
| 7 | Albumin (gm/dL) | 503 |
| 8 | GlucoseAC (mg/dL) | 498 |
| 9 | Cholesterol (mg/dL) | 497 |
| 10 | Ca × P (mg2/dL2) | 490 |
| 11 | Cardiac/thoracic ratio (%) | 486 |
| 12 | Tranferrin saturation (%) | 484 |
| 13 | Fe (μg/dL) | 479 |
| 14 | TIBC (μg/dL) | 472 |
| 15 | Post-Dialysis Weight (kg) | 468 |
| ML Method | Accuracy | Kappa | Sensitivity | Specificity | Precision | F1 | AUC (95% CI) |
|---|---|---|---|---|---|---|---|
| LGR | 0.654 | 0.340 | 0.824 | 0.537 | 0.570 | 0.667 | 0.692 (0.534–0.774) |
| RF | 0.692 | 0.398 | 0.8 | 0.616 | 0.612 | 0.682 | 0.718 (0.579–0.811) |
| XGB | 0.631 | 0.299 | 0.829 | 0.492 | 0.539 | 0.651 | 0.660 (0.517–0.761) |
| CatB | 0.724 | 0.438 | 0.718 | 0.728 | 0.65 | 0.81 | 0.745 (0.605–0.830) |
| lightGBM | 0.675 | 0.353 | 0.729 | 0.637 | 0.586 | 0.649 | 0.708 (0.566–0.797) |
| Reference | |||
|---|---|---|---|
| Non-MACE | MACE | ||
| Prediction | Non-MACE | 37 | 7 |
| MACE | 11 | 27 | |
Disclaimer/Publisher’s Note: The statements, opinions and data contained in all publications are solely those of the individual author(s) and contributor(s) and not of MDPI and/or the editor(s). MDPI and/or the editor(s) disclaim responsibility for any injury to people or property resulting from any ideas, methods, instructions or products referred to in the content. |
© 2025 by the authors. Licensee MDPI, Basel, Switzerland. This article is an open access article distributed under the terms and conditions of the Creative Commons Attribution (CC BY) license (https://creativecommons.org/licenses/by/4.0/).
Share and Cite
Chuang, C.-W.; Wu, C.-K.; Wu, C.-H.; Shia, B.-C.; Chen, M. Machine Learning in Predicting Cardiac Events for ESRD Patients: A Framework for Clinical Decision Support. Diagnostics 2025, 15, 1063. https://doi.org/10.3390/diagnostics15091063
Chuang C-W, Wu C-K, Wu C-H, Shia B-C, Chen M. Machine Learning in Predicting Cardiac Events for ESRD Patients: A Framework for Clinical Decision Support. Diagnostics. 2025; 15(9):1063. https://doi.org/10.3390/diagnostics15091063
Chicago/Turabian StyleChuang, Chien-Wei, Chung-Kuan Wu, Chao-Hsin Wu, Ben-Chang Shia, and Mingchih Chen. 2025. "Machine Learning in Predicting Cardiac Events for ESRD Patients: A Framework for Clinical Decision Support" Diagnostics 15, no. 9: 1063. https://doi.org/10.3390/diagnostics15091063
APA StyleChuang, C.-W., Wu, C.-K., Wu, C.-H., Shia, B.-C., & Chen, M. (2025). Machine Learning in Predicting Cardiac Events for ESRD Patients: A Framework for Clinical Decision Support. Diagnostics, 15(9), 1063. https://doi.org/10.3390/diagnostics15091063