
The Diagnostic Value of EEG Wave Trains for Distinguishing Immature Absence Seizures and Sleep Spindles: Evidence from the WAG/Rij Rat Model


Abstract
1. Introduction
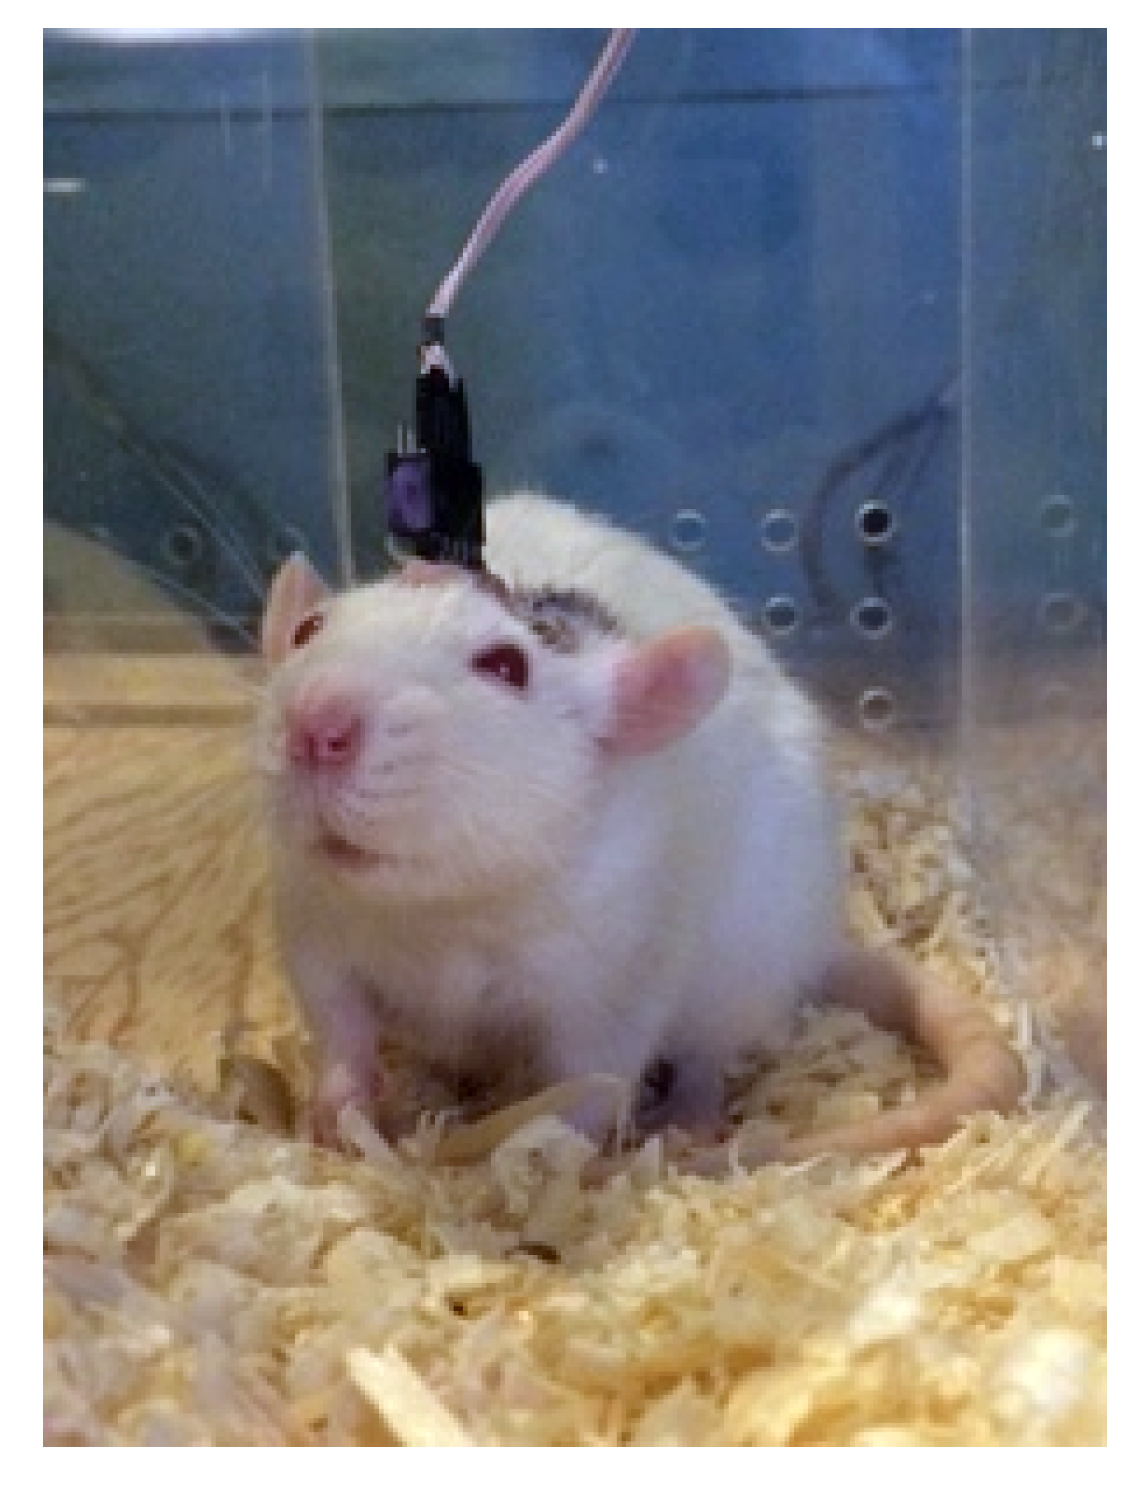
2. Animals
3. EEG Registration
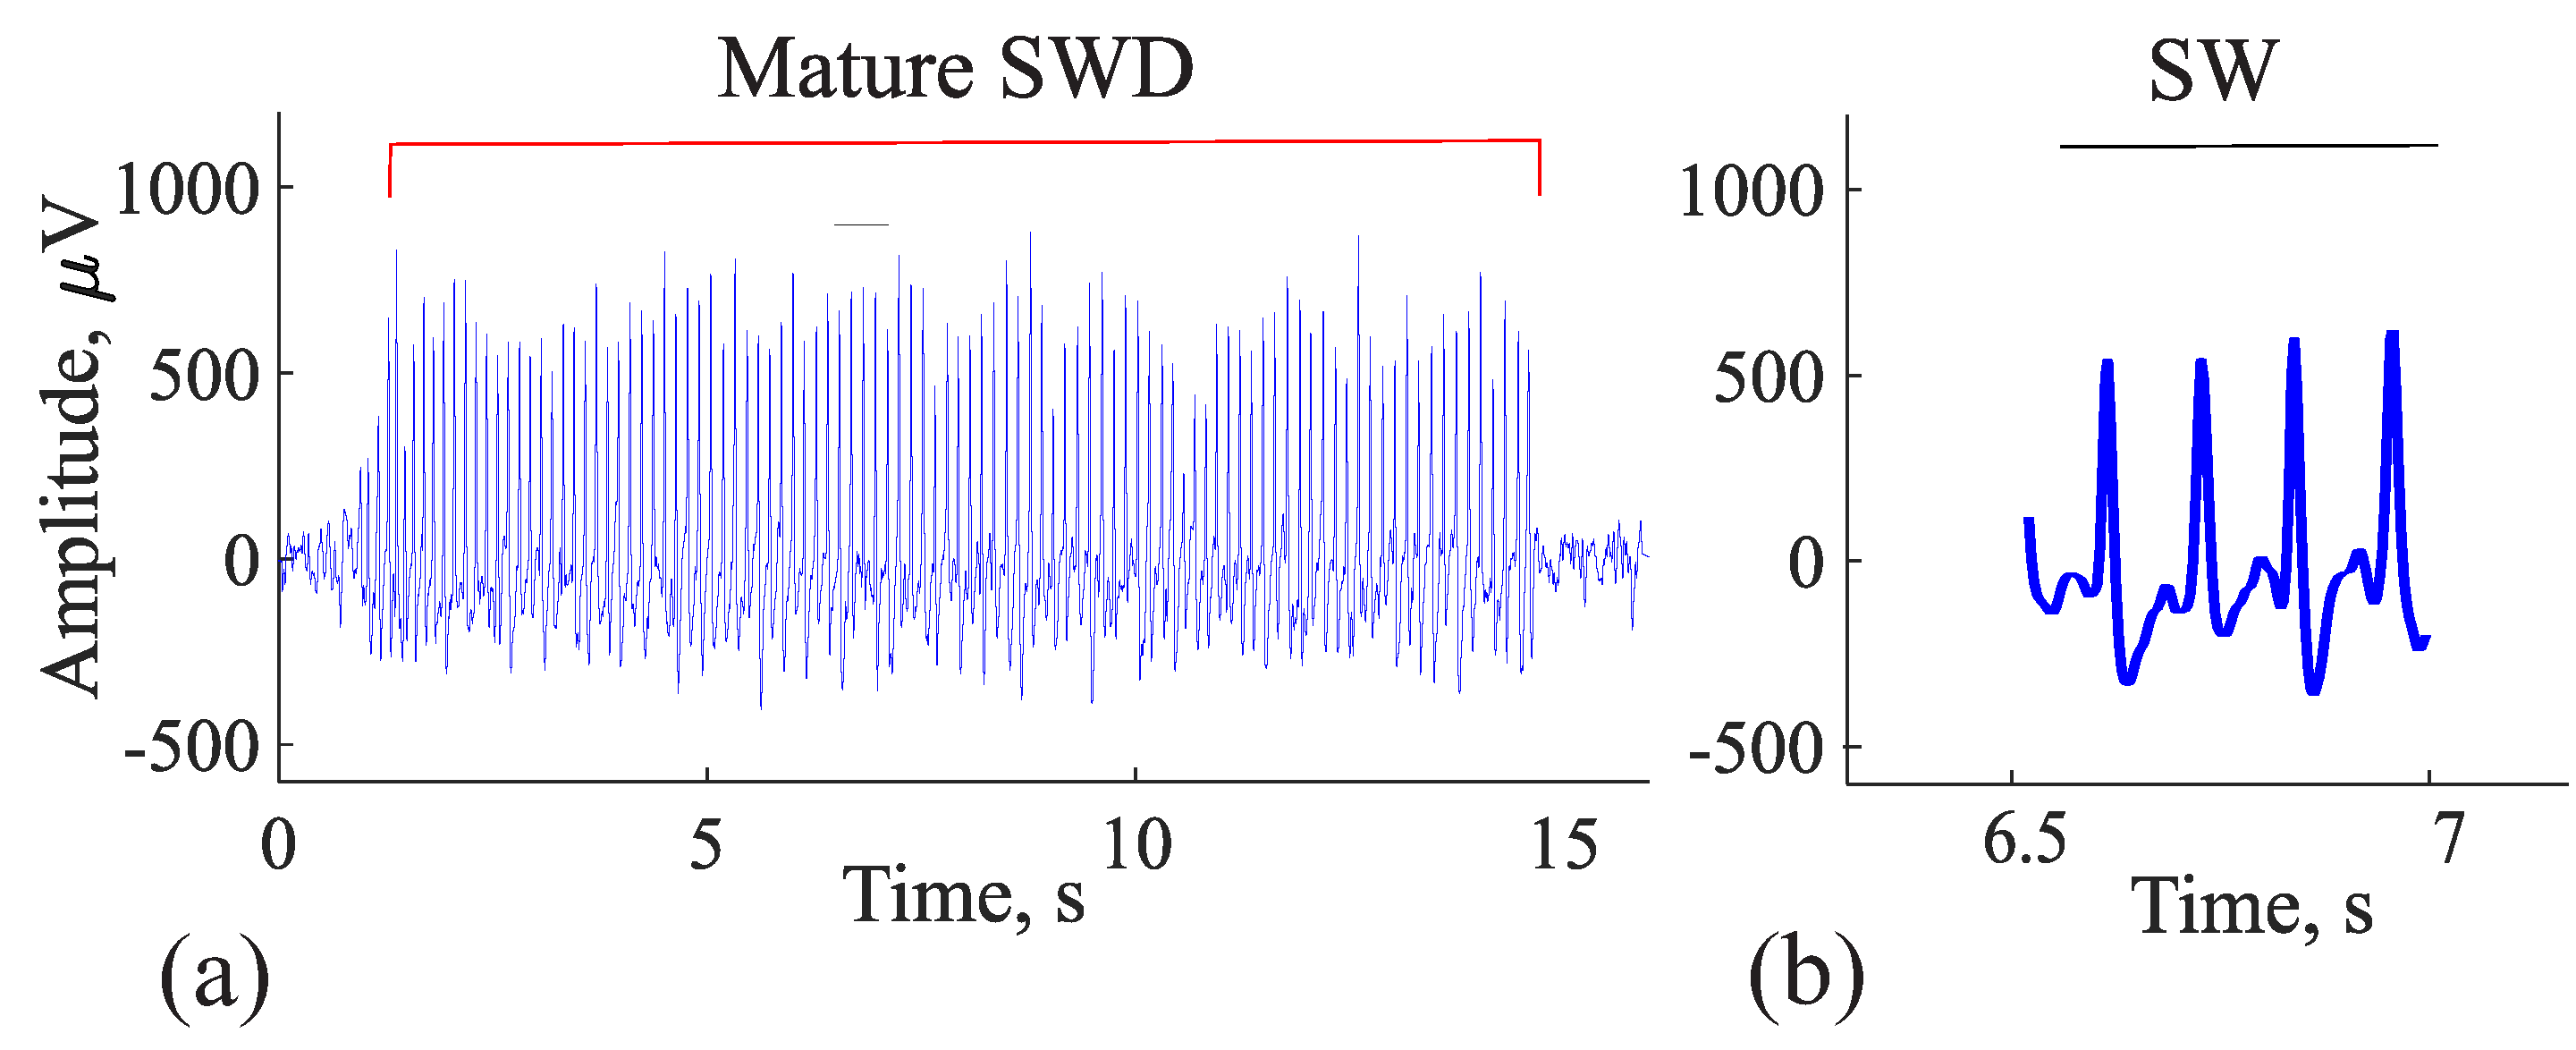
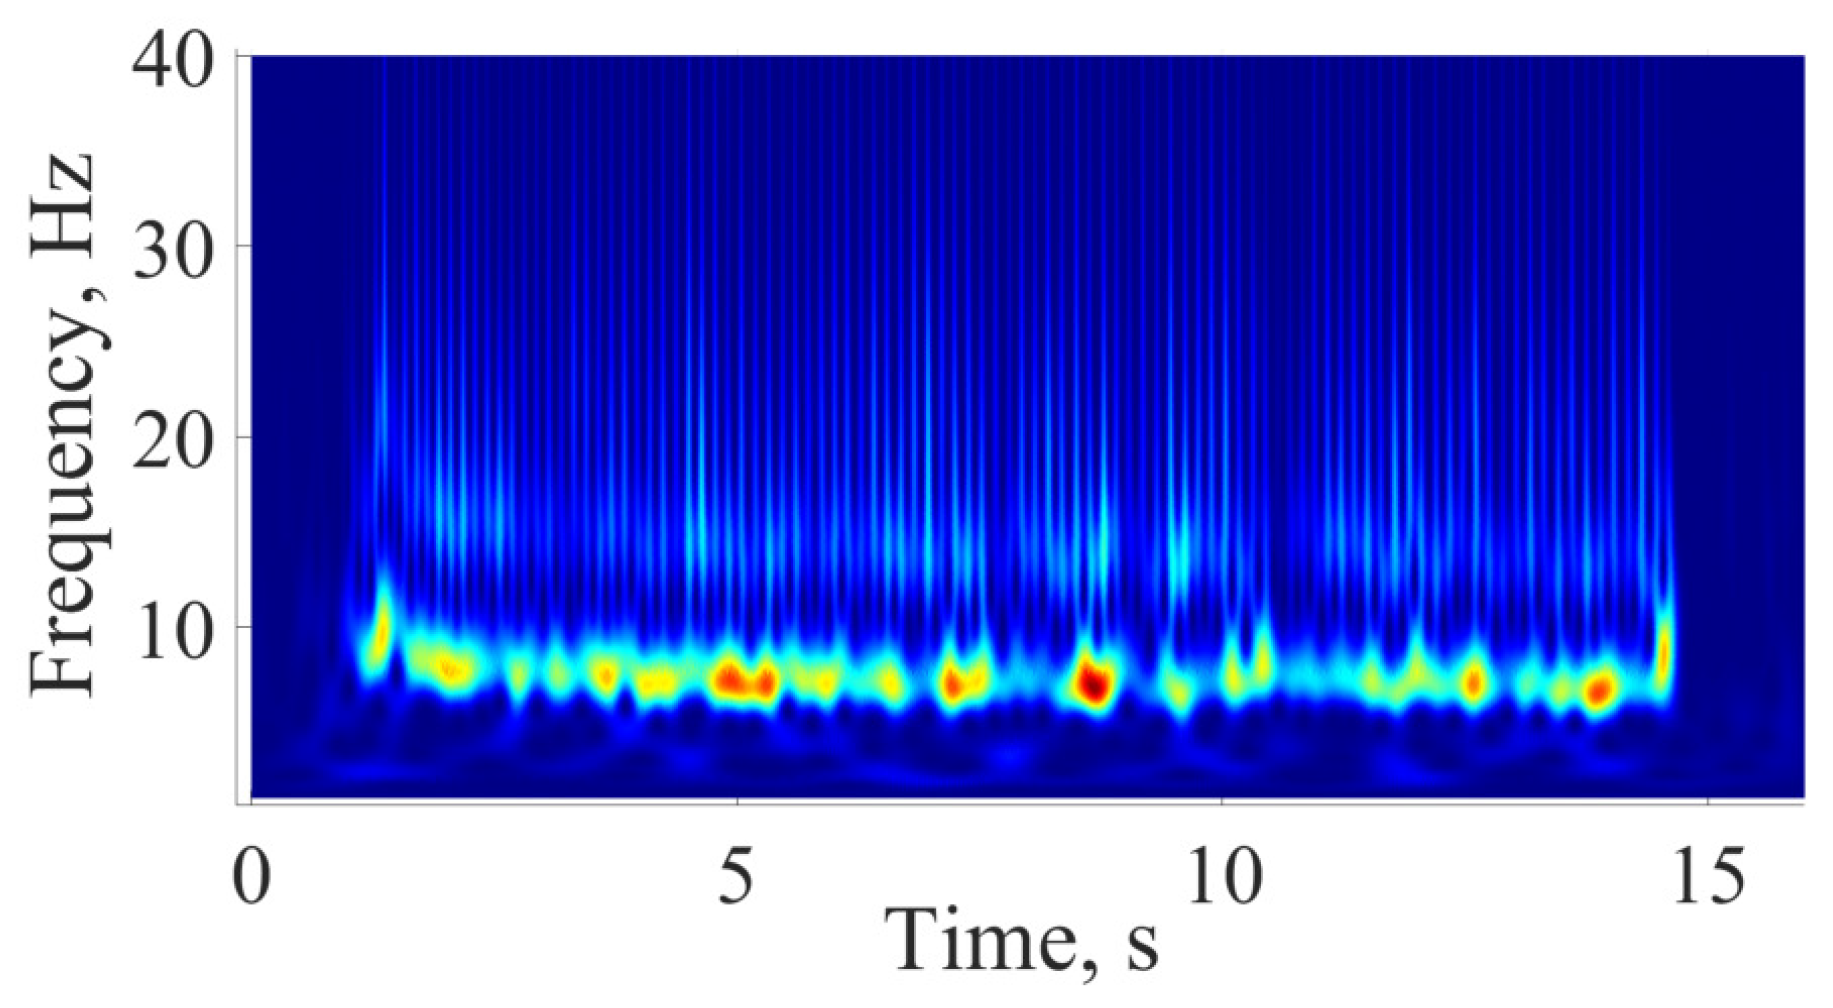
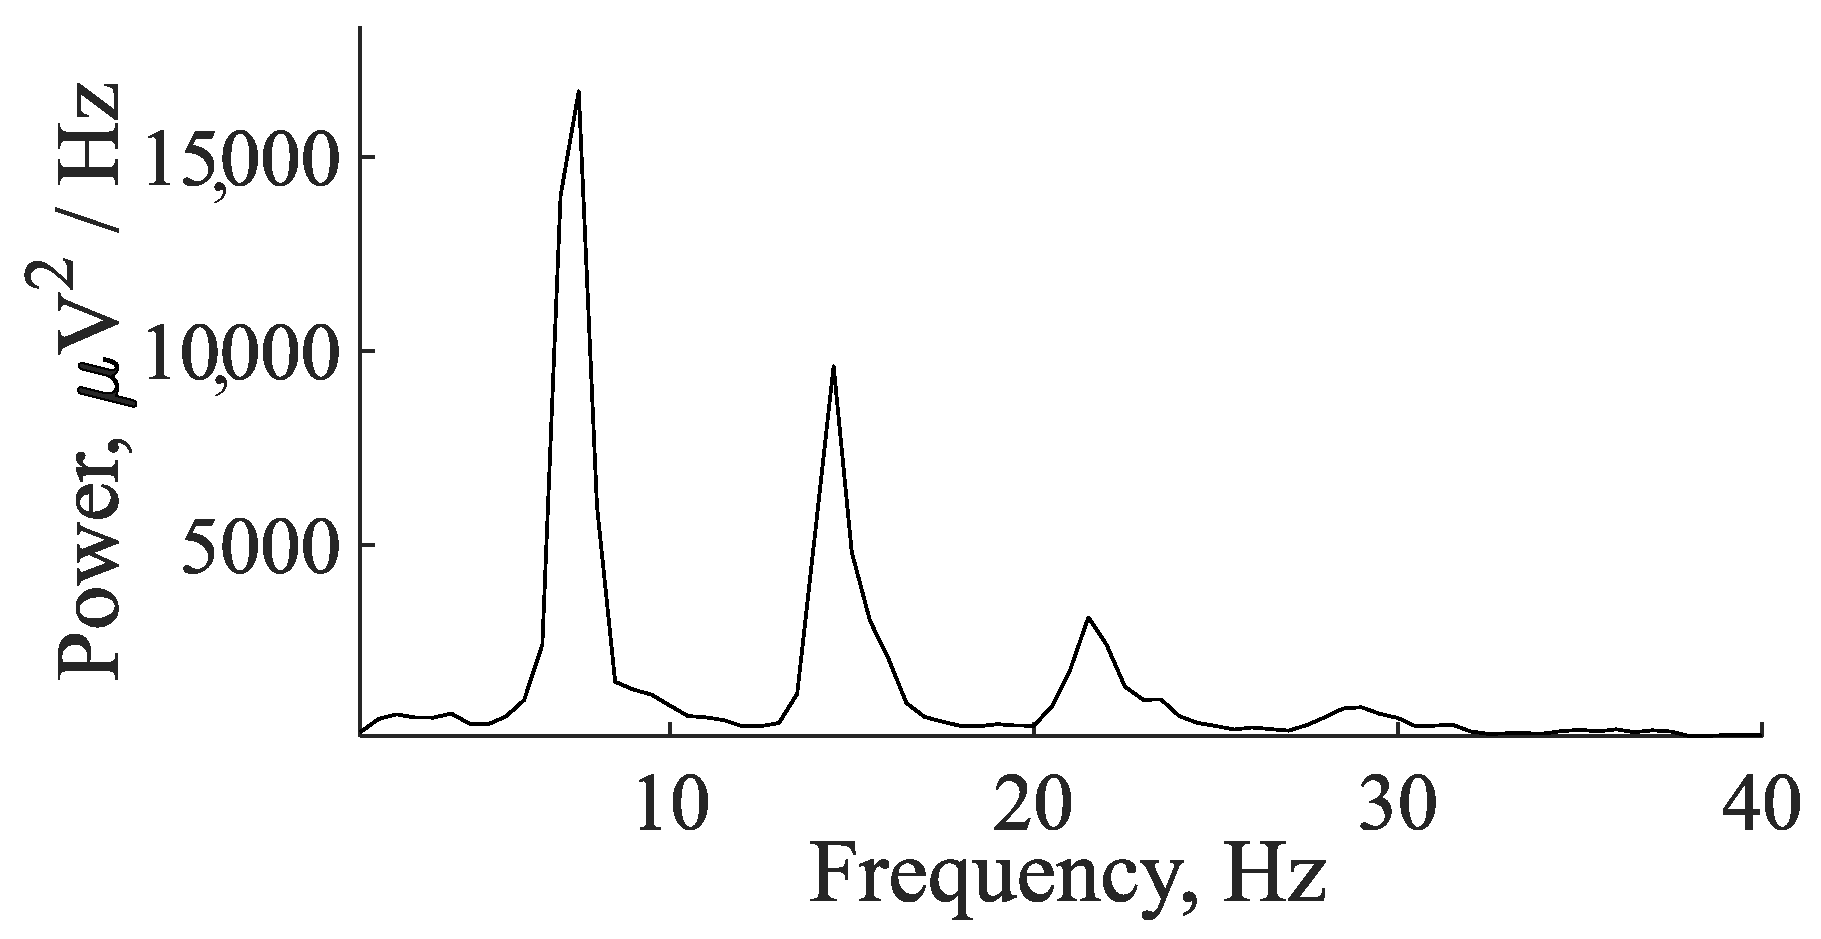
4. EEG Analysis Based on Wave Trains
- The 50 and 100 Hz notch filters were applied to remove a power-line noise.
- The filtering of the EEG with an eighth-order Butterworth filter with a passband from 0.1 to 120 Hz was applied in the forward and reverse directions.
5. Comparison of Immature Discharges and Background EEG
6. Comparison of Immature Discharges and Sleep Spindles
7. Discussion
8. Conclusions
9. Patents
Supplementary Materials
Author Contributions
Funding
Institutional Review Board Statement
Informed Consent Statement
Data Availability Statement
Conflicts of Interest
References
- Scheffer, I.E.; Berkovic, S.; Capovilla, G.; Connolly, M.B.; French, J.; Guilhoto, L.; Hirsch, E.; Jain, S.; Mathern, G.W.; Moshé, S.L.; et al. ILAE classification of the epilepsies: Position paper of the ILAE Commission for Classification and Terminology. Epilepsia 2017, 58, 512–521. [Google Scholar] [CrossRef]
- Wolf, P.; Inoue, Y. Therapeutic response of absence seizures in patients of an epilepsy clinic for adolescents and adults. J. Neurol. 1984, 231, 225–229. [Google Scholar] [CrossRef]
- Panayiotopoulos, C. Treatment of typical absence seizures and related epileptic syndromes. Paediatr. Drugs 2001, 3, 379–403. [Google Scholar] [CrossRef] [PubMed]
- Glaba, P.; Latka, M.; Krause, M.J.; Kuryło, M.; Jernajczyk, W.; Walas, W.; West, B.J. Changes in interictal pretreatment and posttreatment EEG in childhood absence epilepsy. Front. Neurosci. 2020, 14, 196. [Google Scholar] [CrossRef] [PubMed]
- Guerrero-Aranda, A.; Ramírez-Ponce, E.; Ramos-Quezada, O.; Paredes, O.; Guzmán-Quezada, E.; Genel-Espinoza, A.; Romo-Vazquez, R.; Vélez-Pérez, H. Quantitative EEG analysis in typical absence seizures: Unveiling spectral dynamics and entropy patterns. Front. Hum. Neurosci. 2023, 17, 1274834. [Google Scholar] [CrossRef] [PubMed]
- Seneviratne, U.; Cook, M.J.; D’Souza, W.J. Electroencephalography in the diagnosis of genetic generalized epilepsy syndromes. Front. Neurol. 2017, 8, 499. [Google Scholar] [CrossRef]
- Asadollahi, M.; Noorbakhsh, M.; Salehifar, V.; Simani, L. The significance of interictal spike frequency in temporal lobe epilepsy. Clin. EEG Neurosci. 2020, 51, 180–184. [Google Scholar] [CrossRef]
- Matur, Z.; Baykan, B.; Bebek, N.; Gürses, C.; Altındağ, E.; Gökyiğit, A. The evaluation of interictal focal EEG findings in adult patients with absence seizures. Seizure 2009, 18, 352–358. [Google Scholar] [CrossRef]
- Antwi, P.; Atac, E.; Ryu, J.H.; Arencibia, C.A.; Tomatsu, S.; Saleem, N.; Wu, J.; Crowley, M.J.; Banz, B.; Vaca, F.E.; et al. Driving status of patients with generalized spike–wave on EEG but no clinical seizures. Epilepsy Behav. 2019, 92, 5–13. [Google Scholar] [CrossRef]
- Springer, M.; Khalaf, A.; Vincent, P.; Ryu, J.H.; Abukhadra, Y.; Beniczky, S.; Glauser, T.; Krestel, H.; Blumenfeld, H. A machine-learning approach for predicting impaired consciousness in absence epilepsy. Ann. Clin. Transl. Neurol. 2022, 9, 1538–1550. [Google Scholar] [CrossRef]
- Fernández-Torre, J.L.; Hernández-Hernández, M.A.; Orizaola, P.; Paramio-Paz, A.; Vázquez-Higuera, J.L.; de Lucas, E.M. Typical absence status epilepticus in older people: Syndromic delineation. Epileptic Disord. 2022, 24, 555–560. [Google Scholar] [CrossRef] [PubMed]
- Shinnar, S.; Cnaan, A.; Hu, F.; Clark, P.; Dlugos, D.; Hirtz, D.G.; Masur, D.; Mizrahi, E.M.; Moshé, S.L.; Glauser, T.A.; et al. Long-term outcomes of generalized tonic-clonic seizures in a childhood absence epilepsy trial. Neurology 2015, 85, 1108–1114. [Google Scholar] [CrossRef] [PubMed]
- Blumenfeld, H.; Klein, J.P.; Schridde, U.; Vestal, M.; Rice, T.; Khera, D.S.; Bashyal, C.; Giblin, K.; Paul-Laughinghouse, C.; Wang, F.; et al. Early treatment suppresses the development of spike-wave epilepsy in a rat model. Epilepsia 2008, 49, 400–409. [Google Scholar] [CrossRef]
- Sarkisova, K.Y.; Kuznetsova, G.D.; Kulikov, M.A.; Van Luijtelaar, G. Spike–wave discharges are necessary for the expression of behavioral depression-like symptoms. Epilepsia 2010, 51, 146–160. [Google Scholar] [CrossRef] [PubMed]
- Coenen, A.; Van Luijtelaar, E. Genetic animal models for absence epilepsy: A review of the WAG/Rij strain of rats. Behav. Genet. 2003, 33, 635–655. [Google Scholar] [CrossRef] [PubMed]
- Coenen, A.; Van Luijtelaar, E. The WAG/Rij rat model for absence epilepsy: Age and sex factors. Epilepsy Res. 1987, 1, 297–301. [Google Scholar] [CrossRef]
- Depaulis, A.; Charpier, S. Pathophysiology of absence epilepsy: Insights from genetic models. Neurosci. Lett. 2018, 667, 53–65. [Google Scholar] [CrossRef]
- Russo, E.; Citraro, R.; Constanti, A.; Leo, A.; Lüttjohann, A.; van Luijtelaar, G.; De Sarro, G. Upholding WAG/Rij rats as a model of absence epileptogenesis: Hidden mechanisms and a new theory on seizure development. Neurosci. Biobehav. Rev. 2016, 71, 388–408. [Google Scholar] [CrossRef]
- Sarkisova, K.; van Luijtelaar, G. The WAG/Rij strain: A genetic animal model of absence epilepsy with comorbidity of depression. Prog. Neuro-Psychopharmacol. Biol. Psychiatry 2011, 35, 854–876. [Google Scholar] [CrossRef]
- Gabova, A.; Sarkisova, K.Y.; Fedosova, E.; Shatskova, A.; Morozov, A. Developmental changes in peak-wave discharges in WAG/Rij rats with genetic absence epilepsy. Neurosci. Behav. Physiol. 2020, 50, 245–252. [Google Scholar] [CrossRef]
- Jarre, G.; Altwegg-Boussac, T.; Williams, M.S.; Studer, F.; Chipaux, M.; David, O.; Charpier, S.; Depaulis, A.; Mahon, S.; Guillemain, I. Building up absence seizures in the somatosensory cortex: From network to cellular epileptogenic processes. Cereb. Cortex 2017, 27, 4607–4623. [Google Scholar] [CrossRef] [PubMed]
- Gao, Q.; Omran, A.H.; Baghersad, Y.; Mohammadi, O.; Alkhafaji, M.A.; Al-Azzawi, A.K.J.; Al-Khafaji, S.H.; Emami, N.; Toghraie, D.; Golkar, M.J. Electroencephalogram signal classification based on Fourier transform and Pattern Recognition Network for epilepsy diagnosis. Eng. Appl. Artif. Intell. 2023, 123, 106479. [Google Scholar] [CrossRef]
- Cai, H.; Yan, Y.; Liu, G.; Cai, J.; Cheok, A.D.; Liu, N.; Hua, C.; Lian, J.; Fan, Z.; Chen, A. WKLD-based Feature Extraction for Diagnosis of Epilepsy based on EEG. IEEE Access 2024, 12, 69276–69287. [Google Scholar] [CrossRef]
- Hasnaoui, L.H.; Djebbari, A. Robust dimensionality-reduced epilepsy detection system using EEG wavelet packets and machine learning. Res. Biomed. Eng. 2024, 40, 463–484. [Google Scholar] [CrossRef]
- Wijayanto, I.; Humairani, A.; Hadiyoso, S.; Rizal, A.; Prasanna, D.L.; Tripathi, S.L. Epileptic seizure detection on a compressed EEG signal using energy measurement. Biomed. Signal Process. Control 2023, 85, 104872. [Google Scholar] [CrossRef]
- Tzimourta, K.D.; Astrakas, L.G.; Tsipouras, M.G.; Giannakeas, N.; Tzallas, A.T.; Konitsiotis, S. Wavelet based classification of epileptic seizures in EEG signals. In Proceedings of the 2017 IEEE 30th International Symposium on Computer-Based Medical Systems (CBMS), Thessaloniki, Greece, 22–24 June 2017; pp. 35–39. [Google Scholar]
- Iloon, T.; Barati, R.; Azad, H. A New Approach in Epilepsy Diagnosis using Discrete Wavelet Transformation and Analysis of Variance. Signal Process. Renew. Energy 2023, 7, 1–11. [Google Scholar]
- Fathima, T.; Bedeeuzzaman, M.; Farooq, O.; Khan, Y.U. Wavelet based features for epileptic seizure detection. MES J. Technol. Manag. 2011, 2, 108–112. [Google Scholar]
- Wang, D.; Ren, D.; Li, K.; Feng, Y.; Ma, D.; Yan, X.; Wang, G. Epileptic seizure detection in long-term EEG recordings by using wavelet-based directed transfer function. IEEE Trans. Biomed. Eng. 2018, 65, 2591–2599. [Google Scholar] [CrossRef]
- Juárez-Guerra, E.; Alarcon-Aquino, V.; Gómez-Gil, P.; Ramírez-Cortés, J.M.; García-Treviño, E.S. A new wavelet-based neural network for classification of epileptic-related states using EEG. J. Signal Process. Syst. 2020, 92, 187–211. [Google Scholar] [CrossRef]
- Aghazadeh, R.; Shahabi, P.; Frounchi, J.; Sadighi, M. An autonomous real-time single-channel detection of absence seizures in WAG/Rij rats. Gen. Physiol. Biophys 2015, 34, 285–291. [Google Scholar] [CrossRef]
- Sitnikova, E.; Grubov, V.; Hramov, A.E. Slow-wave activity preceding the onset of 10–15-Hz sleep spindles and 5–9-Hz oscillations in electroencephalograms in rats with and without absence seizures. J. Sleep Res. 2020, 29, e12927. [Google Scholar] [CrossRef] [PubMed]
- Sitnikova, E.; Hramov, A.E.; Koronovsky, A.A.; van Luijtelaar, G. Sleep spindles and spike–wave discharges in EEG: Their generic features, similarities and distinctions disclosed with Fourier transform and continuous wavelet analysis. J. Neurosci. Methods 2009, 180, 304–316. [Google Scholar] [CrossRef] [PubMed]
- Dolinina, A.Y.; Sysoeva, M.V.; van Rijn, C.M.; Sysoev, I.V. Detection of spike-wave discharge restarts in genetic rat model based on frequency dynamics. Cybern. Phys 2022, 11, 121–130. [Google Scholar] [CrossRef]
- Sitnikova, E.; Hramov, A.E.; Grubov, V.; Koronovsky, A.A. Time-frequency characteristics and dynamics of sleep spindles in WAG/Rij rats with absence epilepsy. Brain Res. 2014, 1543, 290–299. [Google Scholar] [CrossRef]
- van Luijtelaar, G.; Lüttjohann, A.; Makarov, V.V.; Maksimenko, V.A.; Koronovskii, A.A.; Hramov, A.E. Methods of automated absence seizure detection, interference by stimulation, and possibilities for prediction in genetic absence models. J. Neurosci. Methods 2016, 260, 144–158. [Google Scholar] [CrossRef]
- Lashkari, S.; Sheikhani, A.; Golpayegani, M.R.H.; Moghimi, A.; Kobravi, H. Detection and prediction of absence seizures based on nonlinear analysis of the EEG in Wag/Rij animal model. Int. Clin. Neurosci. J. 2018, 5, 21. [Google Scholar] [CrossRef]
- Casillas-Espinosa, P.M.; Sargsyan, A.; Melkonian, D.; O’Brien, T.J. A universal automated tool for reliable detection of seizures in rodent models of acquired and genetic epilepsy. Epilepsia 2019, 60, 783–791. [Google Scholar] [CrossRef]
- Sushkova, O.S.; Morozov, A.A.; Gabova, A.V.; Karabanov, A.V.; Illarioshkin, S.N. A statistical method for exploratory data analysis based on 2D and 3D area under curve diagrams: Parkinson’s disease investigation. Sensors 2021, 21, 4700. [Google Scholar] [CrossRef]
- Sushkova, O.S.; Morozov, A.A.; Gabova, A.V. Data mining in EEG wave trains in early stages of Parkinson’s disease. In Advances in Soft Computing. MICAI 2016; Lecture Notes in Computer Science; Springer International Publishing: Berlin/Heidelberg, Germany, 2017; Volume 10062, pp. 403–412. [Google Scholar]
- Sushkova, O.S.; Morozov, A.A.; Gabova, A.V. Investigation of specificity of Parkinson’s disease features obtained using the method of cerebral cortex electrical activity analysis based on wave trains. In Proceedings of the 2017 13th International Conference on Signal-Image Technology & Internet-Based Systems (SITIS), Jaipur, India, 4–7 December 2017; pp. 168–172. [Google Scholar]
- Phinyomark, A.; Limsakul, C.; Phukpattaranont, P. Application of wavelet analysis in EMG feature extraction for pattern classification. Meas. Sci. Rev. 2011, 11, 45–52. [Google Scholar] [CrossRef]
- Englehart, K.; Hudgin, B.; Parker, P.A. A wavelet-based continuous classification scheme for multifunction myoelectric control. IEEE Trans. Biomed. Eng. 2001, 48, 302–311. [Google Scholar] [CrossRef]
- De Michele, G.; Sello, S.; Carboncini, M.C.; Rossi, B.; Strambi, S.K. Cross-correlation time-frequency analysis for multiple EMG signals in Parkinson’s disease: A wavelet approach. Med Eng. Phys. 2003, 25, 361–369. [Google Scholar] [CrossRef] [PubMed]
- Hramov, A.E.; Koronovskii, A.A.; Makarov, V.A.; Maksimenko, V.A.; Pavlov, A.N.; Sitnikova, E. Wavelet Approach to the Study of Rhythmic Neuronal Activity. In Wavelets in Neuroscience; Springer: Berlin/Heidelberg, Germany, 2021; pp. 211–242. [Google Scholar]
- Sitnikova, E. Sleep spindles in rats with absence epilepsy. Sleep Spindl. Cortical States 2021, 2, 18–27. [Google Scholar]
- Sarkisova, K.Y.; Gabova, A. Maternal care exerts disease-modifying effects on genetic absence epilepsy and comorbid depression. Genes, Brain Behav. 2018, 17, e12477. [Google Scholar] [CrossRef]
- Zweig, M.H.; Campbell, G. Receiver-operating characteristic (ROC) plots: A fundamental evaluation tool in clinical medicine. Clin. Chem. 1993, 39, 561–577. [Google Scholar] [CrossRef] [PubMed]
- Goldberg, D.E. Genetic Algorithms in Search, Optimization, and Machine Learning; Addison-Wesley Publisher: Boston, MA, USA, 1989. [Google Scholar]
- Abdelaal, M.S.; Kato, T.; Natsubori, A.; Tanaka, K.F. Temporal and Potential Predictive Relationships between Sleep Spindle Density and Spike-and-Wave Discharges. Eneuro 2024, 11, ENEURO.0058. [Google Scholar] [CrossRef]
- Budde, B.; Maksimenko, V.; Sarink, K.; Seidenbecher, T.; van Luijtelaar, G.; Hahn, T.; Pape, H.C.; Lüttjohann, A. Seizure prediction in genetic rat models of absence epilepsy: Improved performance through multiple-site cortico-thalamic recordings combined with machine learning. Eneuro 2022, 9, ENEURO.0160. [Google Scholar] [CrossRef]

| Parameter | Blue Area | Red Area | Units |
|---|---|---|---|
| PSD | - | from 50,000 and above | μV2/Hz |
| Duration in seconds | - | - | s |
| Central frequency | - | - | Hz |
| Duration in periods | - | - | periods |
| Instantaneous phase | - | - | radians |
| Bandwidth | from 2 and above | - | Hz |
| AUC value | 0 | 1 | - |
| Probability of the type 1 error (p-value) | <0.0001 | <0.0001 | - |
| Parameter | Blue Area | Red Area | Units |
|---|---|---|---|
| PSD | - | - | μV2/Hz |
| Duration in seconds | - | - | s |
| Central frequency | No more than 15 | No more than 8.5 | Hz |
| Duration in periods | - | from 1.6 and above | periods |
| Instantaneous phase | from −2.5 to +2.5 | from −3.14 to +1.5 | radians |
| Bandwidth | from 4 and above | from 1.7 and above | Hz |
| AUC value | 0.175 | 0.8889 | - |
| Probability of the type 1 error (p-value) | 0.0062 | <0.0001 | - |
Disclaimer/Publisher’s Note: The statements, opinions and data contained in all publications are solely those of the individual author(s) and contributor(s) and not of MDPI and/or the editor(s). MDPI and/or the editor(s) disclaim responsibility for any injury to people or property resulting from any ideas, methods, instructions or products referred to in the content. |
© 2025 by the authors. Licensee MDPI, Basel, Switzerland. This article is an open access article distributed under the terms and conditions of the Creative Commons Attribution (CC BY) license (https://creativecommons.org/licenses/by/4.0/).
Share and Cite
Sushkova, O.S.; Morozov, A.A.; Gabova, A.V.; Sarkisova, K.Y. The Diagnostic Value of EEG Wave Trains for Distinguishing Immature Absence Seizures and Sleep Spindles: Evidence from the WAG/Rij Rat Model. Diagnostics 2025, 15, 983. https://doi.org/10.3390/diagnostics15080983
Sushkova OS, Morozov AA, Gabova AV, Sarkisova KY. The Diagnostic Value of EEG Wave Trains for Distinguishing Immature Absence Seizures and Sleep Spindles: Evidence from the WAG/Rij Rat Model. Diagnostics. 2025; 15(8):983. https://doi.org/10.3390/diagnostics15080983
Chicago/Turabian StyleSushkova, Olga S., Alexei A. Morozov, Alexandra V. Gabova, and Karine Yu. Sarkisova. 2025. "The Diagnostic Value of EEG Wave Trains for Distinguishing Immature Absence Seizures and Sleep Spindles: Evidence from the WAG/Rij Rat Model" Diagnostics 15, no. 8: 983. https://doi.org/10.3390/diagnostics15080983
APA StyleSushkova, O. S., Morozov, A. A., Gabova, A. V., & Sarkisova, K. Y. (2025). The Diagnostic Value of EEG Wave Trains for Distinguishing Immature Absence Seizures and Sleep Spindles: Evidence from the WAG/Rij Rat Model. Diagnostics, 15(8), 983. https://doi.org/10.3390/diagnostics15080983