
Correlation of Spectral CT-Based Iodine Concentration Parameters with LI-RADS Classification of Suspected Hepatocellular Carcinoma Nodules in Cirrhotic Patients

 , , , ,
  and
and
Abstract
1. Introduction
2. Materials and Methods
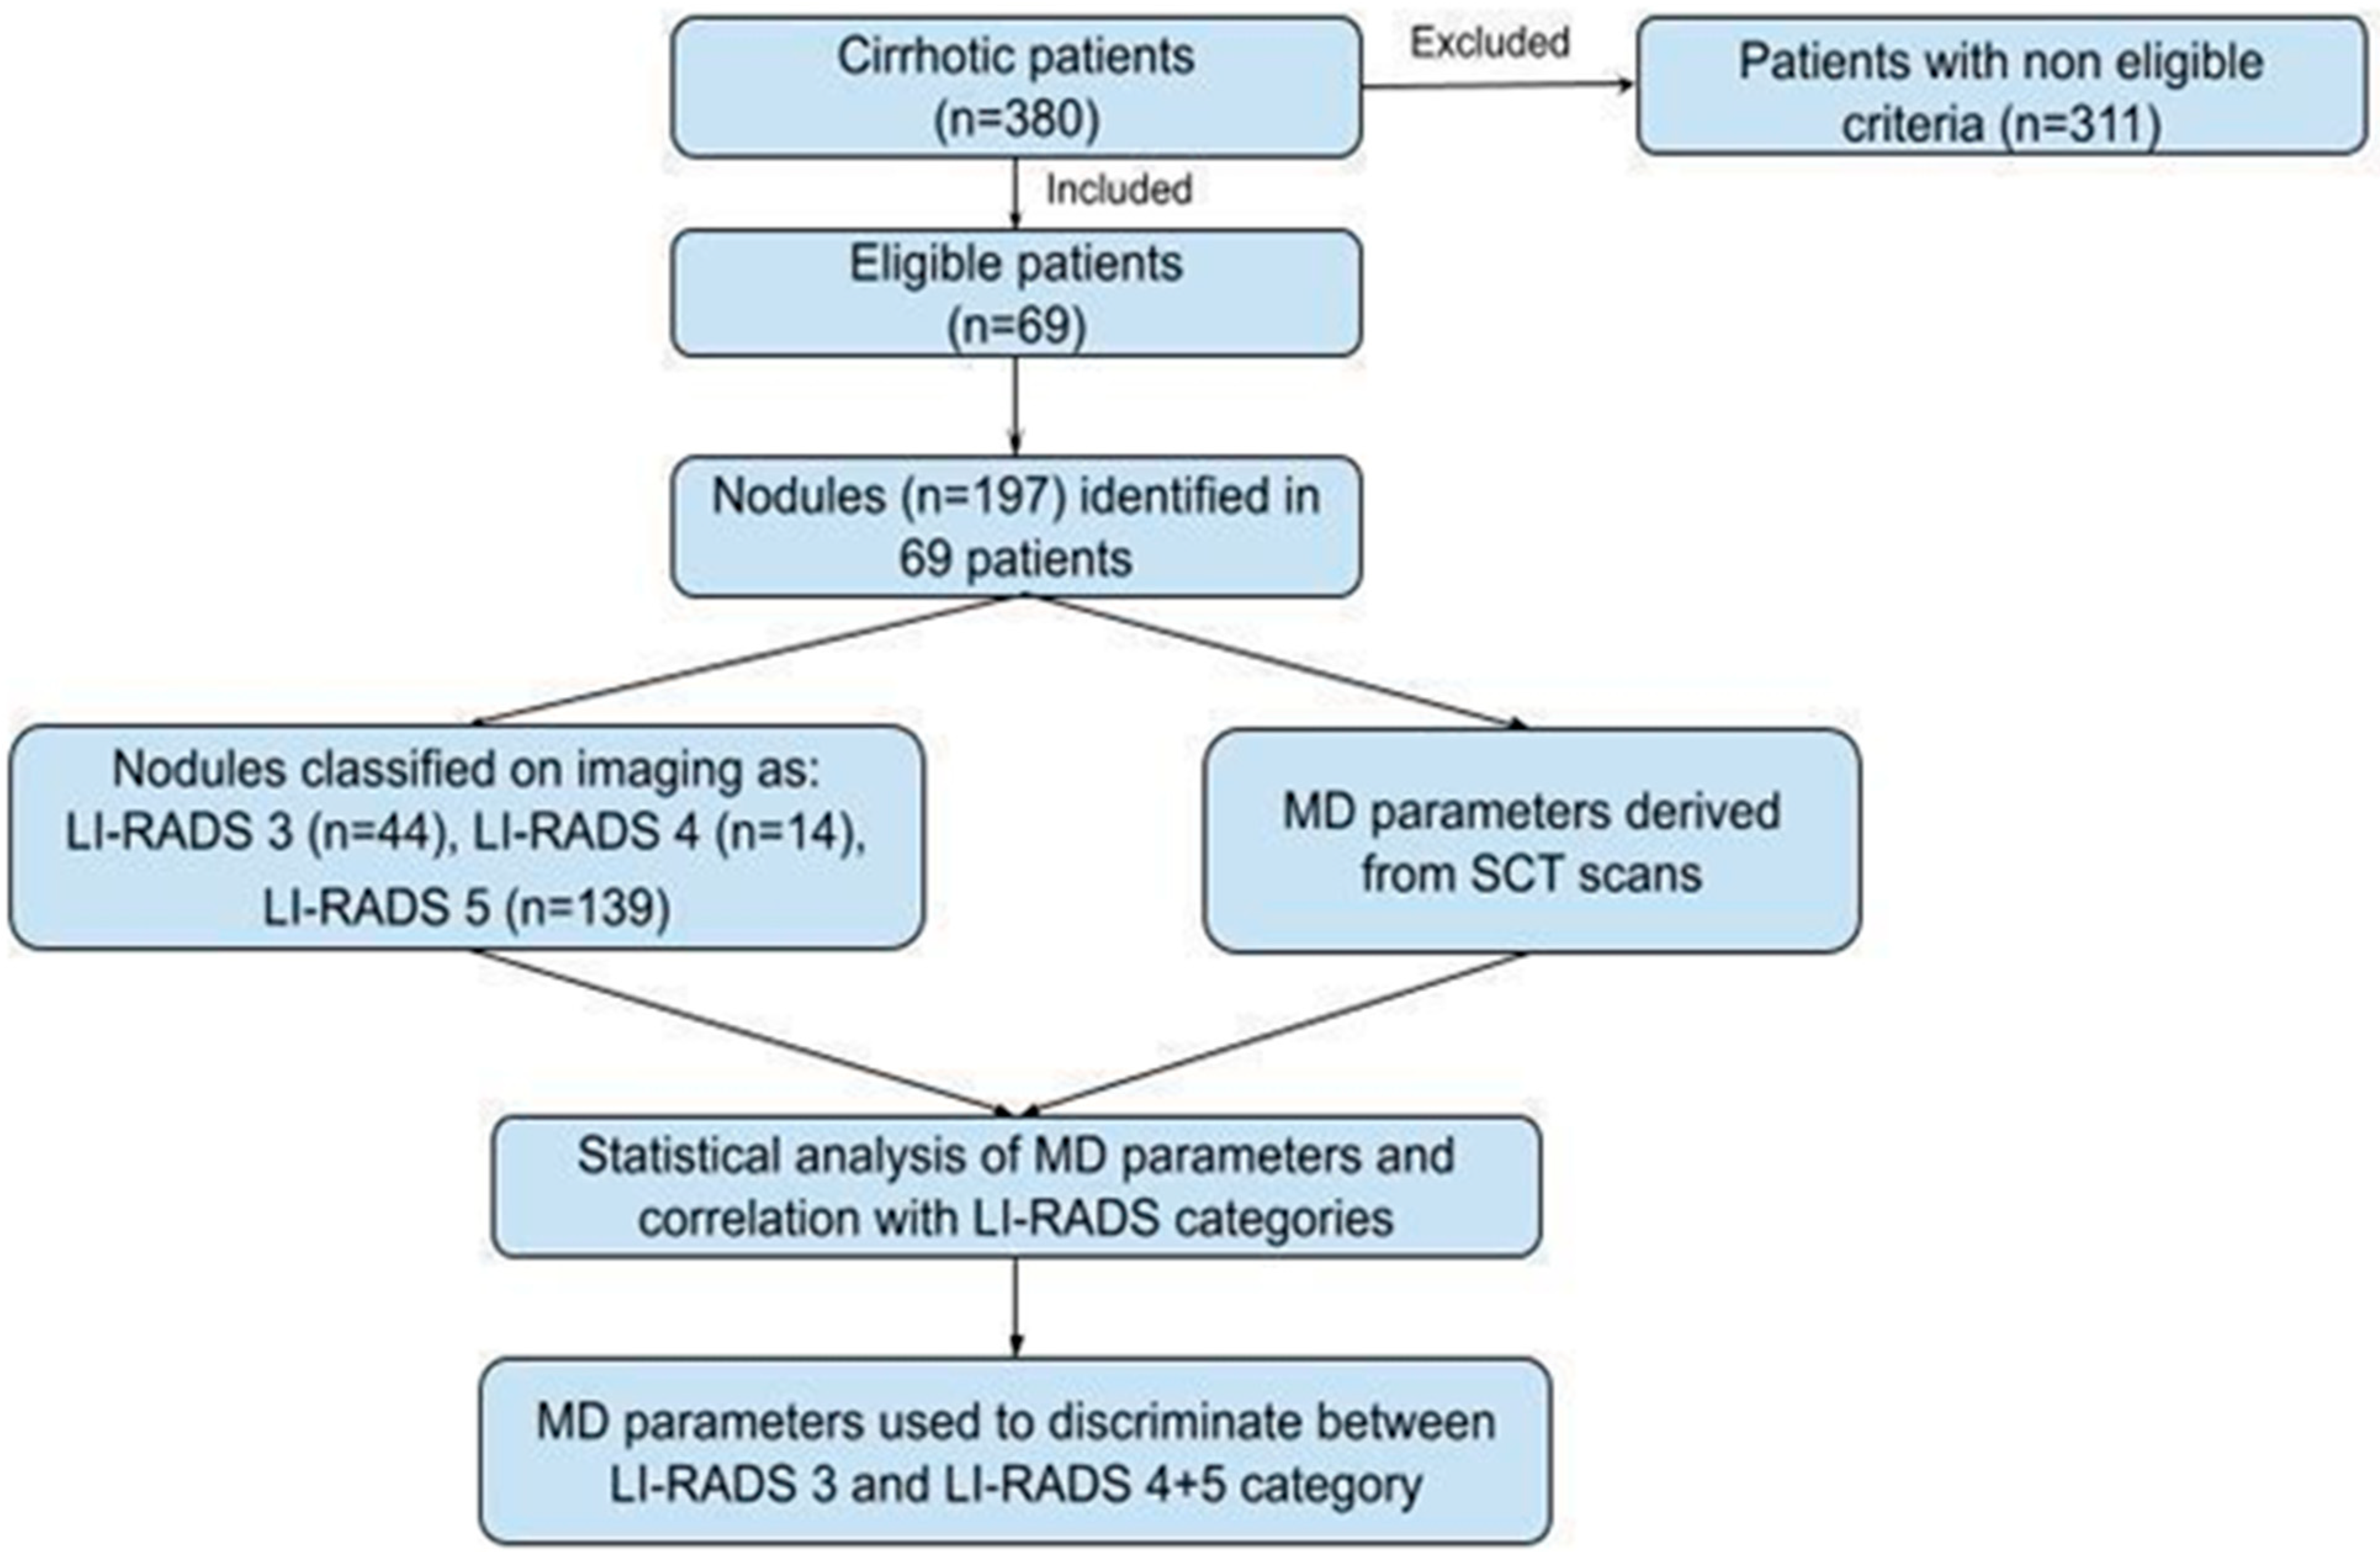
2.1. Study Population
2.2. DECT Protocol
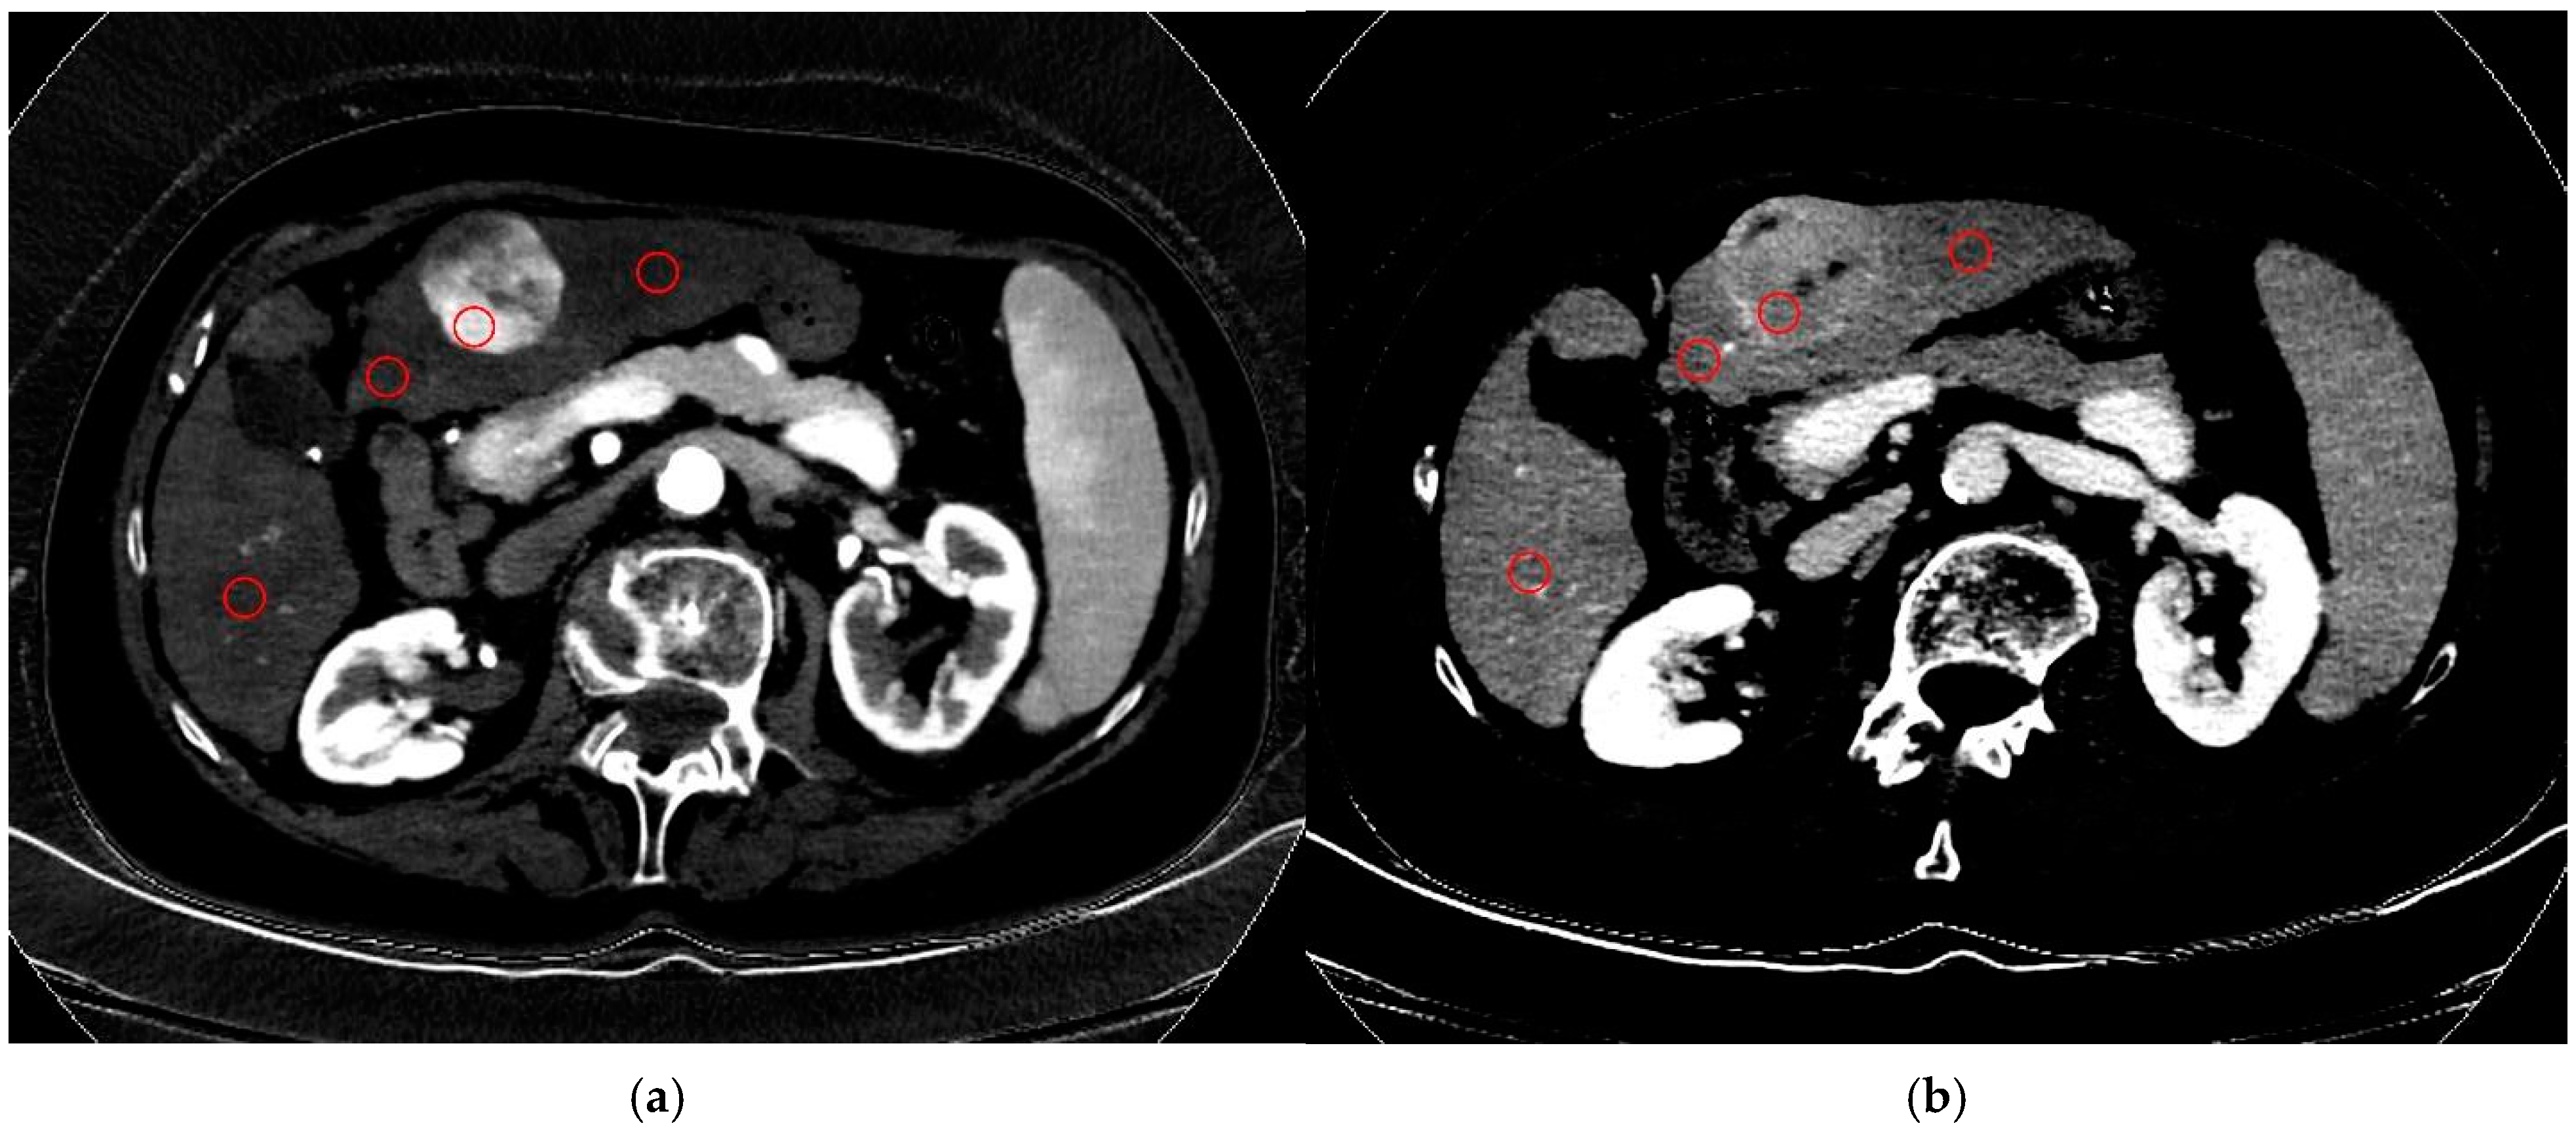
2.3. Image Analysis
2.4. Statistical Analysis
3. Results
3.1. Study Population
3.2. HCC Nodules Features
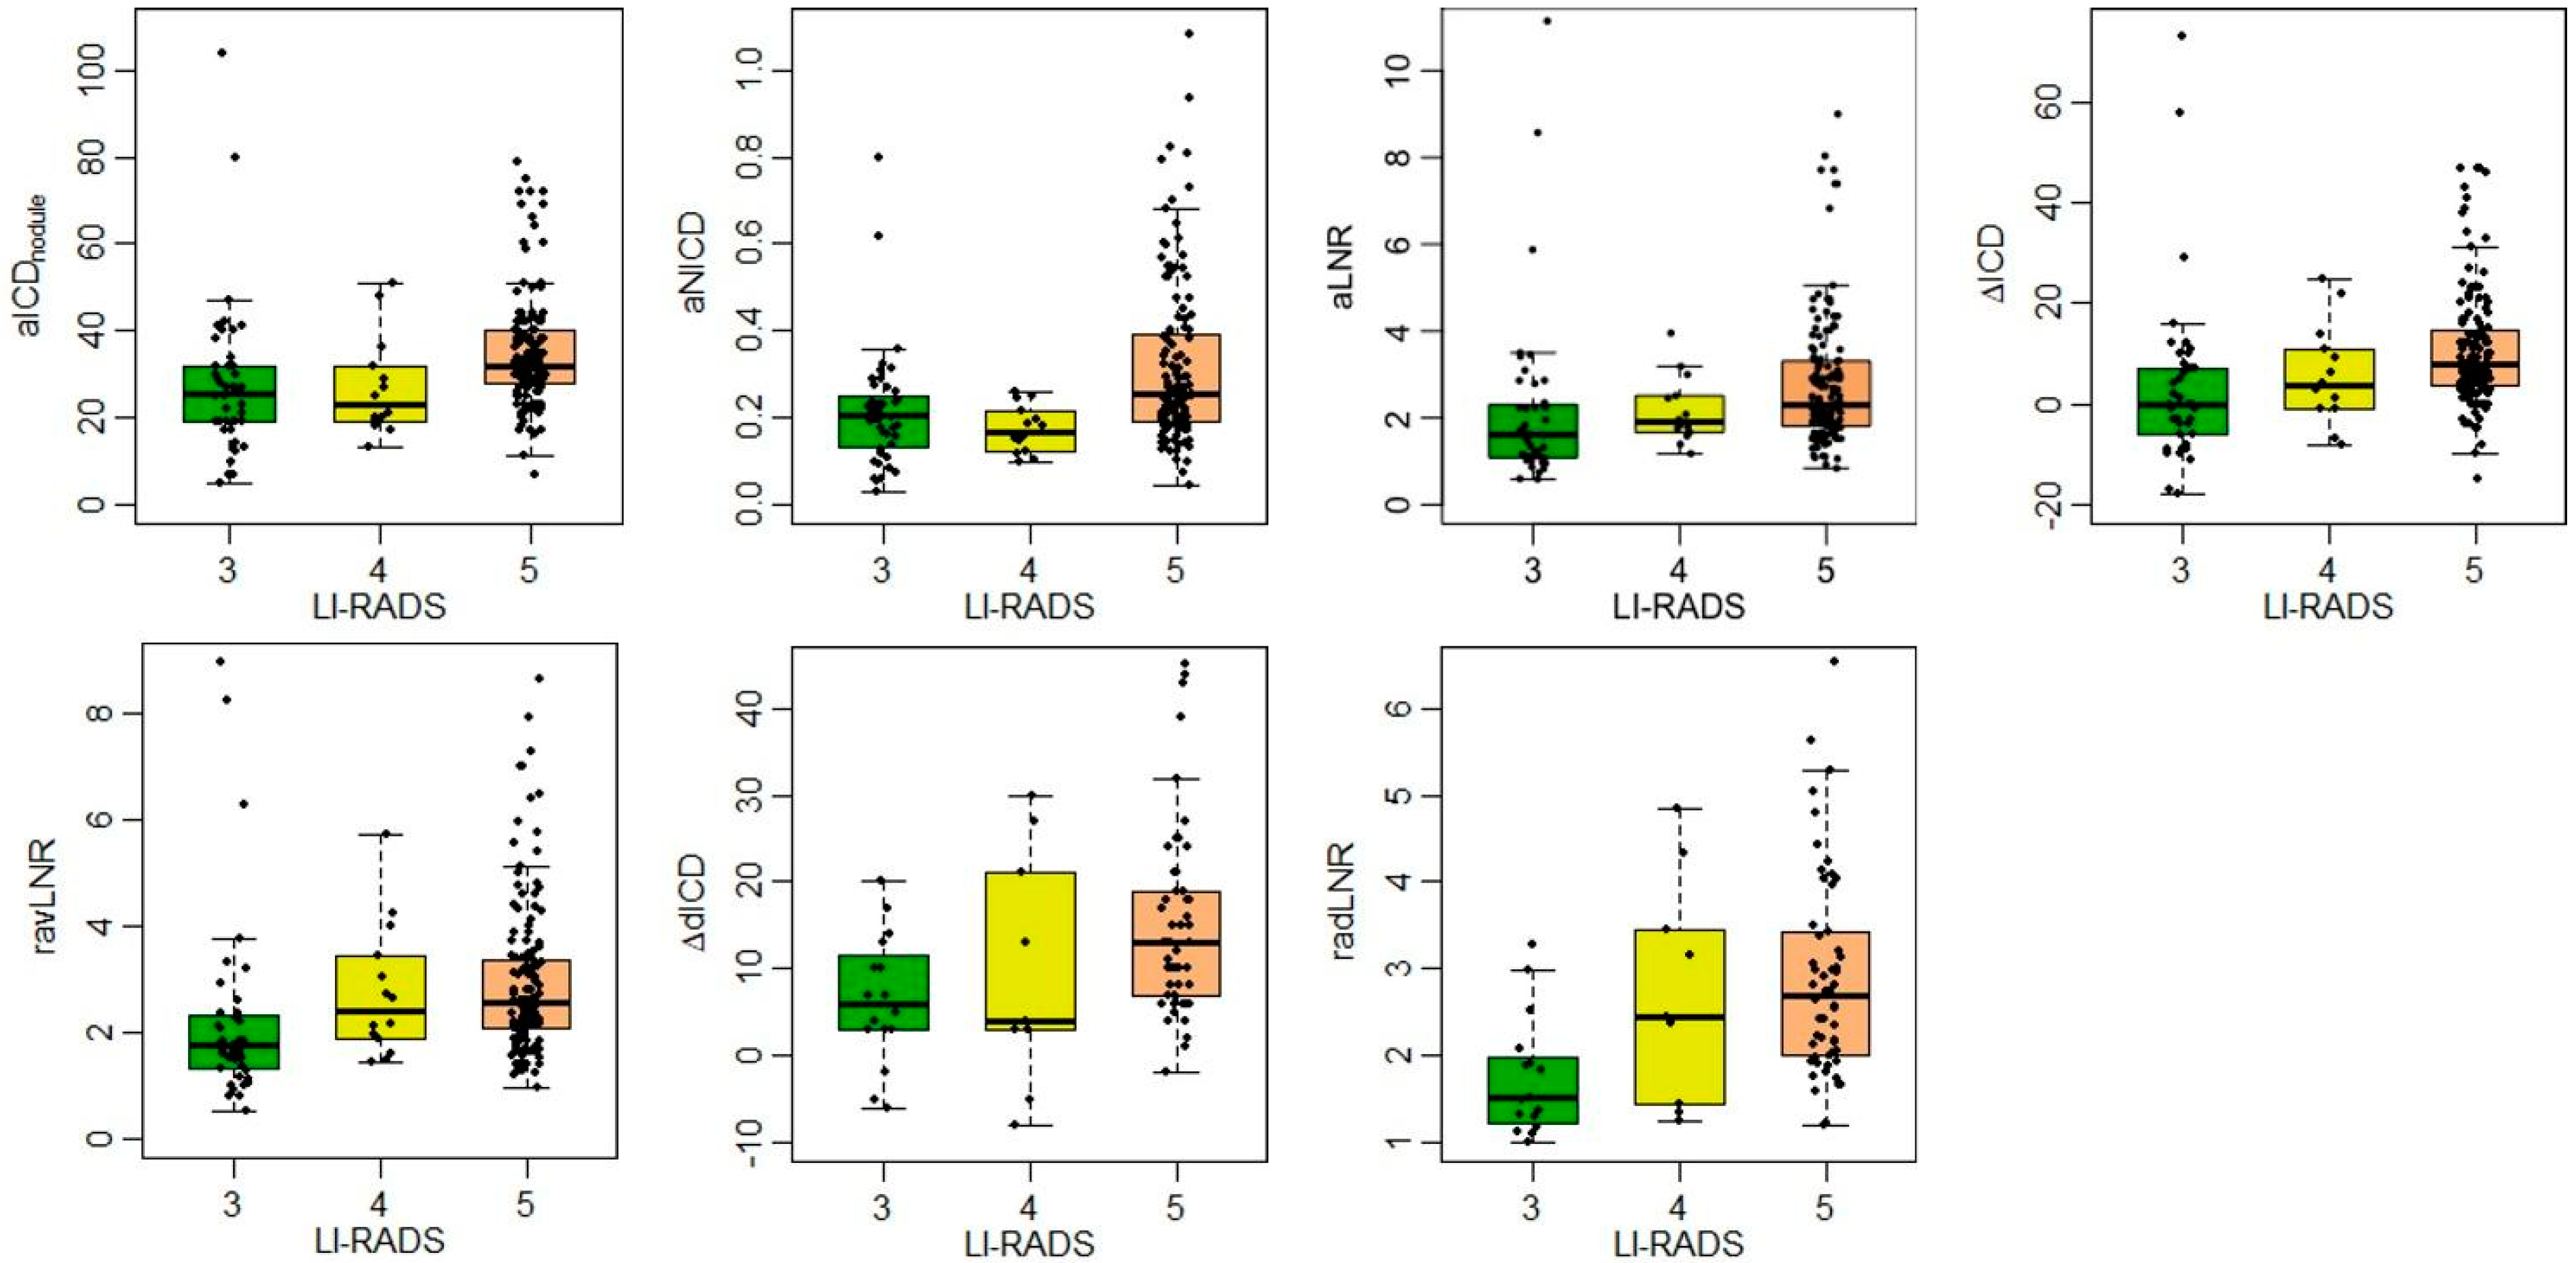
3.3. MD Parameters
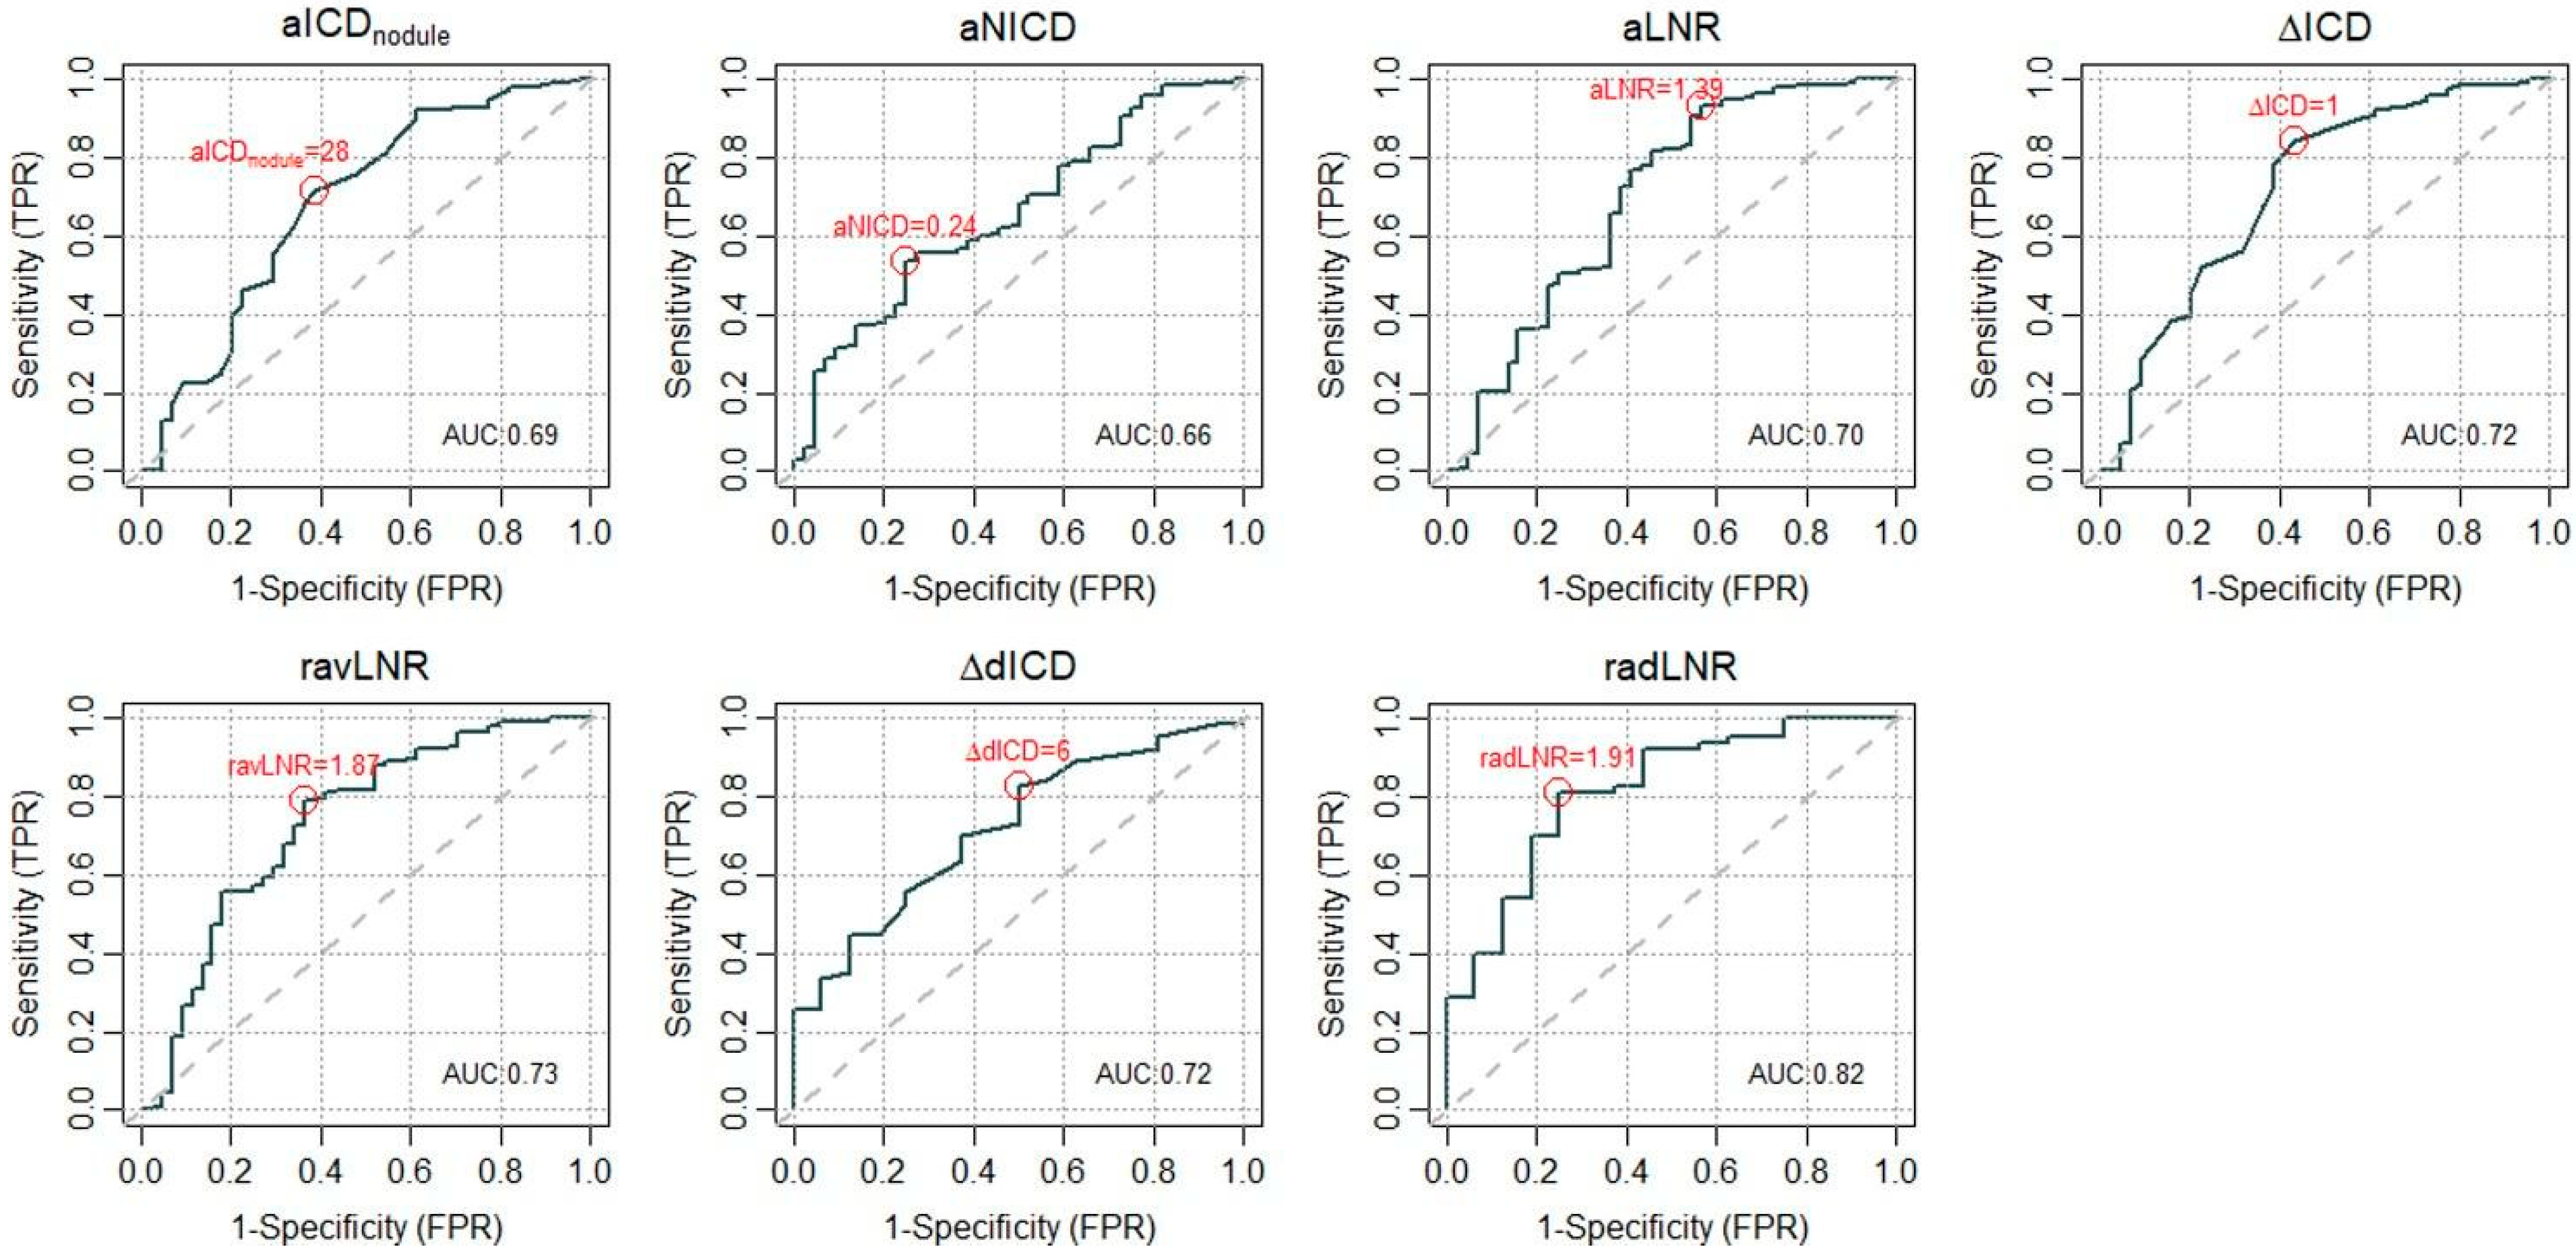
3.4. ROC and Cutoff Definition
4. Discussion
Author Contributions
Funding
Institutional Review Board Statement
Informed Consent Statement
Data Availability Statement
Conflicts of Interest
Abbreviations
| AUC | area under the curve |
| CI | confidence interval |
| CT | computed tomography |
| DECT | dual-energy computed tomography |
| EP | equilibrium phase |
| HAP | hepatic arterial phase |
| HCC | hepatocellular carcinoma |
| ICD | iodine concentration density |
| ICDaorta | iodine concentration density of the aorta |
| ICDliver | iodine concentration density of non-nodular hepatic liver parenchyma |
| ICDnodule | iodine concentration density of the target nodule(s) |
| IQR | interquartile range |
| LNR | lesion-to-non-nodular liver ratio |
| LI-RADS | liver imaging reporting and data system |
| MD | material density |
| NICD | normalized iodine concentration with aorta |
| PVP | portal venous phase |
| rLNR | ratio of lesion-to-non-nodular liver ratio |
| ROC | receiver operating characteristic |
| ROI | region of interest |
| SCT | spectral computed tomography |
| sECT | single-energy computed tomography |
| SD | standard deviation |
| VMI | virtual monoenergetic imaging |
| Specific Parameters | |
| aLNR | lesion-to-non-nodular liver ratio in the hepatic arterial phase (aICDnodule/aICDliver) |
| vLNR | lesion-to-non-nodular liver ratio in the portal venous phase (vICDnodule/vICDliver) |
| eLNR | lesion-to-non-nodular liver ratio in the equilibrium phase (eICDnodule/eICDliver) |
| aNICD | normalized iodine concentration with aorta in the hepatic arterial phase (aICDnodule/aICDaorta) |
| vNICD | normalized iodine concentration with aorta in the portal venous phase (vICDnodule/vICDaorta) |
| eNICD | normalized iodine concentration with aorta in the equilibrium phase (eICDnodule/eICDaorta) |
| ΔICD | difference in iodine concentration density |
| ΔavICD | difference in iodine concentration density from the hepatic arterial phase to the portal venous phase (aICDnodule − vICDnodule) |
| ΔaeICD | difference in iodine concentration density from the hepatic arterial phase to the equilibrium phase (aICDnodule − eICDnodule) |
| ravLNR | ratio between LNR in the hepatic arterial phase and LNR in the portal venous phase (aLNR/vLNR) |
| raeLNR | ratio between LNR in the hepatic arterial phase and LNR in the equilibrium phase (aLNR/eLNR) |
References
- Liver Reporting & Data System|American College of Radiology n.d. Available online: https://www.acr.org/Clinical-Resources/Clinical-Tools-and-Reference/Reporting-and-Data-Systems/LI-RADS (accessed on 12 April 2024).
- Lee, S.; Kim, S.-S.; Roh, Y.H.; Choi, J.-Y.; Park, M.-S.; Kim, M.-J. Diagnostic Performance of CT/MRI Liver Imaging Reporting and Data System v2017 for Hepatocellular Carcinoma: A Systematic Review and Meta-Analysis. Liver Int. 2020, 40, 1488–1497. [Google Scholar] [CrossRef] [PubMed]
- Cho, M.J.; An, C.; Aljoqiman, K.S.; Choi, J.-Y.; Lim, J.S.; Park, M.-S.; Rhee, H.; Kim, M.-J. Diagnostic performance of Liver Imaging Reporting and Data System in patients at risk of both hepatocellular carcinoma and metastasis. Abdom. Radiol. 2020, 45, 3789–3799. [Google Scholar] [CrossRef] [PubMed]
- Lenga, L.; Albrecht, M.H.; Othman, A.E.; Martin, S.S.; Leithner, D.; D’Angelo, T.; Arendt, C.; Scholtz, J.-E.; De Cecco, C.N.; Schoepf, U.J.; et al. Monoenergetic Dual-energy Computed Tomographic Imaging: Cardiothoracic Applications. J. Thorac. Imaging 2017, 32, 151–158. [Google Scholar] [CrossRef] [PubMed]
- Borges, A.P.; Antunes, C.; Caseiro-Alves, F. Spectral CT: Current liver applications. Diagnostics 2023, 13, 1673. [Google Scholar] [CrossRef] [PubMed]
- Xu, X.; Sui, X.; Zhong, W.; Xu, Y.; Wang, Z.; Jiang, J.; Ge, Y.; Song, L.; Du, Q.; Wang, X.; et al. Clinical utility of quantitative dual-energy CT iodine maps and CT morphological features in distinguishing small-cell from non-small-cell lung cancer. Clin. Radiol. 2019, 74, 268–277. [Google Scholar] [CrossRef] [PubMed]
- Uhrig, M.; Simons, D.; Bonekamp, D.; Schlemmer, H.-P. Improved detection of melanoma metastases by iodine maps from dual energy CT. Eur. J. Radiol. 2017, 90, 27–33. [Google Scholar] [CrossRef] [PubMed]
- Goda, N.; Funakoshi, M.; Ono, C.; Mukaida, H.; Kaneko, M. Dual-energy Computed Tomography Iodine Map for Breast Cancer: Comparison with Dynamic Contrast-enhanced Magnetic Resonance Imaging. Anticancer Res. 2023, 43, 4133–4142. [Google Scholar] [CrossRef] [PubMed]
- Wei, X.; Cao, R.; Li, H.; Long, M.; Sun, P.; Zheng, Y.; Li, L.; Yin, J. Dual-energy CT iodine map in predicting the efficacy of neoadjuvant chemotherapy for hypopharyngeal carcinoma: A preliminary study. Sci. Rep. 2022, 12, 21356. [Google Scholar] [CrossRef] [PubMed]
- Jiang, C.; Yang, P.; Lei, J.; Li, J.; Yan, K.; Li, F.; Yan, R.; Xia, L. The Application of Iodine Quantitative Information Obtained by Dual-Source Dual-Energy Computed Tomography on Chemoradiotherapy Effect Monitoring for Cervical Cancer: A Preliminary Study. J. Comput. Assist. Tomogr. 2017, 41, 737–745. [Google Scholar] [CrossRef] [PubMed]
- Iavarone, M.; Viganò, M.; Piazza, N.; Occhipinti, V.; Sangiovanni, A.; Maggioni, M.; D’ambrosio, G.; Forzenigo, L.V.; Motta, F.; Lampertico, P.; et al. Contrast imaging techniques to diagnose hepatocellular carcinoma in cirrhotics outside regular surveillance. Ann. Hepatol. 2019, 18, 318–324. [Google Scholar] [CrossRef] [PubMed]
- Laroia, S.T.; Yadav, K.; Kumar, S.; Rastogi, A.; Kumar, G.; Sarin, S.K. Material decomposition using iodine quantification on spectral CT for characterising nodules in the cirrhotic liver: A retrospective study. Eur. Radiol. Exp. 2021, 5, 22. [Google Scholar] [CrossRef] [PubMed]
- Gao, L.; Lv, Y.; Jin, Y.; Han, F.; Yao, Z.; Yang, J.; Zhang, J. Differential diagnosis of hepatic cancerous nodules and cirrhosis nodules by spectral CT imaging: A feasibility study. Acta Radiol. 2019, 60, 1602–1608. [Google Scholar] [CrossRef] [PubMed]
- Pfeiffer, D.; Parakh, A.; Patino, M.; Kambadakone, A.; Rummeny, E.J.; Sahani, D.V. Iodine material density images in dual-energy CT: Quantification of contrast uptake and washout in HCC. Abdom. Radiol. 2018, 43, 3317–3323. [Google Scholar] [CrossRef] [PubMed]
- Lv, P.; Lin, X.Z.; Li, J.; Li, W.; Chen, K. Differentiation of small hepatic hemangioma from small hepatocellular carcinoma: Recently introduced spectral CT method. Radiology 2011, 259, 720–729. [Google Scholar] [CrossRef] [PubMed]
- Choi, W.S.; Chang, W.; Lee, M.; Hur, S.; Kim, H.-C.; Jae, H.J.; Chung, J.W.; Choi, J.W. Spectral CT-Based Iodized Oil Quantification to Predict Tumor Response Following Chemoembolization of Hepatocellular Carcinoma. J. Vasc. Interv. Radiol. 2021, 32, 16–22. [Google Scholar] [CrossRef] [PubMed]
- Mulé, S.; Pigneur, F.; Quelever, R.; Tenenhaus, A.; Baranes, L.; Richard, P.; Tacher, V.; Herin, E.; Pasquier, H.; Ronot, M.; et al. Can dual-energy CT replace perfusion CT for the functional evaluation of advanced hepatocellular carcinoma? Eur. Radiol. 2018, 28, 1977–1985. [Google Scholar] [CrossRef] [PubMed]
- Available online: https://easl.eu/wp-content/uploads/2018/10/EASL-CPG-Management-of-hepatocellular-carcinoma-.pdf (accessed on 29 October 2024).
- European Association for the Study of the Liver. EASL Clinical Practice Guidelines on the management of hepatocellular carcinoma. J. Hepatol. 2025, 82, 315–374. [Google Scholar] [CrossRef] [PubMed]
- Lee, S.; Kim, Y.-Y.; Shin, J.; Shin, H.; Sirlin, C.B.; Chernyak, V. Performance of LI-RADS category 5 vs combined categories 4 and 5: A systemic review and meta-analysis. Eur. Radiol. 2024, 34, 7025–7040. [Google Scholar] [CrossRef] [PubMed]
- Reimer, R.P.; Hokamp, N.G.; Fehrmann Efferoth, A.; Krauskopf, A.; Zopfs, D.; Kröger, J.R.; Persigehl, T.; Maintz, D.; Bunck, A.C. Virtual monoenergetic images from spectral detector computed tomography facilitate washout assessment in arterially hyper-enhancing liver lesions. Eur. Radiol. 2021, 31, 3468–3477. [Google Scholar] [CrossRef] [PubMed]
- De Muzio, F.; Grassi, F.; Dell’Aversana, F.; Fusco, R.; Danti, G.; Flammia, F.; Chiti, G.; Valeri, T.; Agostini, A.; Palumbo, P.; et al. A Narrative Review on LI-RADS Algorithm in Liver Tumors: Prospects and Pitfalls. Diagnostics 2022, 12, 1655. [Google Scholar] [CrossRef] [PubMed]

| Position | Supine |
|---|---|
| Direction | Craniocaudal |
| Contrast agent dose and rate | 1.5 mL/kg body weight, at the rate of 4 mL/s |
| Saline bolus and rate | 30 mL at the rate of 4 mL/s |
| Scan delay | Automated triggering (threshold at 150 HU in the aorta) |
| Slice thickness | 0.625 mm |
| Reconstruction parameters | 1 mm thickness |
| aLNR = aICDnodule/aICDliver | lesion-to-non-nodular liver ratio in HAP |
| vLNR = vICDnodule/vICDliver | lesion-to-non-nodular liver ratio in PVP |
| eLNR = ICDnodule/eICDliver | lesion-to-non-nodular liver ratio in EP |
| aNICD = aICDnodule/aICDaorta | normalized iodine concentration with aorta in HAP |
| vNICD = vICDnodule/vICDaorta | normalized iodine concentration with aorta in PVP |
| eNICD = eICDnodule/eICDaorta | normalized iodine concentration with aorta in EP |
| ΔavICD = aICDnodule − vICDnodule | difference in ICD from HAP to PVP |
| ΔaeICD = aICDnodule − eICDnodule | difference in ICD from HAP to EP |
| ravLNR = aLNR/vLNR | ratio between LNR in HAP and in PVP |
| raeLNR = aLNR/eLNR | ratio between LNR in HAP and in EP |
| All | LI-RADS 3 (n = 44) | LI-RADS 4-5 (n = 153) | p | |
|---|---|---|---|---|
| aICDnodule | 30 (25–38) | 25.5 (19–32) | 31 (27–39) | 0.0002 |
| aNICD | 0.2 (0.2–0.3) | 0.2 (0.1–0.2) | 0.2 (0.2–0.4) | 0.0015 |
| aLNR | 2.2 (1.6–3) | 1.6 (1.1–2.3) | 2.3 (1.8–3.2) | 0.0001 |
| vICDnodule | 25 (21–28) | 24.5 (20–29) | 25 (21–27) | 0.5179 |
| vNICD | 0.5 (0.5–0.6) | 0.6 (0.4–0.6) | 0.5 (0.5–0.6) | 0.8571 |
| vLNR | 0.9 (0.8–1) | 1 (0.8–1.1) | 0.9 (0.8–1) | 0.1726 |
| ΔavICD = aICDnodule − vICDnodule | 7 (1–12) | 0 (−6–7) | 8 (3–14) | <0.0001 |
| ravLNR = aLNR/vLNR | 2.3 (1.8–3.2) | 1.8 (1.3–2.3) | 2.6 (2–3.4) | <0.0001 |
| eICDnodule | 19 (17–21.5) | 17.5 (15–21) | 19 (17–22) | 0.1504 |
| eNICD | 0.6 (0.5–0.6) | 0.5 (0.5–0.6) | 0.6 (0.5–0.6) | 0.2201 |
| eLNR | 0.9 (0.8–1) | 0.9 (0.8–1) | 1 (0.8–1) | 0.1226 |
| ΔaeICD = aICDnodule − eICDnodule | 10 (6–18) | 6 (3–10.8) | 13 (6–20) | 0.0076 |
| raeLNR = aLNR/eLNR | 2.4 (1.8–3.2) | 1.5 (1.3–1.9) | 2.6 (2–3.4) | 0.0001 |
| Sensitivity (95% CI) | Specificity (95% CI) | |
|---|---|---|
| aICDnodule = 28 | 0.72 (0.64, 0.79) | 0.61 (0.45, 0.76) |
| aNICD = 0.24 | 0.52 (0.44, 0.60) | 0.75 (0.60, 0.87) |
| aLNR = 1.39 | 0.93 (0.88, 0.96) | 0.43 (0.28, 0.59) |
| ΔavICD = 1 | 0.84 (0.78, 0.90) | 0.57 (0.41, 0.72) |
| ravLNR = 1.87 | 0.79 (0.72, 0.85) | 0.64 (0.48, 0.78) |
| ΔaeICD = 6 | 0.83 (0.71, 0.91) | 0.50 (0.25, 0.75) |
| raeLNR = 1.91 | 0.81 (0.69, 0.90) | 0.75 (0.48, 0.93) |
| N LI-RADS 4-5 (%) | OR (95% CI) | p | |
|---|---|---|---|
| aICDnodule | |||
| <28 | 43 (61.4) | 1 | |
| >28 | 110 (86.6) | 4.06 (2.03–8.33) | 0.0001 |
| aNICD | |||
| <0.24 | 73 (68.9) | 1 | |
| >0.24 | 80 (87.9) | 3.29 (1.59–7.25) | 0.0019 |
| aLNR | |||
| <1.39 | 11 (36.7) | 1 | |
| >1.39 | 142 (85) | 9.81 (4.25–23.79) | <0.0001 |
| ΔavICD | |||
| <1 | 24 (49) | 1 | |
| >1 | 129 (87.2) | 7.07 (3.41–15.04) | <0.0001 |
| ravLNR | |||
| <1.87 | 32 (53.3) | 1 | |
| >1.87 | 121 (88.3) | 6.62 (3.24–13.97) | <0.0001 |
| ΔaeICD | |||
| <6 | 11 (57.9) | 1 | |
| >6 | 52 (86.7) | 4.73 (1.46–15.74) | 0.0096 |
| raeLNR | |||
| <1.91 | 12 (50) | 1 | |
| >1.91 | 51 (92.7) | 12.75 (3.75–52.41) | 0.0001 |
Disclaimer/Publisher’s Note: The statements, opinions and data contained in all publications are solely those of the individual author(s) and contributor(s) and not of MDPI and/or the editor(s). MDPI and/or the editor(s) disclaim responsibility for any injury to people or property resulting from any ideas, methods, instructions or products referred to in the content. |
© 2025 by the authors. Licensee MDPI, Basel, Switzerland. This article is an open access article distributed under the terms and conditions of the Creative Commons Attribution (CC BY) license (https://creativecommons.org/licenses/by/4.0/).
Share and Cite
Celestino, A.; Marra, P.; Barbaro, A.; Gargiulo, C.; Muglia, R.; Muscogiuri, G.; Bonaffini, P.A.; Sironi, S. Correlation of Spectral CT-Based Iodine Concentration Parameters with LI-RADS Classification of Suspected Hepatocellular Carcinoma Nodules in Cirrhotic Patients. Diagnostics 2025, 15, 725. https://doi.org/10.3390/diagnostics15060725
Celestino A, Marra P, Barbaro A, Gargiulo C, Muglia R, Muscogiuri G, Bonaffini PA, Sironi S. Correlation of Spectral CT-Based Iodine Concentration Parameters with LI-RADS Classification of Suspected Hepatocellular Carcinoma Nodules in Cirrhotic Patients. Diagnostics. 2025; 15(6):725. https://doi.org/10.3390/diagnostics15060725
Chicago/Turabian StyleCelestino, Antonio, Paolo Marra, Alessandro Barbaro, Carlotta Gargiulo, Riccardo Muglia, Giuseppe Muscogiuri, Pietro Andrea Bonaffini, and Sandro Sironi. 2025. "Correlation of Spectral CT-Based Iodine Concentration Parameters with LI-RADS Classification of Suspected Hepatocellular Carcinoma Nodules in Cirrhotic Patients" Diagnostics 15, no. 6: 725. https://doi.org/10.3390/diagnostics15060725
APA StyleCelestino, A., Marra, P., Barbaro, A., Gargiulo, C., Muglia, R., Muscogiuri, G., Bonaffini, P. A., & Sironi, S. (2025). Correlation of Spectral CT-Based Iodine Concentration Parameters with LI-RADS Classification of Suspected Hepatocellular Carcinoma Nodules in Cirrhotic Patients. Diagnostics, 15(6), 725. https://doi.org/10.3390/diagnostics15060725