
The Distribution of Sport Performance Gene Variations Through COVID-19 Disease Severity

 , , , and
Abstract
1. Introduction
2. Materials and Methods
2.1. Samples
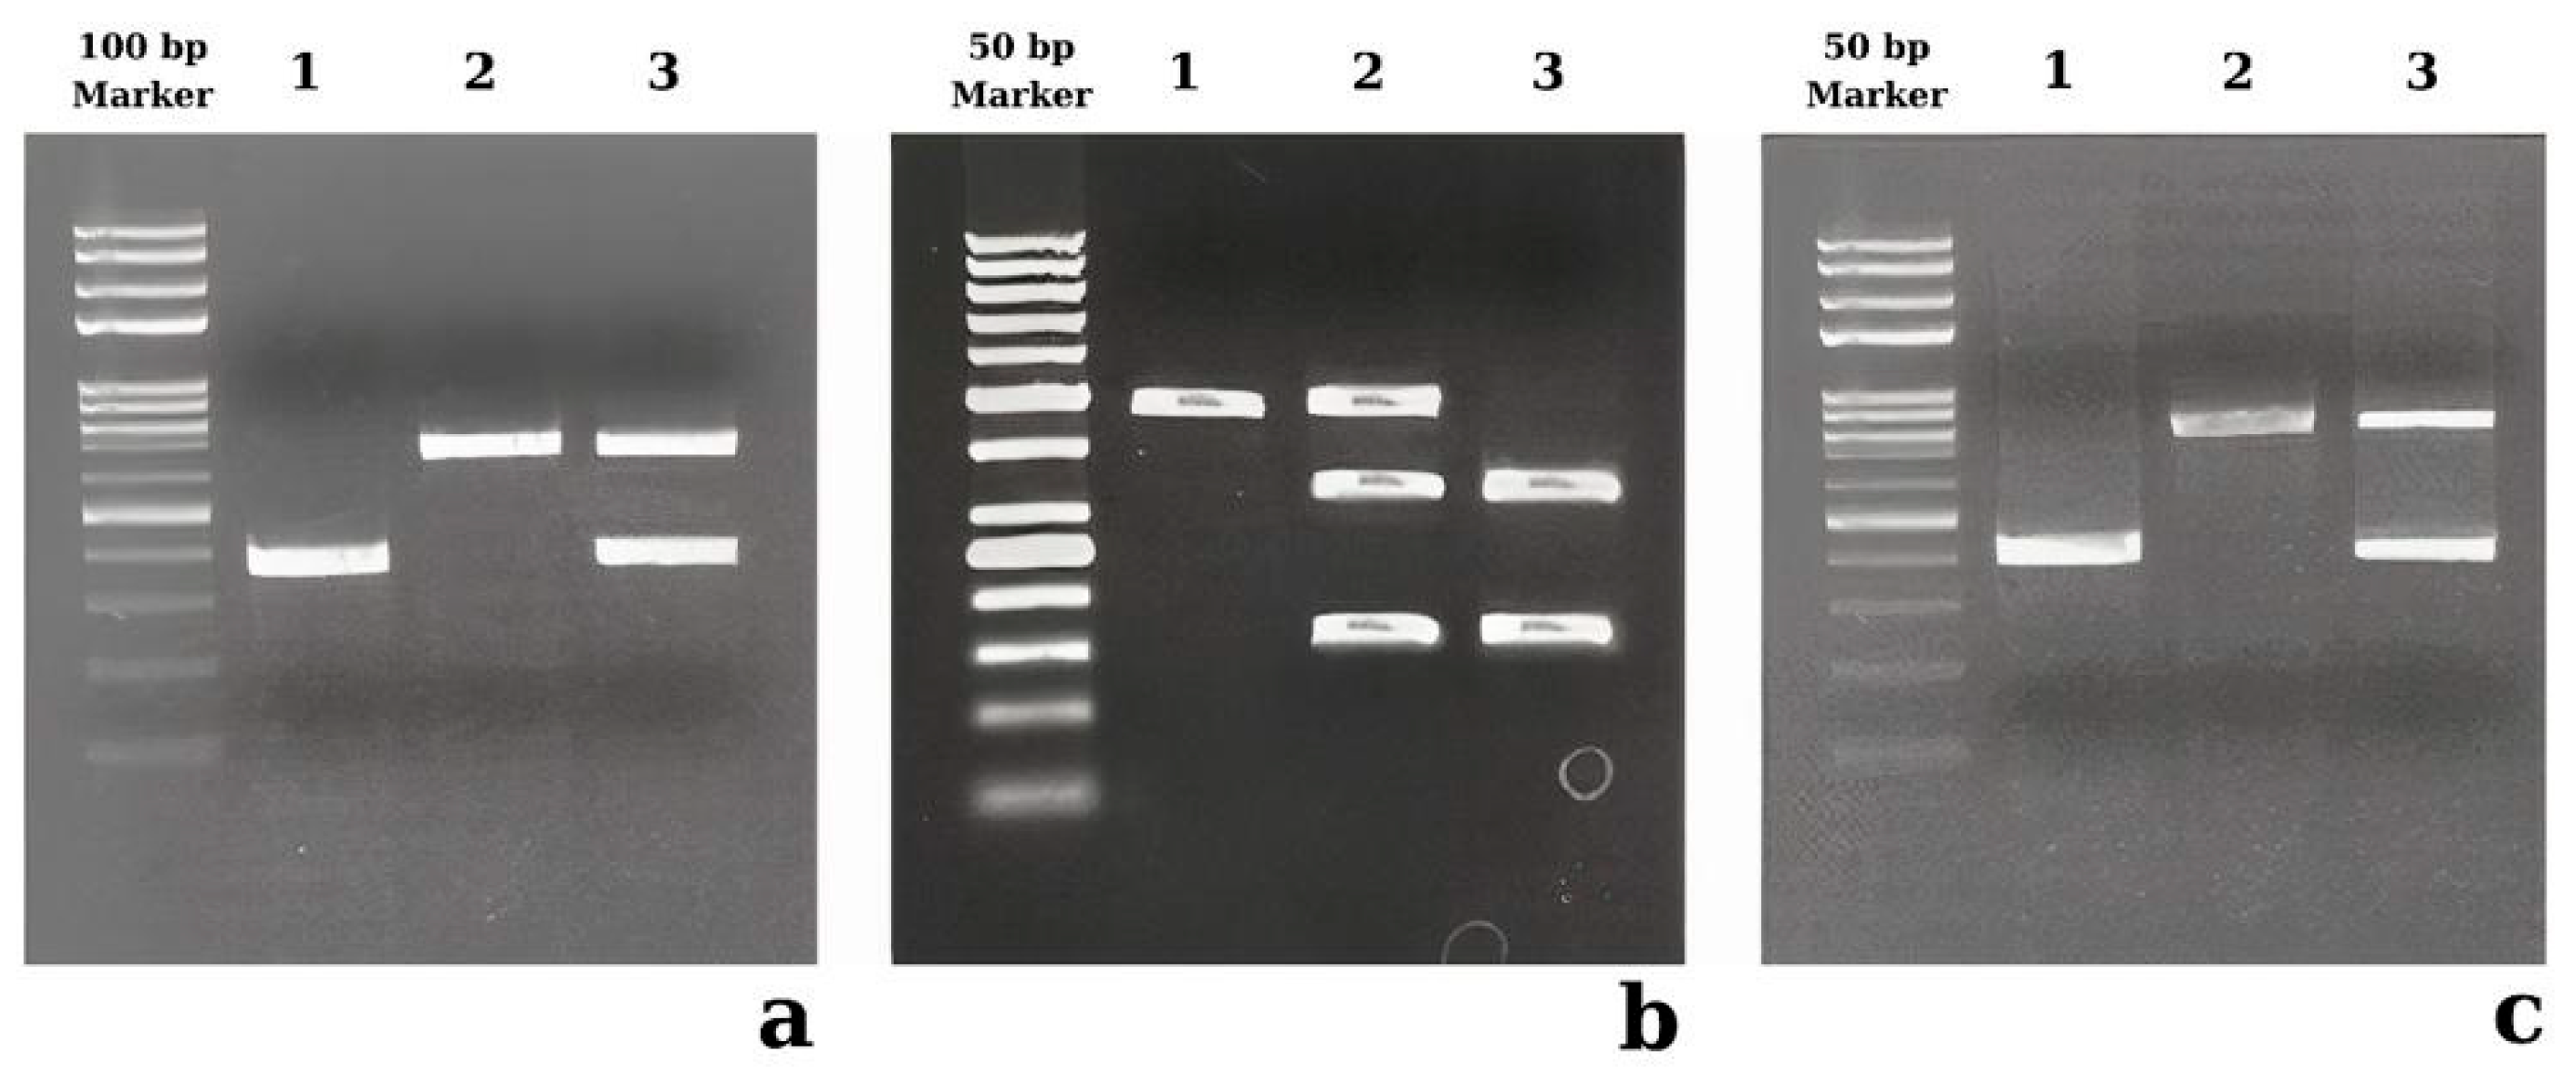
2.2. Genotyping
2.3. Statistical Analysis
3. Results
3.1. Demographic Evaluation of the Patients
3.2. The Genotype Analysis of ACE1 rs4646994, PPARGC1A rs8192678, and ACTN3 rs1815739 Polymorphisms
3.3. The Genotype Analysis of the ACE1 rs4646994 Polymorphism
3.4. The Genotype Analysis of the PPARGC1A rs8192678 Polymorphism
3.5. The Genotype Analysis of the ACTN3 rs1815739 Polymorphism
3.6. Combined Genotype Analysis of ACE1 rs4646994, PPARGC1A rs8192678, and ACTN3 rs1815739 Polymorphisms
4. Discussion
5. Conclusions
Supplementary Materials
Author Contributions
Funding
Institutional Review Board Statement
Informed Consent Statement
Data Availability Statement
Conflicts of Interest
References
- World Health Organisation. Available online: https://data.who.int/dashboards/covid19/cases?n=c (accessed on 31 December 2024).
- Gallo, G.; Calvez, V.; Savoia, C. Hypertension and COVID-19: Current Evidence and Perspectives. High Blood Press. Cardiovasc. Prev. 2022, 29, 115–123. [Google Scholar] [CrossRef] [PubMed]
- Huang, C.; Wang, Y.; Li, X.; Ren, L.; Zhao, J.; Hu, Y.; Zhang, L.; Fan, G.; Xu, J.; Gu, X.; et al. Clinical features of patients infected with 2019 novel coronavirus in Wuhan, China. Lancet 2020, 395, 497–506. [Google Scholar] [CrossRef] [PubMed]
- Rodriguez-Morales, A.J.; Cardona-Ospina, J.A.; Gutiérrez-Ocampo, E.; Villamizar-Peña, R.; Holguin-Rivera, Y.; Escalera-Antezana, J.P.; Alvarado-Arnez, L.E.; Bonilla-Aldana, D.K.; Franco-Paredes, C.; Henao-Martinez, A.F.; et al. Clinical, laboratory and imaging features of COVID-19: A systematic review and meta-analysis. Travel Med. Infect. Dis. 2020, 34, 101623. [Google Scholar] [CrossRef] [PubMed]
- Islam, M.A.; Kundu, S.; Alam, S.S.; Hossan, T.; Kamal, M.A.; Hassan, R. Prevalence and characteristics of fever in adult and paediatric patients with coronavirus disease 2019 (COVID-19): A systematic review and meta-analysis of 17515 patients. PLoS ONE 2021, 16, e0249788. [Google Scholar] [CrossRef]
- Azzolino, D.; Cesari, M. Fatigue in the COVID-19 pandemic. Lancet Healthy Longev. 2022, 3, e128–e129. [Google Scholar] [CrossRef]
- Zafer, M.M.; El-Mahallawy, H.A.; Ashour, H.M. Severe COVID-19 and Sepsis: Immune Pathogenesis and Laboratory Markers. Microorganisms 2021, 9, 159. [Google Scholar] [CrossRef]
- Gómez, C.A.; Sun, C.-K.; Tsai, I.-T.; Chang, Y.-P.; Lin, M.-C.; Hung, I.-Y.; Chang, Y.-J.; Wang, L.-K.; Lin, Y.-T.; Hung, K.-C. Mortality and risk factors associated with pulmonary embolism in coronavirus disease 2019 patients: A systematic review and meta-analysis. Sci. Rep. 2021, 11, 16025. [Google Scholar] [CrossRef]
- Grosse, C.; Grosse, A.; Salzer, H.J.; Dünser, M.W.; Motz, R.; Langer, R. Analysis of cardiopulmonary findings in COVID-19 fatalities: High incidence of pulmonary artery thrombi and acute suppurative bronchopneumonia. Cardiovasc. Pathol. 2020, 49, 107263. [Google Scholar] [CrossRef]
- Chiumello, D.; Modafferi, L.; Fratti, I. Risk Factors and Mortality in Elderly ARDS COVID-19 Compared to Patients Without COVID-19. J. Clin. Med. 2022, 11, 5180. [Google Scholar] [CrossRef]
- Vaduganathan, M.; Vardeny, O.; Michel, T.; McMurray, J.J.V.; Pfeffer, M.A.; Solomon, S.D. Renin–Angiotensin–Aldosterone System Inhibitors in Patients with Covid-19. N. Engl. J. Med. 2020, 382, 1653–1659. [Google Scholar] [CrossRef]
- Kuba, K.; Imai, Y.; Rao, S.; Gao, H.; Guo, F.; Guan, B.; Huan, Y.; Yang, P.; Zhang, Y.; Deng, W.; et al. A crucial role of angiotensin converting enzyme 2 (ACE2) in SARS coronavirus–induced lung injury. Nat. Med. 2005, 11, 875–879. [Google Scholar] [CrossRef] [PubMed]
- Rossaint, J.; Oehmichen, J.; Van Aken, H.; Reuter, S.; Pavenstädt, H.J.; Meersch, M.; Unruh, M.; Zarbock, A. FGF23 signaling impairs neutrophil recruitment and host defense during CKD. J. Clin. Investig. 2016, 126, 962–974. [Google Scholar] [CrossRef] [PubMed]
- Çelik, S.K.; Genç, G.Ç.; Pişkin, N.; Açikgöz, B.; Altinsoy, B.; İşsiz, B.K.; Dursun, A. Polymorphisms of ACE (I/D) and ACE2 receptor gene (Rs2106809, Rs2285666) are not related to the clinical course of COVID-19: A case study. J. Med. Virol. 2021, 93, 5947–5952. [Google Scholar] [CrossRef] [PubMed]
- MacArthur, D.G.; North, K.N. A gene for speed? The evolution and function of α-actinin-3. BioEssays 2004, 26, 786–795. [Google Scholar] [CrossRef]
- Lek, M.; North, K.N. Are biological sensors modulated by their structural scaffolds? The role of the structural muscle proteins α-actinin-2 and α-actinin-3 as modulators of biological sensors. FEBS Lett. 2010, 584, 2974–2980. [Google Scholar] [CrossRef]
- Houweling, P.J.; North, K.N. Sarcomeric α-actinins and their role in human muscle disease. Future Neurol. 2009, 4, 731–743. [Google Scholar] [CrossRef]
- North, K.N.; Yang, N.; Wattanasirichaigoon, D.; Mills, M.; Easteal, S.; Beggs, A.H. A common nonsense mutation results in α-actinin-3 deficiency in the general population. Nat. Genet. 1999, 21, 353–354. [Google Scholar] [CrossRef]
- Alfred, T.; Ben-Shlomo, Y.; Cooper, R.; Hardy, R.; Cooper, C.; Deary, I.J.; Gunnell, D.; Harris, S.E.; Kumari, M.; Martin, R.M.; et al. ACTN3 genotype, athletic status, and life course physical capability: Meta-analysis of the published literature and findings from nine studies. Hum. Mutat. 2011, 32, 1008–1018. [Google Scholar] [CrossRef]
- Del Coso, J.; Valero, M.; Salinero, J.J.; Lara, B.; Díaz, G.; Gallo-Salazar, C.; Ruiz-Vicente, D.; Areces, F.; Puente, C.; Carril, J.C.; et al. ACTN3 genotype influences exercise-induced muscle damage during a marathon competition. Eur. J. Appl. Physiol. 2017, 117, 409–416. [Google Scholar] [CrossRef]
- Seto, J.T.; Chan, S.; Turner, N.; MacArthur, D.G.; Raftery, J.M.; Berman, Y.D.; Quinlan, K.G.; Cooney, G.J.; Head, S.; Yang, N.; et al. The effect of α-actinin-3 deficiency on muscle aging. Exp. Gerontol. 2011, 46, 292–302. [Google Scholar] [CrossRef]
- Charos, A.E.; Reed, B.D.; Raha, D.; Szekely, A.M.; Weissman, S.M.; Snyder, M. A highly integrated and complex PPARGC1A transcription factor binding network in HepG2 cells. Genome Res. 2012, 22, 1668–1679. [Google Scholar] [CrossRef]
- Lin, J.; Wu, H.; Tarr, P.T.; Zhang, C.-Y.; Wu, Z.; Boss, O.; Michael, L.F.; Puigserver, P.; Isotani, E.; Olson, E.N.; et al. Transcriptional co-activator PGC-1α drives the formation of slow-twitch muscle fibres. Nature 2002, 418, 797–801. [Google Scholar] [CrossRef] [PubMed]
- Handschin, C.; Spiegelman, B.M. The role of exercise and PGC1α in inflammation and chronic disease. Nature 2008, 454, 463–469. [Google Scholar] [CrossRef] [PubMed]
- Vimaleswaran, K.S.; Luan, J.; Andersen, G.; Muller, Y.L.; Wheeler, E.; Brito, E.C.; O’Rahilly, S.; Pedersen, O.; Baier, L.J.; Knowler, W.C.; et al. The Gly482Ser genotype at the PPARGC1A gene and elevated blood pressure: A meta-analysis involving 13,949 individuals. J. Appl. Physiol. 2008, 105, 1352–1358. [Google Scholar] [CrossRef] [PubMed]
- Barroso, I.; Luan, J.; Sandhu, M.S.; Franks, P.W.; Crowley, V.; Schafer, A.J.; O’rahilly, S.; Wareham, N.J. Meta-analysis of the Gly482Ser variant in PPARGC1A in type 2 diabetes and related phenotypes. Diabetologia 2006, 49, 501–505. [Google Scholar] [CrossRef]
- Ridderstråle, M.; Johansson, L.E.; Rastam, L.; Lindblad, U. Increased risk of obesity associated with the variant allele of the PPARGC1A Gly482Ser polymorphism in physically inactive elderly men. Diabetologia 2006, 49, 496–500. [Google Scholar] [CrossRef]
- Lin, J.; Handschin, C.; Spiegelman, B.M. Metabolic control through the PGC-1 family of transcription coactivators. Cell Metab. 2005, 1, 361–370. [Google Scholar] [CrossRef]
- Arany, Z.; He, H.; Lin, J.; Hoyer, K.; Handschin, C.; Toka, O.; Ahmad, F.; Matsui, T.; Chin, S.; Wu, P.-H.; et al. Transcriptional coactivator PGC-1α controls the energy state and contractile function of cardiac muscle. Cell Metab. 2005, 1, 259–271. [Google Scholar] [CrossRef]
- Puigserver, P.; Spiegelman, B.M. Peroxisome proliferator-activated receptor-γ coactivator 1α (PGC-1α): Transcriptional coactivator and metabolic regulator. Endocr. Rev. 2003, 24, 78–90. [Google Scholar] [CrossRef]
- Hatami, N.; Ahi, S.; Sadeghinikoo, A.; Foroughian, M.; Javdani, F.; Kalani, N.; Fereydoni, M.; Keshavarz, P.; Hosseini, A. Worldwide ACE (I/D) polymorphism may affect COVID-19 recovery rate: An ecological meta-regression. Endocrine 2020, 68, 479–484. [Google Scholar] [CrossRef]
- Cao, Y.; Li, L.; Feng, Z.; Wan, S.; Huang, P.; Sun, X.; Wen, F.; Huang, X.; Ning, G.; Wang, W. Comparative genetic analysis of the novel coronavirus (2019-nCoV/SARS-CoV-2) receptor ACE2 in different populations. Cell Discov. 2020, 6, 11. [Google Scholar] [CrossRef] [PubMed]
- Marshall, R.P.; Webb, S.; Bellingan, G.J.; Montgomery, H.E.; Chaudhari, B.; McAnulty, R.J.; Humphries, S.E.; Hill, M.R.; Laurent, G.J. Angiotensin converting enzyme insertion/deletion polymorphism is associated with susceptibility and outcome in acute respiratory distress syndrome. Am. J. Respir. Crit. Care Med. 2002, 166, 646–650. [Google Scholar] [CrossRef] [PubMed]
- Itoyama, S.; Keicho, N.; Quy, T.; Phi, N.C.; Long, H.T.; Ha, L.D.; Van Ban, V.; Ohashi, J.; Hijikata, M.; Matsushita, I.; et al. ACE1 polymorphism and progression of SARS. Biochem. Biophys. Res. Commun. 2004, 323, 1124–1129. [Google Scholar] [CrossRef] [PubMed]
- Susilo, H.; Pikir, B.S.; Thaha, M.; Alsagaff, M.Y.; Suryantoro, S.D.; Wungu, C.D.K.; Wafa, I.A.; Pakpahan, C.; Oceandy, D. The Effect of Angiotensin Converting Enzyme (ACE) I/D Polymorphism on Atherosclerotic Cardiovascular Disease and Cardiovascular Mortality Risk in Non-Hemodialyzed Chronic Kidney Disease: The Mediating Role of Plasma ACE Level. Genes 2022, 13, 1121. [Google Scholar] [CrossRef]
- Herzig, S.; Long, F.; Jhala, U.S.; Hedrick, S.; Quinn, R.; Bauer, A.; Rudolph, D.; Schutz, G.; Yoon, C.; Puigserver, P.; et al. CREB regulates hepatic gluconeogenesis through the coactivator PGC-1. Nature 2001, 413, 179–183. [Google Scholar] [CrossRef]
- Yoon, J.C.; Puigserver, P.; Chen, G.; Donovan, J.; Wu, Z.; Rhee, J.; Adelmant, G.; Stafford, J.; Kahn, C.R.; Granner, D.K.; et al. Control of hepatic gluconeogenesis through the transcriptional coactivator PGC-1. Nature 2001, 413, 131–138. [Google Scholar] [CrossRef]
- Hara, K.; Tobe, K.; Okada, T.; Kadowaki, H.; Akanuma, Y.; Ito, C.; Kimura, S.; Kadowaki, T. A genetic variation in the PGC-1 gene could confer insulin resistance and susceptibility to Type II diabetes. Diabetologia 2002, 45, 740–743. [Google Scholar] [CrossRef]
- Zhang, S.-L.; Lu, W.-S.; Yan, L.; Wu, M.-C.; Xu, M.-T.; Chen, L.-H.; Cheng, H. Association between peroxisome proliferator-activated receptor-gamma coactivator-1alpha gene polymorphisms and type 2 diabetes in southern Chinese population: Role of altered interaction with myocyte enhancer factor 2C. Chin. Med. J. 2007, 120, 1878–1885. [Google Scholar] [CrossRef]
- Ek, J.; Andersen, G.; Urhammer, S.A.; Gæde, P.H.; Drivsholm, T.; Borch-Johnsen, K.; Hansen, T.; Pedersen, O. Mutation analysis of peroxisome proliferator-activated receptor-γ coactivator-1 (PGC-1) and relationships of identified amino acid polymorphisms to Type II diabetes mellitus. Diabetologia 2001, 44, 2220–2226. [Google Scholar] [CrossRef]
- Andrulionyte, L.; Peltola, P.; Chiasson, J.-L.; Laakso, M. STOP-NIDDM Study Group. Single nucleotide polymorphisms of PPARD in combination with the Gly482Ser substitution of PGC-1A and the Pro12Ala substitution of PPARG2 predict the conversion from impaired glucose tolerance to type 2 diabetes: The STOP-NIDDM trial. Diabetes 2006, 55, 2148–2152. [Google Scholar] [CrossRef]
- Varillas-Delgado, D. Role of the PPARGC1A Gene and Its rs8192678 Polymorphism on Sport Performance, Aerobic Capacity, Muscle Adaptation and Metabolic Diseases: A Narrative Review. Genes 2024, 15, 1631. [Google Scholar] [CrossRef] [PubMed]
- Zhang, R.-N.; Shen, F.; Pan, Q.; Cao, H.-X.; Chen, G.-Y.; Fan, J.-G. PPARGC1A rs8192678 G>A polymorphism affects the severity of hepatic histological features and nonalcoholic steatohepatitis in patients with nonalcoholic fatty liver disease. World J. Gastroenterol. 2021, 27, 3863–3876. [Google Scholar] [CrossRef] [PubMed]
- Yang, N.; MacArthur, D.G.; Gulbin, J.P.; Hahn, A.G.; Beggs, A.H.; Easteal, S.; North, K. ACTN3 genotype is associated with human elite athletic performance. Am. J. Hum. Genet. 2003, 73, 627–631. [Google Scholar] [CrossRef] [PubMed]
- North, K. Why is α-actinin-3 deficiency so common in the general population? The evolution of athletic performance. Twin Res. Hum. Genet. 2008, 11, 384–394. [Google Scholar] [CrossRef]
- Vincent, B.; De Bock, K.; Ramaekers, M.; Van den Eede, E.; Van Leemputte, M.; Hespel, P.; Thomis, M.A. ACTN3 (R577X) genotype is associated with fiber type distribution. Physiol. Genom. 2007, 32, 58–63. [Google Scholar] [CrossRef]
- Bernardez-Pereira, S.; Santos, P.C.J.L.; Krieger, J.E.; Mansur, A.J.; Pereira, A.C. ACTN3R577X polymorphism and long-term survival in patients with chronic heart failure. BMC Cardiovasc. Disord. 2014, 14, 90. [Google Scholar] [CrossRef]
- Shumna, T.Y.; Fedosieieva, O.S.; Kamyshnyi, O.M. New aspect of studying the mechanisms of development of the lungs ventilation capacity disorders in children with bronchial asthma. J. Educ. Health Sport 2020, 10, 155–170. [Google Scholar] [CrossRef]
- Cifuentes-Silva, E.; Bueno-Buker, D.; Pastene-Maureira, C.; Pacheco-Valles, A. Characterization of strength, endurance and lung function in subjects with neuromuscular diseases with the R577X polymorphism of the ACTN3 gene. Andes Pediatr. Rev. Chil. Pediatr. 2023, 94, 520–528, (In English, Spanish). [Google Scholar] [CrossRef]

| Control Group | Patient Groups | |||
| Asymp. (n = 50) | Mild (n = 300) | Severe (n = 77) | Overall (n = 377) | |
| Age (M ± SEM) | 31 ± 1.6 | 48 ± 1.1 | 63 ± 1.8 | 51 ± 1.0 |
| Sex, n (%) | ||||
| Male | 22 (44) | 151 (50) | 42 (55) | 193 (51) |
| Female | 28 (56) | 149 (50) | 35 (45) | 184 (49) |
| Smoking, n (%) | ||||
| No | 30 (60) | 170 (57) | 25 (32) | 195 (52) |
| Yes | 20 (40) | 129 (43) | 52 (68) | 181 (48) |
| HT, n (%) | ||||
| No | 43 (86) | 207 (69) | 30 (39) | 237 (63) |
| Yes | 7 (14) | 92 (31) | 47 (61) | 139 (37) |
| DM, n (%) | ||||
| No | 44 (88) | 281 (94) | 72 (94) | 353 (94) |
| Yes | 6 (12) | 18 (6) | 5 (6) | 23 (6) |
| CAD, n (%) | ||||
| No | 50 (100) | 272 (91) | 58 (75) | 330 (88) |
| Yes | 0 (0) | 27 (9) | 19 (25) | 46 (12) |
| Fever, n (%) | ||||
| No | 50 (100) | 85 (28) | 73 (95) | 158 (42) |
| Yes | 0 (0) | 215 (72) | 4 (5) | 219 (58) |
| Fatigue, n (%) | ||||
| No | 50 (100) | 84 (28) | 74 (96) | 158 (42) |
| Yes | 0 (0) | 216 (72) | 3 (4) | 219 (58) |
| Sepsis, n (%) | ||||
| No | 50 (100) | 267 (89) | 8 (10) | 275 (73) |
| Yes | 0 (0) | 33 (11) | 69 (90) | 102 (27) |
| ARDS, n (%) | ||||
| No | 50 (100) | 271 (90) | 21 (27) | 292 (77) |
| Yes | 0 (0) | 29 (10) | 56 (73) | 85 (23) |
| PE, n (%) | ||||
| No | 50 (100) | 285 (95) | 75 (97) | 360 (95) |
| Yes | 0 (0) | 15 (5) | 2 (3) | 17 (5) |
| BP, n (%) | ||||
| No | 50 (100) | 274 (91) | 73 (95) | 347 (92) |
| Yes | 0 (0) | 26 (9) | 4 (5) | 30 (8) |
| p-value (OR) | ||||
| Asymp. vs. Overall | Asymp. vs. Mild | Asymp. vs. Severe | Mild vs. Severe | |
| Age | <0.0001 * | <0.0001 * | <0.0001 * | <0.0001 * |
| Sex | 0.3391 a (0.749) | 0.4069 a (0.775) | 0.2455 a (0.655) | 0.5095 a (0.845) |
| Smoking | 0.2788 a (1.392) | 0.6774 a (1.138) | 0.0022 a (3.120) | 0.0001 a (2.741) |
| HT | 0.0013 a (3.603) | 0.0149 a (2.730) | <0.0001 a (9.624) | <0.0001 a (3.525) |
| DM | 0.1328 b (0.478) | 0.1318 b (0.470) | 0.3398 b (0.509) | 0.7950 b (1.084) |
| CAD | 0.0088 a (14.210) | 0.0205 b (10.190) | 0.0001 a (33.670) | 0.0002 a (3.300) |
| Fever | <0.0001 a (139.9) | <0.0001 a (254.6) | 0.1532 b (6.184) | <0.0001 a (0.022) |
| Fatigue | <0.0001 a (139.9) | <0.0001 a (258.8) | 0.2782 b (4.745) | <0.0001 a (0.016) |
| Sepsis | <0.0001 a (37.58) | 0.0076 b (12.65) | <0.0001 a (825.8) | <0.0001 a (69.78) |
| ARDS | 0.0002 a (29.52) | 0.0219 b (10.97) | <0.0001 a (265.4) | <0.0001 a (24.92) |
| PE | 0.2405 b (4.903) | 0.1418 b (5.483) | 0.5188 b (3.344) | 0.5415 b (0.507) |
| BP | 0.0362 b (8.865) | 0.0354 b (9.750) | 0.1532 b (6.184) | 0.3153 a (0.577) |
| ACE1 rs4646994 | Control Group | Patient Groups | p-value (OR) | |||||
| Genotypes | Asymp. (n) | Mild (n) | Severe (n) | Overall (n) | Asymp. vs. Overall | Asymp. vs. Mild | Asymp. vs. Severe | Mild vs. Severe |
| II | 8 | 48 | 15 | 63 | Ref | Ref | Ref | Ref |
| ID | 25 | 122 | 40 | 162 | 0.6517 (0.823) | 0.6386 (0.813) | 0.7541 (0.853) | 0.8901 (1.049) |
| DD | 17 | 130 | 22 | 152 | 0.7797 (1.135) | 0.5980 (1.275) | 0.4947 (0.690) | 0.0988 (0.542) |
| Dominant Model (II + ID vs. DD) | 33 | 170 | 55 | 225 | Ref | Ref | Ref | Ref |
| 17 | 130 | 22 | 152 | 0.3906 (1.311) | 0.2157 (1.484) | 0.5170 (0.777) | 0.0185 (0.523) | |
| Recessive Model (II vs. ID + DD) | 8 | 48 | 15 | 63 | Ref | Ref | Ref | Ref |
| 42 | 252 | 62 | 314 | 0.8991 (0.949) | 1.0000 (1.000) | 0.6188 (0.787) | 0.4652 (0.787) | |
| I | 41 | 218 | 70 | 288 | Ref | Ref | Ref | Ref |
| D | 59 | 382 | 84 | 466 | 0.5883 (1.124) | 0.3709 (1.218) | 0.4844 (0.834) | 0.0377 (0.685) |
| PPARGC1A rs8192678 | Control Group | Patient Groups | p-Value (OR) | |||||
| Genotypes | Asymp. (n) | Overall (n) | Mild (n) | Severe (n) | Asymp. vs. Overall | Asymp. vs. Mild | Asymp. vs. Severe | Mild vs. Severe |
| CC | 25 | 93 | 72 | 21 | Ref | Ref | Ref | Ref |
| TC | 15 | 230 | 183 | 47 | <0.0001 (4.122) | <0.0001 (4.236) | 0.0013 (3.730) | 0.6684 (0.881) |
| TT | 10 | 54 | 45 | 9 | 0.3634 (1.452) | 0.2854 (1.563) | 0.8995 (1.071) | 0.3911 (0.686) |
| Dominant model (CC + TC vs. TT) | 40 | 323 | 255 | 68 | Ref | Ref | Ref | Ref |
| 10 | 54 | 45 | 9 | 0.2907 (0.669) | 0.3684 (0.706) | 0.1995 (0.529) | 0.4593 (0.750) | |
| Recessive model (CC vs. TC + TT) | 25 | 93 | 72 | 21 | Ref | Ref | Ref | Ref |
| 25 | 284 | 228 | 56 | 0.0002 (3.054) | 0.0001 (3.167) | 0.0092 (2.667) | 0.5523 (0.842) | |
| C allele | 65 | 416 | 324 | 89 | Ref | Ref | Ref | Ref |
| T allele | 35 | 338 | 273 | 65 | 0.0626 (1.509) | 0.0456 (1.565) | 0.2507 (1.356) | 0.4336 (0.867) |
| ACTN3 rs1815739 | Control Group | Patient Groups | p-value (OR) | |||||
| Genotypes | Asymp. (n) | Overall (n) | Mild (n) | Severe (n) | Asymp. vs. Overall | Asymp. vs. Mild | Asymp. vs. Severe | Mild vs. Severe |
| CC | 0 | 5 | 5 | 0 | Ref | Ref | Ref | Ref |
| TC | 11 | 260 | 241 | 19 | 1.0000 b (2.059) | 1.0000 b (1.909) | - | 1.0000 b (0.888) |
| TT | 39 | 112 | 54 | 58 | 0.3322 b (0.259) | 0.1537 b (0.125) | - | 0.0572 b (11.81) |
| Dominant model (CC + TC vs. TT) | 11 | 265 | 246 | 19 | Ref | Ref | Ref | Ref |
| 39 | 112 | 54 | 58 | <0.0001 a (0.119) | <0.0001 a (0.062) | 0.7288 a (0.861) | <0.0001 a (13.91) | |
| Recessive model CC vs. TC + TT) | 0 | 5 | 5 | 0 | Ref | Ref | Ref | Ref |
| 50 | 372 | 295 | 77 | 1.0000 b (0.671) | 1.0000 b (0.532) | - | 0.5878 b (2.885) | |
| C allele | 11 | 270 | 251 | 19 | Ref | Ref | Ref | Ref |
| T allele | 89 | 484 | 349 | 135 | <0.0001 a (0.222) | <0.0001 a (0.172) | 0.7469 a (0.878) | <0.0001 a (5.110) |
| ACE1 rs4646994 + PPARGC1A rs8192678 | Control Group | Patient Groups | p-value (OR) | |||||
| Asymp. (n) | Overall (n) | Mild (n) | Severe (n) | Asymp. vs. Overall | Asymp. vs. Mild | Asymp. vs. Severe | Mild vs. Severe | |
| II + CC | 6 | 15 | 11 | 4 | Ref | Ref | Ref | Ref |
| II + TC | 2 | 38 | 27 | 11 | 0.0160 b (7.600) | 0.0380 b (7.364) | 0.0393 b (8.250) | 1.0000 b (1.120) |
| II + TT | 0 | 10 | 10 | 0 | 0.1411 b (8.806) | 0.0570 b (11.87) | - | 0.1245 b (0.122) |
| ID + CC | 13 | 39 | 27 | 12 | 0.7529 a (1.200) | 0.8378 a (1.133) | 0.7233 b (1.385) | 1.0000 b (1.222) |
| ID + TC | 8 | 103 | 80 | 23 | 0.0104 b (5.150) | 0.0102 b (5.455) | 0.0645 b (4.313) | 0.7449 b (0.791) |
| ID + TT | 4 | 20 | 15 | 5 | 0.4764 b (2.000) | 0.4629 b (2.045) | 0.6563 b (1.875) | 1.0000 b (0.917) |
| DD + CC | 6 | 39 | 34 | 5 | 0.1749 b (2.600) | 0.1522 b (3.091) | 1.0000 b (1.250) | 0.2436 b (0.404) |
| DD + TC | 5 | 89 | 76 | 13 | 0.0047 b (7.120) | 0.0031 b (8.291) | 0.1245 b (3.900) | 0.2628 b (0.470) |
| DD + TT | 4 | 24 | 20 | 4 | 0.2906 b (2.400) | 0.2697 b (2.727) | 1.0000 b (1.500) | 0.6857 b (0.550) |
| ACE1 rs4646994 + ACTN3 rs1815739 | Control Group | Patient Groups | p-Value (OR) | ||||
| Asymp. (n) | Overall (n) | Mild (n) | Severe (n) | Asymp. vs. Overall | Asymp. vs. Mild | Mild vs. Severe | |
| II + CC | 0 | 1 | 1 | 0 | Ref | Ref | Ref |
| II + TC | 0 | 43 | 42 | 1 | - | - | 1.0000 (0.106) |
| II + TT | 8 | 19 | 5 | 14 | 1.0000 (0.765) | 0.4286 (0.216) | 0.3000 (7.909) |
| ID + TC | 5 | 111 | 98 | 13 | 1.0000 (6.758) | 1.0000 (5.970) | 1.0000 (0.411) |
| ID + TT | 20 | 50 | 23 | 27 | 1.0000 (0.821) | 1.0000 (0.382) | 0.4706 (3.511) |
| DD + TC | 6 | 106 | 101 | 5 | 1.0000 (5.462) | 1.0000 (5.205) | 1.0000 (0.163) |
| DD + TT | 11 | 43 | 26 | 17 | 1.0000 (1.261) | 1.0000 (0.768) | 1.0000 (1.981) |
Disclaimer/Publisher’s Note: The statements, opinions and data contained in all publications are solely those of the individual author(s) and contributor(s) and not of MDPI and/or the editor(s). MDPI and/or the editor(s) disclaim responsibility for any injury to people or property resulting from any ideas, methods, instructions or products referred to in the content. |
© 2025 by the authors. Licensee MDPI, Basel, Switzerland. This article is an open access article distributed under the terms and conditions of the Creative Commons Attribution (CC BY) license (https://creativecommons.org/licenses/by/4.0/).
Share and Cite
Yenmis, G.; Kallenci, I.; Dokur, M.; Koc, S.; Yalinkilic, S.B.; Atak, E.; Demirbilek, M.; Arkan, H. The Distribution of Sport Performance Gene Variations Through COVID-19 Disease Severity. Diagnostics 2025, 15, 701. https://doi.org/10.3390/diagnostics15060701
Yenmis G, Kallenci I, Dokur M, Koc S, Yalinkilic SB, Atak E, Demirbilek M, Arkan H. The Distribution of Sport Performance Gene Variations Through COVID-19 Disease Severity. Diagnostics. 2025; 15(6):701. https://doi.org/10.3390/diagnostics15060701
Chicago/Turabian StyleYenmis, Guven, Ilayda Kallenci, Mehmet Dokur, Suna Koc, Sila Basak Yalinkilic, Evren Atak, Mahmut Demirbilek, and Hulya Arkan. 2025. "The Distribution of Sport Performance Gene Variations Through COVID-19 Disease Severity" Diagnostics 15, no. 6: 701. https://doi.org/10.3390/diagnostics15060701
APA StyleYenmis, G., Kallenci, I., Dokur, M., Koc, S., Yalinkilic, S. B., Atak, E., Demirbilek, M., & Arkan, H. (2025). The Distribution of Sport Performance Gene Variations Through COVID-19 Disease Severity. Diagnostics, 15(6), 701. https://doi.org/10.3390/diagnostics15060701