
Enhancing Left Ventricular Segmentation in Echocardiograms Through GAN-Based Synthetic Data Augmentation and MultiResUNet Architecture

 , ,
, ,  ,
,
Abstract
1. Introduction
2. Related Work
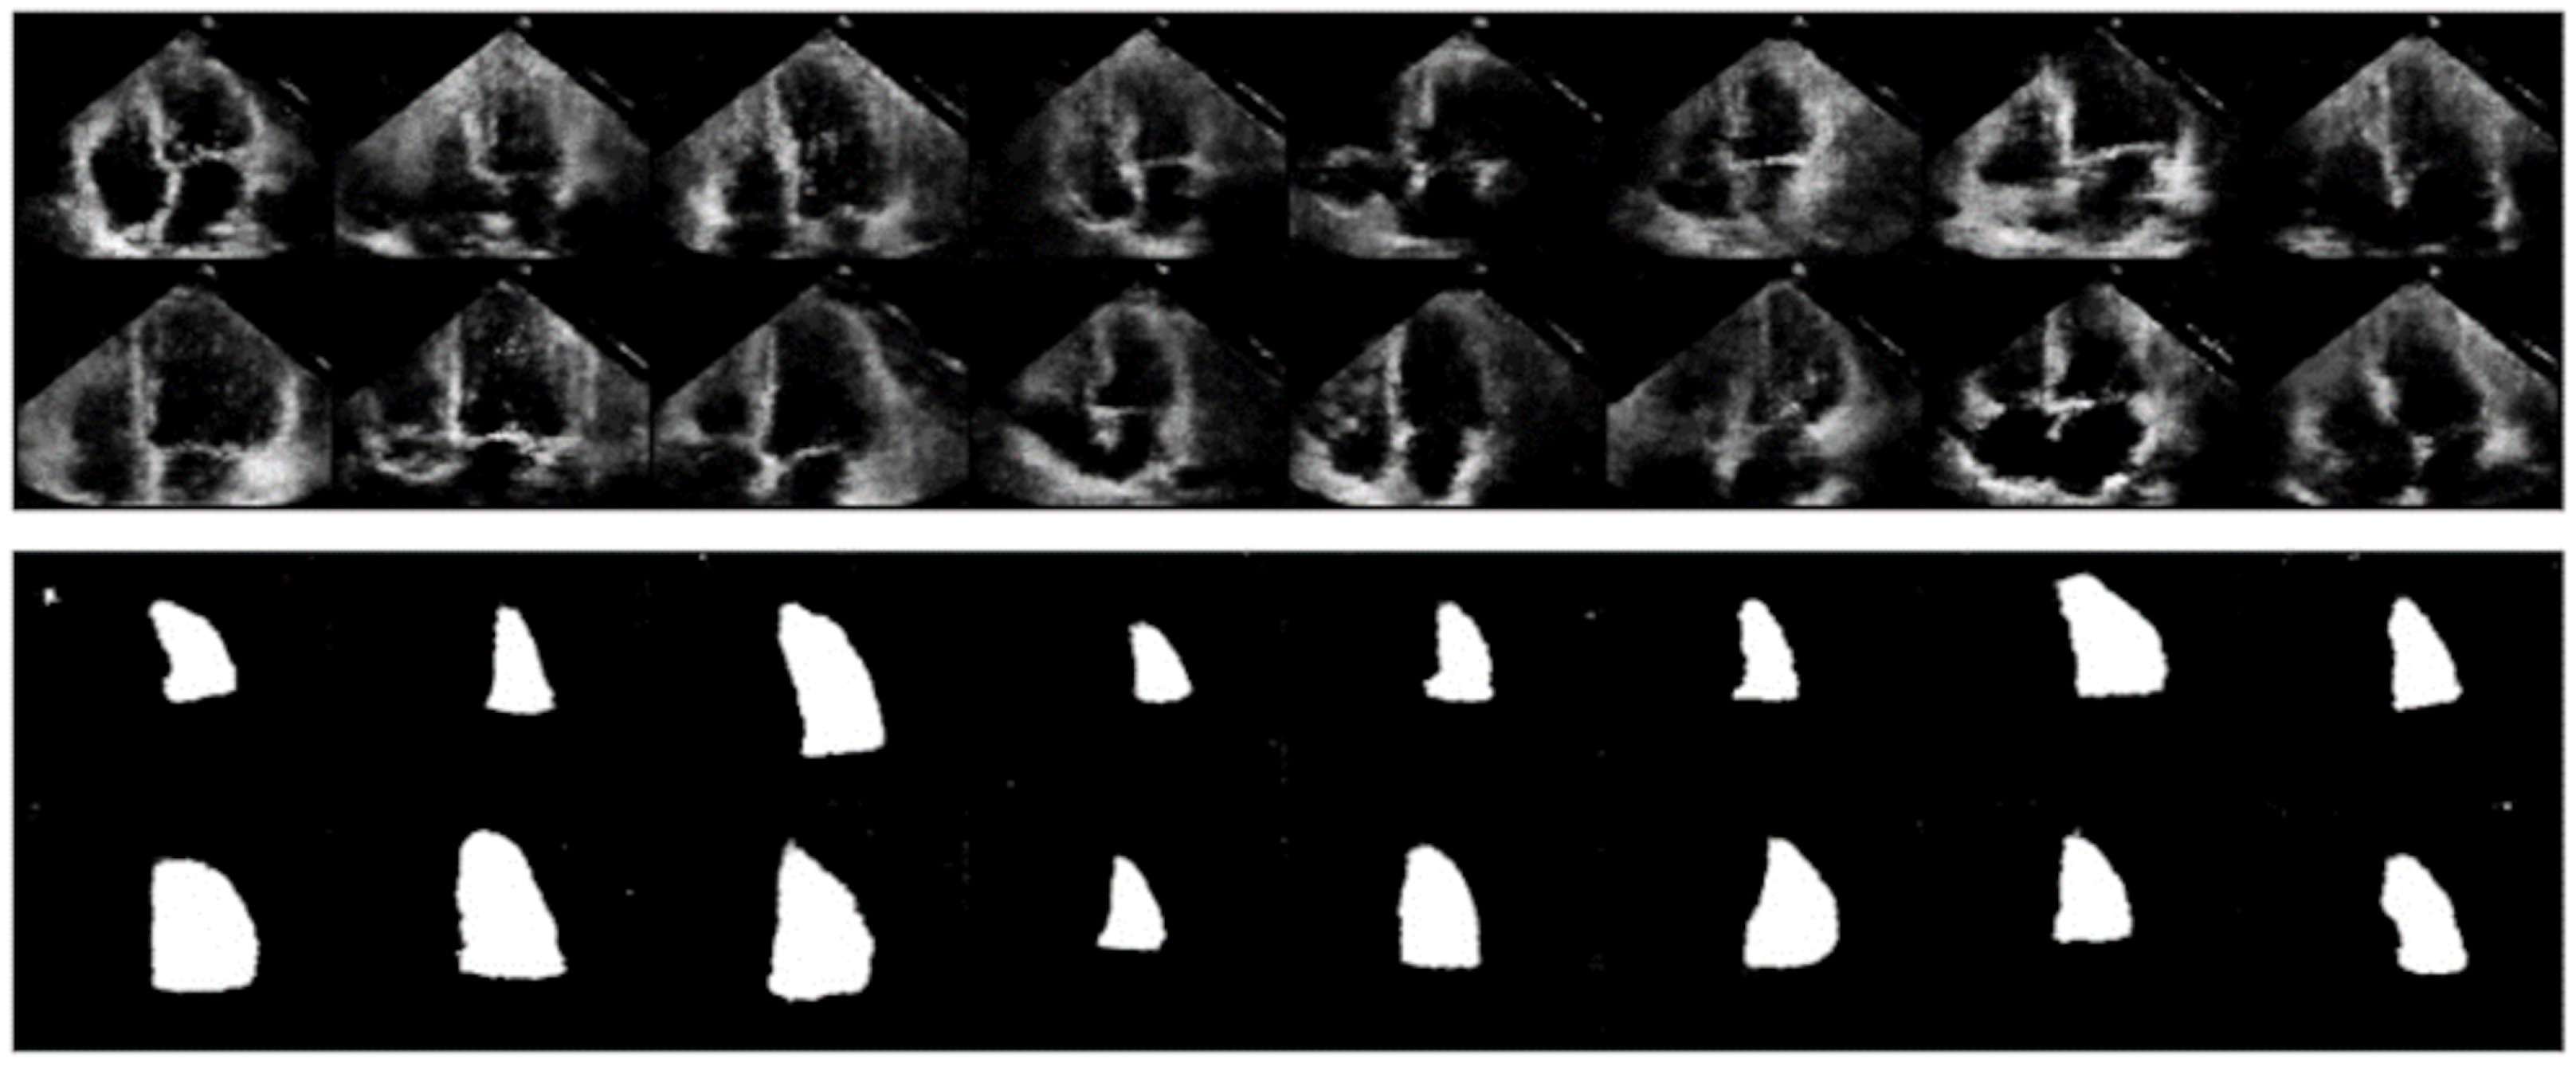
3. Data
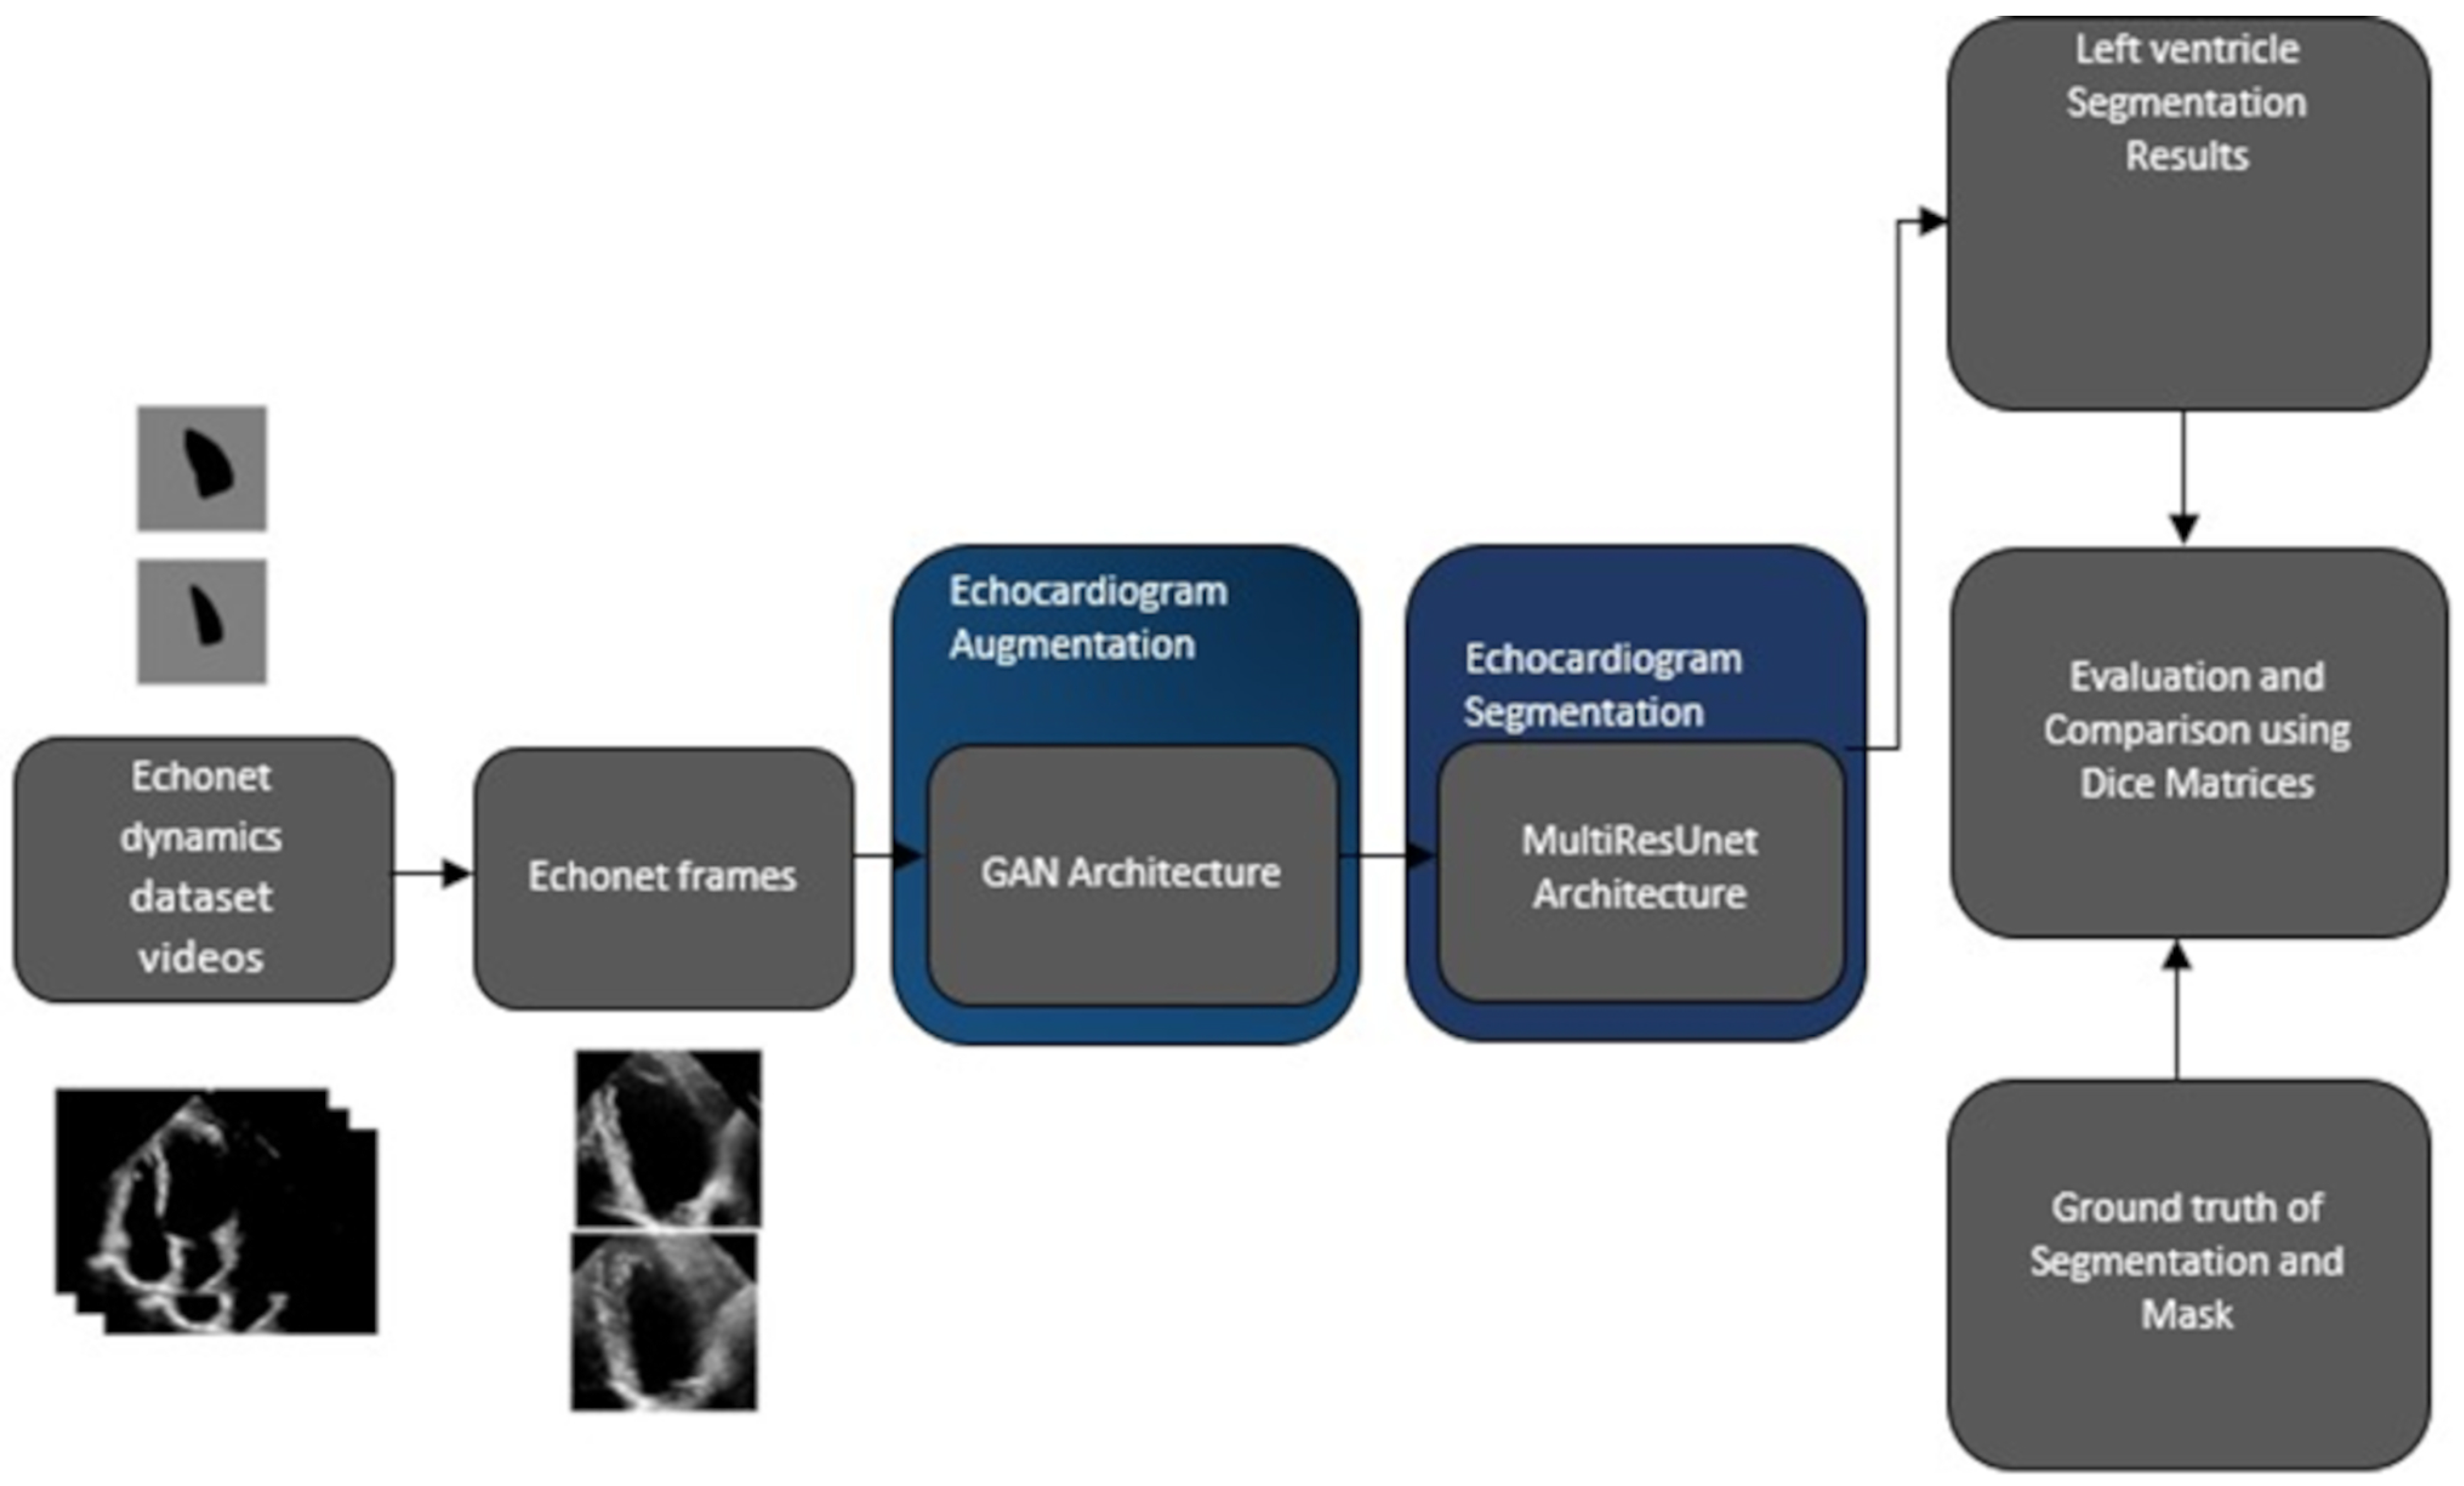
4. Methodology
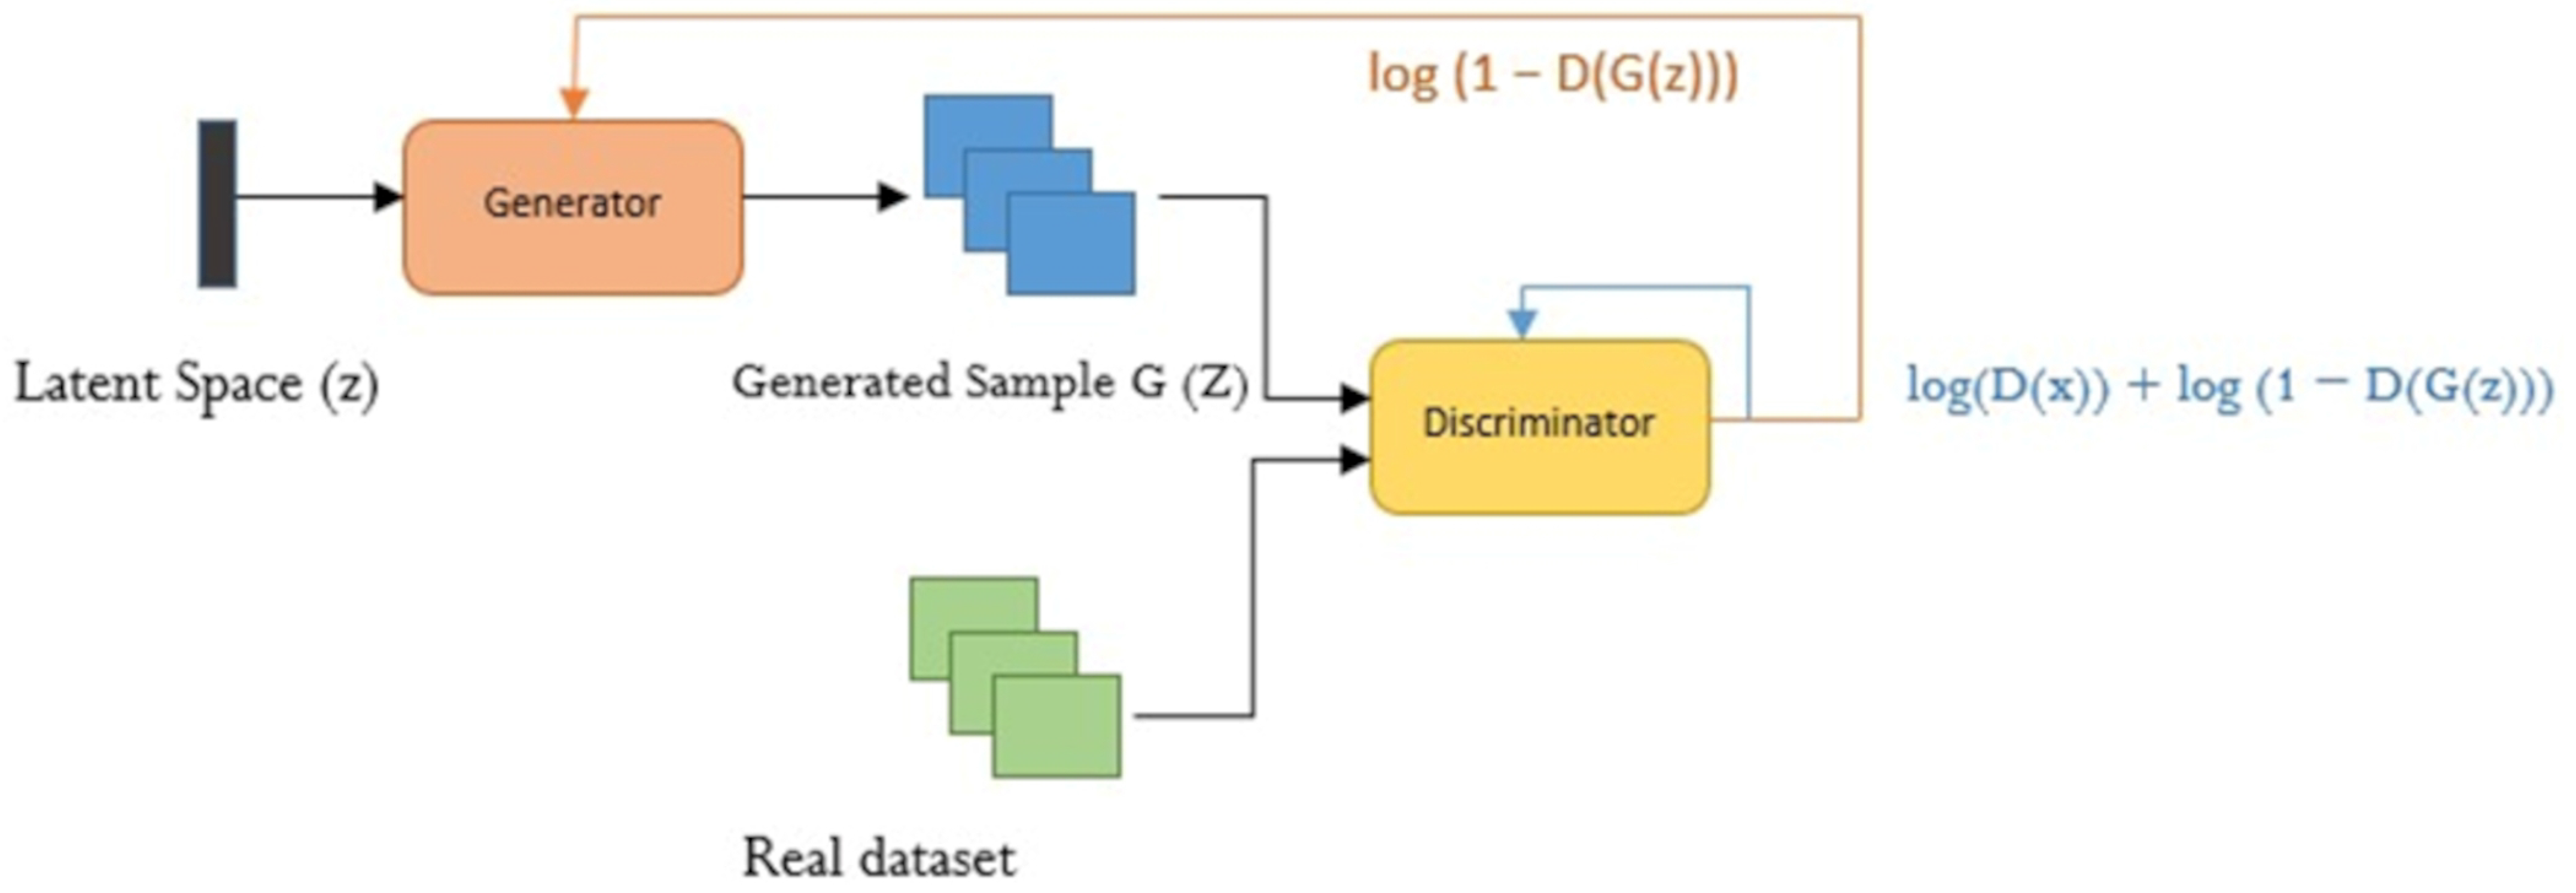
4.1. Data Augmentation with GAN
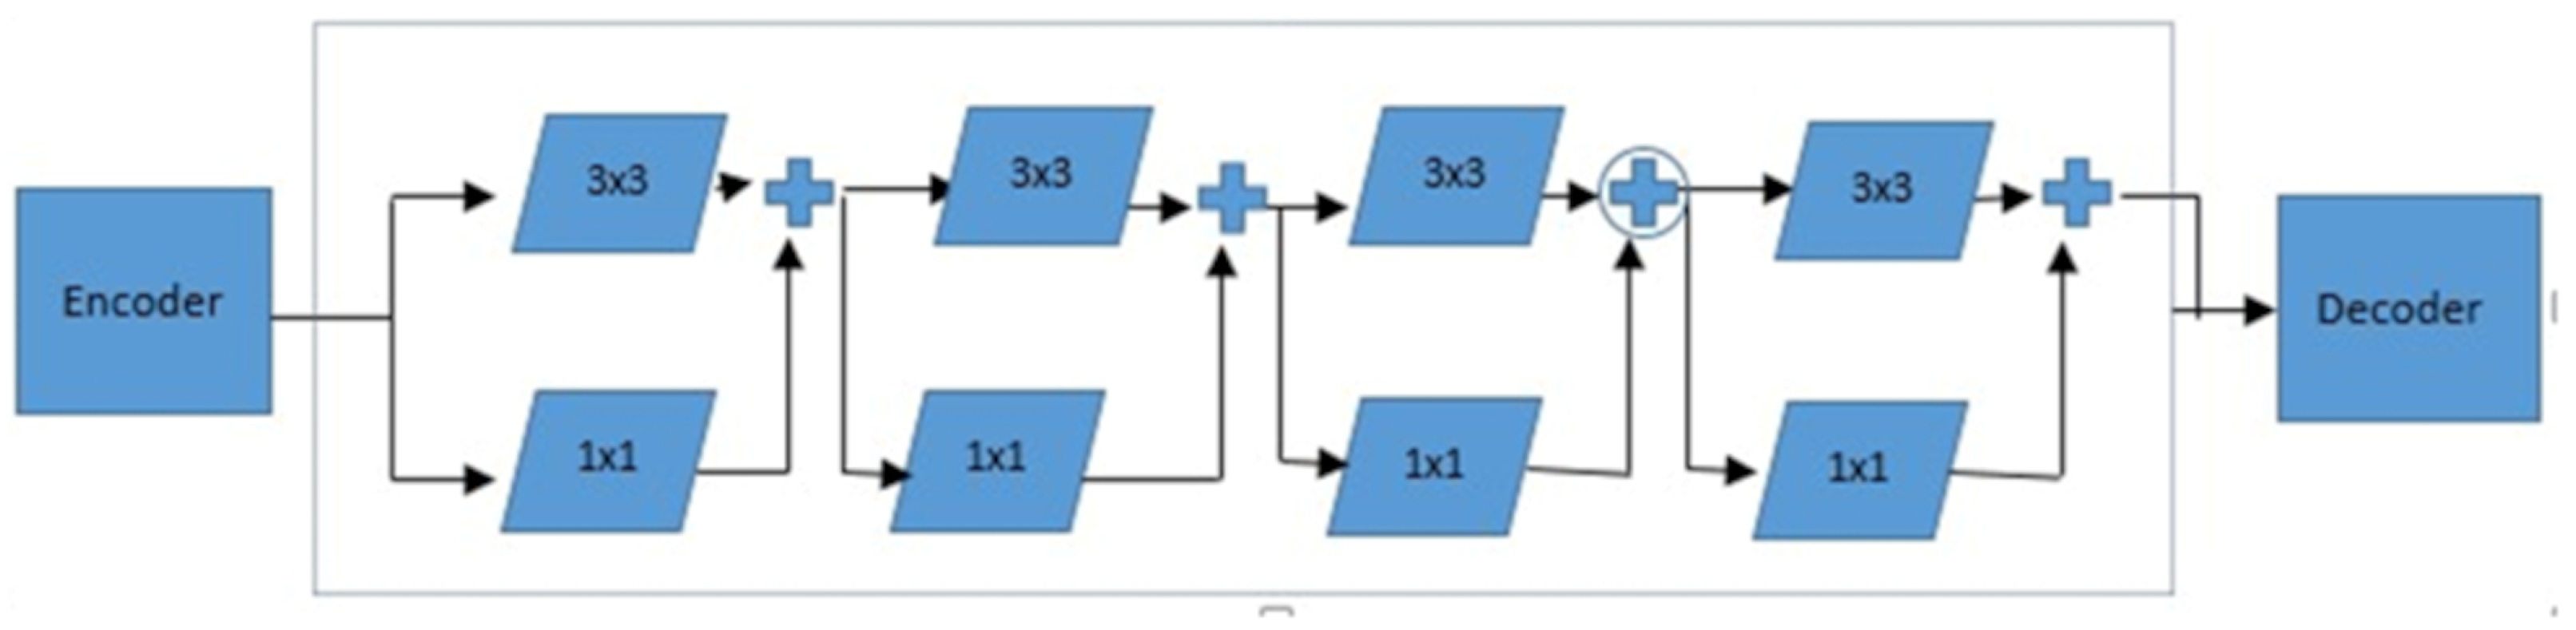
4.2. Segmentation Architecture
4.2.1. MultiRes Block
4.2.2. ResPath
4.2.3. SELU Activation Function
4.2.4. ASPP
4.2.5. Attention
4.3. Evaluation Matrices
5. Experiment and Results
5.1. GAN Architecture
5.2. Segmentation Architecture (MultiResUnet)
5.2.1. Dataset
5.2.2. Training Process
5.2.3. Evaluation Metrics
5.3. Implementation Results of Segmentation Architecture
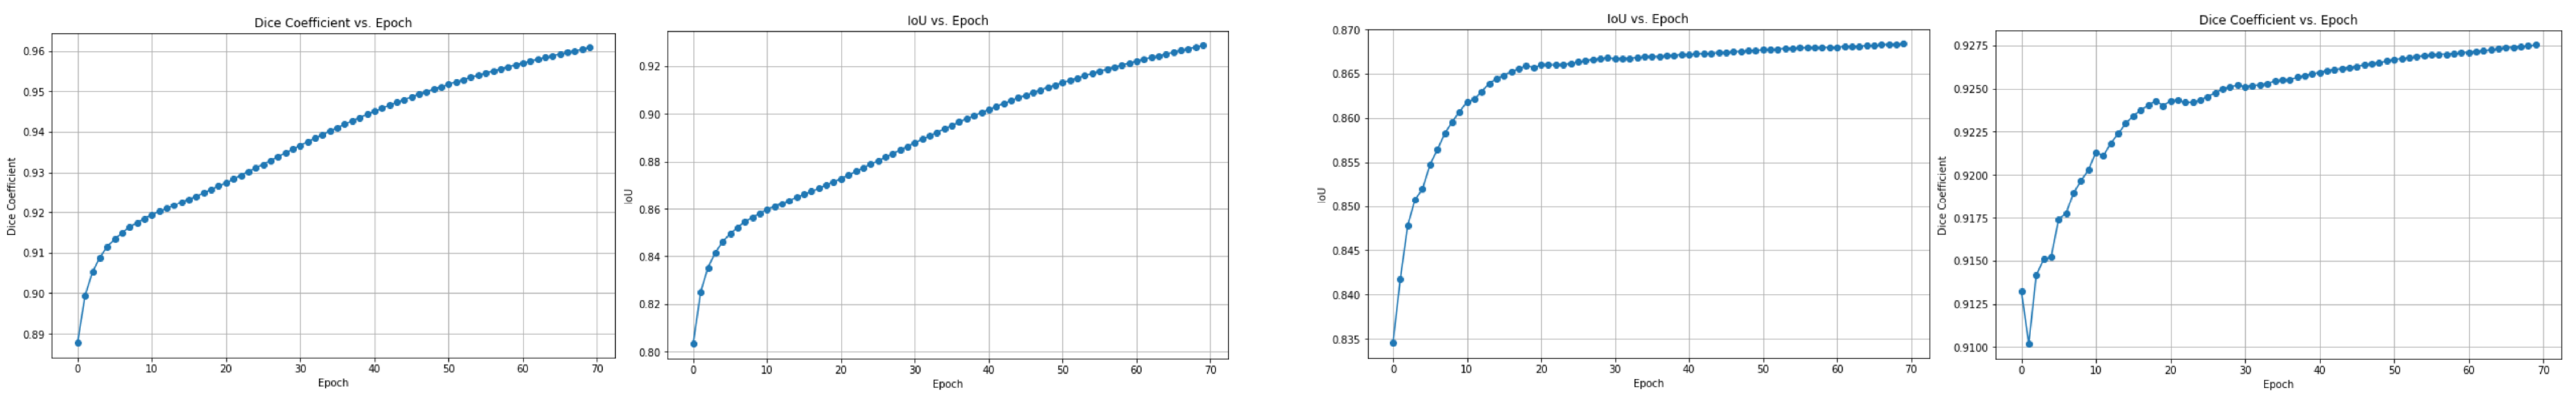
5.3.1. Training Phase
5.3.2. Validation Phase
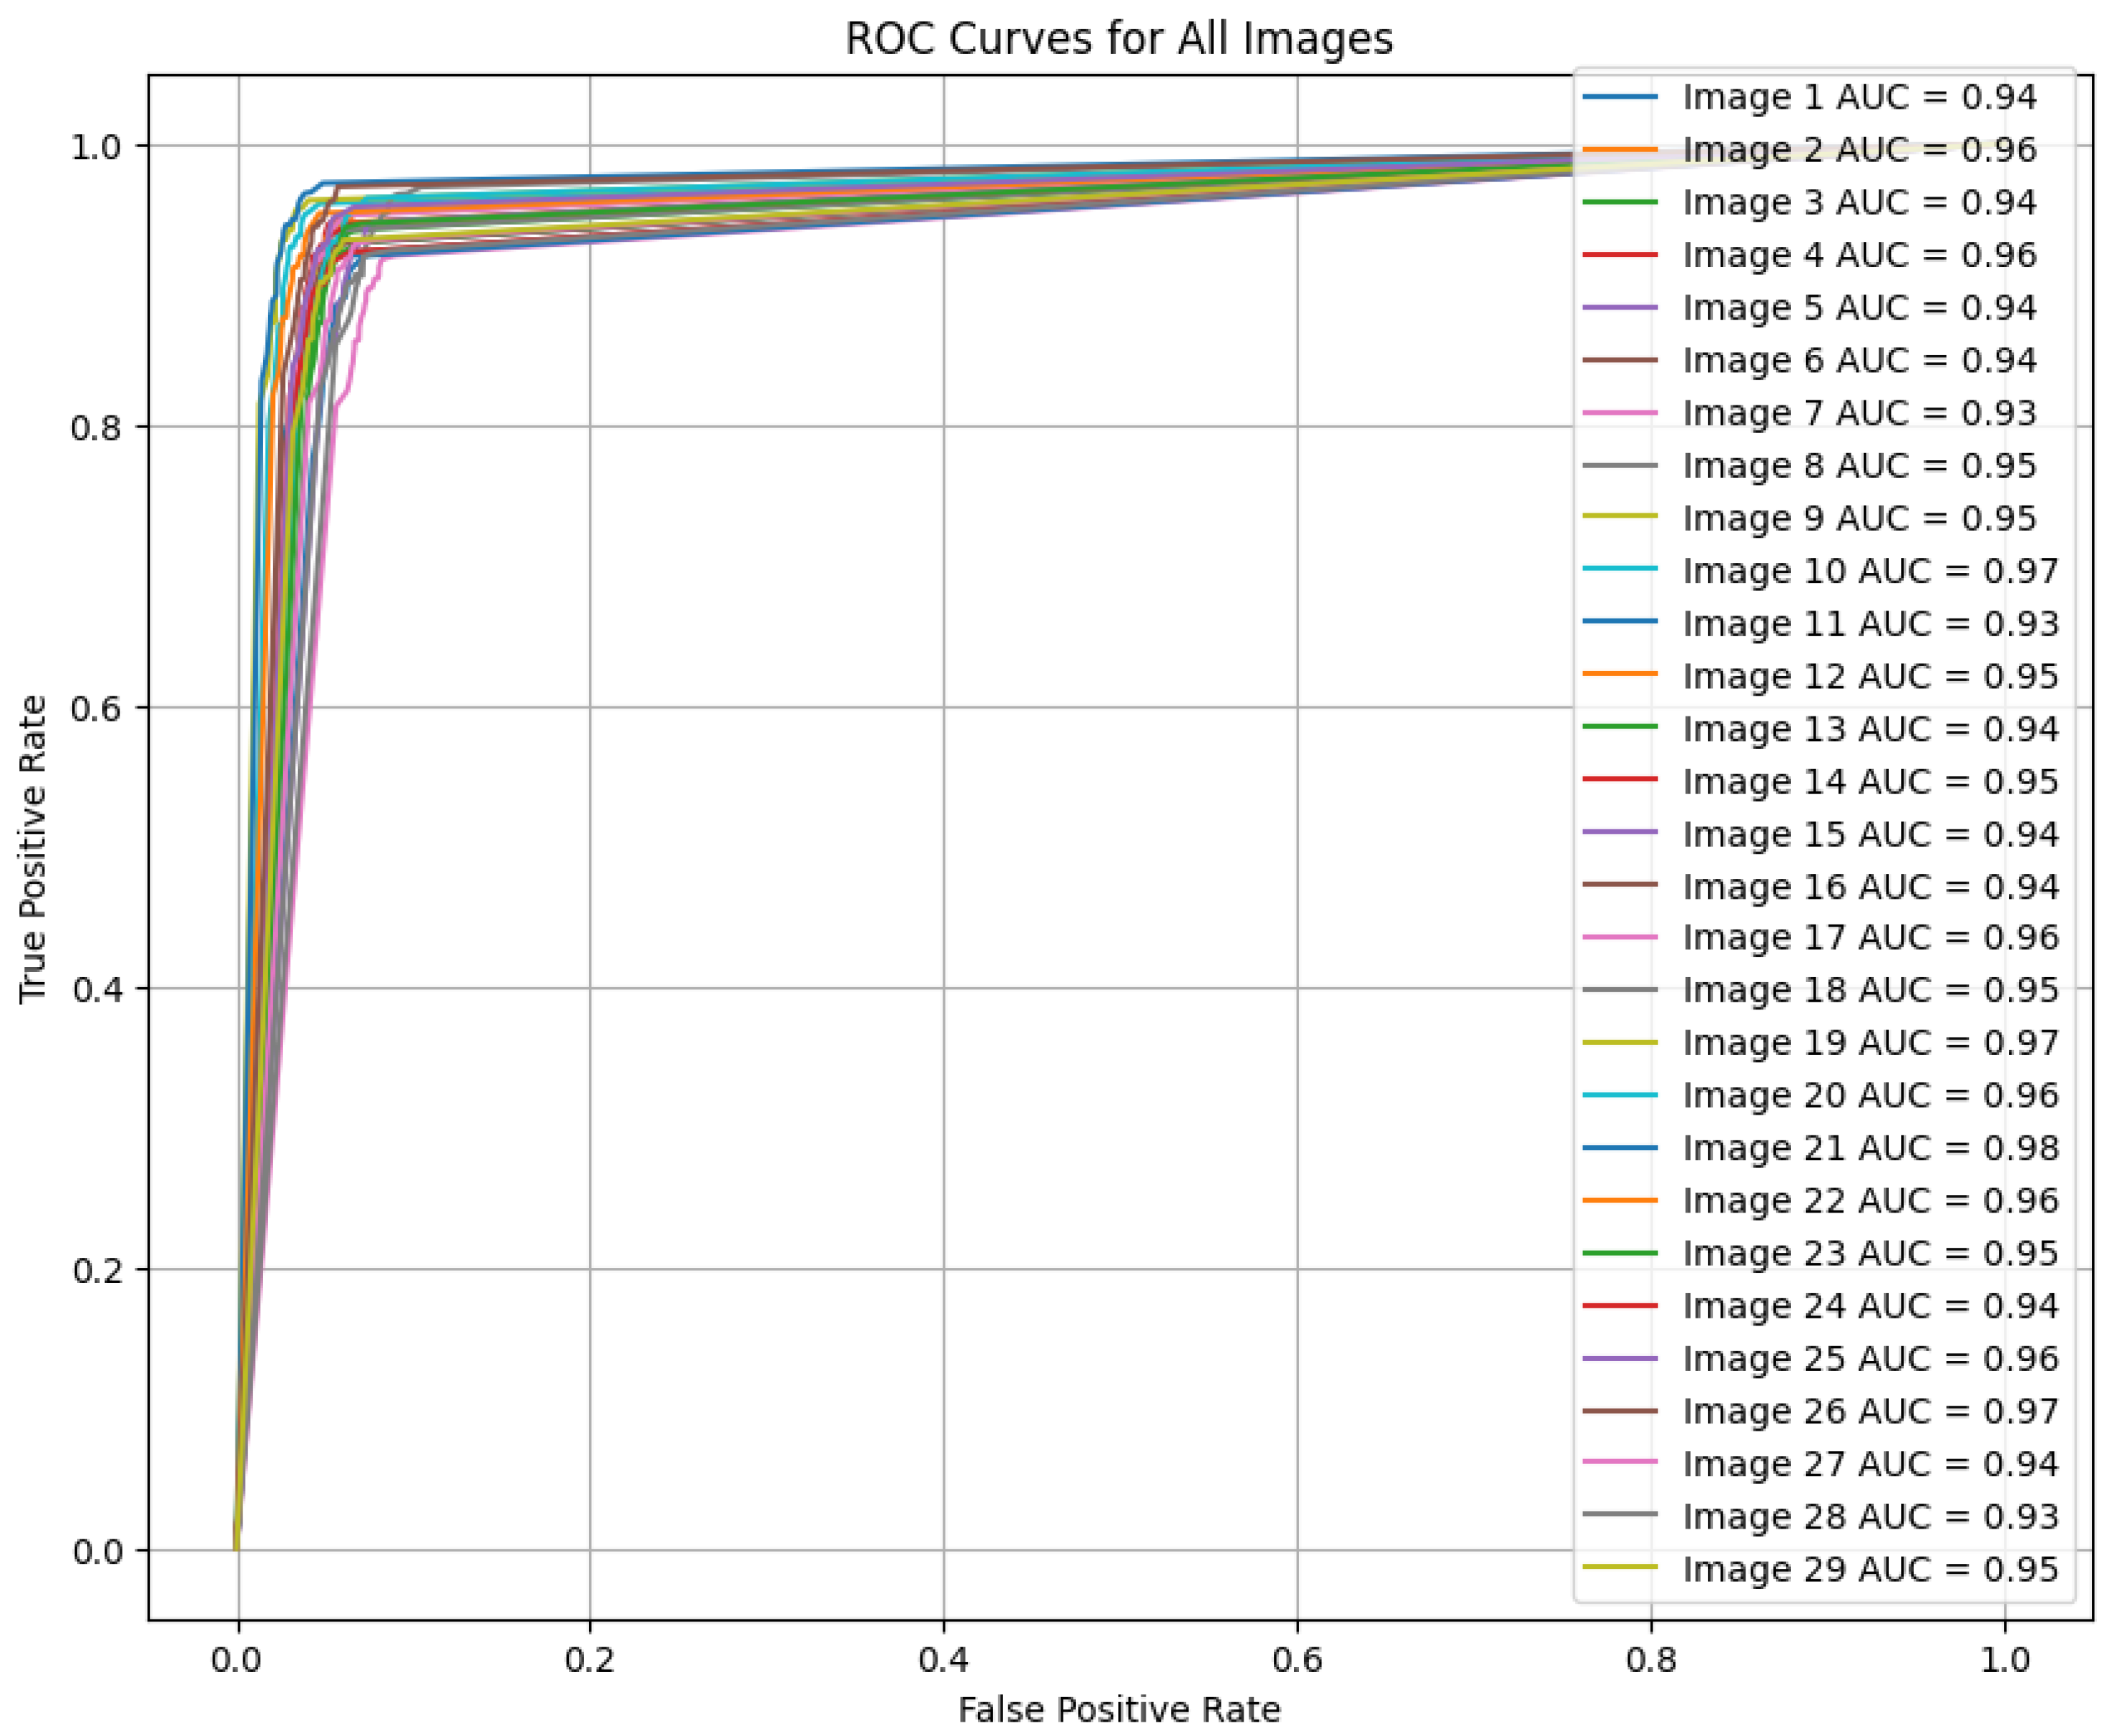
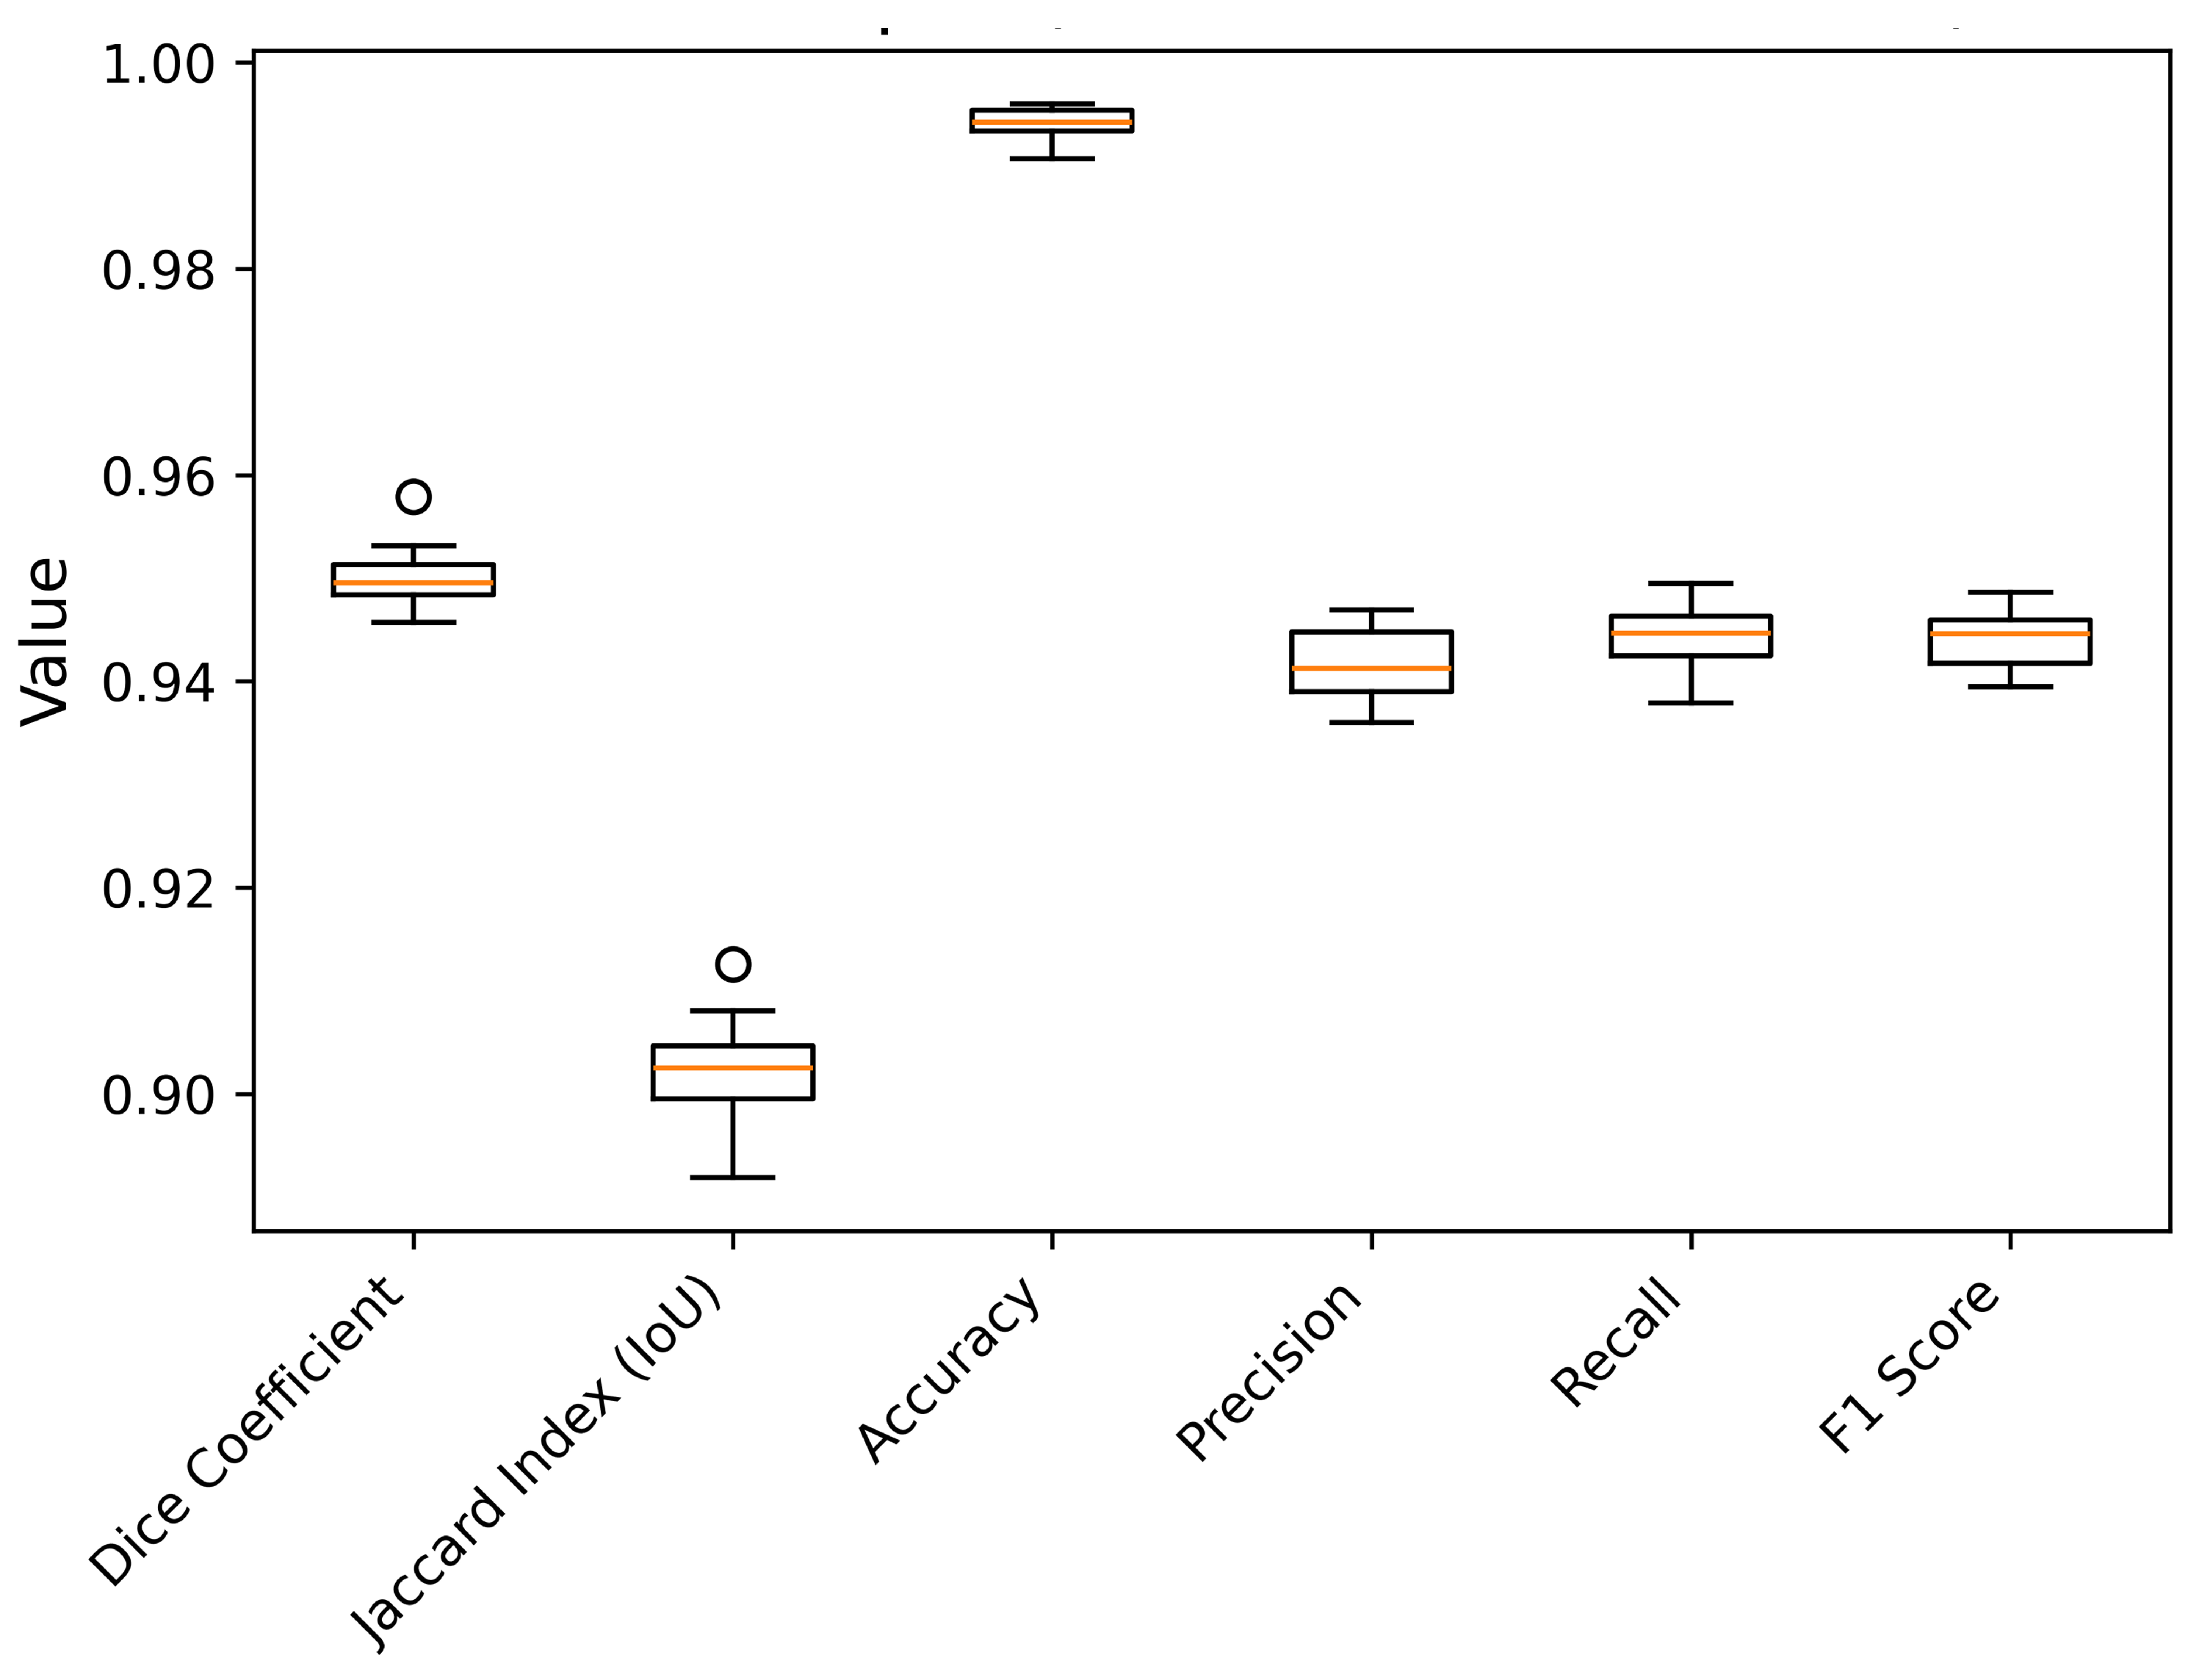
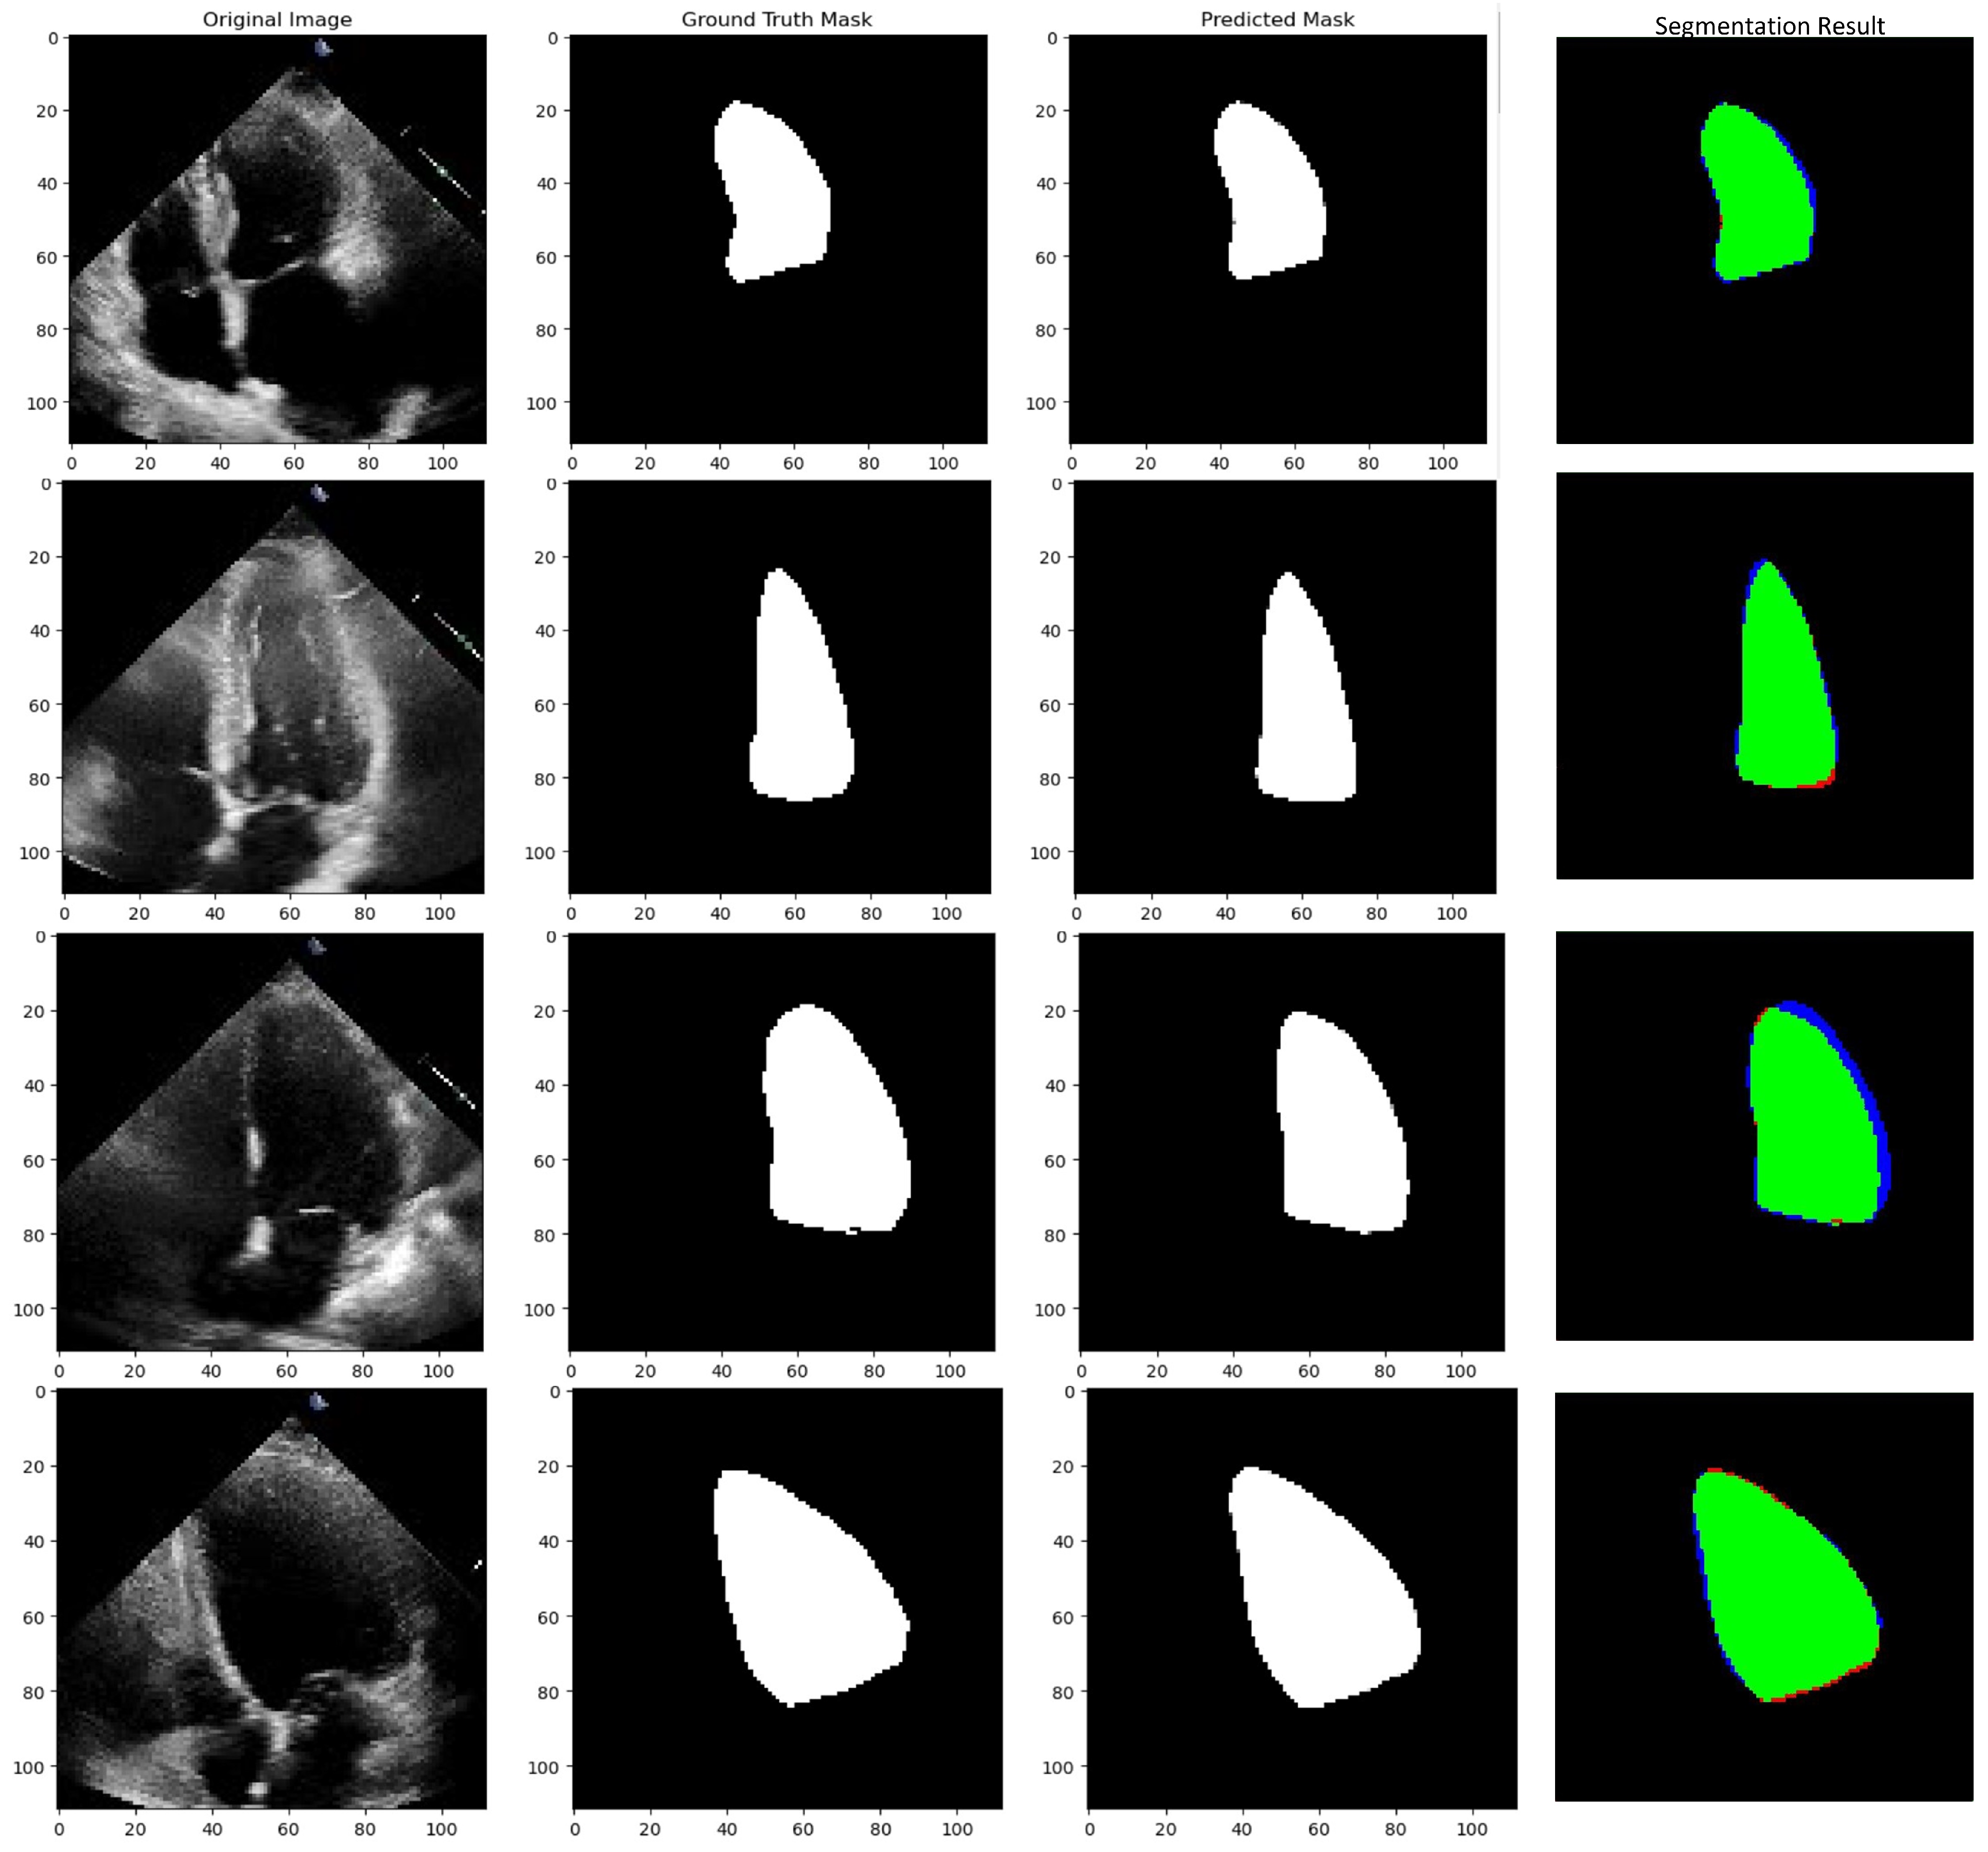
5.3.3. Testing Phase
5.3.4. Comparison of Other Methods
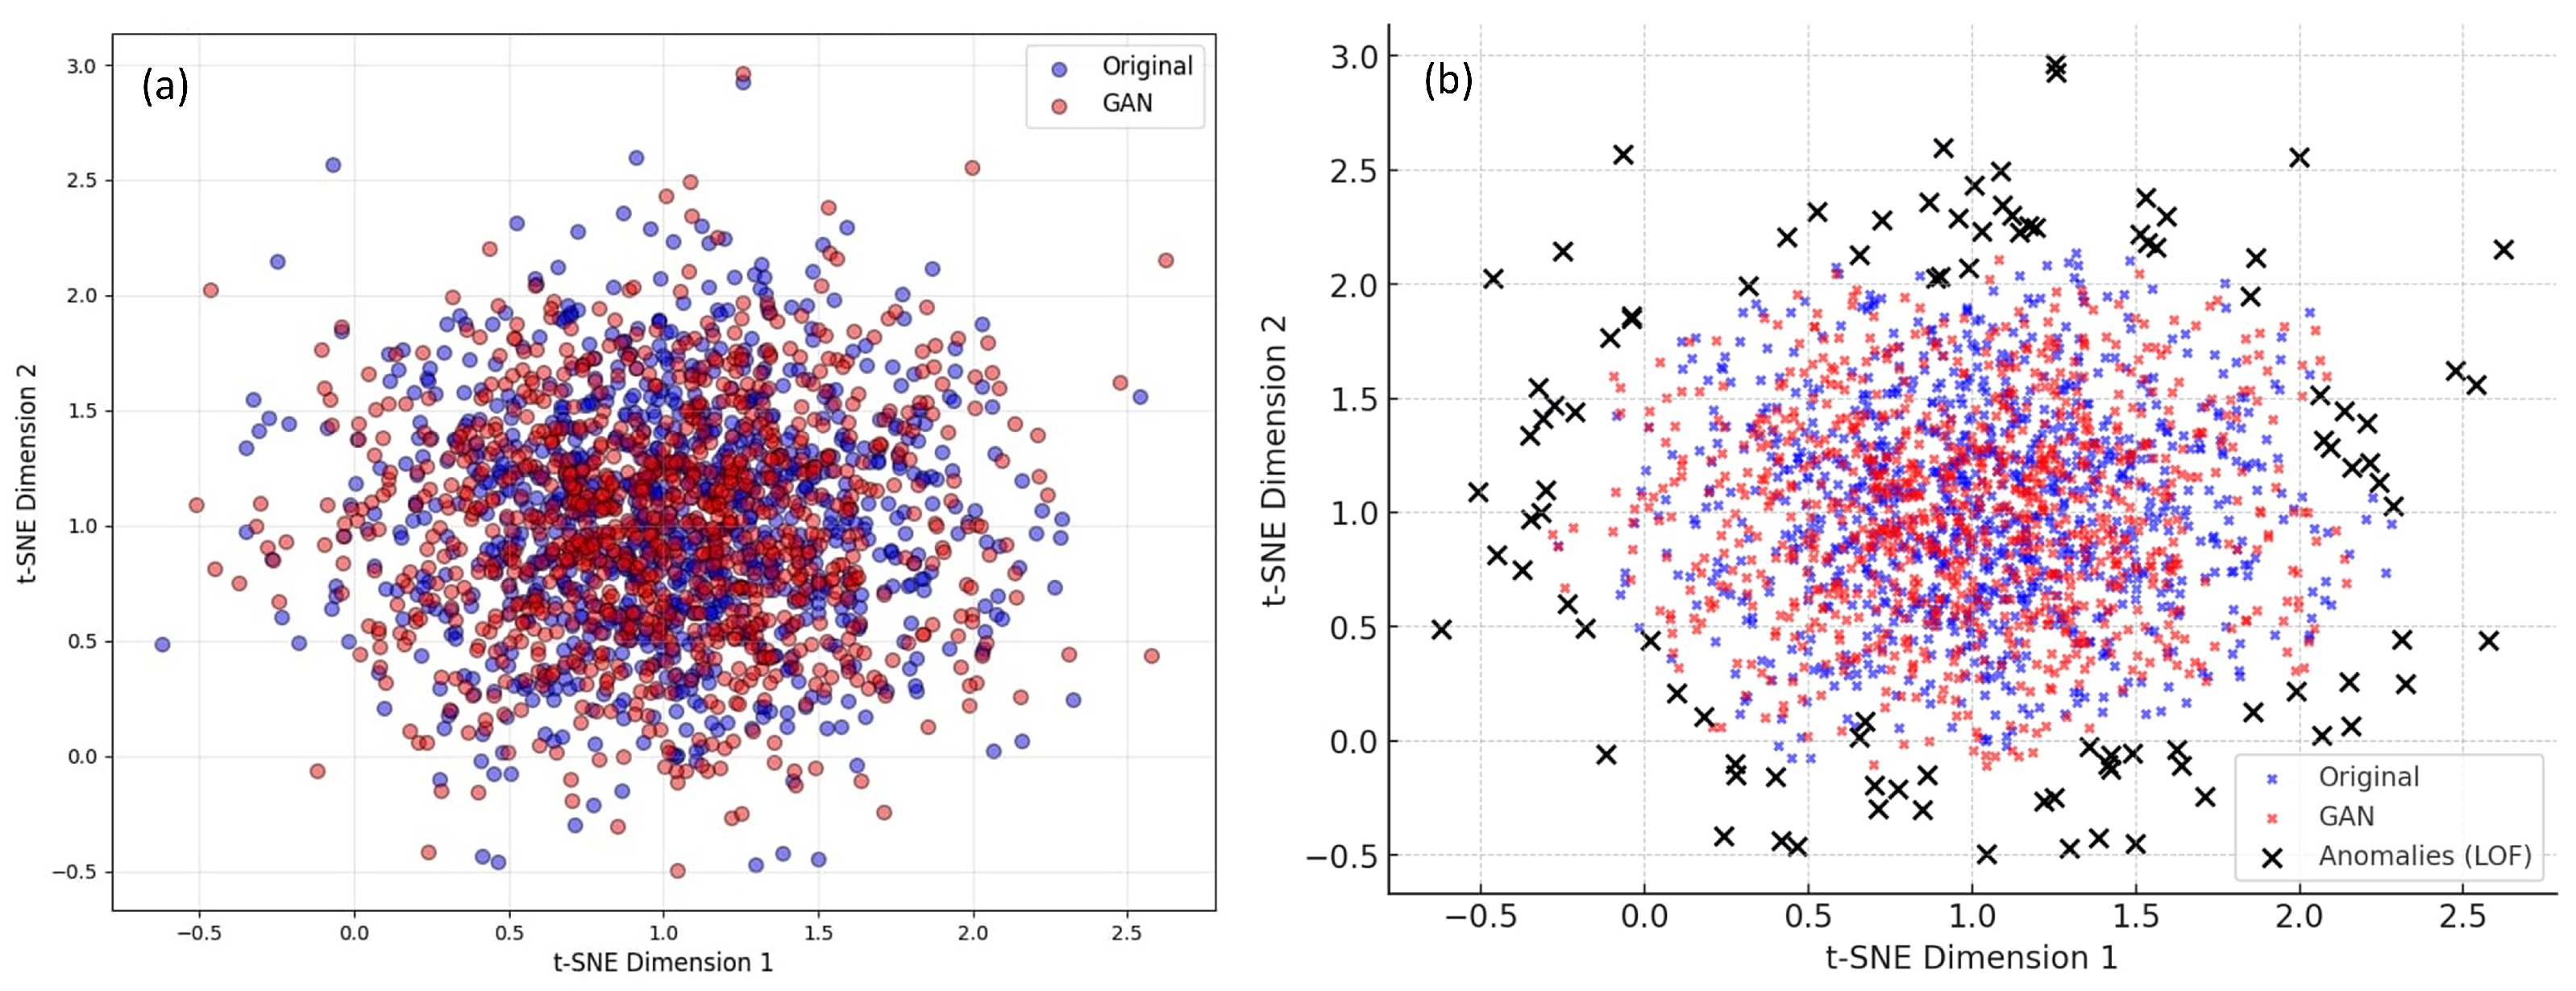
5.3.5. 2D Projection with LOF Anomaly Detection
6. Discussion
7. Conclusions and Future Work
Author Contributions
Funding
Institutional Review Board Statement
Informed Consent Statement
Data Availability Statement
Acknowledgments
Conflicts of Interest
References
- Deng, K.; Meng, Y.; Gao, D.; Bridge, J.; Shen, Y.; Lip, G.; Zhao, Y.; Zheng, Y. Transbridge: A lightweight transformer for left ventricle segmentation in echocardiography. In Proceedings of the Simplifying Medical Ultrasound: Second International Workshop, ASMUS 2021, Strasbourg, France, 27 September 2021; Held in Conjunction with MICCAI 2021, Proceedings 2. Springer: Berlin/Heidelberg, Germany, 2021; pp. 63–72. [Google Scholar]
- Ouyang, D.; He, B.; Ghorbani, A.; Lungren, M.P.; Ashley, E.A.; Liang, D.H.; Zou, J.Y. Echonet-dynamic: A large new cardiac motion video data resource for medical machine learning. In Proceedings of the NeurIPS ML4H Workshop, Vancouver, BC, Canada, 13 December 2019; pp. 1–11. [Google Scholar]
- Barbosa, D.; Friboulet, D.; D’hooge, J.; Bernard, O. Fast tracking of the left ventricle using global anatomical affine optical flow and local recursive block matching. MIDAS J. 2014, 10, 17–24. [Google Scholar] [CrossRef]
- Noble, J.A.; Boukerroui, D. Ultrasound image segmentation: A survey. IEEE Trans. Med. Imaging 2006, 25, 987–1010. [Google Scholar] [CrossRef] [PubMed]
- Goshtasby, A.; Turner, D.A. Segmentation of cardiac cine MR images for extraction of right and left ventricular chambers. IEEE Trans. Med. Imaging 1995, 14, 56–64. [Google Scholar] [CrossRef] [PubMed]
- Leclerc, S.; Grenier, T.; Espinosa, F.; Bernard, O. A fully automatic and multi-structural segmentation of the left ventricle and the myocardium on highly heterogeneous 2D echocardiographic data. In Proceedings of the 2017 IEEE International Ultrasonics Symposium (IUS), Washington, DC, USA, 6–9 September 2017; IEEE: New York, NY, USA, 2017; pp. 1–4. [Google Scholar]
- Belous, G.; Busch, A.; Rowlands, D.; Gao, Y. Segmentation of the left ventricle in echocardiography using contextual shape model. In Proceedings of the 2016 International Conference on Digital Image Computing: Techniques and Applications (DICTA), Gold Coast, Australia, 30 November–2 December 2016; IEEE: New York, NY, USA, 2016; pp. 1–7. [Google Scholar]
- Cousty, J.; Najman, L.; Couprie, M.; Clément-Guinaudeau, S.; Goissen, T.; Garot, J. Segmentation of 4D cardiac MRI: Automated method based on spatio-temporal watershed cuts. Image Vis. Comput. 2010, 28, 1229–1243. [Google Scholar] [CrossRef]
- Afshin, M.; Ayed, I.B.; Punithakumar, K.; Law, M.; Islam, A.; Goela, A.; Peters, T.; Li, S. Regional assessment of cardiac left ventricular myocardial function via MRI statistical features. IEEE Trans. Med. Imaging 2013, 33, 481–494. [Google Scholar] [CrossRef] [PubMed]
- Wang, Z.; Salah, M.B.; Gu, B.; Islam, A.; Goela, A.; Li, S. Direct estimation of cardiac biventricular volumes with an adapted bayesian formulation. IEEE Trans. Biomed. Eng. 2014, 61, 1251–1260. [Google Scholar] [CrossRef] [PubMed]
- Liao, M.; Lian, Y.; Yao, Y.; Chen, L.; Gao, F.; Xu, L.; Huang, X.; Feng, X.; Guo, S. Left Ventricle Segmentation in Echocardiography with Transformer. Diagnostics 2023, 13, 2365. [Google Scholar] [CrossRef] [PubMed]
- Olivetti, N.; Sacilotto, L.; Moleta, D.B.; França, L.A.d.; Capeline, L.S.; Wulkan, F.; Wu, T.C.; Pessente, G.D.; Carvalho, M.L.P.d.; Hachul, D.T.; et al. Enhancing Arrhythmogenic Right Ventricular Cardiomyopathy Detection and Risk Stratification: Insights from Advanced Echocardiographic Techniques. Diagnostics 2024, 14, 150. [Google Scholar] [CrossRef] [PubMed]
- Moradi, S.; Oghli, M.G.; Alizadehasl, A.; Shiri, I.; Oveisi, N.; Oveisi, M.; Maleki, M.; Dhooge, J. MFP-Unet: A novel deep learning based approach for left ventricle segmentation in echocardiography. Phys. Medica 2019, 67, 58–69. [Google Scholar] [CrossRef] [PubMed]
- Liu, F.; Wang, K.; Liu, D.; Yang, X.; Tian, J. Deep pyramid local attention neural network for cardiac structure segmentation in two-dimensional echocardiography. Med. Image Anal. 2021, 67, 101873. [Google Scholar] [CrossRef] [PubMed]
- Guo, L.; Lei, B.; Chen, W.; Du, J.; Frangi, A.F.; Qin, J.; Zhao, C.; Shi, P.; Xia, B.; Wang, T. Dual attention enhancement feature fusion network for segmentation and quantitative analysis of paediatric echocardiography. Med. Image Anal. 2021, 71, 102042. [Google Scholar] [CrossRef] [PubMed]
- Ouyang, D.; He, B.; Ghorbani, A.; Yuan, N.; Ebinger, J.; Langlotz, C.P.; Heidenreich, P.A.; Harrington, R.A.; Liang, D.H.; Ashley, E.A.; et al. Video-based AI for beat-to-beat assessment of cardiac function. Nature 2020, 580, 252–256. [Google Scholar] [CrossRef]
- Reynaud, H.; Vlontzos, A.; Hou, B.; Beqiri, A.; Leeson, P.; Kainz, B. Ultrasound video transformers for cardiac ejection fraction estimation. In Proceedings of the Medical Image Computing and Computer Assisted Intervention–MICCAI 2021: 24th International Conference, Strasbourg, France, 27 September–1 October 2021; Proceedings, Part VI 24. Springer: Berlin/Heidelberg, Germany, 2021; pp. 495–505. [Google Scholar]
- Tsang, W.; Salgo, I.S.; Medvedofsky, D.; Takeuchi, M.; Prater, D.; Weinert, L.; Yamat, M.; Mor-Avi, V.; Patel, A.R.; Lang, R.M. Transthoracic 3D echocardiographic left heart chamber quantification using an automated adaptive analytics algorithm. JACC Cardiovasc. Imaging 2016, 9, 769–782. [Google Scholar] [CrossRef] [PubMed]
- Dong, T.; Sunderland, N.; Nightingale, A.; Fudulu, D.P.; Chan, J.; Zhai, B.; Freitas, A.; Caputo, M.; Dimagli, A.; Mires, S.; et al. Development and Evaluation of a Natural Language Processing System for Curating a Trans-Thoracic Echocardiogram (TTE) Database. Bioengineering 2023, 10, 1307. [Google Scholar] [CrossRef] [PubMed]
- Zhang, J.; Gajjala, S.; Agrawal, P.; Tison, G.H.; Hallock, L.A.; Beussink-Nelson, L.; Lassen, M.H.; Fan, E.; Aras, M.A.; Jordan, C.; et al. Fully automated echocardiogram interpretation in clinical practice: Feasibility and diagnostic accuracy. Circulation 2018, 138, 1623–1635. [Google Scholar] [CrossRef]
- Dong, S.; Luo, G.; Sun, G.; Wang, K.; Zhang, H. A left ventricular segmentation method on 3D echocardiography using deep learning and snake. In Proceedings of the 2016 Computing in Cardiology Conference (CinC), Vancouver, BC, Canada, 11–14 September 2016; IEEE: New York, NY, USA, 2016; pp. 473–476. [Google Scholar]
- ∅stvik, A. Automatic Analysis in Echocardiography Using Machine Learning; NTNU open: Gjøvik, Norway, 2021. [Google Scholar]
- Oktay, O.; Ferrante, E.; Kamnitsas, K.; Heinrich, M.; Bai, W.; Caballero, J.; Cook, S.A.; De Marvao, A.; Dawes, T.; O‘Regan, D.P.; et al. Anatomically constrained neural networks (ACNNs): Application to cardiac image enhancement and segmentation. IEEE Trans. Med. Imaging 2017, 37, 384–395. [Google Scholar] [CrossRef] [PubMed]
- Amer, A.; Ye, X.; Janan, F. ResDUnet: A deep learning-based left ventricle segmentation method for echocardiography. IEEE Access 2021, 9, 159755–159763. [Google Scholar] [CrossRef]
- Chen, J.; Lu, Y.; Yu, Q.; Luo, X.; Adeli, E.; Wang, Y.; Lu, L.; Yuille, A.L.; Zhou, Y. Transunet: Transformers make strong encoders for medical image segmentation. arXiv 2021, arXiv:2102.04306. [Google Scholar]
- Zeng, Y.; Tsui, P.H.; Pang, K.; Bin, G.; Li, J.; Lv, K.; Wu, X.; Wu, S.; Zhou, Z. MAEF-Net: Multi-attention efficient feature fusion network for left ventricular segmentation and quantitative analysis in two-dimensional echocardiography. Ultrasonics 2023, 127, 106855. [Google Scholar] [CrossRef] [PubMed]
- Goodfellow, I.; Pouget-Abadie, J.; Mirza, M.; Xu, B.; Warde-Farley, D.; Ozair, S.; Courville, A.; Bengio, Y. Generative adversarial networks. In Proceedings of the Advances in Neural Information Processing Systems 27: Annual Conference on Neural Information Processing Systems 2014, Montreal, QC, Canada, 8–13 December 2014; Volume 2, pp. 2672–2680. [Google Scholar]
- Ibtehaz, N.; Rahman, M.S. MultiResUNet: Rethinking the U-Net architecture for multimodal biomedical image segmentation. Neural Netw. 2020, 121, 74–87. [Google Scholar] [CrossRef] [PubMed]
- Yang, Q.; Li, Y.; Zhang, M.; Wang, T.; Yan, F.; Xie, C. Automatic segmentation of COVID-19 CT images using improved MultiResUNet. In Proceedings of the 2020 Chinese Automation Congress (CAC), Shanghai, China, 6–8 November 2020; IEEE: New York, NY, USA, 2020; pp. 1614–1618. [Google Scholar]
- Jha, D.; Smedsrud, P.H.; Riegler, M.A.; Johansen, D.; De Lange, T.; Halvorsen, P.; Johansen, H.D. Resunet++: An advanced architecture for medical image segmentation. In Proceedings of the 2019 IEEE international symposium on multimedia (ISM), San Diego, CA, USA, 9–11 December 2019; IEEE: New York, NY, USA, 2019; pp. 225–2255. [Google Scholar]
- Zeng, Y.; Tsui, P.H.; Wu, W.; Zhou, Z.; Wu, S. MAEF-Net: Multi-attention efficient feature fusion network for deep learning segmentation. In Proceedings of the 2021 IEEE International Ultrasonics Symposium (IUS), Xi’an, China, 11–16 September 2021; IEEE: New York, NY, USA, 2021; pp. 1–4. [Google Scholar]


| Bibliography | Dataset | Methods | Achieved Results |
|---|---|---|---|
| [3] | CETUS (MICCAI Challenge Dataset) | Utilized an active contour method with mathematical fitting | Achieved a Dice coefficient of 0.937 |
| [20] | UCSF | Employed a Convolutional Neural Network within the conventional U-Net framework comprising 23 layers | Attained an IoU score of 0.891 |
| [21] | CETUS (MICCAI Challenge Dataset) | Implemented an active snake technique enhanced by a Convolutional Neural Network encoder acting as a locator | Demonstrated modified Dice coefficients of 0.112 (ED) and 0.160 (ES) |
| [22] | 1500 videos | Utilized a CNN model with U-Net architecture and supplementary training involving Kalman filtering | Reported Dice coefficients of 0.870 (CNN) and 0.860 (KF) |
| [23] | CETUS (MICCAI Challenge Dataset) | Employed a Convolutional Neural Network incorporating autoencoder architecture to align with the structure of the LV | Achieved Dice coefficients of 0.912 (ED) and 0.873 (ES) |
| [16] | EchoNet-Dynamic | Developed a Convolutional Neural Network using the Deeplab V3 architecture and atrous convolutions | Attained Dice coefficients of 0.927 (ED) and 0.903 (ES) |
| [24] | CAMUS DATASET | Created a Convolutional Neural Network with a combination of residual blocks and U-Net-based encoder-decoder architecture | Achieved a Dice coefficient of 0.951 |
| [1] | EchoNet-Dynamic | Convolutional Neural Network with Transformer architecture connected with encoder and decoder | Demonstrated a Dice coefficient of 0.916 |
| [25] | EchoNet-Dynamic (screened) | U-Net architecture with Transformer | Achieved a Dice coefficient of 0.925 |
| [26] | EchoNet-Dynamic (screened) | EASPP module and channel-spatial dual attention mechanism with Convolutional Neural Network | Dice: 0.931 (LV) |
| Dataset | Training | Validation | Testing |
|---|---|---|---|
| Original | 7465 | 1288 | 1277 |
| After GAN | 14,930 | 2576 | 2524 |
| Method | Dice Coefficient | Jaccard Index (IoU) | Precision | Accuracy | F1-Score | Area Error Ratio | Other Notes |
|---|---|---|---|---|---|---|---|
| UNet | 0.89 | 0.81 | 0.88 | 0.91 | 0.88 | 0.15 | Strong baseline, sensitive to noise |
| UNet++ | 0.91 | 0.84 | 0.90 | 0.93 | 0.91 | 0.12 | Improved multi-scale segmentation |
| Attention-UNet | 0.92 | 0.85 | 0.91 | 0.94 | 0.92 | 0.11 | Better edge refinement |
| ResUNet | 0.90 | 0.83 | 0.89 | 0.92 | 0.90 | 0.13 | Efficient with residual connections |
| R50-AttnUNet | 0.93 | 0.87 | 0.92 | 0.95 | 0.93 | 0.10 | Uses EMA for precision |
| DeepLabv3+ | 0.94 | 0.88 | 0.93 | 0.96 | 0.94 | 0.09 | Excellent for large datasets |
| YOLO-based | 0.92 | 0.85 | 0.91 | 0.94 | 0.92 | 0.11 | Optimized for speed |
| MultiResUNet | 0.91 | 0.86 | 0.89 | 0.98 | 0.90 | 0.02 | Ablation 1 |
| MultiResUNet + ASPP + Attention (Without GAN ) | 0.92 | 0.87 | 0.91 | 0.98 | 0.91 | 0.02 | Ablation 2 |
| MultiResUNet + ASPP + Attention + GAN (Proposed approach) | 0.96 | 0.92 | 0.99 | 0.99 | 0.98 | 0.02 | Optimized for handling noises and variability in echocardiogram data |
| Model | Dice Coefficient | JaccardIndex (IoU) | Precision | Accuracy | F1-Score |
|---|---|---|---|---|---|
| Proposed Model (with GAN) | 0.9568 | 0.9162 | 0.9898 | 0.9976 | 0.9879 |
| Proposed Model (with GAN + LOF) | 0.9582 | 0.9185 | 0.9901 | 0.9978 | 0.9883 |
| Authors | Methods | Year | Dataset | IoU | Dice |
|---|---|---|---|---|---|
| Ouyang et al. [16] | DeepLabV3 and ResNet | 2020 | EchoNet Dynamics | NA | 91.50 |
| Deng et al. [1] | Trans Bridge | 2021 | EchoNet Dynamics | NA | 91.64 |
| Chen et al. [25] | Trans U-net | 2021 | EchoNet Dynamics | NA | 92.54 |
| Minqi Liao et al. [11] | Swin Transformer and K-Net | 2023 | EchoNet Dynamics | 86.78 | 92.92 |
| Minqi Liao et al. [11] | Segformer Network | 2023 | EchoNet Dynamics | 86.57 | 92.79 |
| Yan Zeng et al. [31] | MAEF-Net | 2023 | EchoNet Dynamics | NA | 93.10 |
| Proposed MultiResUnet | 2024 | EchoNet Dynamics and Synthetic Dataset | 91.62 | 95.68 |
Disclaimer/Publisher’s Note: The statements, opinions and data contained in all publications are solely those of the individual author(s) and contributor(s) and not of MDPI and/or the editor(s). MDPI and/or the editor(s) disclaim responsibility for any injury to people or property resulting from any ideas, methods, instructions or products referred to in the content. |
© 2025 by the authors. Licensee MDPI, Basel, Switzerland. This article is an open access article distributed under the terms and conditions of the Creative Commons Attribution (CC BY) license (https://creativecommons.org/licenses/by/4.0/).
Share and Cite
Kumar, V.; Sharma, N.M.; Mahapatra, P.K.; Dogra, N.; Maurya, L.; Ahmad, F.; Dahiya, N.; Panda, P. Enhancing Left Ventricular Segmentation in Echocardiograms Through GAN-Based Synthetic Data Augmentation and MultiResUNet Architecture. Diagnostics 2025, 15, 663. https://doi.org/10.3390/diagnostics15060663
Kumar V, Sharma NM, Mahapatra PK, Dogra N, Maurya L, Ahmad F, Dahiya N, Panda P. Enhancing Left Ventricular Segmentation in Echocardiograms Through GAN-Based Synthetic Data Augmentation and MultiResUNet Architecture. Diagnostics. 2025; 15(6):663. https://doi.org/10.3390/diagnostics15060663
Chicago/Turabian StyleKumar, Vikas, Nitin Mohan Sharma, Prasant K. Mahapatra, Neeti Dogra, Lalit Maurya, Fahad Ahmad, Neelam Dahiya, and Prashant Panda. 2025. "Enhancing Left Ventricular Segmentation in Echocardiograms Through GAN-Based Synthetic Data Augmentation and MultiResUNet Architecture" Diagnostics 15, no. 6: 663. https://doi.org/10.3390/diagnostics15060663
APA StyleKumar, V., Sharma, N. M., Mahapatra, P. K., Dogra, N., Maurya, L., Ahmad, F., Dahiya, N., & Panda, P. (2025). Enhancing Left Ventricular Segmentation in Echocardiograms Through GAN-Based Synthetic Data Augmentation and MultiResUNet Architecture. Diagnostics, 15(6), 663. https://doi.org/10.3390/diagnostics15060663