
Pain-Related White-Matter Changes Following Mild Traumatic Brain Injury: A Longitudinal Diffusion Tensor Imaging Pilot Study

 , , , and
Abstract
1. Introduction
2. Materials and Methods
2.1. Participants
2.2. Quantitative Pain Assessments
2.3. Psychological and Clinical Pain Assessments
2.4. Image Acquisition
2.5. Diffusion MRI Data Analysis
2.6. Statistical Analysis
3. Results
3.1. Group Differences in the DTI Metrics
3.2. Association Between the Early DTI Metrics and Later Pain- and Psychological-Related Measures
3.3. Between Group Prediction Power Differences
4. Discussion
5. Conclusions
Supplementary Materials
Author Contributions
Funding
Institutional Review Board Statement
Informed Consent Statement
Data Availability Statement
Acknowledgments
Conflicts of Interest
Abbreviations
| DTI | Diffusion tensor imaging |
| mTBI | Mild traumatic brain injury |
| PTH | Post-traumatic headache |
| PPT | Pressure pain thresholds |
| CPM | Conditioned pain modulation |
| MRI | Magnetic resonance imaging |
| SWI | Susceptibility-weighted imaging |
| FA | Fractional anisotropy |
| MD | Mean diffusivity |
| RD | Radial diffusivity |
| AD | Axial diffusivity |
| MMSE | Mini Mental Status Examination |
| QST | Quantitative sensory tests |
| TS | Temporal summation |
| CPM | Conditioned pain modulation |
| HA | Headache intensity |
| MPQ | McGill Pain Questionnaire |
| PRI | Pain rating index |
| DVPRS | Defense and Veterans Pain Rating Scale |
| TBI-QOL | TBI Quality of Life |
| PTSD | Post-Traumatic Stress Disorder |
| PCS | Pain Catastrophizing Scale |
| CES-D | Center for Epidemiological Studies-Depression Scale |
| IRSPGR | Inversion recovery-prepared spoiled gradient-echo |
| GRE | Gradient-echo sequence |
| FSL | FMRIB Software Library |
| MNI | Montreal Neurological Institute |
| ROIs | Regions-of-interest |
| TBBS | Tract-based spatial statics |
| p | Significance level |
| JHU | Johns Hopkins University |
| mo | Month |
| PCL | Post-traumatic stress symptoms questionnaire |
| r | Correlation coefficient |
| R2 | Coefficient of determination for goodness of fit |
| pint | Significance level of the group interaction term |
| pmTBI | Significance level of the association between DTI and pain-related measures for the mTBI group |
| rmTBI | Correlation coefficient for the mTBI group |
| pcon | Significance level of the association between DTI and pain-related measures for the control group |
| rcon | Correlation coefficient for the control group |
| SLF | Superior longitudinal fasciculus |
References
- Nampiaparampil, D.E. Prevalence of chronic pain after traumatic brain injury: A systematic review. JAMA 2008, 300, 711–719. [Google Scholar] [CrossRef] [PubMed]
- Lucas, S.; Hoffman, J.M.; Bell, K.R.; Dikmen, S. A prospective study of prevalence and characterization of headache following mild traumatic brain injury. Cephalalgia 2014, 34, 93–102. [Google Scholar] [CrossRef] [PubMed]
- Hoffman, J.M.; Lucas, S.; Dikmen, S.; Temkin, N. Clinical perspectives on headache after traumatic brain injury. PMR 2020, 12, 967–974. [Google Scholar] [CrossRef]
- Zhang, Y.; Kong, Q.; Chen, J.; Li, L.; Wang, D.; Zhou, J. International Classification of Headache Disorders 3rd edition beta-based field testing of vestibular migraine in China: Demographic, clinical characteristics, audiometric findings and diagnosis statues. Cephalalgia 2016, 36, 240–248. [Google Scholar] [CrossRef]
- Channell, M.K.; Mueller, L.L.; Hahn, R. Management of chronic posttraumatic headache: A multidisciplinary approach. J. Osteopath. Med. 2009, 109, 509–513. [Google Scholar]
- Defrin, R. Chronic post-traumatic headache: Clinical findings and possible mechanisms. J. Man. Manip. Ther. 2014, 22, 36–43. [Google Scholar] [CrossRef]
- Rasmussen, B.K.; Olesen, J. Symptomatic and nonsymptomatic headaches in a general population. Neurology 1992, 42, 1225. [Google Scholar] [CrossRef]
- Ashina, H.; Iljazi, A.; Al-Khazali, H.M.; Ashina, S.; Jensen, R.H.; Amin, F.M.; Ashina, M.; Schytz, H.W. Persistent post-traumatic headache attributed to mild traumatic brain injury: Deep phenotyping and treatment patterns. Cephalalgia 2020, 40, 554–564. [Google Scholar] [CrossRef]
- Naugle, K.M.; Carey, C.; Evans, E.; Saxe, J.; Overman, R.; White, F.A. The role of deficient pain modulatory systems in the development of persistent post-traumatic headaches following mild traumatic brain injury: An exploratory longitudinal study. J. Headache Pain 2020, 21, 138. [Google Scholar] [CrossRef]
- Sahbaie, P.; Tajerian, M.; Yang, P.; Irvine, K.A.; Huang, T.-T.; Luo, J.; Wyss-Coray, T.; Clark, J.D. Nociceptive and cognitive changes in a murine model of polytrauma. J. Pain 2018, 19, 1392–1405. [Google Scholar] [CrossRef]
- Schwedt, T.J.; Chong, C.D.; Peplinski, J.; Ross, K.; Berisha, V. Persistent post-traumatic headache vs. migraine: An MRI study demonstrating differences in brain structure. J. Headache Pain. 2017, 18, 87. [Google Scholar] [CrossRef] [PubMed]
- Farkas, O.; Povlishock, J.T. Cellular and subcellular change evoked by diffuse traumatic brain injury: A complex web of change extending far beyond focal damage. Prog. Brain Res. 2007, 161, 43–59. [Google Scholar] [CrossRef] [PubMed]
- Büki, A.; Povlishock, J. All roads lead to disconnection?–Traumatic axonal injury revisited. Acta Neurochir. 2006, 148, 181–194. [Google Scholar] [CrossRef]
- Dikranian, K.; Cohen, R.; Mac Donald, C.; Pan, Y.; Brakefield, D.; Bayly, P.; Parsadanian, A. Mild traumatic brain injury to the infant mouse causes robust white matter axonal degeneration which precedes apoptotic death of cortical and thalamic neurons. Exp. Neurol. 2008, 211, 551–560. [Google Scholar] [CrossRef] [PubMed]
- Oppenheimer, D.R. Microscopic lesions in the brain following head injury. J. Neurol. Neurosurg. Psychiatry 1968, 31, 299. [Google Scholar] [CrossRef]
- Blumbergs, P.; Scott, G.; Manavis, J.; Wainwright, H.; Simpson, D.; McLean, A. Stalning af amyloid percursor protein to study axonal damage in mild head Injury. Lancet 1994, 344, 1055–1056. [Google Scholar] [CrossRef]
- Bigler, E.D. Neuropsychological results and neuropathological findings at autopsy in a case of mild traumatic brain injury. J. Int. Neuropsychol. Soc. 2004, 10, 794–806. [Google Scholar] [CrossRef]
- McKee, A.C.; Stein, T.D.; Nowinski, C.J.; Stern, R.A.; Daneshvar, D.H.; Alvarez, V.E.; Lee, H.-S.; Hall, G.; Wojtowicz, S.M.; Baugh, C.M. The spectrum of disease in chronic traumatic encephalopathy. Brain 2013, 136, 43–64. [Google Scholar] [CrossRef]
- Koerte, I.K.; Hufschmidt, J.; Muehlmann, M.; Lin, A.P.; Shenton, M.E. Advanced neuroimaging of mild traumatic brain injury. In Translational Research in Traumatic Brain Injury; CRC Press: Boca Raton, FL, USA, 2016. [Google Scholar]
- Ofoghi, Z.; Dewey, D.; Barlow, K.M. A systematic review of structural and functional imaging correlates of headache or pain after mild traumatic brain injury. J. Neurotrauma 2020, 37, 907–923. [Google Scholar] [CrossRef]
- Baliki, M.N.; Petre, B.; Torbey, S.; Herrmann, K.M.; Huang, L.; Schnitzer, T.J.; Fields, H.L.; Apkarian, A.V. Corticostriatal functional connectivity predicts transition to chronic back pain. Nat. Neurosci. 2012, 15, 1117–1119. [Google Scholar] [CrossRef]
- Vachon-Presseau, E.; Tétreault, P.; Petre, B.; Huang, L.; Berger, S.E.; Torbey, S.; Baria, A.T.; Mansour, A.R.; Hashmi, J.A.; Griffith, J.W. Corticolimbic anatomical characteristics predetermine risk for chronic pain. Brain 2016, 139, 1958–1970. [Google Scholar] [CrossRef] [PubMed]
- Hashmi, J.A.; Baliki, M.N.; Huang, L.; Baria, A.T.; Torbey, S.; Hermann, K.M.; Schnitzer, T.J.; Apkarian, A.V. Shape shifting pain: Chronification of back pain shifts brain representation from nociceptive to emotional circuits. Brain 2013, 136, 2751–2768. [Google Scholar] [CrossRef] [PubMed]
- Yu, R.; Gollub, R.L.; Spaeth, R.; Napadow, V.; Wasan, A.; Kong, J. Disrupted functional connectivity of the periaqueductal gray in chronic low back pain. NeuroImage Clin. 2014, 6, 100–108. [Google Scholar] [CrossRef] [PubMed]
- Georgopoulos, V.; Akin-Akinyosoye, K.; Zhang, W.; McWilliams, D.F.; Hendrick, P.; Walsh, D.A. Quantitative sensory testing and predicting outcomes for musculoskeletal pain, disability, and negative affect: A systematic review and meta-analysis. Pain 2019, 160, 1920–1932. [Google Scholar] [CrossRef]
- Amyot, F.; Arciniegas, D.B.; Brazaitis, M.P.; Curley, K.C.; Diaz-Arrastia, R.; Gandjbakhche, A.; Herscovitch, P.; Hinds, S.R.; Manley, G.T.; Pacifico, A. A review of the effectiveness of neuroimaging modalities for the detection of traumatic brain injury. J. Neurotrauma 2015, 32, 1693–1721. [Google Scholar] [CrossRef]
- Haller, S.; Haacke, E.M.; Thurnher, M.M.; Barkhof, F. Susceptibility-weighted imaging: Technical essentials and clinical neurologic applications. Radiology 2021, 299, 3–26. [Google Scholar] [CrossRef]
- Stephens, J.A.; Liu, P.; Lu, H.; Suskauer, S.J. Cerebral blood flow after mild traumatic brain injury: Associations between symptoms and post-injury perfusion. J. Neurotrauma 2018, 35, 241–248. [Google Scholar] [CrossRef]
- Wang, Y.; Bartels, H.M.; Nelson, L.D. A systematic review of ASL perfusion MRI in mild TBI. Neuropsychol. Rev. 2023, 33, 160–191. [Google Scholar] [CrossRef]
- Li, F.; Zhang, D.; Ren, J.; Xing, C.; Hu, L.; Miao, Z.; Lu, L.; Wu, X. Connectivity of the insular subdivisions differentiates posttraumatic headache-associated from nonheadache-associated mild traumatic brain injury: An arterial spin labelling study. J. Headache Pain 2024, 25, 103. [Google Scholar] [CrossRef]
- Fan, F.; Beare, R.; Takagi, M.; Anderson, N.; Bressan, S.; Clarke, C.J.; Davis, G.A.; Dunne, K.; Fabiano, F.; Hearps, S.J.C.; et al. Cerebral blood flow in children with persisting postconcussive symptoms and posttraumatic headache at 2 weeks postconcussion. J. Neurosurg. Pediatr. 2023, 32, 1–8. [Google Scholar] [CrossRef]
- Belanger, H.G.; Vanderploeg, R.D.; Curtiss, G.; Warden, D.L. Recent neuroimaging techniques in mild traumatic brain injury. J. Neuropsychiatry Clin. Neurosci. 2007, 19, 5–20. [Google Scholar] [CrossRef]
- Bigler, E.D.; Bazarian, J.J. Diffusion tensor imaging: A biomarker for mild traumatic brain injury? Neurology 2010, 74, 626–627. [Google Scholar] [CrossRef]
- Lipton, M.L.; Kim, N.; Park, Y.K.; Hulkower, M.B.; Gardin, T.M.; Shifteh, K.; Kim, M.; Zimmerman, M.E.; Lipton, R.B.; Branch, C.A. Robust detection of traumatic axonal injury in individual mild traumatic brain injury patients: Intersubject variation, change over time and bidirectional changes in anisotropy. Brain Imaging Behav. 2012, 6, 329–342. [Google Scholar] [CrossRef] [PubMed]
- Gardner, A.; Kay-Lambkin, F.; Stanwell, P.; Donnelly, J.; Williams, W.H.; Hiles, A.; Schofield, P.; Levi, C.; Jones, D.K. A systematic review of diffusion tensor imaging findings in sports-related concussion. J. Neurotrauma 2012, 29, 2521–2538. [Google Scholar] [CrossRef]
- Eierud, C.; Craddock, R.C.; Fletcher, S.; Aulakh, M.; King-Casas, B.; Kuehl, D.; LaConte, S.M. Neuroimaging after mild traumatic brain injury: Review and meta-analysis. NeuroImage Clin. 2014, 4, 283–294. [Google Scholar] [CrossRef] [PubMed]
- Dodd, A.B.; Epstein, K.; Ling, J.M.; Mayer, A.R. Diffusion tensor imaging findings in semi-acute mild traumatic brain injury. J. Neurotrauma 2014, 31, 1235–1248. [Google Scholar] [CrossRef] [PubMed]
- Yuh, E.L.; Cooper, S.R.; Mukherjee, P.; Yue, J.K.; Lingsma, H.F.; Gordon, W.A.; Valadka, A.B.; Okonkwo, D.O.; Schnyer, D.M.; Vassar, M.J. Diffusion tensor imaging for outcome prediction in mild traumatic brain injury: A TRACK-TBI study. J. Neurotrauma 2014, 31, 1457–1477. [Google Scholar] [CrossRef]
- Leung, A.; Yang, E.; Lim, M.; Metzger-Smith, V.; Theilmann, R.; Song, D.; Lin, L.; Tsai, A.; Lee, R. Pain-related white matter tract abnormalities in mild traumatic brain injury patients with persistent headache. Mol. Pain. 2018, 14, 1744806918810297. [Google Scholar] [CrossRef]
- Farmer, M.A.; Huang, L.; Martucci, K.; Yang, C.C.; Maravilla, K.R.; Harris, R.E.; Clauw, D.J.; Mackey, S.; Ellingson, B.M.; Mayer, E.A. Brain white matter abnormalities in female interstitial cystitis/bladder pain syndrome: A MAPP network neuroimaging study. J. Urol. 2015, 194, 118–126. [Google Scholar] [CrossRef]
- Huang, L.; Kutch, J.J.; Ellingson, B.M.; Martucci, K.T.; Harris, R.E.; Clauw, D.J.; Mackey, S.; Mayer, E.A.; Schaeffer, A.J.; Apkarian, A.V. Brain white matter changes associated with urological chronic pelvic pain syndrome: Multisite neuroimaging from a MAPP case–control study. Pain 2016, 157, 2782–2791. [Google Scholar] [CrossRef]
- Messé, A.; Caplain, S.; Paradot, G.; Garrigue, D.; Mineo, J.F.; Soto Ares, G.; Ducreux, D.; Vignaud, F.; Rozec, G.; Desal, H. Diffusion tensor imaging and white matter lesions at the subacute stage in mild traumatic brain injury with persistent neurobehavioral impairment. Hum. Brain Mapp. 2011, 32, 999–1011. [Google Scholar] [CrossRef]
- Kraus, M.F.; Susmaras, T.; Caughlin, B.P.; Walker, C.J.; Sweeney, J.A.; Little, D.M. White matter integrity and cognition in chronic traumatic brain injury: A diffusion tensor imaging study. Brain 2007, 130, 2508–2519. [Google Scholar] [CrossRef]
- Wu, Y.-C.; Harezlak, J.; Elsaid, N.M.; Lin, Z.; Wen, Q.; Mustafi, S.M.; Riggen, L.D.; Koch, K.M.; Nencka, A.S.; Meier, T.B. Longitudinal white-matter abnormalities in sports-related concussion: A diffusion MRI study. Neurology 2020, 95, e781–e792. [Google Scholar] [CrossRef]
- Liu, J.; Mu, J.; Chen, T.; Zhang, M.; Tian, J. White matter tract microstructure of the mPFC-amygdala predicts interindividual differences in placebo response related to treatment in migraine patients. Hum. Brain Mapp. 2019, 40, 284–292. [Google Scholar] [CrossRef] [PubMed]
- Petrušić, I.; Daković, M.; Kačar, K.; Mićić, O.; Zidverc-Trajković, J. Migraine with aura and white matter tract changes. Acta Neurol. Belg. 2018, 118, 485–491. [Google Scholar] [CrossRef] [PubMed]
- Chong, C.D.; Peplinski, J.; Berisha, V.; Ross, K.; Schwedt, T.J. Differences in fibertract profiles between patients with migraine and those with persistent post-traumatic headache. Cephalalgia 2019, 39, 1121–1133. [Google Scholar] [CrossRef] [PubMed]
- Alhilali, L.; Delic, J.; Fakhran, S. Differences in callosal and forniceal diffusion between patients with and without postconcussive migraine. Am. J. Neuroradiol. 2017, 38, 691–695. [Google Scholar] [CrossRef]
- Ghodadra, A.; Alhilali, L.; Fakhran, S. Principal component analysis of diffusion tensor images to determine white matter injury patterns underlying postconcussive headache. Am. J. Neuroradiol. 2016, 37, 274–278. [Google Scholar] [CrossRef]
- Branco, P.; Bosak, N.; Bielefeld, J.; Cong, O.; Granovsky, Y.; Kahn, I.; Yarnitsky, D.; Apkarian, A.V. Structural brain connectivity predicts early acute pain after mild traumatic brain injury. Pain 2023, 164, 1312–1320. [Google Scholar] [CrossRef]
- Mtbi, C. Methodological issues and research recommendations for mild traumatic brain injury: The WHO Collaborating Centre Task Force on Mild Traumatic Brain Injury. J. Rehabil. Med. 2004, 43 (Suppl. S43), 113–125. [Google Scholar] [CrossRef]
- Naugle, K.M.; Nguyen, T.; Smith, J.A.; Saxe, J.; White, F.A. Racial differences in head pain and other pain-related outcomes after mild traumatic brain injury. J. Neurotrauma 2023, 40, 1671–1683. [Google Scholar] [CrossRef]
- Woolf, C.J. Central sensitization: Implications for the diagnosis and treatment of pain. Pain 2011, 152, S2–S15. [Google Scholar] [CrossRef]
- Filatova, E.; Latysheva, N.; Kurenkov, A. Evidence of persistent central sensitization in chronic headaches: A multi-method study. J. Headache Pain 2008, 9, 295–300. [Google Scholar] [CrossRef] [PubMed]
- Yarnitsky, D. Conditioned pain modulation (the diffuse noxious inhibitory control-like effect): Its relevance for acute and chronic pain states. Curr. Opin. Anesthesiol. 2010, 23, 611–615. [Google Scholar] [CrossRef]
- Yarnitsky, D.; Bouhassira, D.; Drewes, A.; Fillingim, R.; Granot, M.; Hansson, P.; Landau, R.; Marchand, S.; Matre, D.; Nilsen, K. Recommendations on practice of conditioned pain modulation (CPM) testing. Eur. J. Pain 2015, 19, 805–806. [Google Scholar] [CrossRef]
- Melzack, R. The McGill Pain Questionnaire: Major properties and scoring methods. Pain 1975, 1, 277–299. [Google Scholar] [CrossRef] [PubMed]
- Cook, K.F.; Kallen, M.A.; Buckenmaier III, C.; Flynn, D.M.; Hanling, S.R.; Collins, T.S.; Joltes, K.; Kwon, K.; Medina-Torne, S.; Nahavandi, P. Evaluation of the validity and response burden of patient self-report measures of the Pain Assessment Screening Tool and Outcomes Registry (PASTOR). Mil. Med. 2017, 182, e1851–e1861. [Google Scholar] [CrossRef] [PubMed]
- Tulsky, D.S.; Kisala, P.A.; Victorson, D.; Carlozzi, N.; Bushnik, T.; Sherer, M.; Choi, S.W.; Heinemann, A.W.; Chiaravalloti, N.; Sander, A.M. TBI-QOL: Development and calibration of item banks to measure patient reported outcomes following traumatic brain injury. J. Head Trauma Rehabil. 2016, 31, 40–51. [Google Scholar] [CrossRef]
- Weathers, F.W.; Litz, B.T.; Keane, T.M.; Herman, D.S.; Steinberg, H.R.; Huska, J.A.; Kraemer, H.C. The utility of the SCL-90-R for the diagnosis of war-zone related posttraumatic stress disorder. J. Trauma. Stress 1996, 9, 111–128. [Google Scholar]
- Sullivan, M.J.; Bishop, S.R.; Pivik, J. The pain catastrophizing scale: Development and validation. Psychol. Assess. 1995, 7, 524. [Google Scholar] [CrossRef]
- Eaton, W.W.; Muntaner, C.; Smith, C.; Tien, A.; Ybarra, M. Center for epidemiologic studies depression scale: Review and revision. In The Use of Psychological Testing for Treatment Planning and Outcomes Assessment; Maruish, M., Ed.; Lawrence Erlbaum: Mahwah, NJ, USA, 2004; pp. 363–377. [Google Scholar]
- Veraart, J.; Novikov, D.S.; Christiaens, D.; Ades-Aron, B.; Sijbers, J.; Fieremans, E. Denoising of diffusion MRI using random matrix theory. Neuroimage 2016, 142, 394–406. [Google Scholar] [CrossRef] [PubMed]
- Kellner, E.; Dhital, B.; Kiselev, V.G.; Reisert, M. Gibbs-ringing artifact removal based on local subvoxel-shifts. Magn. Reson. Med. 2016, 76, 1574–1581. [Google Scholar] [CrossRef]
- Jenkinson, M.; Beckmann, C.F.; Behrens, T.E.; Woolrich, M.W.; Smith, S.M. Fsl. Neuroimage 2012, 62, 782–790. [Google Scholar] [CrossRef]
- Tournier, J.-D.; Smith, R.; Raffelt, D.; Tabbara, R.; Dhollander, T.; Pietsch, M.; Christiaens, D.; Jeurissen, B.; Yeh, C.-H.; Connelly, A. MRtrix3: A fast, flexible and open software framework for medical image processing and visualisation. Neuroimage 2019, 202, 116137. [Google Scholar] [CrossRef] [PubMed]
- Avants, B.B.; Tustison, N.; Song, G. Advanced normalization tools (ANTS). Insight J. 2009, 2, 1–35. [Google Scholar] [CrossRef]
- Smith, S.M.; Jenkinson, M.; Johansen-Berg, H.; Rueckert, D.; Nichols, T.E.; Mackay, C.E.; Watkins, K.E.; Ciccarelli, O.; Cader, M.Z.; Matthews, P.M. Tract-based spatial statistics: Voxelwise analysis of multi-subject diffusion data. Neuroimage 2006, 31, 1487–1505. [Google Scholar] [CrossRef]
- Gomez-Beldarrain, M.; Oroz, I.; Zapirain, B.G.; Ruanova, B.F.; Fernandez, Y.G.; Cabrera, A.; Anton-Ladislao, A.; Aguirre-Larracoechea, U.; Garcıa-Monco, J.C. Right fronto-insular white matter tracts link cognitive reserve and pain in migraine patients. J. Headache Pain 2016, 17, 1–12. [Google Scholar] [CrossRef]
- Althouse, A.D. Adjust for multiple comparisons? It’s not that simple. Ann. Thorac. Surg. 2016, 101, 1644–1645. [Google Scholar] [CrossRef]
- Navas-Sánchez, F.J.; Alemán-Gómez, Y.; Sánchez-Gonzalez, J.; Guzmán-De-Villoria, J.A.; Franco, C.; Robles, O.; Arango, C.; Desco, M. White matter microstructure correlates of mathematical giftedness and intelligence quotient. Hum. Brain Mapp. 2014, 35, 2619–2631. [Google Scholar] [CrossRef]
- Weber, B.; Koschutnig, K.; Schwerdtfeger, A.; Rominger, C.; Papousek, I.; Weiss, E.M.; Tilp, M.; Fink, A. Learning unicycling evokes manifold changes in gray and white matter networks related to motor and cognitive functions. Sci. Rep. 2019, 9, 4324. [Google Scholar] [CrossRef]
- Kang, X.; Coetzee, J.P.; Main, K.L.; Seenivasan, S.; Zhu, K.; Adamson, M.M. Fiber tract integrity in patients with brain injury and chronic health symptoms. Neuroimage Rep. 2021, 1, 100047. [Google Scholar] [CrossRef]
- Segerdahl, A.R.; Mezue, M.; Okell, T.W.; Farrar, J.T.; Tracey, I. The dorsal posterior insula subserves a fundamental role in human pain. Nat. Neurosci. 2015, 18, 499–500. [Google Scholar] [CrossRef]
- Jensen, K.B.; Regenbogen, C.; Ohse, M.C.; Frasnelli, J.; Freiherr, J.; Lundström, J.N. Brain activations during pain: A neuroimaging meta-analysis of patients with pain and healthy controls. Pain 2016, 157, 1279–1286. [Google Scholar] [CrossRef]
- Lenroot, R.K.; Giedd, J.N. Brain development in children and adolescents: Insights from anatomical magnetic resonance imaging. Neurosci. Biobehav. Rev. 2006, 30, 718–729. [Google Scholar] [CrossRef] [PubMed]
- Hikosaka, O.; Takikawa, Y.; Kawagoe, R. Role of the basal ganglia in the control of purposive saccadic eye movements. Physiol. Rev. 2000, 80, 953–978. [Google Scholar] [CrossRef] [PubMed]
- Haber, S.N. The primate basal ganglia: Parallel and integrative networks. J. Chem. Neuroanat. 2003, 26, 317–330. [Google Scholar] [CrossRef]
- Hollerman, J.R.; Tremblay, L.; Schultz, W. Influence of reward expectation on behavior-related neuronal activity in primate striatum. J. Neurophysiol. 1998, 80, 947–963. [Google Scholar] [CrossRef]
- Hollerman, J.R.; Tremblay, L.; Schultz, W. Involvement of basal ganglia and orbitofrontal cortex in goal-directed behavior. Prog. Brain Res. 2000, 126, 193–215. [Google Scholar] [CrossRef]
- Knudson, D.V.; Lindsey, C. Type I and Type II errors in correlations of various sample sizes. Compr. Psychol. 2014, 3, 3. [Google Scholar] [CrossRef]
- Zhang, H.; Schneider, T.; Wheeler-Kingshott, C.A.; Alexander, D.C. NODDI: Practical in vivo neurite orientation dispersion and density imaging of the human brain. NeuroImage 2012, 61, 1000–1016. [Google Scholar] [CrossRef]
- Benitez, A.; Jensen, J.H.; Falangola, M.F.; Nietert, P.J.; Helpern, J.A. Modeling white matter tract integrity in aging with diffusional kurtosis imaging. Neurobiol. Aging 2018, 70, 265–275. [Google Scholar] [CrossRef] [PubMed]


| Time Point | mTBI | Control | p-Value | |
|---|---|---|---|---|
| Demographics | ||||
| Sample size (n) | 12 | 10 | N/A | |
| Age (year) | 34.00 (8.09) | 31.30 (8.38) | 0.45 | |
| Sex (male:female) | 9:3 | 5:5 | 0.44 * | |
| Quantitative sensory tests (QST) | ||||
| TS | 1 mo | 12.13 (17.66) | 15.25 (16.97) | 0.68 |
| 6 mo | 9.8 (18.48) | 12.22 (5.42) | 0.71 | |
| PPT | 1 mo | 293.95 (149.38) | 344.61 (115.00) | 0.39 |
| 6 mo | 333.82 (182.03) | 411.80 (115.37) | 0.29 | |
| CPM | 1 mo | 13.27 (18.17) | 23.02 (18.90) | 0.23 |
| 6 mo | 49.39 (91.00) | 21.26 (17.45) | 0.40 | |
| Psychological measures | ||||
| PCS | 1 mo | 13.17 (11.33) | 13.20 (11.55) | 0.99 |
| 6 mo | 14.60 (10.32) | 23.11 (17.59) | 0.21 | |
| PCL | 1 mo | 23.08 (18.74) | 8.10 (6.06) | 0.03 |
| 6 mo | 24.00 (22.42) | 9.00 (9.25) | 0.08 | |
| CES-D | 1 mo | 18.42 (13.10) | 8.30 (8.21) | 0.04 |
| 6 mo | 16.90 (13.39) | 8.56 (8.32) | 0.13 | |
| Clinical measures | ||||
| HA | 1 mo | 6.00 (2.68) | 0.70 (2.21) | 0.0001 |
| 6 mo | 5.11 (3.69) | 0.78 (2.33) | 0.01 | |
| MPQ | 1 mo | 10.25 (6.05) | 0.10 (0.32) | 0.0001 |
| 6 mo | 7.60 (5.50) | 1.22 (3.67) | 0.01 | |
| TBI-QOL | 1 mo | 22.33 (5.65) | 1.00 (3.16) | 0.00001 |
| 6 mo | 23.30 (13.05) | 2.33 (4.64) | 0.001 | |
| DVRS pain rating at MRI scan | 1 mo | 3.17 (2.33) | 0.00 (0.00) | 0.001 |
| DTI Metrics | p | r | R2 | |
|---|---|---|---|---|
| Quantitative sensory tests (QST) | ||||
| Right sagittal stratum | ||||
| TS | FA | 0.01 | −0.60 | 0.80 |
| Left anterior thalamic radiation | ||||
| PPT | AD | 0.04 | 0.23 | 0.87 |
| Left corticospinal tract | ||||
| PPT | AD | 0.01 | 0.35 | 0.94 |
| Left insula | ||||
| PPT | AD | 0.02 | 0.13 | 0.90 |
| Left superior longitudinal fasciculus | ||||
| CPM | FA | 0.02 | 0.83 | 0.84 |
| Psychological measures | ||||
| Right sagittal stratum | ||||
| PCL | FA | 0.02 | −0.60 | 0.75 |
| PCL | RD | 0.04 | 0.66 | 0.67 |
| CES-D | FA | 0.03 | −0.61 | 0.75 |
| CES-D | RD | 0.03 | 0.69 | 0.74 |
| Left insular | ||||
| PCS | MD | 0.03 | 0.68 | 0.70 |
| Left Corticospinal tract | ||||
| PCS | AD | 0.04 | 0.69 | 0.64 |
| Left superior longitudinal fasciculus | ||||
| PCL | MD | 0.03 | 0.73 | 0.71 |
| PCL | RD | 0.03 | 0.77 | 0.71 |
| CES-D | MD | 0.03 | 0.85 | 0.73 |
| CES-D | RD | 0.04 | 0.78 | 0.72 |
| Clinical measures | ||||
| Left Corticospinal tract | ||||
| MPQ | RD | 0.01 | 0.67 | 0.84 |
| Model 3 | mTBI (post hoc) | Control (post hoc) | |||||
|---|---|---|---|---|---|---|---|
| DTI Metrics | pint | R2 | pmTBI | rmTBI | pcon | rcon | |
| Quantitative sensory tests (QST) | |||||||
| Left insula | |||||||
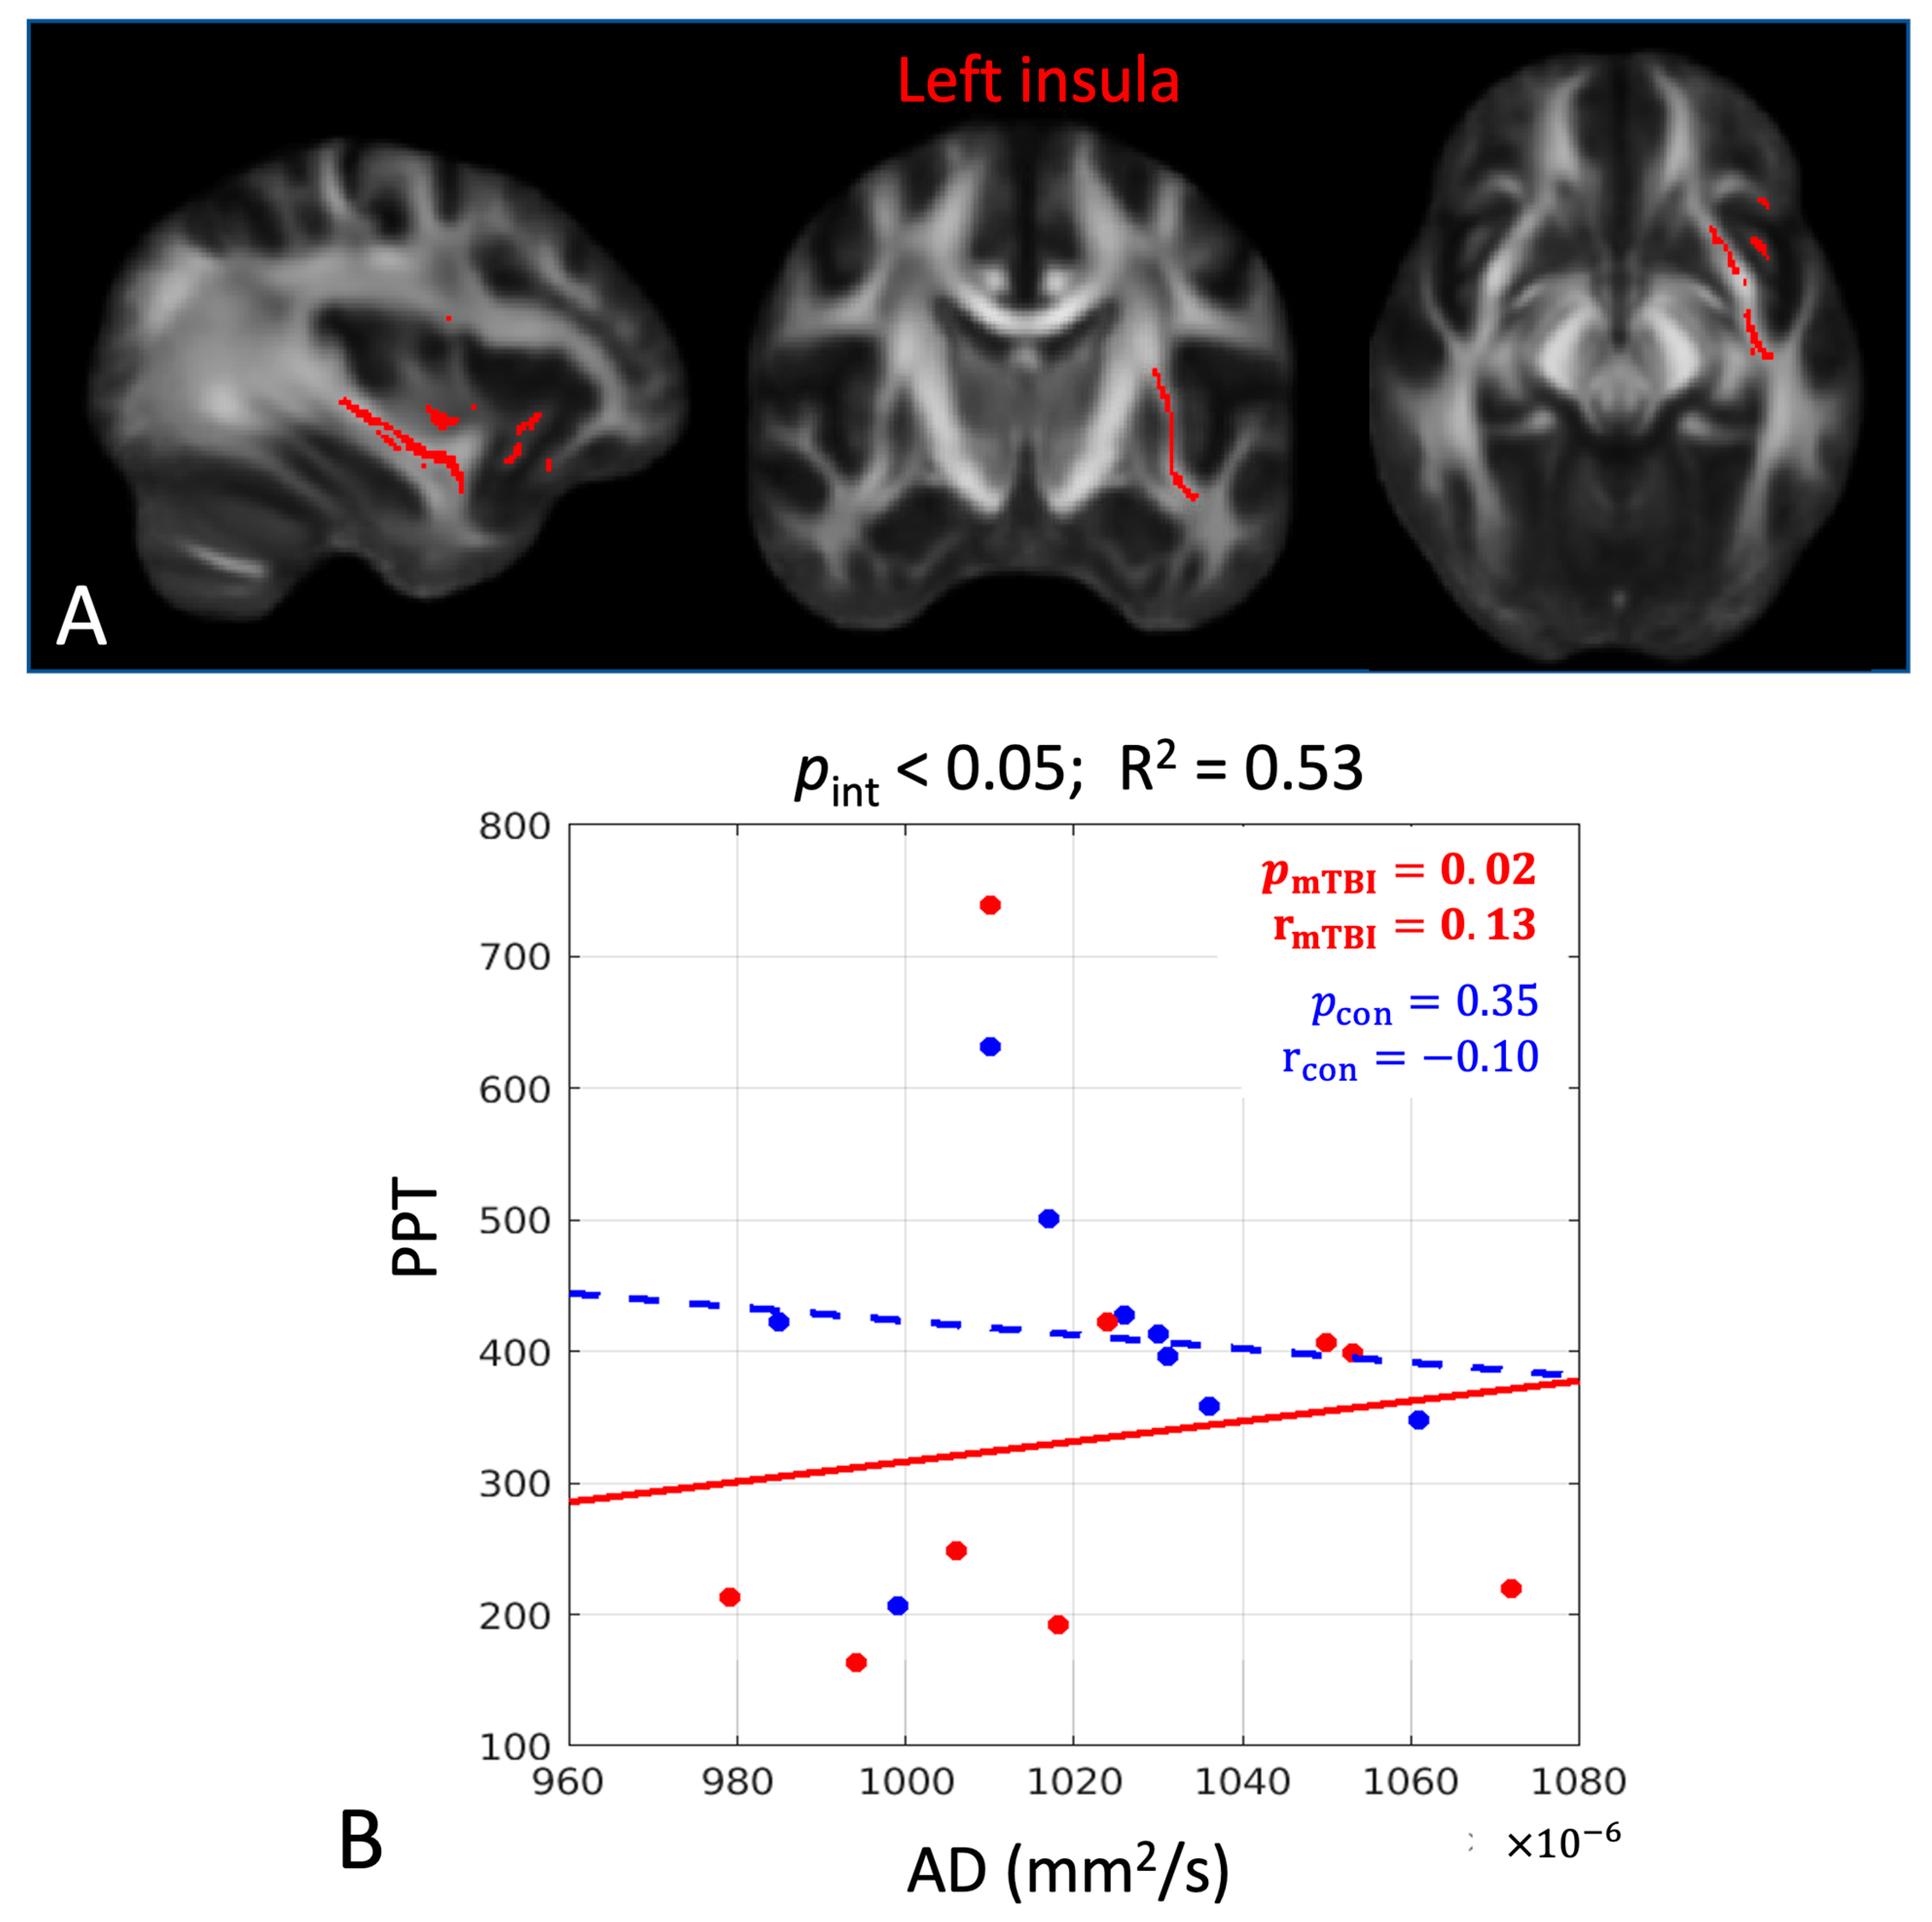
| PPT | AD | 0.04 | 0.53 | 0.02 | 0.13 | 0.35 | −0.10 |
| Psychological measures | |||||||
| Right sagittal stratum | |||||||
| PCL | FA | 0.00 * | 0.53 | 0.02 | −0.60 | 0.8 | −0.04 |
| PCL | RD | 0.01 | 0.55 | 0.04 | 0.66 | 0.65 | −0.04 |
| CES-D | FA | 0.01 | 0.48 | 0.03 | −0.61 | 0.19 | 0.14 |
| CES-D | RD | 0.01 | 0.54 | 0.03 | 0.69 | 0.18 | −0.15 |
| Left superior longitudinal fasciculus | |||||||
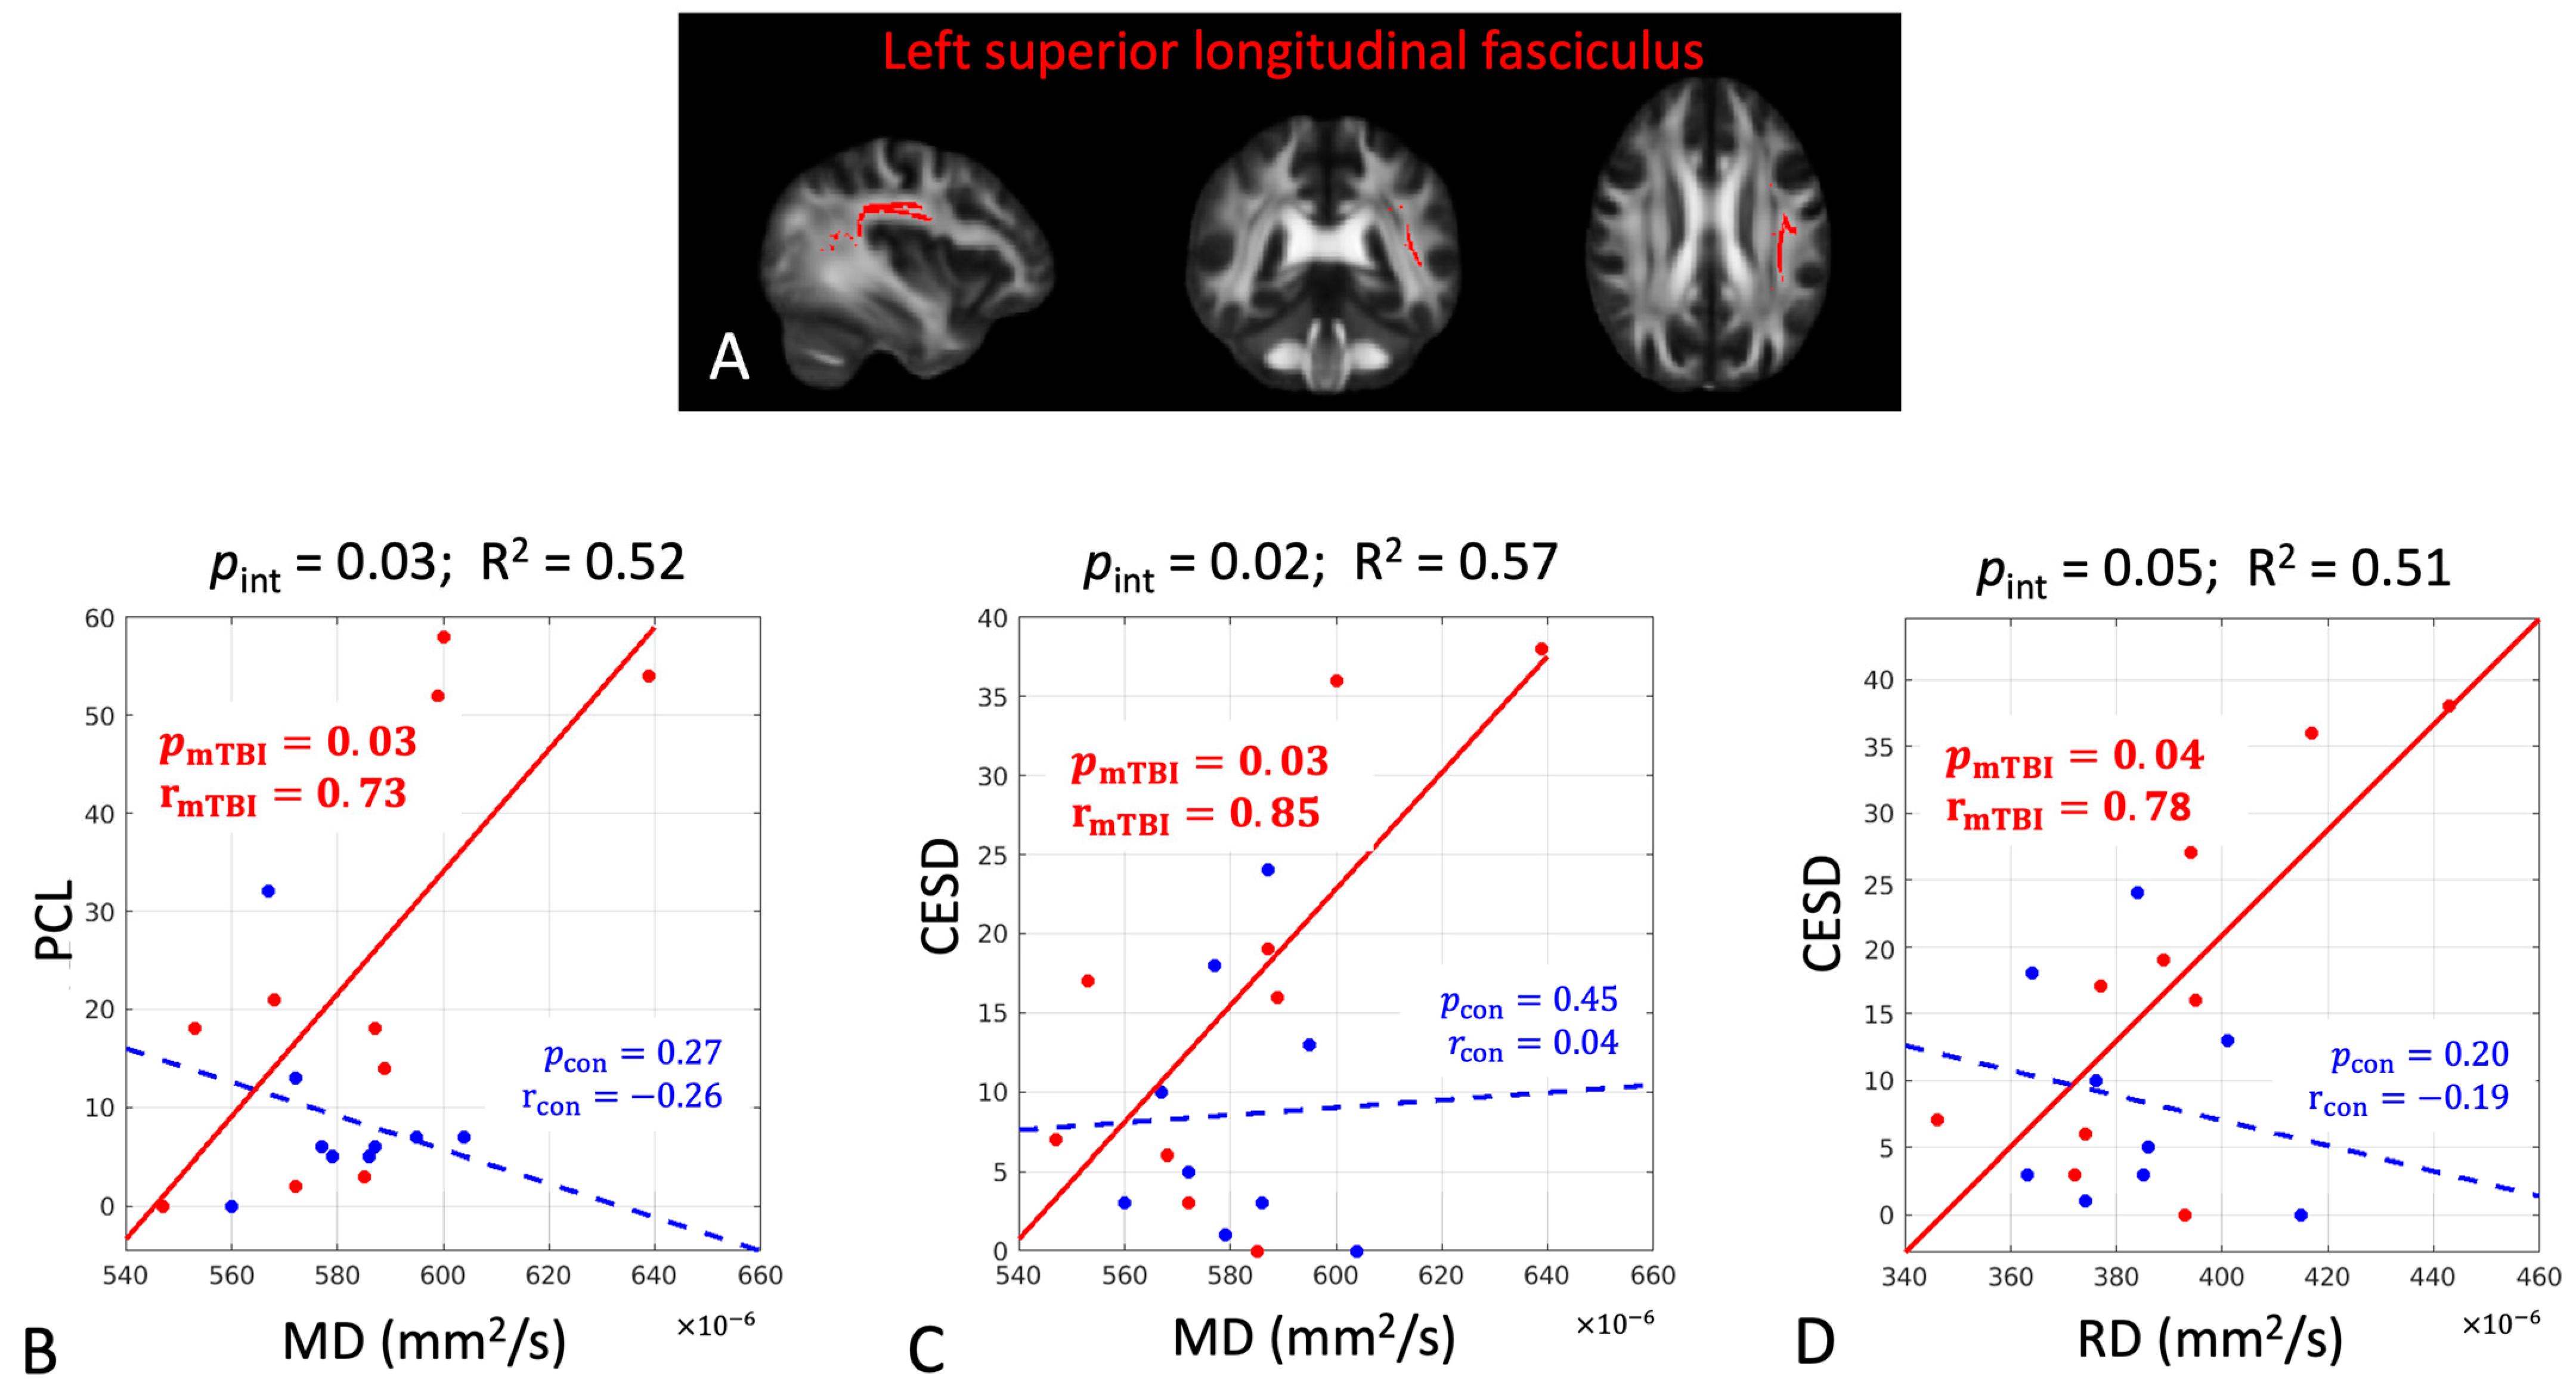
| PCL | MD | 0.03 | 0.52 | 0.03 | 0.73 | 0.27 | −0.26 |
| CES-D | MD | 0.02 | 0.57 | 0.03 | 0.85 | 0.45 | 0.04 |
| CES-D | RD | 0.05 | 0.51 | 0.04 | 0.78 | 0.20 | −0.19 |
Disclaimer/Publisher’s Note: The statements, opinions and data contained in all publications are solely those of the individual author(s) and contributor(s) and not of MDPI and/or the editor(s). MDPI and/or the editor(s) disclaim responsibility for any injury to people or property resulting from any ideas, methods, instructions or products referred to in the content. |
© 2025 by the authors. Licensee MDPI, Basel, Switzerland. This article is an open access article distributed under the terms and conditions of the Creative Commons Attribution (CC BY) license (https://creativecommons.org/licenses/by/4.0/).
Share and Cite
Yang, H.-C.; Nguyen, T.; White, F.A.; Naugle, K.M.; Wu, Y.-C. Pain-Related White-Matter Changes Following Mild Traumatic Brain Injury: A Longitudinal Diffusion Tensor Imaging Pilot Study. Diagnostics 2025, 15, 642. https://doi.org/10.3390/diagnostics15050642
Yang H-C, Nguyen T, White FA, Naugle KM, Wu Y-C. Pain-Related White-Matter Changes Following Mild Traumatic Brain Injury: A Longitudinal Diffusion Tensor Imaging Pilot Study. Diagnostics. 2025; 15(5):642. https://doi.org/10.3390/diagnostics15050642
Chicago/Turabian StyleYang, Ho-Ching, Tyler Nguyen, Fletcher A. White, Kelly M. Naugle, and Yu-Chien Wu. 2025. "Pain-Related White-Matter Changes Following Mild Traumatic Brain Injury: A Longitudinal Diffusion Tensor Imaging Pilot Study" Diagnostics 15, no. 5: 642. https://doi.org/10.3390/diagnostics15050642
APA StyleYang, H.-C., Nguyen, T., White, F. A., Naugle, K. M., & Wu, Y.-C. (2025). Pain-Related White-Matter Changes Following Mild Traumatic Brain Injury: A Longitudinal Diffusion Tensor Imaging Pilot Study. Diagnostics, 15(5), 642. https://doi.org/10.3390/diagnostics15050642