
The Association of Statin Therapy with Liver and Pancreatic Fat Fraction in Type 2 Diabetes Mellitus

 , , , , , and
Abstract
1. Introduction
2. Materials and Methods
2.1. Study Population
2.2. Laboratory Measurements
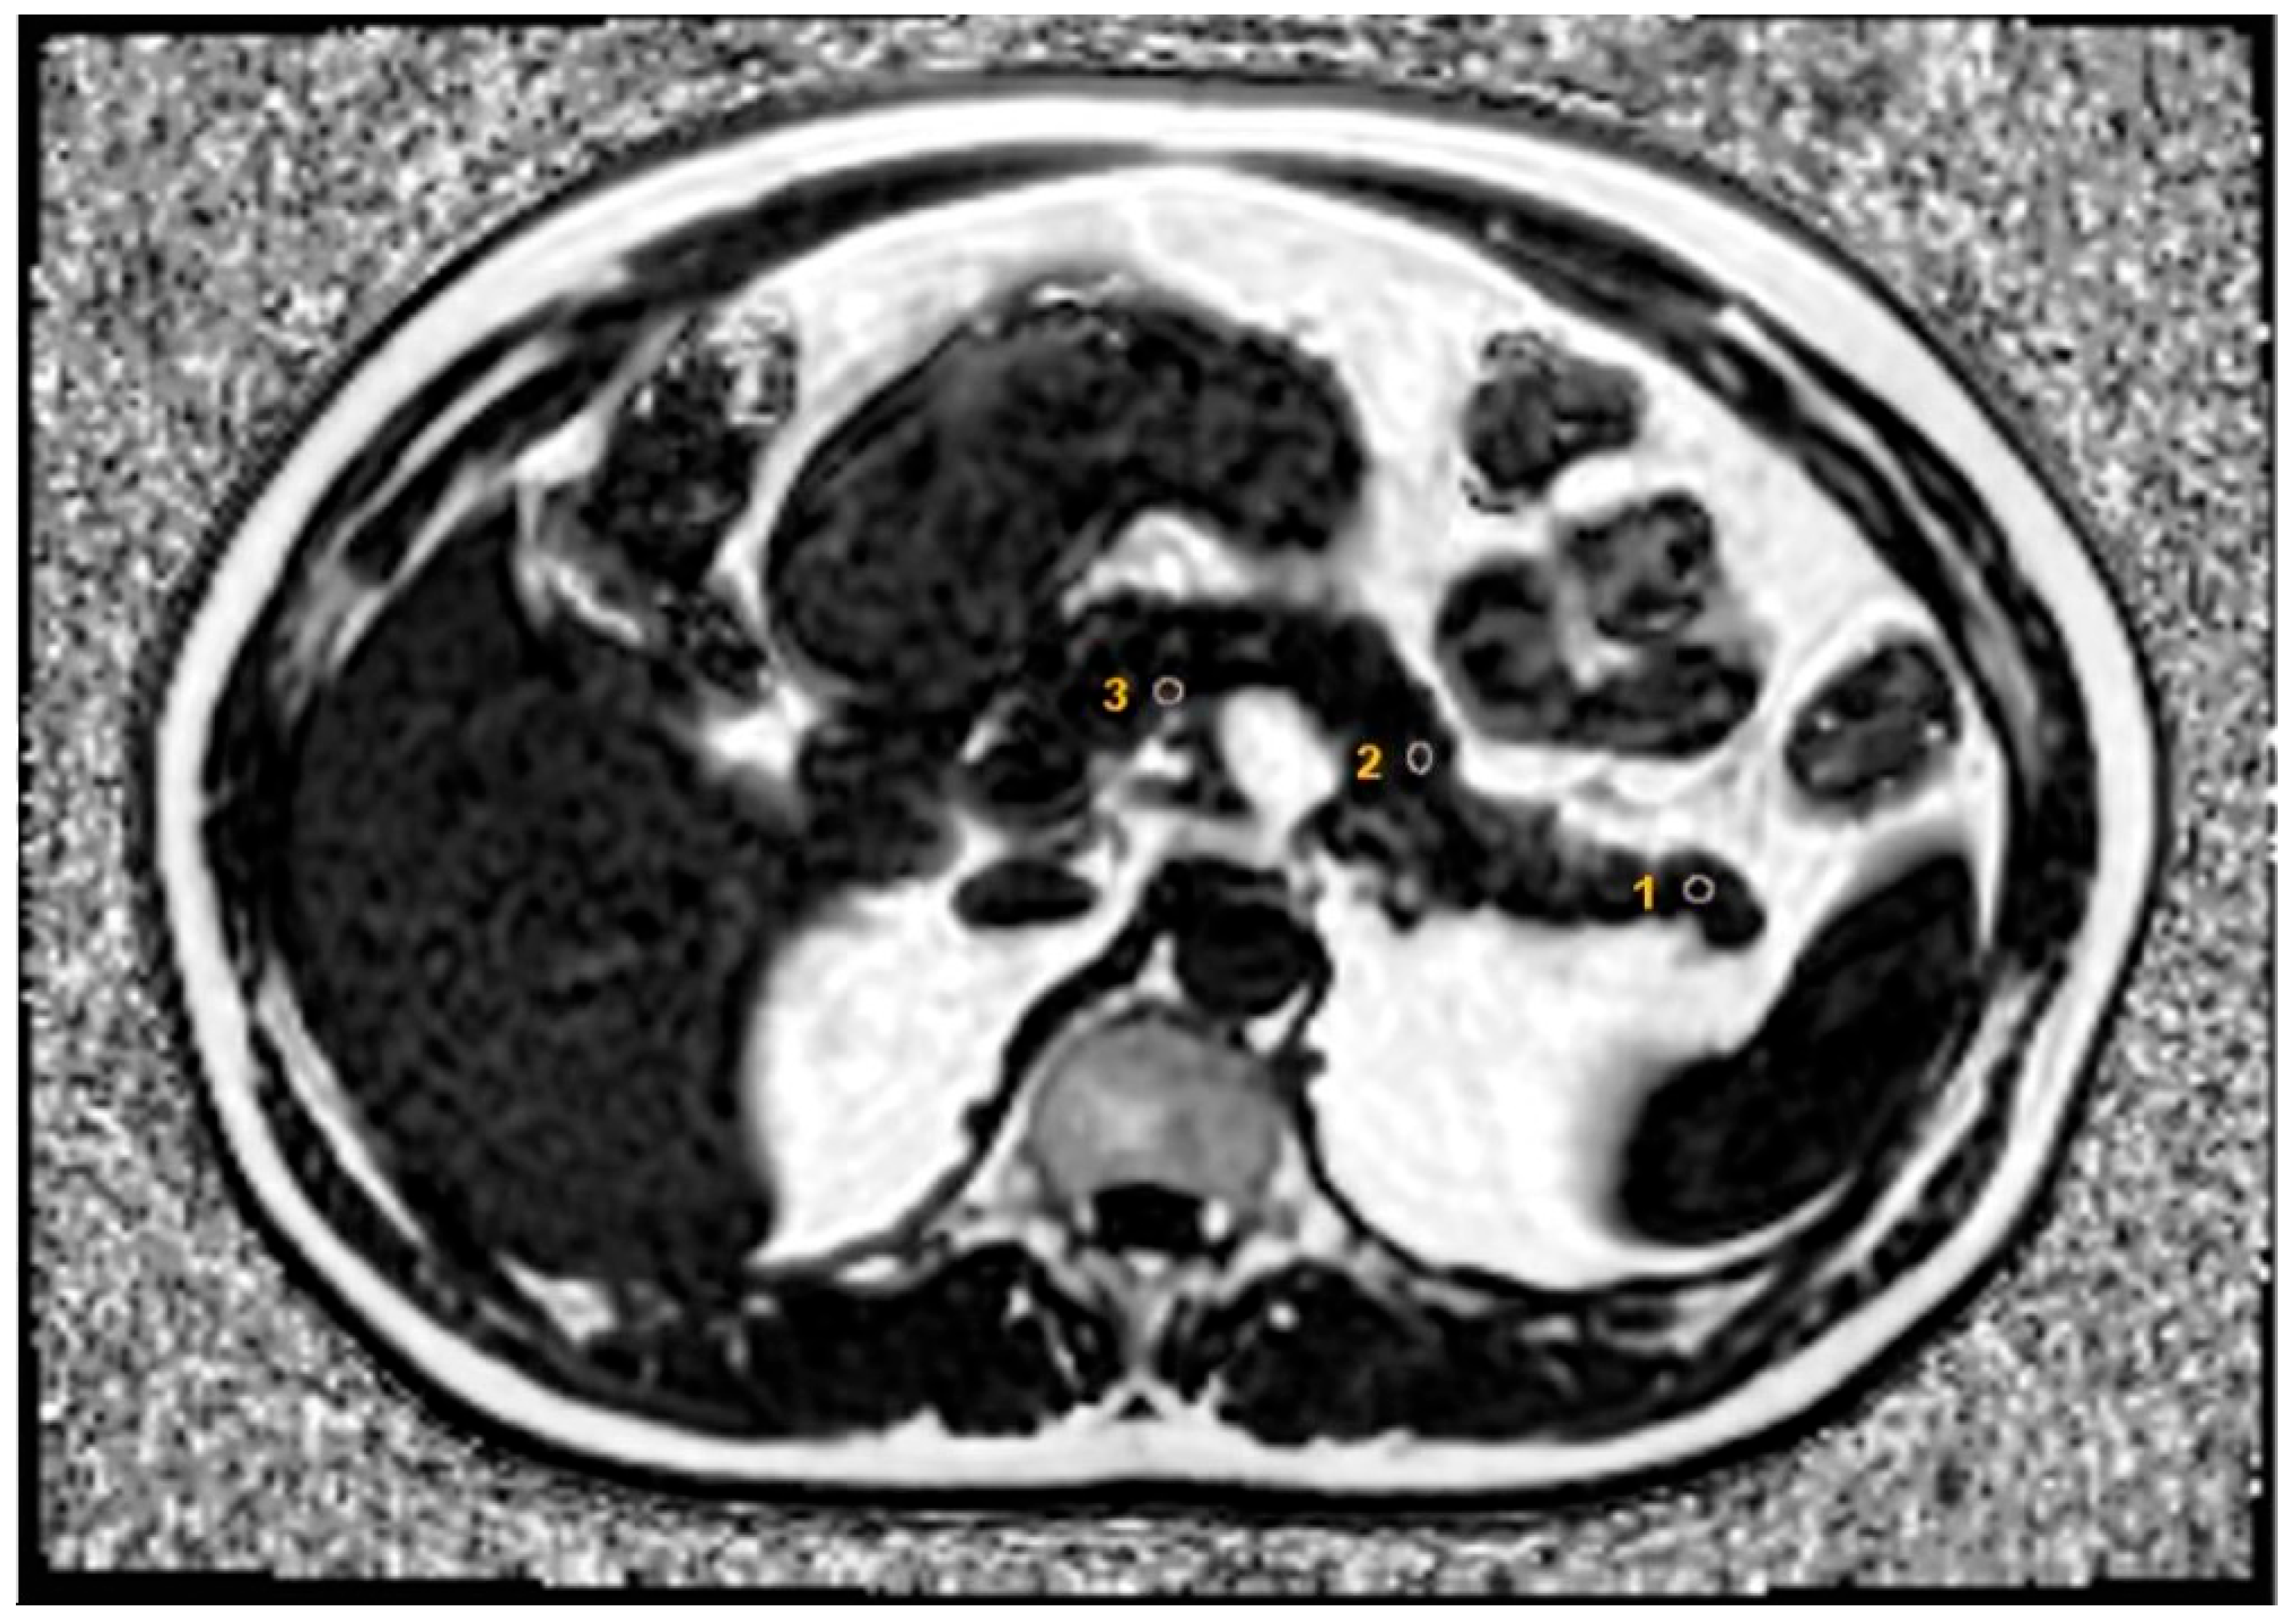
2.3. MRI Measurements
2.4. Hepatobiliary USG
2.5. Statistical Analysis
3. Results
4. Discussion
5. Conclusions
Supplementary Materials
Author Contributions
Funding
Institutional Review Board Statement
Informed Consent Statement
Data Availability Statement
Conflicts of Interest
References
- Sun, H.; Saeedi, P.; Karuranga, S.; Pinkepank, M.; Ogurtsova, K.; Duncan, B.B.; Stein, C.; Basit, A.; Chan, J.C.N.; Mbanya, J.C.; et al. IDF Diabetes Atlas: Global, regional and country-level diabetes prevalence estimates for 2021 and projections for 2045. Diabetes Res. Clin. Pract. 2022, 183, 109119. [Google Scholar] [CrossRef] [PubMed]
- Yapislar, H.; Gurler, E.B. Management of Microcomplications of Diabetes Mellitus: Challenges, Current Trends, and Future Perspectives in Treatment. Biomedicines 2024, 12, 1958. [Google Scholar] [CrossRef]
- Jakubiak, G.K.; Chwalba, A.; Basek, A.; Cieslar, G.; Pawlas, N. Glycated Hemoglobin and Cardiovascular Disease in Patients Without Diabetes. J. Clin. Med. 2024, 14, 53. [Google Scholar] [CrossRef]
- Huang, P.L. A comprehensive definition for metabolic syndrome. Dis. Model. Mech. 2009, 2, 231–237. [Google Scholar] [CrossRef] [PubMed]
- Dhokte, S.; Czaja, K. Visceral Adipose Tissue: The Hidden Culprit for Type 2 Diabetes. Nutrients 2024, 16, 1015. [Google Scholar] [CrossRef]
- Oh, Y.H.; Moon, J.H.; Kim, H.J.; Kong, M.H. Visceral-to-subcutaneous fat ratio as a predictor of the multiple metabolic risk factors for subjects with normal waist circumference in Korea. Diabetes Metab. Syndr. Obes. 2017, 10, 505–511. [Google Scholar] [CrossRef]
- Eskridge, W.; Cryer, D.R.; Schattenberg, J.M.; Gastaldelli, A.; Malhi, H.; Allen, A.M.; Noureddin, M.; Sanyal, A.J. Metabolic dysfunction-associated steatotic liver disease and metabolic dysfunction-associated steatohepatitis: The patient and physician perspective. J. Clin. Med. 2023, 12, 6216. [Google Scholar] [CrossRef] [PubMed]
- Eslam, M.; Newsome, P.N.; Sarin, S.K.; Anstee, Q.M.; Targher, G.; Romero-Gomez, M.; Zelber-Sagi, S.; Wong, V.W.-S.; Dufour, J.-F.; Schattenberg, J.M. A new definition for metabolic dysfunction-associated fatty liver disease: An international expert consensus statement. J. Hepatol. 2020, 73, 202–209. [Google Scholar] [CrossRef]
- Canivet, C.M.; Boursier, J.; Loomba, R. New Nomenclature for Nonalcoholic Fatty Liver Disease: Understanding Metabolic Dysfunction-Associated Steatotic Liver Disease, Metabolic Dysfunction-and Alcohol-Associated Liver Disease, and Their Implications in Clinical Practice. Semin. Liver Dis. 2024, 44, 35–42. [Google Scholar] [CrossRef]
- Dharmalingam, M.; Yamasandhi, P.G. Nonalcoholic Fatty Liver Disease and Type 2 Diabetes Mellitus. Indian. J. Endocrinol. Metab. 2018, 22, 421–428. [Google Scholar] [CrossRef]
- Mika, A.; Macaluso, F.; Barone, R.; Di Felice, V.; Sledzinski, T. Effect of Exercise on Fatty Acid Metabolism and Adipokine Secretion in Adipose Tissue. Front. Physiol. 2019, 10, 26. [Google Scholar] [CrossRef]
- Kozawa, J.; Shimomura, I. Ectopic Fat Accumulation in Pancreas and Heart. J. Clin. Med. 2021, 10, 1326. [Google Scholar] [CrossRef]
- Imai, Y.; Cousins, R.S.; Liu, S.; Phelps, B.M.; Promes, J.A. Connecting pancreatic islet lipid metabolism with insulin secretion and the development of type 2 diabetes. Ann. N. Y. Acad. Sci. 2020, 1461, 53–72. [Google Scholar] [CrossRef]
- Zatterale, F.; Longo, M.; Naderi, J.; Raciti, G.A.; Desiderio, A.; Miele, C.; Beguinot, F. Chronic Adipose Tissue Inflammation Linking Obesity to Insulin Resistance and Type 2 Diabetes. Front. Physiol. 2019, 10, 1607. [Google Scholar] [CrossRef]
- Heber, S.D.; Hetterich, H.; Lorbeer, R.; Bayerl, C.; Machann, J.; Auweter, S.; Storz, C.; Schlett, C.L.; Nikolaou, K.; Reiser, M.; et al. Pancreatic fat content by magnetic resonance imaging in subjects with prediabetes, diabetes, and controls from a general population without cardiovascular disease. PLoS ONE 2017, 12, e0177154. [Google Scholar] [CrossRef]
- Ahbab, S.; Unsal, A.; Ataoglu, H.E.; Can, T.S.; Kayas, D.; Savas, Y. Prediabetes and Type 2 Diabetes are Independent Risk Factors for Computed Tomography-Estimated Nonalcoholic Fatty Pancreas Disease. Clinics 2019, 74, e1337. [Google Scholar] [CrossRef] [PubMed]
- Cerf, M.E. Beta cell dysfunction and insulin resistance. Front. Endocrinol. 2013, 4, 37. [Google Scholar] [CrossRef] [PubMed]
- Macauley, M.; Percival, K.; Thelwall, P.E.; Hollingsworth, K.G.; Taylor, R. Altered volume, morphology and composition of the pancreas in type 2 diabetes. PLoS ONE 2015, 10, e0126825. [Google Scholar] [CrossRef] [PubMed]
- Steven, S.; Hollingsworth, K.G.; Small, P.K.; Woodcock, S.A.; Pucci, A.; Aribisala, B.; Al-Mrabeh, A.; Daly, A.K.; Batterham, R.L.; Taylor, R. Weight Loss Decreases Excess Pancreatic Triacylglycerol Specifically in Type 2 Diabetes. Diabetes Care 2016, 39, 158–165. [Google Scholar] [CrossRef]
- Heni, M.; Machann, J.; Staiger, H.; Schwenzer, N.F.; Peter, A.; Schick, F.; Claussen, C.D.; Stefan, N.; Haring, H.U.; Fritsche, A. Pancreatic fat is negatively associated with insulin secretion in individuals with impaired fasting glucose and/or impaired glucose tolerance: A nuclear magnetic resonance study. Diabetes Metab. Res. Rev. 2010, 26, 200–205. [Google Scholar] [CrossRef]
- Fabbrini, E.; Magkos, F.; Mohammed, B.S.; Pietka, T.; Abumrad, N.A.; Patterson, B.W.; Okunade, A.; Klein, S. Intrahepatic fat, not visceral fat, is linked with metabolic complications of obesity. Proc. Natl. Acad. Sci. USA 2009, 106, 15430–15435. [Google Scholar] [CrossRef]
- van Raalte, D.H.; Diamant, M. Glucolipotoxicity and beta cells in type 2 diabetes mellitus: Target for durable therapy? Diabetes Res. Clin. Pract. 2011, 93 (Suppl. S1), S37–S46. [Google Scholar] [CrossRef] [PubMed]
- Cnop, M. Fatty acids and glucolipotoxicity in the pathogenesis of Type 2 diabetes. Biochem. Soc. Trans. 2008, 36, 348–352. [Google Scholar] [CrossRef] [PubMed]
- Chan, T.T.; Tse, Y.K.; Lui, R.N.; Wong, G.L.; Chim, A.M.; Kong, A.P.; Woo, J.; Yeung, D.K.; Abrigo, J.M.; Chu, W.C.; et al. Fatty Pancreas Is Independently Associated With Subsequent Diabetes Mellitus Development: A 10-Year Prospective Cohort Study. Clin. Gastroenterol. Hepatol. 2022, 20, 2014–2022.e2014. [Google Scholar] [CrossRef]
- Skudder-Hill, L.; Coffey, S.; Sequeira-Bisson, I.R.; Ko, J.; Poppitt, S.D.; Petrov, M.S. Comprehensive analysis of dyslipidemia states associated with fat in the pancreas. Diabetes Metab. Syndr. 2023, 17, 102881. [Google Scholar] [CrossRef]
- Yu, T.Y.; Wang, C.Y. Impact of non-alcoholic fatty pancreas disease on glucose metabolism. J. Diabetes Investig. 2017, 8, 735–747. [Google Scholar] [CrossRef] [PubMed]
- Ou, H.Y.; Wang, C.Y.; Yang, Y.C.; Chen, M.F.; Chang, C.J. The association between nonalcoholic fatty pancreas disease and diabetes. PLoS ONE 2013, 8, e62561. [Google Scholar] [CrossRef] [PubMed]
- Tushuizen, M.E.; Bunck, M.C.; Pouwels, P.J.; Bontemps, S.; van Waesberghe, J.H.; Schindhelm, R.K.; Mari, A.; Heine, R.J.; Diamant, M. Pancreatic fat content and beta-cell function in men with and without type 2 diabetes. Diabetes Care 2007, 30, 2916–2921. [Google Scholar] [CrossRef]
- Yu, X.; Wang, D.; Xiao, W.; Shi, X.; She, Q.; Sun, H.; Qi, T.; Xu, R.; Li, G.; Liu, X.; et al. Relationship between fatty pancreas and hypertriglyceridemic waist phenotype: A cross-sectional study. Sci. Rep. 2020, 10, 21937. [Google Scholar] [CrossRef] [PubMed]
- Elnaem, M.H.; Mohamed, M.H.N.; Huri, H.Z.; Azarisman, S.M.; Elkalmi, R.M. Statin Therapy Prescribing for Patients with Type 2 Diabetes Mellitus: A Review of Current Evidence and Challenges. J. Pharm. Bioallied Sci. 2017, 9, 80–87. [Google Scholar] [CrossRef] [PubMed]
- Abe, M.; Matsuda, M.; Kobayashi, H.; Miyata, Y.; Nakayama, Y.; Komuro, R.; Fukuhara, A.; Shimomura, I. Effects of statins on adipose tissue inflammation: Their inhibitory effect on MyD88-independent IRF3/IFN-beta pathway in macrophages. Arterioscler. Thromb. Vasc. Biol. 2008, 28, 871–877. [Google Scholar] [CrossRef]
- Yamada, Y.; Takeuchi, S.; Yoneda, M.; Ito, S.; Sano, Y.; Nagasawa, K.; Matsuura, N.; Uchinaka, A.; Murohara, T.; Nagata, K. Atorvastatin reduces cardiac and adipose tissue inflammation in rats with metabolic syndrome. Int. J. Cardiol. 2017, 240, 332–338. [Google Scholar] [CrossRef]
- Parisi, V.; Petraglia, L.; D’Esposito, V.; Cabaro, S.; Rengo, G.; Caruso, A.; Grimaldi, M.G.; Baldascino, F.; De Bellis, A.; Vitale, D.; et al. Statin therapy modulates thickness and inflammatory profile of human epicardial adipose tissue. Int. J. Cardiol. 2019, 274, 326–330. [Google Scholar] [CrossRef]
- Krisnamurti, D.G.B.; Farida, S.; Putri, R.C.; Fachri, W.; Purwaningsih, E.H. The effect of simvastatin-Acalypha indica Linn. combination on the improvement of fatty pancreas in rats induced with a high fructose and cholesterol diet. J. Adv. Vet. Anim. Res. 2022, 9, 346–350. [Google Scholar] [CrossRef] [PubMed]
- Raggi, P.; Gadiyaram, V.; Zhang, C.; Chen, Z.; Lopaschuk, G.; Stillman, A.E. Statins Reduce Epicardial Adipose Tissue Attenuation Independent of Lipid Lowering: A Potential Pleiotropic Effect. J. Am. Heart Assoc. 2019, 8, e013104. [Google Scholar] [CrossRef]
- Friedewald, W.T.; Levy, R.I.; Fredrickson, D.S. Estimation of the concentration of low-density lipoprotein cholesterol in plasma, without use of the preparative ultracentrifuge. Clin. Chem. 1972, 18, 499–502. [Google Scholar] [CrossRef]
- Kim, S.H.; Lee, J.M.; Kim, J.H.; Kim, K.G.; Han, J.K.; Lee, K.H.; Park, S.H.; Yi, N.J.; Suh, K.S.; An, S.K.; et al. Appropriateness of a donor liver with respect to macrosteatosis: Application of artificial neural networks to US images—Initial experience. Radiology 2005, 234, 793–803. [Google Scholar] [CrossRef]
- Hernaez, R.; Lazo, M.; Bonekamp, S.; Kamel, I.; Brancati, F.L.; Guallar, E.; Clark, J.M. Diagnostic accuracy and reliability of ultrasonography for the detection of fatty liver: A meta-analysis. Hepatology 2011, 54, 1082–1090. [Google Scholar] [CrossRef] [PubMed]
- Dasarathy, S.; Dasarathy, J.; Khiyami, A.; Joseph, R.; Lopez, R.; McCullough, A.J. Validity of real time ultrasound in the diagnosis of hepatic steatosis: A prospective study. J. Hepatol. 2009, 51, 1061–1067. [Google Scholar] [CrossRef] [PubMed]
- Leiu, K.H.; Poppitt, S.D.; Miles-Chan, J.L.; Sequeira, I.R. Fatty Pancreas and Cardiometabolic Risk: Response of Ectopic Fat to Lifestyle and Surgical Interventions. Nutrients 2022, 14, 4873. [Google Scholar] [CrossRef] [PubMed]
- Boicean, A.; Ichim, C.; Todor, S.B.; Anderco, P.; Popa, M.L. The Importance of Microbiota and Fecal Microbiota Transplantation in Pancreatic Disorders. Diagnostics 2024, 14, 861. [Google Scholar] [CrossRef]
- Boicean, A.; Birlutiu, V.; Ichim, C.; Brusnic, O.; Onisor, D.M. Fecal Microbiota Transplantation in Liver Cirrhosis. Biomedicines 2023, 11, 2930. [Google Scholar] [CrossRef]
- Mahyoub, M.A.; Elhoumed, M.; Maqul, A.H.; Almezgagi, M.; Abbas, M.; Jiao, Y.; Wang, J.; Alnaggar, M.; Zhao, P.; He, S. Fatty infiltration of the pancreas: A systematic concept analysis. Front. Med. 2023, 10, 1227188. [Google Scholar] [CrossRef] [PubMed]
- Souza-Mello, V.; Gregorio, B.M.; Relvas-Lucas, B.; da Silva Faria, T.; Aguila, M.B.; Mandarim-de-Lacerda, C.A. Pancreatic ultrastructural enhancement due to telmisartan plus sitagliptin treatment in diet-induced obese C57BL/6 mice. Pancreas 2011, 40, 715–722. [Google Scholar] [CrossRef] [PubMed]
- Dutour, A.; Abdesselam, I.; Ancel, P.; Kober, F.; Mrad, G.; Darmon, P.; Ronsin, O.; Pradel, V.; Lesavre, N.; Martin, J.C.; et al. Exenatide decreases liver fat content and epicardial adipose tissue in patients with obesity and type 2 diabetes: A prospective randomized clinical trial using magnetic resonance imaging and spectroscopy. Diabetes Obes. Metab. 2016, 18, 882–891. [Google Scholar] [CrossRef]
- Shi, M.; Zhang, H.; Wang, W.; Zhang, X.; Liu, J.; Wang, Q.; Wang, Y.; Zhang, C.; Guo, X.; Qiao, Q.; et al. Effect of dapagliflozin on liver and pancreatic fat in patients with type 2 diabetes and non-alcoholic fatty liver disease. J. Diabetes Complicat. 2023, 37, 108610. [Google Scholar] [CrossRef]
- Hummel, J.; Machann, J.; Dannecker, C.; Kullmann, S.; Birkenfeld, A.L.; Haring, H.U.; Peter, A.; Fritsche, A.; Wagner, R.; Heni, M. Eight weeks of empagliflozin does not affect pancreatic fat content and insulin secretion in people with prediabetes. Diabetes Obes. Metab. 2022, 24, 1661–1666. [Google Scholar] [CrossRef] [PubMed]
- Zsori, G.; Illes, D.; Ivany, E.; Kosar, K.; Holzinger, G.; Tajti, M.; Palinkas, E.; Szabovik, G.; Nagy, A.; Palko, A.; et al. In New-Onset Diabetes Mellitus, Metformin Reduces Fat Accumulation in the Liver, But Not in the Pancreas or Pericardium. Metab. Syndr. Relat. Disord. 2019, 17, 289–295. [Google Scholar] [CrossRef]
- Szczepaniak, L.S.; Victor, R.G.; Mathur, R.; Nelson, M.D.; Szczepaniak, E.W.; Tyer, N.; Chen, I.; Unger, R.H.; Bergman, R.N.; Lingvay, I. Pancreatic steatosis and its relationship to beta-cell dysfunction in humans: Racial and ethnic variations. Diabetes Care 2012, 35, 2377–2383. [Google Scholar] [CrossRef] [PubMed]
- Al Quran, T.M.; Bataineh, Z.A.; Al-Mistarehi, A.H.; Zein Alaabdin, A.M.; Allan, H.; Al Qura’an, A.; Weshah, S.M.; Alanazi, A.A.; Khader, Y.S. Prevalence and Pattern of Dyslipidemia and Its Associated Factors Among Patients with Type 2 Diabetes Mellitus in Jordan: A Cross-Sectional Study. Int. J. Gen. Med. 2022, 15, 7669–7683. [Google Scholar] [CrossRef]
- Boutari, C.; Pappas, P.D.; Anastasilakis, D.; Mantzoros, C.S. Statins’ efficacy in non-alcoholic fatty liver disease: A systematic review and meta-analysis. Clin. Nutr. 2022, 41, 2195–2206. [Google Scholar] [CrossRef] [PubMed]
- Athyros, V.G.; Boutari, C.; Stavropoulos, K.; Anagnostis, P.; Imprialos, K.P.; Doumas, M.; Karagiannis, A. Statins: An Under-Appreciated Asset for the Prevention and the Treatment of NAFLD or NASH and the Related Cardiovascular Risk. Curr. Vasc. Pharmacol. 2018, 16, 246–253. [Google Scholar] [CrossRef] [PubMed]
- Lingvay, I.; Esser, V.; Legendre, J.L.; Price, A.L.; Wertz, K.M.; Adams-Huet, B.; Zhang, S.; Unger, R.H.; Szczepaniak, L.S. Noninvasive quantification of pancreatic fat in humans. J. Clin. Endocrinol. Metab. 2009, 94, 4070–4076. [Google Scholar] [CrossRef]
- Laakso, M.; Fernandes Silva, L. Statins and risk of type 2 diabetes: Mechanism and clinical implications. Front. Endocrinol. 2023, 14, 1239335. [Google Scholar] [CrossRef]
- Kothari, S.; Dhami-Shah, H.; Shah, S.R. Antidiabetic Drugs and Statins in Nonalcoholic Fatty Liver Disease. J. Clin. Exp. Hepatol. 2019, 9, 723–730. [Google Scholar] [CrossRef] [PubMed]
- El-Assaad, W.; Joly, E.; Barbeau, A.; Sladek, R.; Buteau, J.; Maestre, I.; Pepin, E.; Zhao, S.; Iglesias, J.; Roche, E.; et al. Glucolipotoxicity alters lipid partitioning and causes mitochondrial dysfunction, cholesterol, and ceramide deposition and reactive oxygen species production in INS832/13 ss-cells. Endocrinology 2010, 151, 3061–3073. [Google Scholar] [CrossRef]
- Ishikawa, M.; Okajima, F.; Inoue, N.; Motomura, K.; Kato, T.; Takahashi, A.; Oikawa, S.; Yamada, N.; Shimano, H. Distinct effects of pravastatin, atorvastatin, and simvastatin on insulin secretion from a beta-cell line, MIN6 cells. J. Atheroscler. Thromb. 2006, 13, 329–335. [Google Scholar] [CrossRef]
- Climent, E.; Benaiges, D.; Pedro-Botet, J. Hydrophilic or Lipophilic Statins? Front. Cardiovasc. Med. 2021, 8, 687585. [Google Scholar] [CrossRef] [PubMed]
- Pastori, D.; Polimeni, L.; Baratta, F.; Pani, A.; Del Ben, M.; Angelico, F. The efficacy and safety of statins for the treatment of non-alcoholic fatty liver disease. Dig. Liver Dis. 2015, 47, 4–11. [Google Scholar] [CrossRef]
- Cho, Y.; Lee, H.; Park, H.K.; Choe, E.Y.; Wang, H.J.; Kim, R.H.; Kim, Y.; Kang, E.S. Differential Diabetogenic Effect of Pitavastatin and Rosuvastatin, in vitro and in vivo. J. Atheroscler. Thromb. 2020, 27, 429–440. [Google Scholar] [CrossRef]
- Braun, L.R.; Feldpausch, M.N.; Czerwonka, N.; Weiss, J.; Branch, K.; Lee, H.; Martinez-Salazar, E.L.; Torriani, M.; Sponseller, C.A.; Grinspoon, S.K.; et al. Effects of Pitavastatin on Insulin Sensitivity and Liver Fat: A Randomized Clinical Trial. J. Clin. Endocrinol. Metab. 2018, 103, 4176–4186. [Google Scholar] [CrossRef]
- Neto-Ferreira, R.; Rocha, V.N.; Souza-Mello, V.; Mandarim-de-Lacerda, C.A.; de Carvalho, J.J. Pleiotropic effects of rosuvastatin on the glucose metabolism and the subcutaneous and visceral adipose tissue behavior in C57Bl/6 mice. Diabetol. Metab. Syndr. 2013, 5, 32. [Google Scholar] [CrossRef] [PubMed]
- Chen, Z.Y.; Liu, S.N.; Li, C.N.; Sun, S.J.; Liu, Q.; Lei, L.; Gao, L.H.; Shen, Z.F. Atorvastatin helps preserve pancreatic beta cell function in obese C57BL/6 J mice and the effect is related to increased pancreas proliferation and amelioration of endoplasmic-reticulum stress. Lipids Health Dis. 2014, 13, 98. [Google Scholar] [CrossRef] [PubMed]
- Aguirre, L.; Hijona, E.; Macarulla, M.T.; Gracia, A.; Larrechi, I.; Bujanda, L.; Hijona, L.; Portillo, M.P. Several statins increase body and liver fat accumulation in a model of metabolic syndrome. J. Physiol. Pharmacol. 2013, 64, 281–288. [Google Scholar] [PubMed]

| Variables | All Population n = 140 | Statin Use | p | |
|---|---|---|---|---|
| No | Yes | |||
| n = 70 | n = 70 | |||
| Female gender, n (%) | 77 (55.0) | 40 (57.1) | 37 (52.9) | 0.610 |
| Age, years | 56.5 ± 8.2 | 55.7 ± 8.7 | 57.4 ± 7.5 | 0.225 |
| BMI, kg/m2 | 31.1 ± 7.6 | 30.9 ± 8.0 | 31.2 ± 7.3 | 0.776 |
| Waist circumference, cm | 103.4 ± 12.1 | 102.9 ± 11.4 | 103.9 ± 12.8 | 0.637 |
| Alcohol use, n (%) | 19 (13.6) | 12 (17.1) | 7 (10.0) | 0.324 |
| Duration of diabetes, years | 7.0 (3.2–13.0) | 6.0 (2.2–12.0) | 8.0 (5.0–15.0) | 0.050 * |
| Comorbidities, n (%) | ||||
| Hypertension | 65 (46.4) | 26 (37.1) | 39 (55.7) | 0.028 * |
| Cardiac disease | 14 (10.0) | 5 (7.1) | 9 (12.9) | 0.260 |
| Thyroid diseases | 16 (11.4) | 7 (10.0) | 9 (12.9) | 0.595 |
| Hyperlipidemia | 88 (62.9) | 22 (31.4) | 66 (94.3) | <0.001 * |
| Anti-diabetic drugs | ||||
| Only OADs | 92 (65.7) | 46 (65.7) | 46 (65.7) | 0.684 |
| Only insulin | 4 (2.9) | 1 (1.4) | 3 (4.3) | |
| Combined therapy | 44 (31.4) | 23 (32.9) | 21 (30.0) | |
| Hepatosteatosis, n (%) | 122 (87.1) | 64 (91.4) | 58 (82.9) | 0.207 |
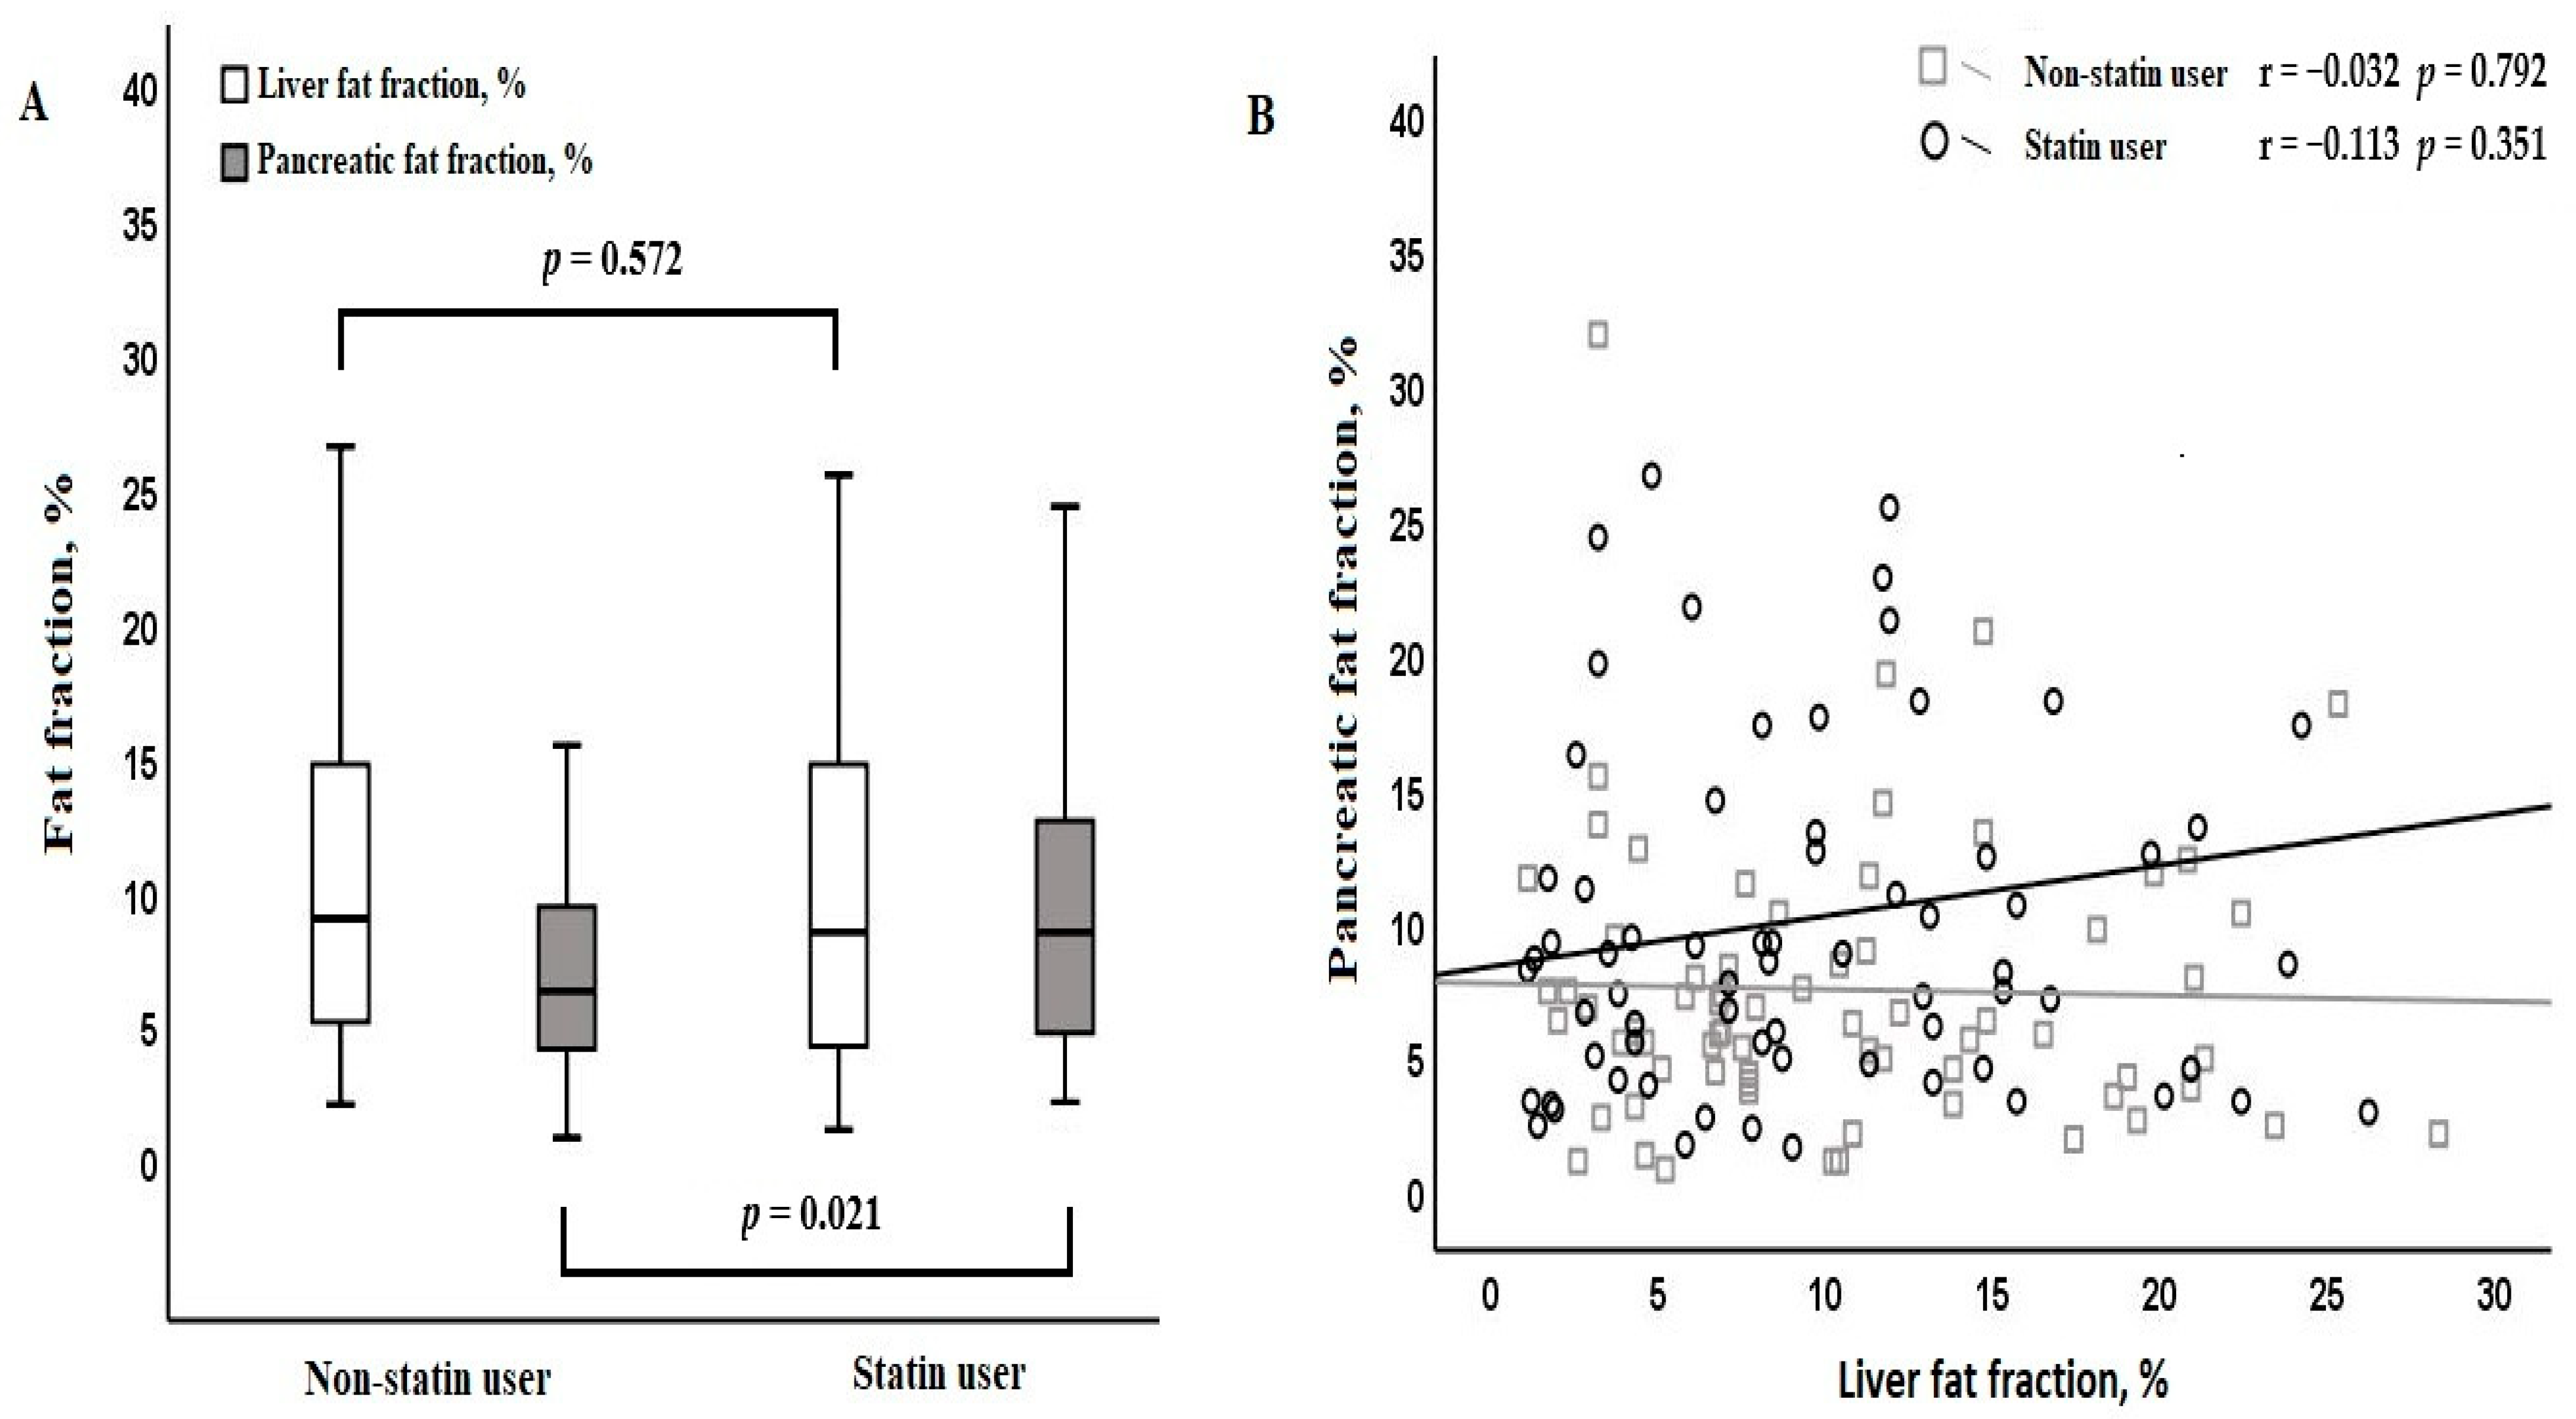
| Liver fat fraction, % | 8.5 (4.5–14.7) | 9.0 (5.1–14.7) | 8.4 (4.2–14.7) | 0.572 |
| Pancreatic fat fraction, % | 7.2 (4.4–11.4) | 6.2 (4.2–9.3) | 8.4 (4.7–12.6) | 0.021 * |
| Laboratory findings | ||||
| Glucose, mg/dL | 134.5 (107.0–174.5) | 142.0 (121.0–184.5) | 130.5 (103.0–161.8) | 0.060 |
| Leukocytes, 103/mm3 | 7.9 ± 2.2 | 7.9 ± 2.5 | 7.8 ± 1.9 | 0.821 |
| Platelets, 103/mm3 | 271.5 ± 58.5 | 269.1 ± 58.1 | 273.9 ± 59.2 | 0.634 |
| HbA1-c, % | 7.5 (6.5–9.0) | 7.7 (6.6–9.8) | 7.1 (6.4–8.6) | 0.073 |
| Urea, mg/dL | 30.0 (25.0–34.0) | 29.0 (25.0–32.0) | 30.0 (25.0–36.0) | 0.255 |
| Creatinine, mg/dL | 0.8 (0.6–0.9) | 0.7 (0.6–0.8) | 0.8 (0.7–0.9) | 0.035 * |
| ALT, U/L | 18.8 (14.0–25.0) | 18.1 (14.0–23.0) | 19.0 (14.5–25.0) | 0.479 |
| AST, U/L | 17.0 (14.0–20.0) | 16.0 (14.0–18.8) | 17.0 (15.0–20.7) | 0.047 * |
| ALP, U/L | 78.0 (65.8–96.0) | 77.5 (64.0–96.0) | 79.5 (69.0–95.8) | 0.298 |
| GGT, U/L | 23.0 (16.0–32.0) | 23.0 (15.2–30.8) | 24.5 (17.0–35.5) | 0.216 |
| Amylase, U/L | 61.0 (45.5–77.8) | 54.0 (41.2–82.8) | 63.0 (54.2–74.0) | 0.142 |
| Lipase, U/L | 30.0 (24.0–41.0) | 32.5 (23.0–41.5) | 28.5 (24.4–40.5) | 0.467 |
| Cholesterol, mg/dL | 197.5 ± 58.2 | 221.6 ± 66.5 | 180.4 ± 44.8 | 0.002 * |
| HDL-C, mg/dL | 47.7 ± 12.8 | 48.4 ± 12.8 | 46.9 ± 12.9 | 0.495 |
| LDL-C, mg/dL | 110.5 (86.0–140.0) | 119.5 (96.2–142.8) | 100.0 (78.0–133.8) | 0.009 * |
| Triglycerides, mg/dL | 142.0 (97.8–195.8) | 164.0 (101.2–212.2) | 132.0 (97.2–181.5) | 0.087 |
| Variables | LFF (%) | PFF (%) | ||
|---|---|---|---|---|
| Median (IQR) or Correlation Coefficient (r) | p | Median (IQR) or Correlation Coefficient (r) | p | |
| Gender | ||||
| Female | 11.3 (6.7–16.7) | 0.002 * | 7.0 (4.9–10.3) | 0.752 |
| Male | 6.9 (3.8–11.3) | 7.4 (3.9–12.5) | ||
| Age | −0.003 | 0.975 | 0.167 | 0.149 |
| BMI | 0.310 | <0.001 * | 0.090 | 0.292 |
| Waist circumference | 0.224 | 0.008 * | 0.148 | 0.082 |
| Alcohol use | ||||
| No | 9.0 (4.4–14.8) | 0.191 | 7.2 (4.5–11.2) | 0.966 |
| Yes | 6.1 (4.6–11.2) | 7.5 (3.5–11.6) | ||
| Duration of diabetes | −0.045 | 0.601 | 0.074 | 0.385 |
| Hypertension | ||||
| No | 7.8 (4.3–13.8) | 0.253 | 7.1 (4.3–9.7) | 0.240 |
| Yes | 9.8 (5.8–14.7) | 7.2 (4.5–13.3) | ||
| Cardiac disease | ||||
| No | 9.2 (4.6–14.8) | 0.370 | 7.2 (4.5–10.6) | 0.367 |
| Yes | 8.1 (3.8–10.8) | 8.3 (4.2–17.3) | ||
| Thyroid diseases | ||||
| No | 8.5 (4.7–14.7) | 0.958 | 7.3 (4.5–11.0) | 0.888 |
| Yes | 10.6 (3.8–15.0) | 6.6 (4.3–11.5) | ||
| Hyperlipidemia | ||||
| No | 10.4 (5.5–14.8) | 0.509 | 6.7 (4.5–9.2) | 0.112 |
| Yes | 8.4 (4.3–14.5) | 7.6 (4.4–12.5) | ||
| Anti-diabetic drugs | ||||
| Only OADs | 10.5 (6.0–15.3) † | 0.032 * | 7.3 (4.3–11.1) | 0.906 |
| Only insulin | 4.8 (3.4–7.1) † | 7.2 (4.1–9.0) | ||
| Combined therapy | 7.4 (4.2–13.2) † | 6.9 (4.5–12.0) | ||
| Duration of statin | −0.086 | 0.315 | 0.142 | 0.194 |
| Statin use | ||||
| No | 9.0 (5.1–14.7) | 0.445 | 6.2 (4.2–9.3) † | 0.004 * |
| Atorvastatin | 8.3 (3.8–13.0) | 8.7 (5.5–14.9) | ||
| Rosuvastatin | 8.1 (5.1–16.1) | 3.2 (2.6–6.6) † | ||
| Pitavastatin | 14.8 (7.8–20.1) | 9.2 (3.5–10.2) | ||
| Dose of atorvastatin | ||||
| 10 mg/day | 8.5 (5.1–13.9) | 0.009 * | 8.8 (5.4–15.4) | 0.042 * |
| 20 mg/day | 11.9 (4.4–22.0) | 9.0 (5.1–13.5) | ||
| 40 mg/day | 4.8 (1.6–8.0) † | 5.5 (2.8–8.9) † | ||
| Variables | LFF | PFF | ||
|---|---|---|---|---|
| r | p | r | p | |
| Glucose | 0.168 | 0.166 | 0.025 | 0.836 |
| Leukocytes | 0.184 | 0.130 | 0.023 | 0.848 |
| Platelets | 0.146 | 0.232 | −0.057 | 0.644 |
| HbA1-c | 0.016 | 0.899 | 0.013 | 0.918 |
| Urea | −0.032 | 0.796 | −0.025 | 0.838 |
| Creatinine | −0.170 | 0.161 | −0.073 | 0.553 |
| ALT | 0.348 | <0.001 * | 0.228 | 0.090 |
| AST | 0.220 | 0.102 | 0.149 | 0.223 |
| ALP | 0.230 | 0.080 | 0.484 | <0.001 * |
| GGT | 0.162 | 0.184 | 0.128 | 0.293 |
| Amylase | −0.141 | 0.248 | −0.166 | 0.163 |
| Lipase | 0.003 | 0.978 | −0.067 | 0.582 |
| Cholesterol | 0.149 | 0.222 | −0.091 | 0.458 |
| HDL-C | −0.046 | 0.709 | −0.140 | 0.252 |
| LDL-C | 0.024 | 0.844 | −0.043 | 0.726 |
| Triglycerides | 0.458 | <0.001 * | −0.010 | 0.933 |
| Variables | Univariable Regression | Multivariable Regression | ||||
|---|---|---|---|---|---|---|
| ꞵ ± SE | 95% CI | p | ꞵ ± SE | 95% CI | p | |
| log(LFF) | ||||||
| Male gender | −0.18 ± 0.06 | (−0.29)–(−0.06) | 0.003 * | −0.21 ± 0.05 | (−0.31)–(−0.10) | 0.007 * |
| BMI | 0.09 ± 0.04 | 0.02–0.17 | 0.017 * | - | - | - |
| Waist circumference | 0.06 ± 0.02 | 0.01–0.11 | 0.009 * | 0.05 ± 0.02 | 0.01–0.09 | 0.033 * |
| Insulin use | −0.17 ± 0.06 | (−0.29)–(−0.05) | 0.007 * | −0.16 ± 0.05 | (−0.27)–(−0.06) | 0.010 * |
| log(ALT) | 0.71 ± 0.15 | 0.41–1.01 | <0.001 * | 0.67 ± 0.14 | 0.40–0.94 | <0.001 * |
| log(Triglyceride) | 0.50 ± 0.13 | 0.24–0.77 | <0.001 * | 0.36 ± 0.12 | 0.12–0.59 | 0.003 * |
| Adjusted R2 = 0.33, p < 0.001 * | ||||||
| log(PFF) | ||||||
| Atorvastatin | 0.19 ± 0.07 | 0.05–0.33 | 0.001 * | 0.17 ± 0.06 | 0.06–0.28 | 0.011 * |
| Rosuvastatin | −0.18 ± 0.06 | (−0.30)–(−0.06) | 0.010 * | −0.16 ± 0.07 | (−0.30)–(−0.02) | 0.025 * |
| Pitavastatin | 0.21 ± 0.08 | 0.05–0.37 | 0.008 * | 0.19 ± 0.07 | 0.05–0.33 | 0.008 * |
| log(ALP) | 0.44 ± 0.16 | 0.11–0.76 | <0.001 * | 0.33 ± 0.16 | 0.01–0.64 | 0.046 * |
| Adjusted R2 = 0.21, p < 0.001 * | ||||||
Disclaimer/Publisher’s Note: The statements, opinions and data contained in all publications are solely those of the individual author(s) and contributor(s) and not of MDPI and/or the editor(s). MDPI and/or the editor(s) disclaim responsibility for any injury to people or property resulting from any ideas, methods, instructions or products referred to in the content. |
© 2025 by the authors. Licensee MDPI, Basel, Switzerland. This article is an open access article distributed under the terms and conditions of the Creative Commons Attribution (CC BY) license (https://creativecommons.org/licenses/by/4.0/).
Share and Cite
Parlar, M.A.; Mutlu, H.; Doğantekin, B.; Musaoğlu, İ.S.; Albayrakoğlu, N.D.; Yavuz, M.L.; Özbolat, Z.B.; Kaplan, M. The Association of Statin Therapy with Liver and Pancreatic Fat Fraction in Type 2 Diabetes Mellitus. Diagnostics 2025, 15, 426. https://doi.org/10.3390/diagnostics15040426
Parlar MA, Mutlu H, Doğantekin B, Musaoğlu İS, Albayrakoğlu ND, Yavuz ML, Özbolat ZB, Kaplan M. The Association of Statin Therapy with Liver and Pancreatic Fat Fraction in Type 2 Diabetes Mellitus. Diagnostics. 2025; 15(4):426. https://doi.org/10.3390/diagnostics15040426
Chicago/Turabian StyleParlar, Mehmet Akif, Hakan Mutlu, Betül Doğantekin, İsmail Serhat Musaoğlu, Nisa Demirboşnak Albayrakoğlu, Mustafa Lütfi Yavuz, Zehra Buşra Özbolat, and Mustafa Kaplan. 2025. "The Association of Statin Therapy with Liver and Pancreatic Fat Fraction in Type 2 Diabetes Mellitus" Diagnostics 15, no. 4: 426. https://doi.org/10.3390/diagnostics15040426
APA StyleParlar, M. A., Mutlu, H., Doğantekin, B., Musaoğlu, İ. S., Albayrakoğlu, N. D., Yavuz, M. L., Özbolat, Z. B., & Kaplan, M. (2025). The Association of Statin Therapy with Liver and Pancreatic Fat Fraction in Type 2 Diabetes Mellitus. Diagnostics, 15(4), 426. https://doi.org/10.3390/diagnostics15040426