Abstract
Background/Objectives: Alzheimer’s disease (AD) accounts for ~70% of global dementia cases, with projections estimating 139 million affected individuals by 2050. This increasing burden highlights the urgent need for accessible, cost-effective diagnostic tools, particularly in low- and middle-income countries (LMICs). Traditional neuropsychological assessments, while effective, are resource-intensive and time-consuming. Methods: A total of 760 older adults (394 [51.8%] with AD) were recruited and neuropsychologically evaluated at the Instituto Colombiano de Neuropedagogía (ICN) in collaboration with Universidad del Norte (UN), Barranquilla. Machine learning (ML) algorithms were trained on a screening protocol incorporating demographic data and neuropsychological measures assessing memory, language, executive function, and praxis. Model performance was determined using 10-fold cross-validation. Variable importance analyses identified key predictors to develop optimized, abbreviated ML-based protocols. Metrics of compactness, cohesion, and separation further quantified diagnostic differentiation performance. Results: The eXtreme Gradient Boosting (xgbTree) algorithm achieved the highest diagnostic accuracy (91%) with the full protocol. Five ML-optimized screening protocols were also developed. The most efficient, the ICN-UN battery (including MMSE, Rey–Osterrieth Complex Figure recall, Rey Auditory Verbal Learning, Lawton & Brody Scale, and FAST), maintained strong diagnostic performance while reducing screening time from over four hours to under 25 min. Conclusions: The ML-optimized ICN-UN protocol offers a rapid, accurate, and scalable AD screening solution for LMICs. While promising for clinical adoption and earlier detection, further validation in diverse populations is recommended.
1. Introduction
Alzheimer’s Disease (AD) accounts for 70% of dementia cases and represents a growing global concern [1]. The disease is a significant burden on healthcare systems and millions of families worldwide. The number of affected individuals is expected to reach 78 million cases by 2030 and 139 million by 2050 [2].
With more than 60% of dementia patients residing in low- and middle-income countries (LMICs) [3], there is an urgent need for rapid and affordable diagnostic methods that enable early detection of AD across diverse socioeconomic groups, ensuring no one is excluded [4].
Traditional neuropsychological assessments are effective but are often resource-intensive and time-consuming. Variability in neuropsychological test administration, the influence of comorbidities, and possible confounding with vascular dementia. Nevertheless, neuropsychological variables remain cost-effective and non-invasive predictive biomarkers for AD diagnosis, especially where advanced imaging is inaccessible [5].
Clinical practitioners and researchers integrate a range of neuropsychological tests for evaluating neuropsychiatric pathologies. These include tools such as the Mini-Mental State Examination, Addenbrooke’s Cognitive Examination, Corsi’s Test, Trail Making Test, Symbol Digit Modalities Test, Tower of London-Drexel Version, Boston Naming Test, Rey–Osterrieth Complex Figure, Visual Object and Space Perception Battery, Clock Test, Wechsler Memory Scale, Digit Span, AD Assessment Scale-Cognitive Behavior, and the Functional Assessment Questionnaire [6,7,8,9]. While some of these tests achieve >85% accuracy for the diagnosis of AD [10,11,12], their combined administration is often lengthy and costly [13,14,15], restricting the number of participants in AD research.
Recently, Machine Learning (ML)-based predictive models have demonstrated value for diagnosis and monitoring in psychiatric and neurodegenerative disorders, including AD [16], bipolar disorder [17], Parkinson’s disease [18] and attention deficit hyperactivity disorder [19]. These models can identify patterns and achieve high diagnostic accuracy in relatively short timeframes. ML applications integrating multimodal data often outperform traditional methods, offering improved accuracy and interpretability [20]. ML-based models have also been extensively applied across various scientific domains, demonstrating remarkable effectiveness in addressing challenges such as digital image processing and financial forecasting [21,22].
Recent studies have applied ML-based models (i.e., Naïve Bayes, K-Nearest Neighbors, Gradient Boosting, Random Forest [RF], Support Vector Machines [SVMs], and Logistic Regression) to accelerate AD diagnosis in individuals exhibiting cognitive impairment. These models have achieved correct classification rates exceeding 85% [8,23,24].
Explainability of ML models is increasingly recognized as a critical aspect of ML in healthcare [25]. Techniques such as Shapley Additive Explanations (SHAP) [26] and Partial Dependence Plots (PDPs) [27] provide valuable insights into feature importance, helping clinicians discern which cognitive domains most strongly influence predictions. This transparency supports decision-making and enhances trust in predictive tools [28,29,30].
The present study aims to develop a reduced assessment protocol to optimize the time of neuropsychological evaluation of individuals diagnosed with AD through the implementation of ML-based models, identifying the neuropsychological tests that most contribute to achieving high detection rates of patients with AD.
The remainder of this manuscript is structured as follows. In Section 2, we detail the study design, participant selection, the neuropsychological assessment protocols, and the ML methods and feature selection procedures used to optimize the battery for AD diagnosis. Section 3 reports the main results, including the diagnostic performance of the reduced battery. Section 4 discusses the implications, limitations, and future directions. Finally, Section 5 provides our conclusions.
2. Subjects and Methods
2.1. Subjects
We included 760 individuals (394 AD cases and 366 healthy controls) over 65 years old from the Alzheimer’s disease SGR study [31] led by Universidad del Norte (UN), Barranquilla. This initiative is dedicated to unraveling the genetic landscape associated with AD susceptibility, age of onset, and disease progression in individuals from the Atlántico Department, located in the Northern Caribbean coast of Colombia.
As part of this collaborative effort, individuals were recruited at the Instituto Colombiano de Neuropedagogía (ICN) in Barranquilla, Colombia. The ICN team determined candidates’ eligibility based on the Montreal Cognitive Assessment (MoCA) results [16] and the inclusion criteria described elsewhere [32,33]. After eligibility was confirmed, data from clinical evaluations, family histories, comprehensive neurological and neuropsychological clinical examinations, structured interviews and genetic testing were collected.
2.2. Neuropsychological Assessment
As part of our comprehensive clinical evaluation protocol, all individuals completed an extensive battery of conventional neuropsychological tests covering multiple domains, including general cognitive function, memory, language, and daily living skills.
In addition to collecting sociodemographic data, this protocol included detailed neuropsychological assessments. The following tests were included: Mini-Mental State Examination, Mental Control–Wechsler Memory Scale, Semantic Verbal Fluency, Phonological Verbal Fluency, Rey–Osterrieth Complex Figure Test (ROCFT), Token Test–Short Version, Rey Auditory Verbal Learning Test (RAVLT), Boston Naming Test (BNT), Stroop Color and Word Test, Trail Making Test (TMT), Symbol Digit Test (SDT), Continuous Auditory Performance Test, Benton Visual Retention Test, Clock Drawing Test, Wisconsin Card Sorting Test (WCST), Memory Disorder Scale, Yesavage Depression Scale, Barthel Index, Lawton and Brody Scale, Katz Index, and the Functional Assessment Staging (FAST).
2.3. ML-Based Screening Tool for AD Diagnosis
2.3.1. Preprocessing
Missing data, a common problem in clinical studies, was imputed using the methods implemented in the missForest package version 1.6.1 [34] of R version 4.5.0 [35]. missForest implements a data imputation method based on the RF algorithm, where initial values are assigned to missing data, typically using the mean or mode. An RF model is then constructed to predict the missing values for each variable, using the other variables as predictors. The imputed values are updated with the predictions generated by the model. This process is repeated iteratively, improving the predictions with each iteration, until a convergence criterion is met, or a maximum number of iterations is reached. The overall proportion of missing data is 4.78% across all registers. In this study, imputation was performed separately for training and testing. At no point was the outcome variable (diagnosis) included in the imputation process, ensuring that information leakage did not bias the performance of the classification models.
2.3.2. ML Algorithms
We used the caret package version 7.0-1 [36,37] in R to construct predictive models of AD status (0: control; 1: case) including the neuropsychological measures and demographic variables (i.e., age at the beginning of the study, sex and years of education) as predictors. A 10-fold cross-validation procedure was employed to assess how the models will likely perform on future unseen data. To develop ML models for AD, we explored several algorithms, including: Generalized Linear Model (glm), K-Nearest Neighbors (knn), Recursive Partitioning and Regression Trees (rpart, rpart1se, rpart2), Bagged Classification Trees (treebag), SVMs with Linear, Radial and Polynomial Kernels (svmlinear, svmlinear2, svmradial and svmpoly, respectively), Random Forest (rf), Linear Discriminant Analysis (lda2), High Dimensional Discriminant Analysis (hdda), Gradient Boosting Machine (gbm), Extreme Gradient Boosting (xgbtree and xgblinear), Bayesian Generalized Linear Model (bayesglm), and Artificial Neural Networks (avNNet). These algorithms were selected for their capacity to manage complex relationships in the data and provide robust predictions. For details on these algorithms and their parameters, see Table S1 of the Supplementary Material.
The dataset (n = 760) was partitioned into training (70%, n = 533) and testing (30%, n = 227) datasets, ensuring equal proportions of AD cases and healthy controls in these partitions. Imputation was conducted separately in these data partitions. Hyperparameter tuning of ML algorithms was performed using grid-search in the training data following the implementation of the train() function in caret.
The performance of each ML algorithm was evaluated using accuracy metrics derived from the cross-validation process [38,39]. Each ML-based model was evaluated using several performance metrics for binary classifiers, including the accuracy, the Receiver Operating Characteristic (ROC) curve, and the area under the ROC curve (AUC), sensitivity, specificity, precision, lift, negative predictive value and positive predictive value. These metrics assess how well the model predictions align with actual outcomes.
2.4. Construction of Neuropsychological Protocols
We optimized four neuropsychological protocols for AD screening using ML. Protocol #1 incorporated all neuropsychological variables in addition to demographic predictors including sex, age, and years of education as predictors. The ML algorithm with the highest diagnostic accuracy in the training dataset was retained for further analysis. Variable importance was then evaluated with this model to rank the contribution of each neuropsychological measure, and the five most informative variables were identified. These five top predictors formed the basis of Protocol 2, the ICN-UN Neuropsychological Battery.
Protocol #3 was developed using the one-rule (OneR) ML, implemented through the OneR package version 2.2 [40] in R. This algorithm creates one-rule models for each predictor in the dataset and selects the single most predictive attribute for the outcome variable of interest [41]. In this case, neuropsychological variables served as predictors of AD diagnosis (0: control; 1: case). The protocol included the top five neuropsychological variables with the highest accuracy for AD diagnosis identified using OneR.
Protocol #4 was developed by calculating the Predictive Power Score (PPS) [42] for each neuropsychological variable to assess their relevance in AD diagnosis. The PPS quantifies the strength and quality of predictive relationships, capturing both non-linear and asymmetric associations, making it particularly useful for identifying key variables in complex predictive modeling. We used the ppsr package version 0.0.5 (van der Laken, 2024 [42]) of R to compute these scores. The protocol incorporated the five neuropsychological variables with the highest PPS for discriminating AD. Additionally, given the diagnostic value of the BNT and RAVLT for AD diagnosis [10,11,12], we also developed separate protocols assessing the contribution of each of these tests.
2.4.1. Compactness, Cohesion and Separation of Neuropsychological Protocols
We assessed the compactness of individuals diagnosed with AD and healthy controls for each protocol by calculating the compactness coefficient using the diceR [43,44] package version 3.1.0 of R. This internal validation index quantifies cluster quality based on the compactness (cohesion within clusters) and separability (distinctness between clusters) between groups; lower values indicate a better-defined clustering structure. To further evaluate the protocols, we computed the silhouette coefficient using the silhouette() function from the cluster [45] package version 2.1.8.1 of R. The silhouette coefficient ranges from −1 to +1, with higher values indicating greater cohesion within clusters and clearer separation from other groups [45,46]. Values near 0 suggest that the individual lies near the boundary between clusters, and negative values imply potential misclassification.
2.4.2. Explainability of ML-Based Predictions
Partial dependence plots (PDPs) [27] help interpret complex black-box models by revealing the nature of the relationship between features and the target variable, including linearity, monotonicity, or more intricate patterns. Using the pdp package version 0.8.2 [47,48] in R, we generated PDPs to visualize the marginal effect of one or two features on the model’s predicted outcome while averaging over the remaining features.
3. Results
3.1. Participants
We collected data from 760 individuals (477 [63.2%] female; 394 [51.8%] diagnosed with AD) through clinical evaluations, family histories, comprehensive neurological and neuropsychological clinical examinations, and structured interviews. The Universidad del Norte Ethics Committee approved this study (Project Approval Act #198 of 31 October 2019). Table 1 summarizes the demographic characteristics of our sample.

Table 1.
Demographic characteristics of individuals included in this study.
We found statistically significant differences in the average age at the time of inclusion, with AD individuals up to 5 years older than healthy controls (AD: 78.9 ± 7.51; Controls: 74.29 ± 6.41, p < 0.001; Table 1), and in the gender distribution (.84, p = 0.027; Table 1). Interestingly, 67% of the patients with AD were women, compared to 59% in the control group. However, no statistically significant difference was identified in the average years of education (schooling) between the comparison groups (AD: 8.85 ± 14.67; Controls: 9.21 ± 13.48; p = 0.723; Table 1).
Table 2 presents the results of comparing the neuropsychological tests between the groups included in this study. Several tests showed statistically significant differences between groups, indicating their potential relevance for distinguishing individuals with an AD diagnosis in a predictive model.
Table 2.
Neuropsychological characteristics of individuals included in this study.
3.2. ML-Optimized Protocols for AD Diagnosis
We evaluated the performance of 18 ML algorithms to construct a predictive framework for AD diagnosis based on the demographic variables and the full neuropsychological protocol (that is, Protocol #1). The main results of this approach are presented in Figure 1.
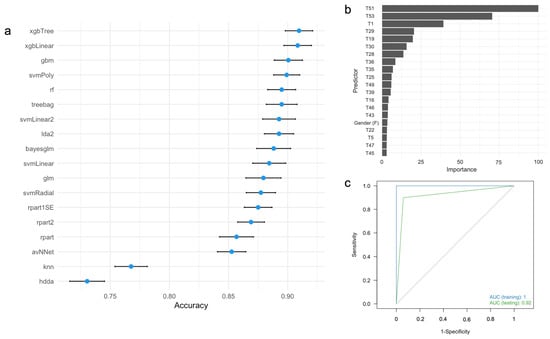
Figure 1.
(a) Accuracy and 95% confidence intervals for predicting AD diagnosis using different ML algorithms based on full neuropsychological protocol. (b) Variable importance analysis for the xgbTree algorithm. (c) ROC curves for the xgbTree algorithm in the training (blue) and testing (green) datasets. ROC, receiver operating characteristic; AUC, area under the ROC curve. For the labels of the predictors, see Table 2.
In the training dataset, the xgbTree, xgLinear, and gbm algorithms demonstrated the best performance, while hdda and knn showed the lowest (Figure 1a). Variable importance analysis of the xgbTree algorithm identified the five most influential neuropsychological measures as T51 (Lawton and Brody test), T53 (FAST), T1 (MMSE), T29 (Rey Auditory Verbal Memory Recognition, Yes), and T19 (Recall of the ROCFT) (Figure 1b). Although years of education and age were included as predictors, these demographic variables are not relevant contributors to AD diagnosis. Figure 1c shows the ROC curves for both training and testing datasets for Protocol #1. In the clinical setting, this protocol takes 4 h (240 min) to be completed (Table 3). Overall, this protocol demonstrated excellent ability to distinguish individuals with AD from healthy controls in both the training and testing datasets (Table 3).
Table 3.
Performance of protocols for AD diagnosis in the training and testing datasets.
The top five predictors identified in Protocol #1 were subsequently used to develop Protocol #2. Consistency analyses revealed that these predictors were robustly selected across multiple data splits, underscoring their reliability (see Figure S2 in the Supplementary Material). Despite including significantly fewer variables than Protocol #1, Protocol #2 maintains strong discriminatory power to differentiate individuals diagnosed with AD from healthy controls (Table 3). Implementing Protocol #2 in the clinical setting drastically reduces the evaluation time from 240 min (4 h) to 25 min (Table 3).
The application of the OneR algorithm identified the neuropsychological variables T51, T53, T1, T19, and T28 as the most accurate predictors of AD diagnosis when used independently (Table 4a). These variables were subsequently included in Protocol #3. Other neuropsychological variables include T27, T25, T43, T23 and T3. Our results demonstrate that the xgbTree ML model, fitted to this protocol with these predictors, effectively distinguished individuals diagnosed with AD from those without the diagnosis while significantly reducing the evaluation time (Protocol #3, Table 3). Compared to the current neuropsychological protocol (Protocol #1), implementing Protocol #3 significantly reduces the evaluation time, on average, to 35 min (Protocol #3, Table 3)
Table 4.
Top 10 features for classifying individuals with AD based on (a) the OneR algorithm and (b) the PPS methods.
We identified the neuropsychological variables T4, T10, T13, and T16 as those with the highest PPS (Table 2 and Table 4b). In addition to gender and schooling, other relevant neuropsychological variables include T45, T8, T7 and T32 (Table 2 and Table 4b). While significantly reducing the average evaluation time to 25 min for participants, the xgbTree ML model fitted to Protocol #4 performs poorly for differentiating individuals with AD from healthy controls (Table 3).
Overall, the performance metrics based on the xgbTree algorithm showed that Protocol #1, which includes all neuropsychological measurements, achieved the best overall performance. Specifically, its testing accuracy was 0.92, outperforming the other evaluation protocols (Table 3). Similarly, its specificity of 0.90 exceeded the 0.88 and 0.87 observed in Protocols #2 and #3, respectively. Protocol #1 also demonstrated higher AUC values compared to the others (0.92 versus 0.91 for Protocol #2 and 0.90 for Protocol #3). In terms of sensitivity, Protocol #1 scored 0.94, matching the sensitivity values of Protocols #2 and #3. On the other hand, Protocol #4, along with the BTN and RAVLT, consistently performed worse across all metrics compared to Protocols #1, #2, and #3 despite reducing the average evaluation time to only 25 min (Table 3). Although the metrics of Protocol #2 were slightly lower than those of Protocol #1, the difference was minimal, particularly in sensitivity values. However, the reduction in the average evaluation time from 240 min (4 h) to only 25 min makes it a suitable alternative in the clinical setting.
3.3. Compactness, Cohesion and Separation of Individuals of by Neuropsychological Protocol
Table 5 presents the compactness and average silhouette coefficients to evaluate the compactness, cohesion, and separation of individuals according to each ML-optimized neuropsychological protocol.
Table 5.
Compactness, average silhouette coefficients and accuracy in the testing dataset for the ML-optimized neuropsychological protocols. Rank is shown in ().
Our results suggest that Protocol #4 provides the greatest compactness of individuals, followed by Protocols #2 and #3. In contrast, the full protocol and those based on specific neuropsychological tests (BNT and RAVLT) do not demonstrate the same level of performance. Meanwhile, Protocol #2, constructed using the top five predictors identified by the xgbTree algorithm, exhibits the highest silhouette coefficient, followed by Protocol #3, RAVLT, Protocol #1, BNT, and Protocol #4. This finding indicates that reducing the full protocol to only the top 5 predictors substantially improve the distribution of individuals within our sample (Table 5).
3.4. ML Explainability of the ICN-UN Battery
Our results support that Protocol #2, namely the ICN-UN Neuropsychological Battery, outperforms all other ML-optimized protocols evaluated in this study (Table 3 and Table 5). This protocol comprises the T53 (FAST), T51 (Lawton & Brody Scale), T1 (MMSE) and T29 (Rey Auditory Verbal Memory Recognition, “Yes”) and T19 (Recall in the ROCFT) variables (Table 2 and Table 3).
According to the ML-based predictive model for AD status, ML explainability analyses via PDPs reveal notable patterns in the relationship between test scores and the probability of an AD diagnosis (Figure 2). Specifically, having at least four points on test T53 corresponds to a probability of AD diagnosis exceeding 70% (Figure 2a).
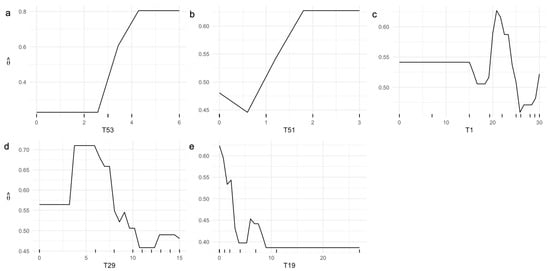
Figure 2.
Univariate PDPs illustrating the probability of AD diagnosis, , as the (a) T53, (b) T51, (c) T1, (d) T29, and (e) T19 test scores of the ICN-UN Neuropsychological Battery independently vary.
Similarly, scoring one or more points on test T51 yields a probability above 50% for a positive AD diagnosis (Figure 2b). Analysis of T1 indicates that scores between 20 and 25 points are associated with the highest probability of an AD diagnosis, whereas scores greater than 25 points reduce this probability (Figure 2c). Furthermore, scores above 10 points on T29 (Figure 2d) or below 3 points on T19 (Figure 2e) are indicative of a negative AD diagnosis.
Figure 3 demonstrates that the combined effect of specific neuropsychological test scores significantly influences the probability of AD diagnosis. Scores where T53 exceeds 3 combined with T51 greater than 1 produce a probability higher than 0.7 (Figure 3a), and when T53 exceeds 3 alongside T1 scores above 15, the probability increases to over 0.8 (Figure 3b). More stringent combinations, such as T53 greater than 3 with T29 between 3 and 8, yield a probability exceeding 0.9 (Figure 3c). Similarly, T53 > 3 combined with T19 < 3 leads to a probability greater than 0.8 (Figure 3d). Additional combinations involving T51 > 1 with T1 in the 20–25 range (Figure 3e), T51 > 1 with 4 < T9 < 8 (Figure 3f), and T51 > 1 with T19 < 3 (Figure 3g) result in probabilities ranging from 0.7 to 0.8. Furthermore, pairs such as T1 between 20 and 25 with 4 < T29 < 8 (Figure 3h), T1 in the same range with T19 < 4 (Figure 3i), and 4 < T29 < 6 with T19 < 4 (Figure 3j) consistently generate probabilities above 0.75, emphasizing the importance of combined neuropsychological scores in AD diagnostic prediction.
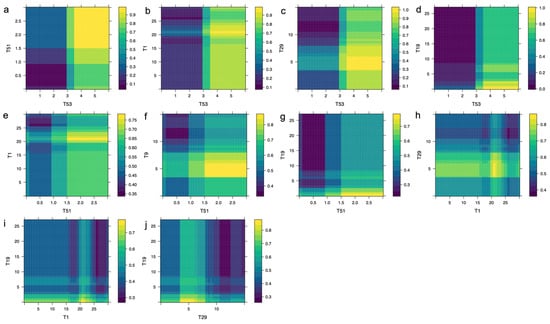
Figure 3.
Bivariate PDPs illustrating the probability of AD diagnosis, , as (a) T53 and T51, (b) T53 and T1, (c) T53 and T29, (d) T53 and T19, (e) T51 and T1, (f) T51 and T9, (g) T51 and T19, (h) T1 and T29, (i) T1 and T19, and (j) T29 and T19 neuropsychological tests of the proposed battery simultaneously vary. Higher values of are shown in yellow.
4. Discussion
Early and accurate diagnosis of individuals with Alzheimer’s disease (AD) is critical for timely intervention, slowing disease progression, and improving patients’ quality of life [49,50]. However, current diagnostic protocols rely heavily on a combination of neuropsychological assessments and neuroimaging (e.g., MRI, PET scans) [11,15,51], which are both costly and time-consuming [13]. These challenges create significant barriers to widespread adoption, particularly in low- and middle-income countries (LMICs), where healthcare resources are often limited [52]. Therefore, developing streamlined cost-effective screening tools is crucial to improve accessibility and scalability in underserved populations.
In this study, we evaluated streamlined neuropsychological screening protocols for AD diagnosis using data from the Alzheimer’s Disease SGR Study in Barranquilla, Colombia [31]. Our results show that these abbreviated protocols achieve diagnostic accuracy comparable to the comprehensive protocol currently used in clinical practice.
The adoption of simplified protocols can greatly reduce assessment time without compromising precision. Such protocols could improve clinical efficiency, reduce patient and clinician burden, improve patient adherence, and optimize healthcare resource use. Importantly, they support broader and earlier AD detection, particularly in low-income communities where access to healthcare professionals is limited and poverty impedes early AD diagnosis [3]. In that sense, a streamlined assessment protocol aligns with the goals of international organizations to expand representation of these populations in AD research [52].
Our results demonstrate a significant reduction in evaluation time using the ML-optimized ICN-UN battery compared to traditional protocols (Table 3). Specifically, the comprehensive neuropsychological assessment protocol currently used in clinical settings requires approximately 240 min (4 h) to complete. In contrast, the ICN-UN ML-optimized battery, which retains high diagnostic accuracy, reduces the total assessment time to under 25 min—representing a nine-fold reduction in time from start to finish. Other abbreviated protocols tested in our study required between 25 and 35 min (Table 3), but perform poorly in terms of cohesion, compactness and separation of individuals (Table 5 and Figure S1 of the Supplementary Material). The time saved by implementing the streamlined battery translates into significant improvements in clinical efficiency, reduced burden for both patients and clinicians, and enables the assessment of more individuals within the same timeframe. This reduction in evaluation time can be especially beneficial in low-resource settings, where clinical capacity and patient adherence are key barriers to early diagnosis of AD.
The collection of ML algorithms assessed in this study achieved precision and sensitivity rates above 90%, surpassing benchmarks set by other studies about AD detection (see Table S2 of the Supplementary Material) [8,52,53,54]. Those studies evaluated only a limited number of algorithms, leaving it unclear whether other methods might perform better. In contrast, the high accuracy demonstrated by our models indicates that these selected algorithms are highly effective in detecting AD, outperforming the BNT (Table 3). This suggests they hold significant potential as supportive tools for healthcare professionals in clinical settings. According to the performance, compactness, and cohesion and separation performance measures, Protocol #2 (i.e., the ICN-UN Neuropsychological Battery) is recommended to assess AD diagnosis in this population (Table 5).
Key strengths of this study include a wide array of neuropsychological tests that was included, allowing for comprehensive cognitive function assessment. Evaluating multiple machine learning models enabled rigorous comparison and selection of the most accurate protocol for AD detection. Despite these positive implications, the study has some limitations. The sample size, though balanced, may not fully represent the general population, warranting future studies with larger and more diverse samples to validate the generalizability of results. Moreover, the study primarily focused on AD detection, suggesting future research could explore the applicability of the ICN-UN neuropsychological battery to distinguishing AD from other types of dementia or even mild cognitive impairment. Longitudinal studies are recommended to assess the protocol’s predictive validity over time, providing valuable insights into its effectiveness across different disease stages.
Although the findings of this study are promising (i.e., our ML-optimized neuropsychological protocols can achieve high diagnostic accuracy with just five key measures; Table 3), further validation in other populations is needed. The current dataset, derived from a cohort of older adults residing in Barranquilla, Colombia, may not fully capture the ethnic, cultural, and educational heterogeneity of other regions, potentially limiting the generalizability of the protocol. Hence, external validation across varying geographic and sociodemographic contexts is crucial to confirm the model’s efficacy and ensure its applicability in low-resource settings [55], particularly in understudied populations.
5. Conclusions
We have developed streamlined neuropsychological assessment protocols for AD detection that achieved high performance metrics in our sample of individuals diagnosed with sporadic AD from the Atlántico Department of Colombia (see Table 3).
Our results suggest that the ML-optimized protocol can offer a more time-efficient alternative to traditional assessments, reducing evaluation time while maintaining comparable diagnostic quality in our sample. This approach has the potential to benefit clinical practice by reducing the time and costs associated with comprehensive neuropsychological assessments, ultimately facilitating earlier and more accessible AD diagnosis. Based on the measures of compactness, cohesion, and separation, Protocol #2 (the ICN-UN Neuropsychological Battery) is the preferred method for assessing AD diagnosis in this population, as it reduced the evaluation time from 240 to 25 min while maintaining an accuracy of 92%, sensitivity of 94%, specificity of 90%, and an AUC of 0.92 (Table 3). This protocol also demonstrated strong compactness, high cohesion and separation, and robust differentiation between individuals with AD and healthy controls (Table 5 and Figure S1 of the Supplementary Material). These results indicate that streamlined protocols can substantially decrease assessment duration without compromising AD diagnostic performance. Implementing this reduced protocol in clinical settings could improve the quality of care and enable more timely and effective interventions for individuals with AD.
Despite these promising results, our study has some limitations. The findings are based on a regional cohort, and broader validation in larger and more diverse populations is necessary to confirm the generalizability and clinical utility of the proposed protocol. Future work should include external validation of the streamlined battery in independent and diverse cohorts, as well as prospective implementation studies to confirm its clinical utility across different healthcare settings.
Supplementary Materials
The following supporting information can be downloaded at: https://www.mdpi.com/article/10.3390/diagnostics15233045/s1, Table S1. ML algorithms used to predict Alzheimer’s disease (AD) diagnosis. Figure S1. Correlation between (a) accuracy and compactness (r = 0.372, p = 0.467), and (b) accuracy and the silhouette coefficient (r = 0.856, p = 0.029) for the proposed neuropsychological protocols. The ICN-UN Neuropsychological Battery is shown in green. For more information see Table 3 in the main manuscript. BNT, Boston Naming Test; RAVLT, Rey Auditory Verbal Learning test. Figure S2. Trace plots illustrating the variable importance scores for predictors included in the ICN-UN Neu-ropsychological Battery (Protocol #2). A robust sampling procedure involving 500 random samples was per-formed based on the xgbTree ML algorithm. For each sample, variable importance was quantified through a cross-validation approach on the training dataset. The mean (M) ± standard deviation (SD) variable importance for the top predictors were as follows: T53: 93.7 ± 11.6, T51: 76.8 ± 25.7, T19: 29.2 ± 9.5, T29: 23.0 ± 4.6, and T1: 25.2 ± 18.9. See Table 1 in the main document for detailed descriptions of the neuropsychological variables. Table S2. Research papers in Web of Science (WoS) assessing the performance of ML algorithms for AD diag-nosis. In this case, the query “Alzheimer’s disease (Title) AND neuropsychology (Topic) AND diagnosis (Topic) AND battery (Topic) and Article (Document Types) and 2020 or 2021 or 2022 or 2023 or 2024 or 2025 (Publication Years) and Article (Document Types)” was used. Research papers assessing the diagnosis of AD using neuropsychological variables and ML-based classification models are highlighted in green.
Author Contributions
Conceptualization, E.B., P.G.-G. and J.I.V.; methodology, E.B., D.R. and J.I.V.; software, D.R. and J.I.V.; validation, E.B., D.R., R.A., M.A.-B., P.G.-G. and J.I.V.; formal analysis, D.R. and J.I.V. investigation, E.B., R.A., E.M., M.I.M.-H., O.M.V., C.S.-R., P.G.-G. and J.I.V.; resources, M.I.M.-H., P.G.-G. and J.I.V.; data curation, E.B., D.R., E.M., M.I.M.-H. and J.I.V.; writing—original draft preparation, D.R. and J.I.V.; writing—review and editing, E.B., M.A.-B. and J.I.V.; visualization, D.R. and J.I.V.; supervision, E.B., P.G.-G. and J.I.V.; project administration, P.G.-G. and J.I.V.; funding acquisition, M.I.M.-H., P.G.-G. and J.I.V. All authors have read and agreed to the published version of the manuscript.
Funding
This study was financed by the Sistema General de Regalías (SGR) de Colombia, project “Desarrollo de un modelo basado en inteligencia artificial como instrumento de predicción de la Enfermedad de Alzheimer esporádica y su velocidad de progresión en el departamento del Atlántico”, code BPIN 2020000100449, awarded to Grupo de Productividad y Competitividad and Grupo de Genética y Medicina Molecular, Universidad del Norte, Barranquilla, Colombia.
Institutional Review Board Statement
This study was conducted by the tenets of the Declaration of Helsinki and approved by the Ethics Committee of Universidad del Norte, Barranquilla, Colombia (Project Approval Act #198 of 31 October 2019).
Informed Consent Statement
Informed written consent was obtained from all individuals who participated voluntarily in this study.
Data Availability Statement
The data presented in this study are available upon reasonable request from the corresponding authors. They are not publicly available due to the ongoing nature of the study and our commitment to protecting the privacy and confidentiality of our patients.
Acknowledgments
We are deeply grateful to all the individuals, their families, and caregivers who have generously volunteered to participate in our ongoing research on Alzheimer’s disease. The APC was funded by Universidad del Norte, Barranquilla, Colombia.
Conflicts of Interest
The authors declare no conflicts of interest. As expected, the funders had no role in the study’s design, data collection, analysis, interpretation, manuscript writing, or decision to publish the results.
Abbreviations
The following abbreviations are used in this manuscript:
| AD | Alzheimer’s Disease |
| AUC | Area Under the Receiver Operating Characteristic Curve |
| BNT | Boston Naming Test |
| CART | Classification and Regression Trees |
| FAST | Functional Assessment Staging Test |
| LMICs | Low- and Middle-Income Countries |
| ML | Machine Learning |
| MMSE | Mini-Mental State Examination |
| MoCA | Montreal Cognitive Assessment |
| NPV | Negative Predictive Value |
| PPS | Predictive Power Score |
| PPV | Positive Predictive Value |
| RAVLT | Rey Auditory Verbal Learning Test |
| RF | Random Forest |
| ROC | Receiver Operating Characteristic |
| ROCFT | Rey–Osterrieth Complex Figure Test |
| Se | Sensitivity |
| Sp | Specificity |
| SVM | Support Vector Machines |
| TMT | Trail Making Test |
| WCST | Wisconsin Card Sorting Test |
References
- World Health Organization. World Failing to Address Dementia Challenge. Available online: https://www.who.int/news/item/02-09-2021-world-failing-to-address-dementia-challenge (accessed on 17 November 2025).
- World Health Organization. Dementia. Available online: https://www.who.int/news-room/fact-sheets/detail/dementia (accessed on 17 November 2025).
- Kerwin, D.; Abdelnour, C.; Caramelli, P.; Ogunniyi, A.; Shi, J.; Zetterberg, H.; Traber, M. Alzheimer’s Disease Diagnosis and Management: Perspectives from around the World. Alzheimer’s Dement. Diagn. Assess. Dis. Monit. 2022, 14, e12334. [Google Scholar] [CrossRef]
- Allegri, R.F. Dementia Research in Low-Income and Middle-Income Countries—A View from Latin America. Nat. Rev. Neurol. 2025, 21, 499–505. [Google Scholar] [CrossRef]
- Costanzo, M.; Cutrona, C.; Leodori, G.; Malimpensa, L.; D’antonio, F.; Conte, A.; Belvisi, D. Exploring Easily Accessible Neurophysiological Biomarkers for Predicting Alzheimer’s Disease Progression: A Systematic Review. Alzheimers Res. Ther. 2024, 16, 244. [Google Scholar] [CrossRef]
- Battista, P.; Salvatore, C.; Castiglioni, I. Optimizing Neuropsychological Assessments for Cognitive, Behavioral, and Functional Impairment Classification: A Machine Learning Study. Behav. Neurol. 2017, 2017, 1850909. [Google Scholar] [CrossRef]
- Garcia-Gutierrez, F.; Delgado-Alvarez, A.; Delgado-Alonso, C.; Díaz-Álvarez, J.; Pytel, V.; Valles-Salgado, M.; Gil, M.J.; Hernández-Lorenzo, L.; Matías-Guiu, J.; Ayala, J.L.; et al. Diagnosis of Alzheimer’s Disease and Behavioural Variant Frontotemporal Dementia with Machine Learning-Aided Neuropsychological Assessment Using Feature Engineering and Genetic Algorithms. Int. J. Geriatr. Psychiatry 2022, 37, 1–13. [Google Scholar] [CrossRef]
- Gurevich, P.; Stuke, H.; Kastrup, A.; Stuke, H.; Hildebrandt, H. Neuropsychological Testing and Machine Learning Distinguish Alzheimer’s Disease from Other Causes for Cognitive Impairment. Front. Aging Neurosci. 2017, 9, 114. [Google Scholar] [CrossRef] [PubMed]
- Martínez-Banfi, M.; Vélez, J.I.; Perea, M.V.; García, R.; Puentes-Rozo, P.J.; Mebarak Chams, M.; Ladera, V. Neuropsychological Performance in Patients with Asymptomatic HIV-1 Infection. AIDS Care-Psychol. Socio-Med. Asp. AIDS/HIV 2018, 30, 623–633. [Google Scholar] [CrossRef] [PubMed]
- Belleville, S.; Fouquet, C.; Hudon, C.; Zomahoun, H.T.V.; Croteau, J. Neuropsychological Measures That Predict Progression from Mild Cognitive Impairment to Alzheimer’s Type Dementia in Older Adults: A Systematic Review and Meta-Analysis. Neuropsychol. Rev. 2017, 27, 328–353. [Google Scholar] [CrossRef] [PubMed]
- Eckerström, C.; Olsson, E.; Bjerke, M.; Malmgren, H.; Edman, Å.; Wallin, A.; Nordlund, A. A Combination of Neuropsychological, Neuroimaging, and Cerebrospinal Fluid Markers Predicts Conversion from Mild Cognitive Impairment to Dementia. J. Alzheimer’s Dis. 2013, 36, 421–431. [Google Scholar] [CrossRef]
- Salimi, S.; Irish, M.; Foxe, D.; Hodges, J.R.; Piguet, O.; Burrell, J.R. Can Visuospatial Measures Improve the Diagnosis of Alzheimer’s Disease? Alzheimer’s Dement. Diagn. Assess. Dis. Monit. 2018, 10, 66–74. [Google Scholar] [CrossRef]
- Davis, J.J. Time Is Money: Examining the Time Cost and Associated Charges of Common Performance Validity Tests. Clin. Neuropsychol. 2023, 37, 475–490. [Google Scholar] [CrossRef]
- Kamini; Rani, S. Machine Learning Models for Diagnosing Alzheimer’s Disorders. In Data Analysis for Neurodegenerative Disorders; Cognitive Technologies Series; Springer: Singapore, 2023. [Google Scholar]
- Aghdam, M.A.; Bozdag, S.; Saeed, F. Alzheimer’s Disease Diagnosis Using Gray Matter of T1-weighted SMRI Data and Vision Transformer. Alzheimer’s Dement. 2024, 20, e089944. [Google Scholar] [CrossRef]
- Nasreddine, Z.S.; Phillips, N.A.; Bédirian, V.; Charbonneau, S.; Whitehead, V.; Collin, I.; Cummings, J.L.; Chertkow, H. The Montreal Cognitive Assessment, MoCA: A Brief Screening Tool For Mild Cognitive Impairment. J. Am. Geriatr. Soc. 2005, 53, 695–699. [Google Scholar] [CrossRef]
- Sonkurt, H.O.; Altınöz, A.E.; Çimen, E.; Köşger, F.; Öztürk, G. The Role of Cognitive Functions in the Diagnosis of Bipolar Disorder: A Machine Learning Model. Int. J. Med. Inform. 2021, 145, 104311. [Google Scholar] [CrossRef]
- Vaccaro, M.G.; Sarica, A.; Quattrone, A.; Chiriaco, C.; Salsone, M.; Morelli, M.; Quattrone, A. Neuropsychological Assessment Could Distinguish among Different Clinical Phenotypes of Progressive Supranuclear Palsy: A Machine Learning Approach. J. Neuropsychol. 2021, 15, 301–318. [Google Scholar] [CrossRef] [PubMed]
- Bledsoe, J.C.; Xiao, C.; Chaovalitwongse, A.; Mehta, S.; Grabowski, T.J.; Semrud-Clikeman, M.; Pliszka, S.; Breiger, D. Diagnostic Classification of ADHD Versus Control: Support Vector Machine Classification Using Brief Neuropsychological Assessment. J. Atten. Disord. 2020, 24, 1547–1556. [Google Scholar] [CrossRef] [PubMed]
- Javeed, A.; Dallora, A.L.; Berglund, J.S.; Ali, A.; Ali, L.; Anderberg, P. Machine Learning for Dementia Prediction: A Systematic Review and Future Research Directions. J. Med. Syst. 2023, 47, 17. [Google Scholar] [CrossRef]
- Derbentsev, V.; Matviychuk, A.; Datsenko, N.; Bezkorovainyi, V.; Azaryan, A. Machine Learning Approaches for Financial Time Series Forecasting. In Proceedings of the CEUR Workshop Proceedings, 2020; Volume 2713. Available online: https://www.semanticscholar.org/paper/Machine-learning-approaches-for-financial-time-Derbentsev-Matviychuk/d5e437f2cdfe3d845ae5624215cf2444fe8d572b (accessed on 21 November 2025).
- Jasti, V.D.P.; Zamani, A.S.; Arumugam, K.; Naved, M.; Pallathadka, H.; Sammy, F.; Raghuvanshi, A.; Kaliyaperumal, K. Computational Technique Based on Machine Learning and Image Processing for Medical Image Analysis of Breast Cancer Diagnosis. Secur. Commun. Netw. 2022, 2022, 1918379. [Google Scholar] [CrossRef]
- Almubark, I.; Chang, L.C.; Nguyen, T.; Turner, R.S.; Jiang, X. Early Detection of Alzheimer’s Disease Using Patient Neuropsychological and Cognitive Data and Machine Learning Techniques. In Proceedings of the 2019 IEEE International Conference on Big Data, Big Data 2019, Los Angeles, CA, USA, 9–12 December 2019. [Google Scholar]
- Buyrukoglu, S. Improvement of Machine Learning Models Performances Based on Ensemble Learning for the Detection of Alzheimer Disease. In Proceedings of the 6th International Conference on Computer Science and Engineering, UBMK 2021, Ankara, Turkey, 15–17 September 2021. [Google Scholar]
- Sadeghi, Z.; Alizadehsani, R.; CIFCI, M.A.; Kausar, S.; Rehman, R.; Mahanta, P.; Bora, P.K.; Almasri, A.; Alkhawaldeh, R.S.; Hussain, S.; et al. A Review of Explainable Artificial Intelligence in Healthcare. Comput. Electr. Eng. 2024, 118, 109370. [Google Scholar] [CrossRef]
- Lundberg, S.M.; Lee, S.I. A Unified Approach to Interpreting Model Predictions. In Proceedings of the Advances in Neural Information Processing Systems, Long Beach, CA, USA, 4–9 December 2017; Volume 2017. [Google Scholar]
- Friedman, J.H. Greedy Function Approximation: A Gradient Boosting Machine. Ann. Stat. 2001, 29, 1189–1232. [Google Scholar] [CrossRef]
- Vlontzou, M.E.; Athanasiou, M.; Dalakleidi, K.V.; Skampardoni, I.; Davatzikos, C.; Nikita, K. A Comprehensive Interpretable Machine Learning Framework for Mild Cognitive Impairment and Alzheimer’s Disease Diagnosis. Sci. Rep. 2025, 15, 8410. [Google Scholar] [CrossRef]
- Das, D.; Ito, J.; Kadowaki, T.; Tsuda, K. An Interpretable Machine Learning Model for Diagnosis of Alzheimer’s Disease. PeerJ 2019, 2019, e6543. [Google Scholar] [CrossRef]
- Vimbi, V.; Shaffi, N.; Mahmud, M. Interpreting Artificial Intelligence Models: A Systematic Review on the Application of LIME and SHAP in Alzheimer’s Disease Detection. Brain Inform. 2024, 11, 10. [Google Scholar] [CrossRef]
- Universidad del Norte. Proyecto de Investigación En Alzheimer. Available online: https://www.uninorte.edu.co/web/hospital/proyecto-de-investigacion-en-alzheimer (accessed on 7 September 2025).
- BoIivar, D.; Mosquera Heredia, M.; Vidal, O.; Barceló, E.; Allegri, R.; Morales, L.; Silvera-Redondo, C.; Arcos-Burgos, M. Exosomal MRNA Signatures as Predictive Biomarkers for Risk and Age of Onset in Alzheimer’s Disease. Int. J. Mol. Sci. 2024, 25, 12293. [Google Scholar] [CrossRef] [PubMed]
- Mosquera-Heredia, M.I.; Vidal, O.M.; Morales, L.C.; Silvera-Redondo, C.; Barceló, E.; Allegri, R.; Arcos-Burgos, M.; Vélez, J.I.; Garavito-Galofre, P. Long Non-Coding RNAs and Alzheimer’s Disease: Towards Personalized Diagnosis. Int. J. Mol. Sci. 2024, 25, 7641. [Google Scholar] [CrossRef]
- Stekhoven, D.J.; Buehlmann, P. MissForest: Nonparametric Missing Value Imputation Using Random Forest. R Package Version 1.5. Bioinformatics 2012, 28, 112–118. [Google Scholar] [CrossRef] [PubMed]
- R Core Team. R: A Language and Environment for Statistical Computing [Computer Software]; R Core Team: Vienna, Austria, 2012. [Google Scholar]
- Kuhn, M. Package ‘caret’—Classification and Regression Training; CRAN Repository; R Core Team: Vienna, Austria, 2019. [Google Scholar]
- Kuhn, M. Building Predictive Models in R Using the Caret Package. J. Stat. Softw. 2008, 28, 1–26. [Google Scholar] [CrossRef]
- Ramezan, C.A.; Warner, T.A.; Maxwell, A.E. Evaluation of Sampling and Cross-Validation Tuning Strategies for Regional-Scale Machine Learning Classification. Remote Sens. 2019, 11, 185. [Google Scholar] [CrossRef]
- Naidu, G.; Zuva, T.; Sibanda, E.M. A Review of Evaluation Metrics in Machine Learning Algorithms. In Artificial Intelligence Application in Networks and Systems; Lecture Notes in Networks and Systems; Springer: Cham, Switzerland, 2023; Volume 724. [Google Scholar]
- von Jouanne-Diedrich, J. OneR: One Rule Machine Learning Classification Algorithm with Enhancements; R Core Team: Vienna, Austria, 2017. [Google Scholar]
- Holte, R.C. Very Simple Classification Rules Perform Well on Most Commonly Used Datasets. Mach. Learn. 1993, 11, 63–90. [Google Scholar] [CrossRef]
- van der Laken, P.; ppsr: Predictive Power Score. R Package Version 0.0.5. 2024. Available online: https://CRAN.R-project.org/package=ppsr (accessed on 1 July 2025). [CrossRef]
- Chiu, D.S.; Talhouk, A. DiceR: An R Package for Class Discovery Using an Ensemble Driven Approach. BMC Bioinform. 2018, 19, 11. [Google Scholar] [CrossRef] [PubMed]
- Chiu, D.; Talhouk, A. DiceR: Diverse Cluster Ensemble in R; CRAN: Contributed Packages; R Core Team: Vienna, Austria, 2017. [Google Scholar] [CrossRef]
- Maechler, M.; Rousseeuw, P.; Struyf, A.; Hubert, M.; Cluster: Cluster Analysis Basics and Extensions. R Package Version 2.1.8.1. Available online: https://CRAN.R-project.org/package=cluster (accessed on 9 September 2025).
- Rousseeuw, P.J. Silhouettes: A Graphical Aid to the Interpretation and Validation of Cluster Analysis. J. Comput. Appl. Math. 1987, 20, 53–65. [Google Scholar] [CrossRef]
- Greenwell, B.M. Pdp: An R Package for Constructing Partial Dependence Plots. R J. 2017, 9, 421–436. [Google Scholar] [CrossRef]
- Greenwell, B.M. Pdp: Partial Dependence Plots. Available online: https://CRAN.R-project.org/package=pdp (accessed on 10 September 2025).
- Nabosne, I.; da Cruz, R.C.; Borges, B.E.; The Importance of Early Detection of Alzheimer’s to Improve the Patient’s Quality of Life. In Eyes on Health Sciences V.02; Seven Editora: 2024. Available online: https://sevenpubl.com.br/editora/article/view/3534 (accessed on 21 November 2025).
- Parul; Singh, A.; Shukla, S. Novel Techniques for Early Diagnosis and Monitoring of Alzheimer’s Disease. Expert Rev. Neurother. 2025, 25, 29–42. [Google Scholar] [CrossRef]
- Castellazzi, G.; Cuzzoni, M.G.; Cotta Ramusino, M.; Martinelli, D.; Denaro, F.; Ricciardi, A.; Vitali, P.; Anzalone, N.; Bernini, S.; Palesi, F.; et al. A Machine Learning Approach for the Differential Diagnosis of Alzheimer and Vascular Dementia Fed by MRI Selected Features. Front. Neuroinform. 2020, 14, 25. [Google Scholar] [CrossRef]
- Sexton, C.; Snyder, H.M.; Chandrasekaran, L.; Worley, S.; Carrillo, M.C. Expanding Representation of Low and Middle Income Countries in Global Dementia Research: Commentary From the Alzheimer’s Association. Front. Neurol. 2021, 12, 633777. [Google Scholar] [CrossRef]
- Cazzolli, C.; Chierici, M.; Dallabona, M.; Guella, C.; Jurman, G. Neuropsychological Tests and Machine Learning: Identifying Predictors of MCI and Dementia Progression. Aging Clin. Exp. Res. 2025, 37, 79. [Google Scholar] [CrossRef]
- Goodwin, G.J.; Fonseca, J.; Mehrzad, S.; Cummings, J.L.; John, S.E. Classification of AD and BvFTD Using Neuropsychological and Neuropsychiatric Variables: A Machine Learning Study. Alzheimer’s Dement. 2025, 21, e70782. [Google Scholar] [CrossRef] [PubMed]
- Merkley, T.L.; Esopenko, C.; Zizak, V.S.; Bilder, R.M.; Strutt, A.M.; Tate, D.F.; Irimia, A. Challenges and Opportunities for Harmonization of Cross-Cultural Neuropsychological Data. Neuropsychology 2023, 37, 237–246. [Google Scholar] [CrossRef] [PubMed]
Disclaimer/Publisher’s Note: The statements, opinions and data contained in all publications are solely those of the individual author(s) and contributor(s) and not of MDPI and/or the editor(s). MDPI and/or the editor(s) disclaim responsibility for any injury to people or property resulting from any ideas, methods, instructions or products referred to in the content. |
© 2025 by the authors. Licensee MDPI, Basel, Switzerland. This article is an open access article distributed under the terms and conditions of the Creative Commons Attribution (CC BY) license (https://creativecommons.org/licenses/by/4.0/).