
Ultrasonography Elastography to Predict the Diagnosis, Severity, and Treatment Indication of Esophageal Varices in Patients with Chronic Liver Diseases


 , , and
Abstract
1. Introduction
2. Patients and Methods
2.1. Study Design
2.2. Study Population
2.3. EGD
2.4. Definition of EVs
2.5. Ultrasonography Procedure
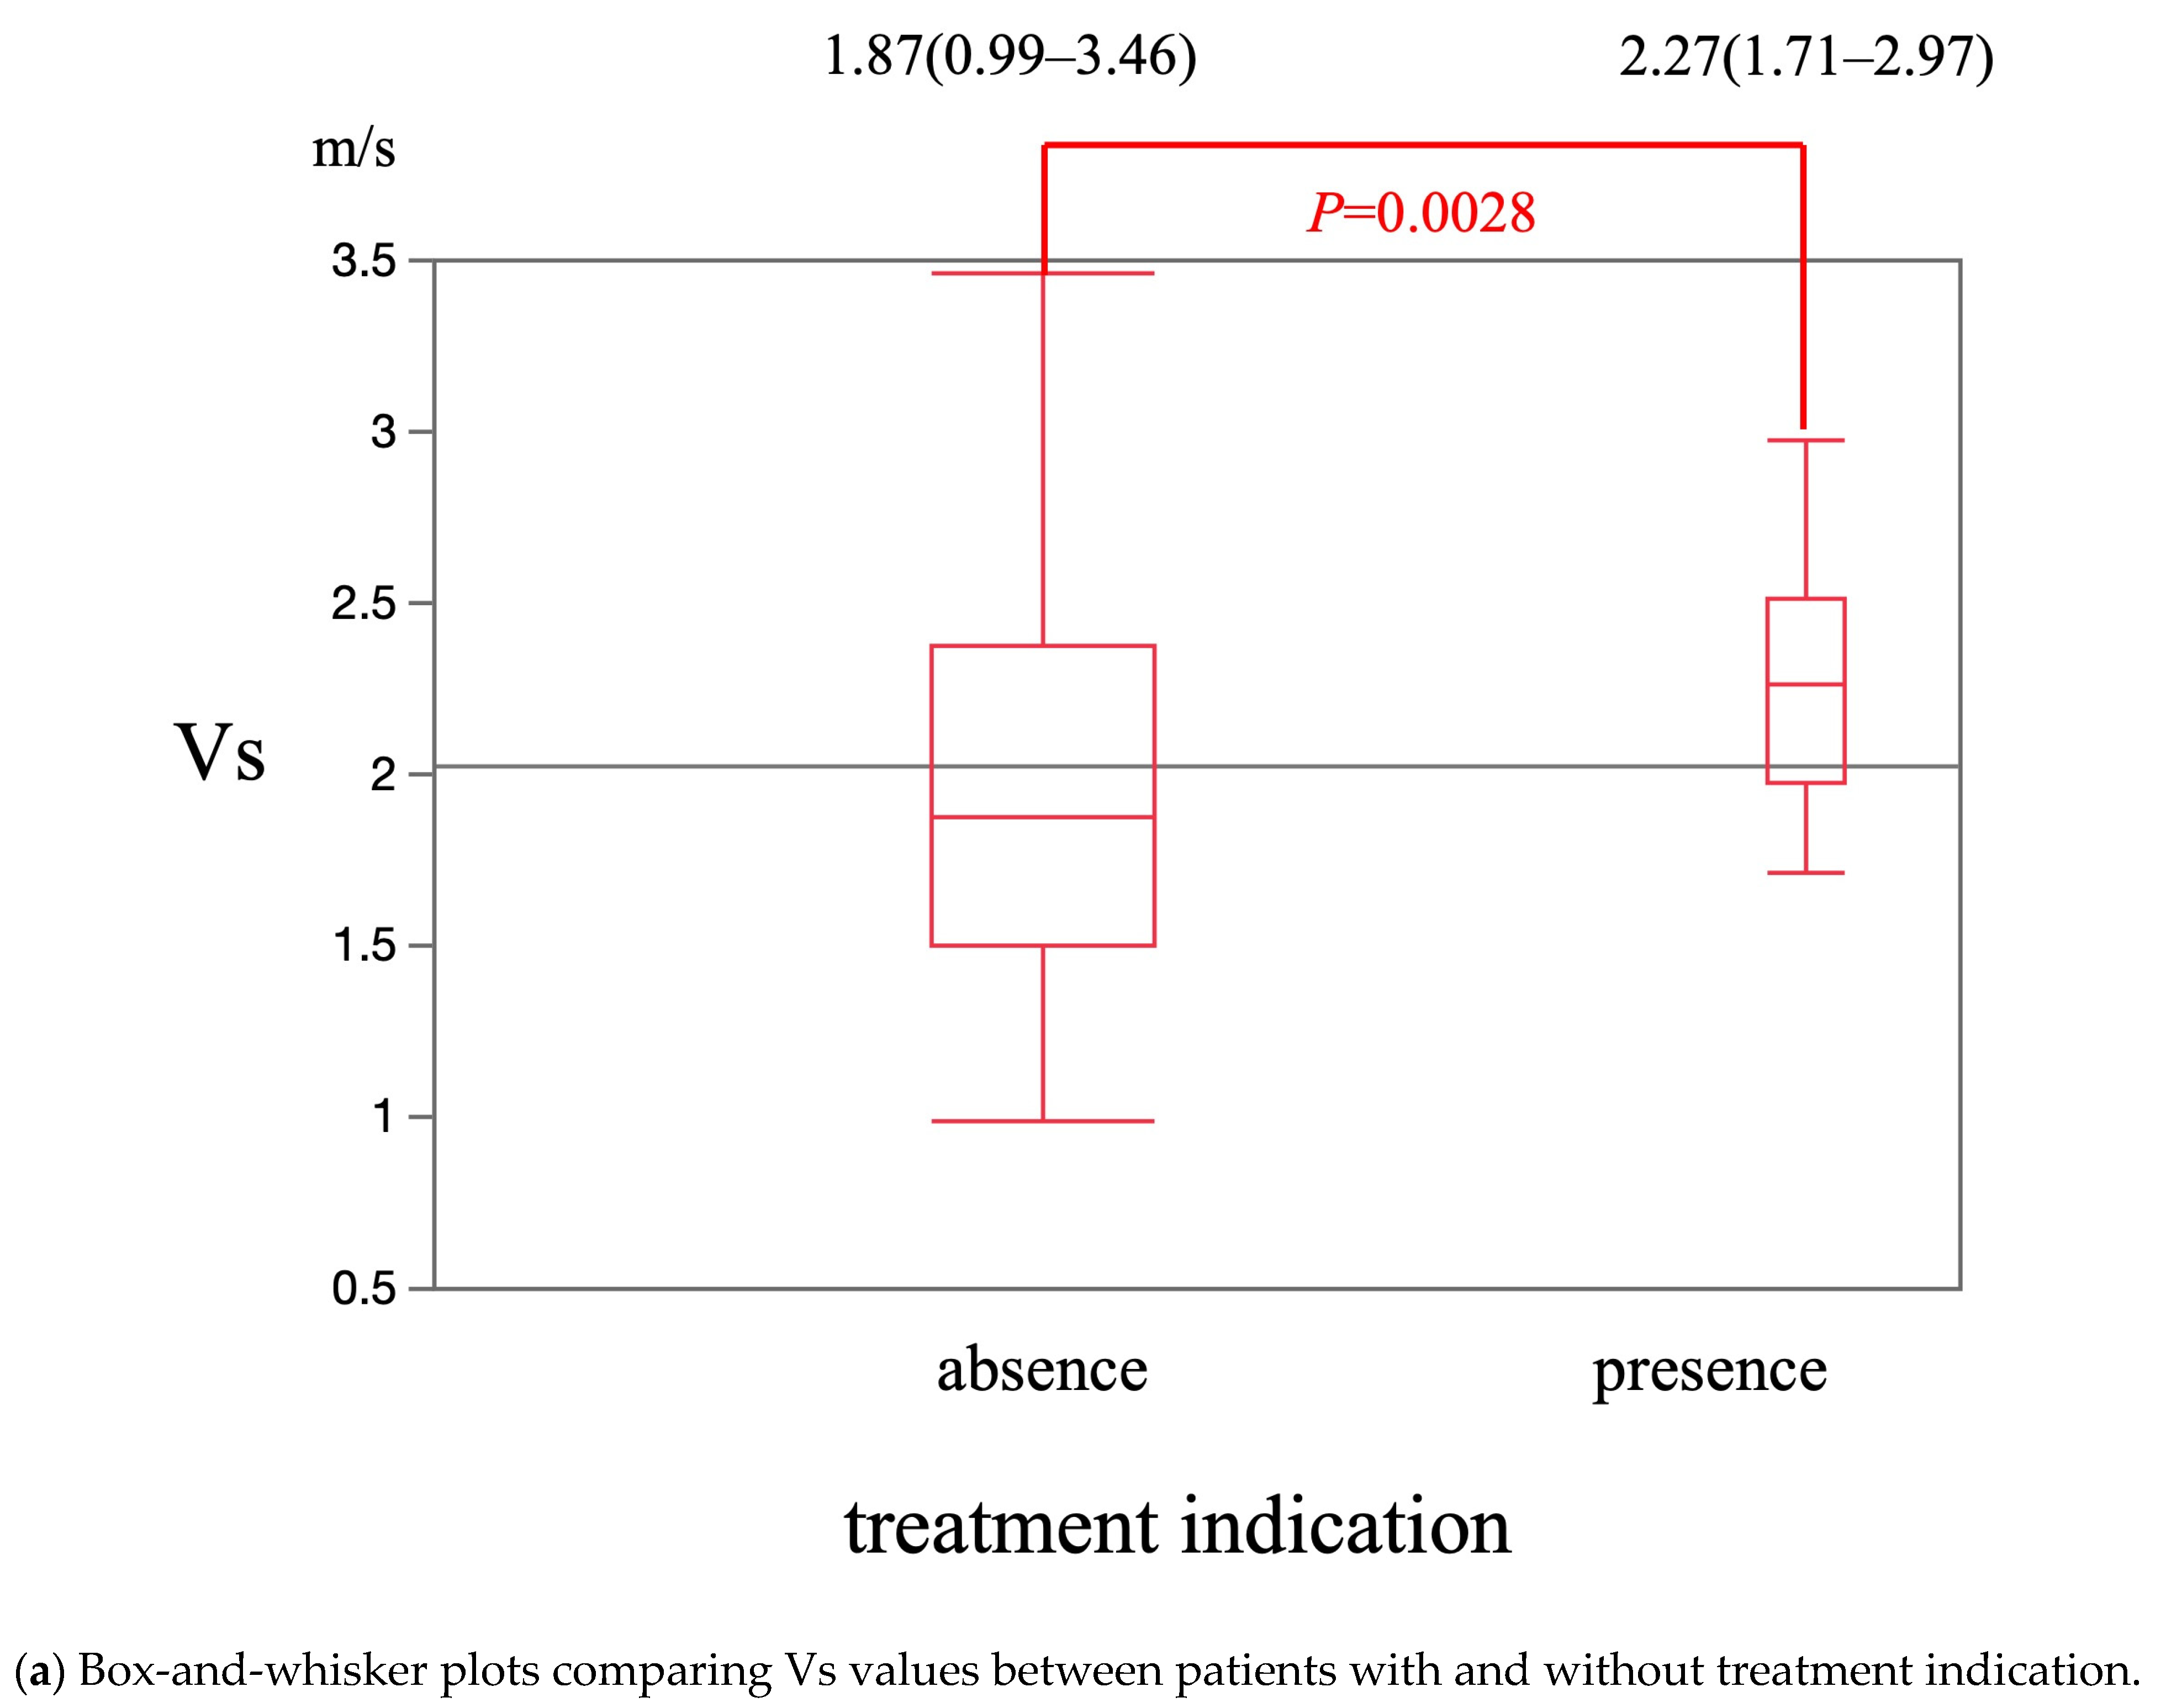
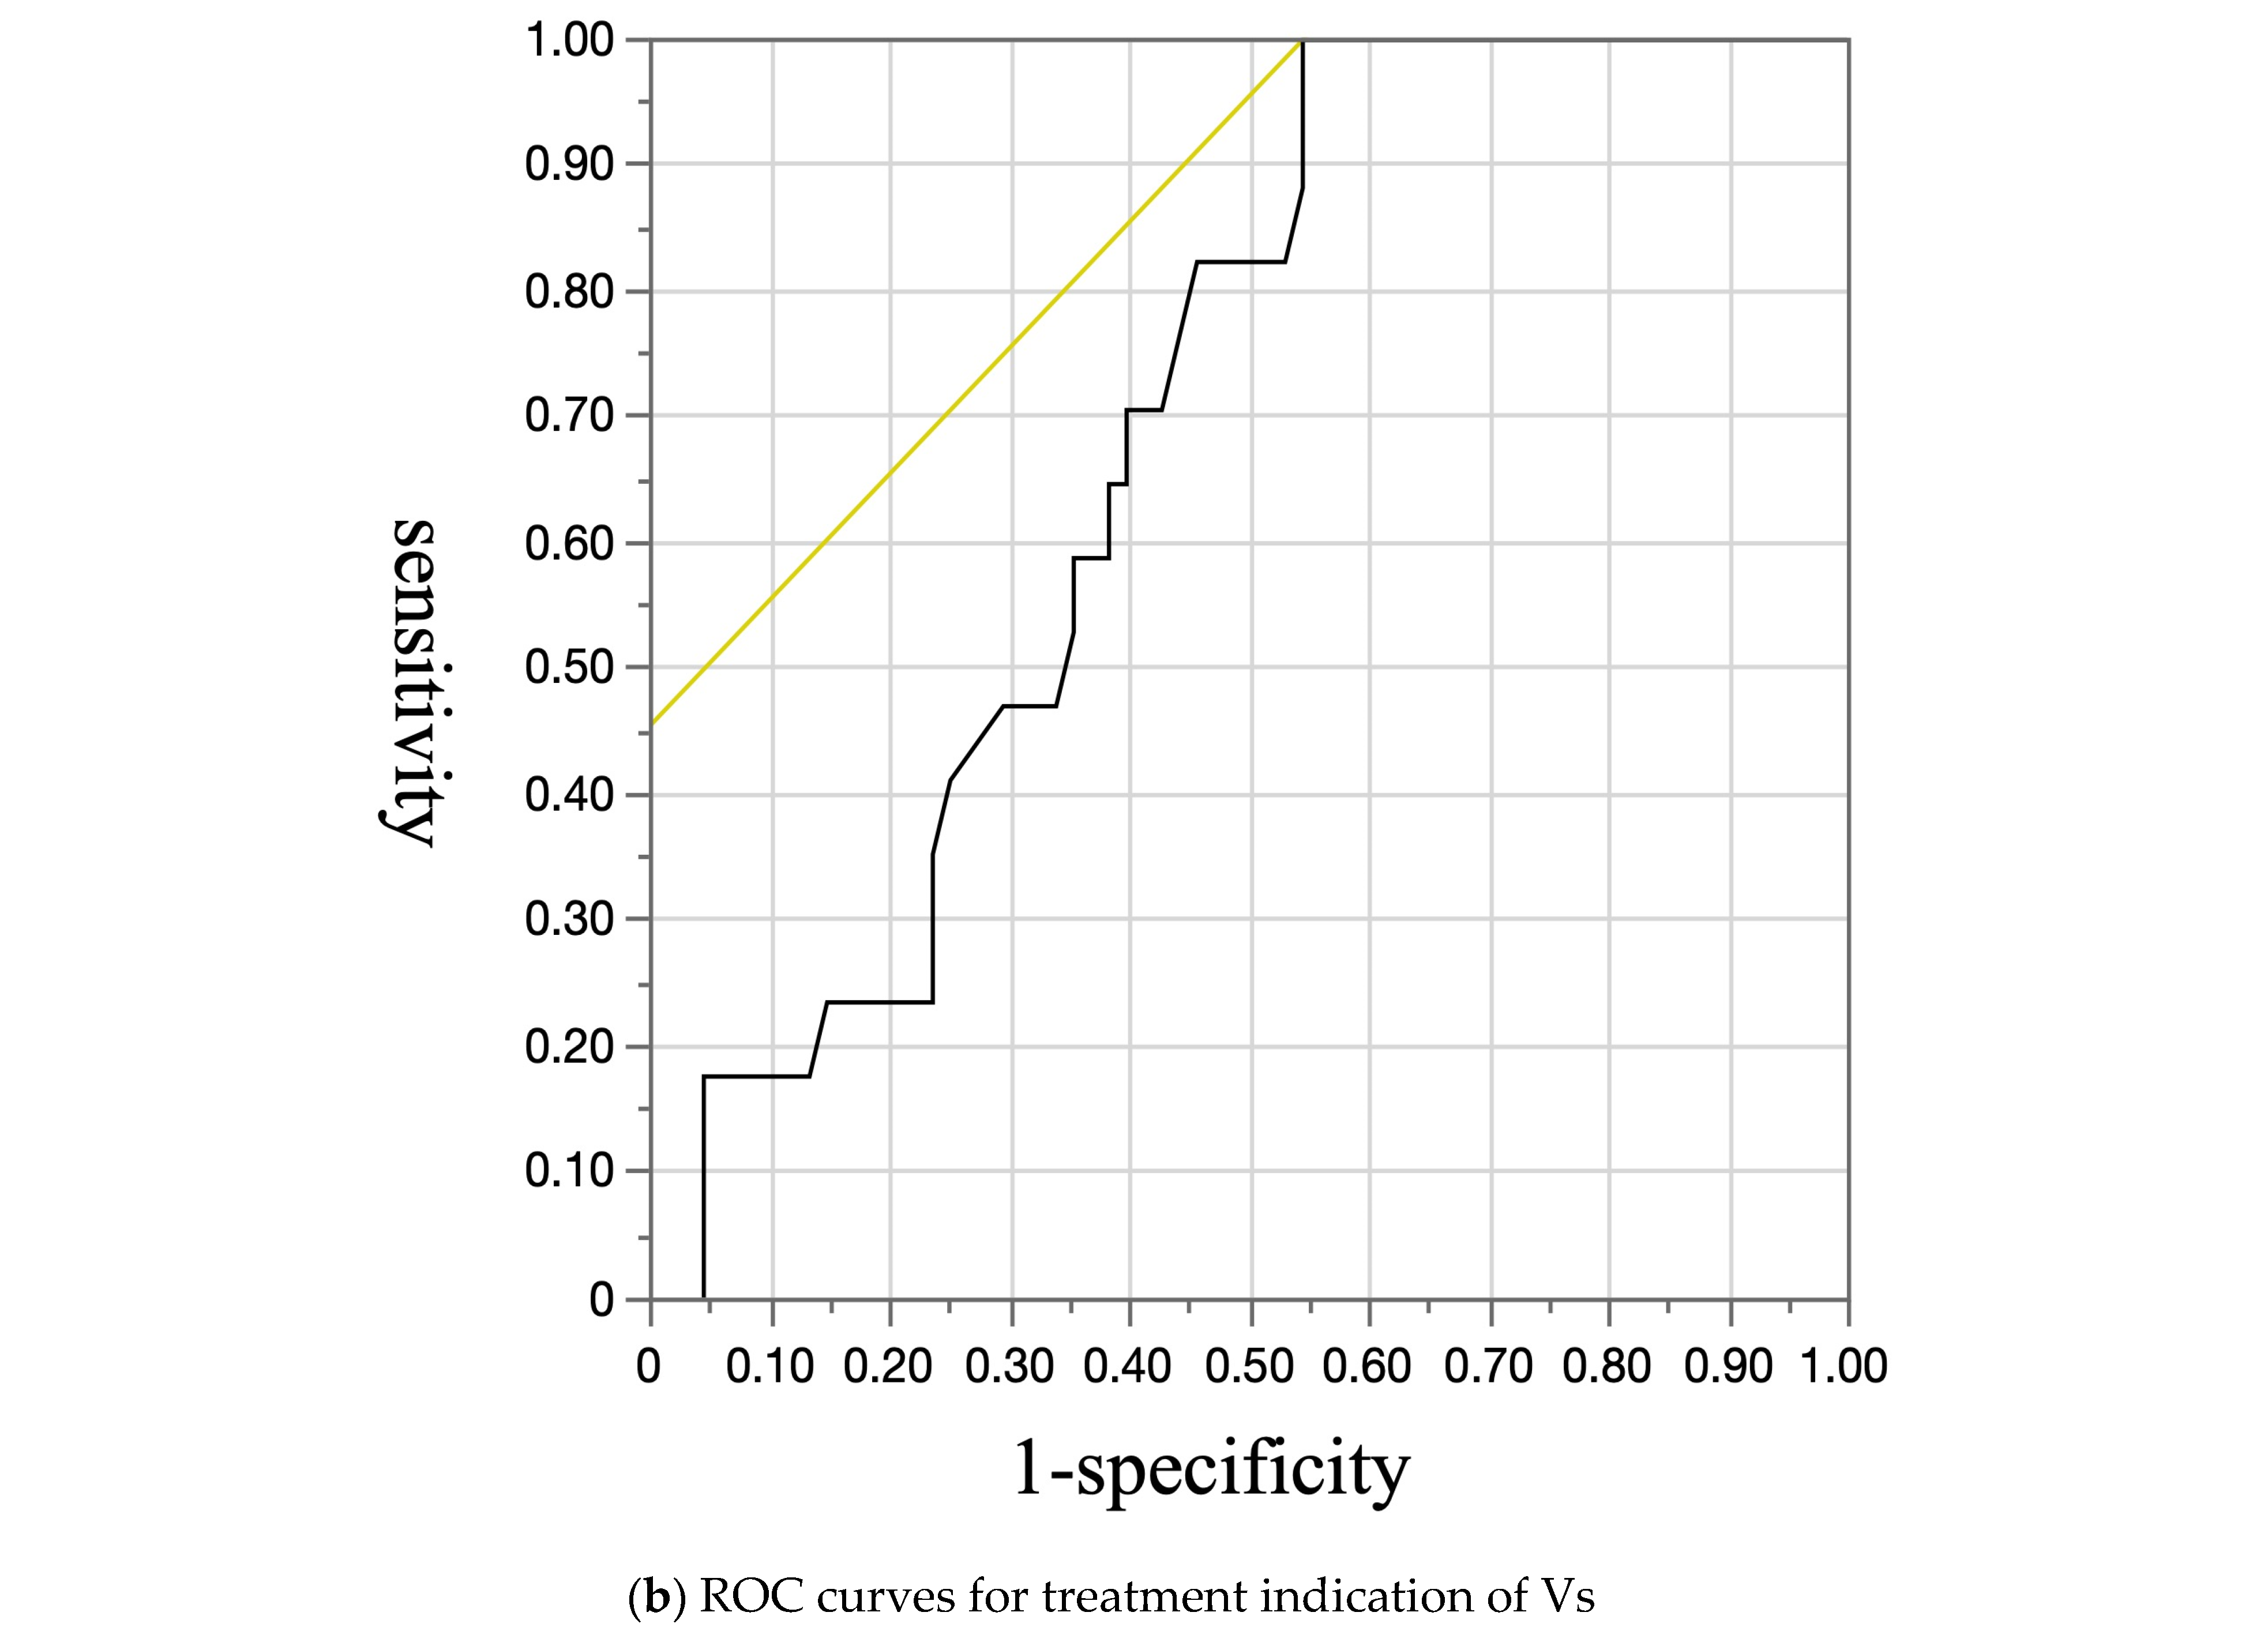
2.6. Vs
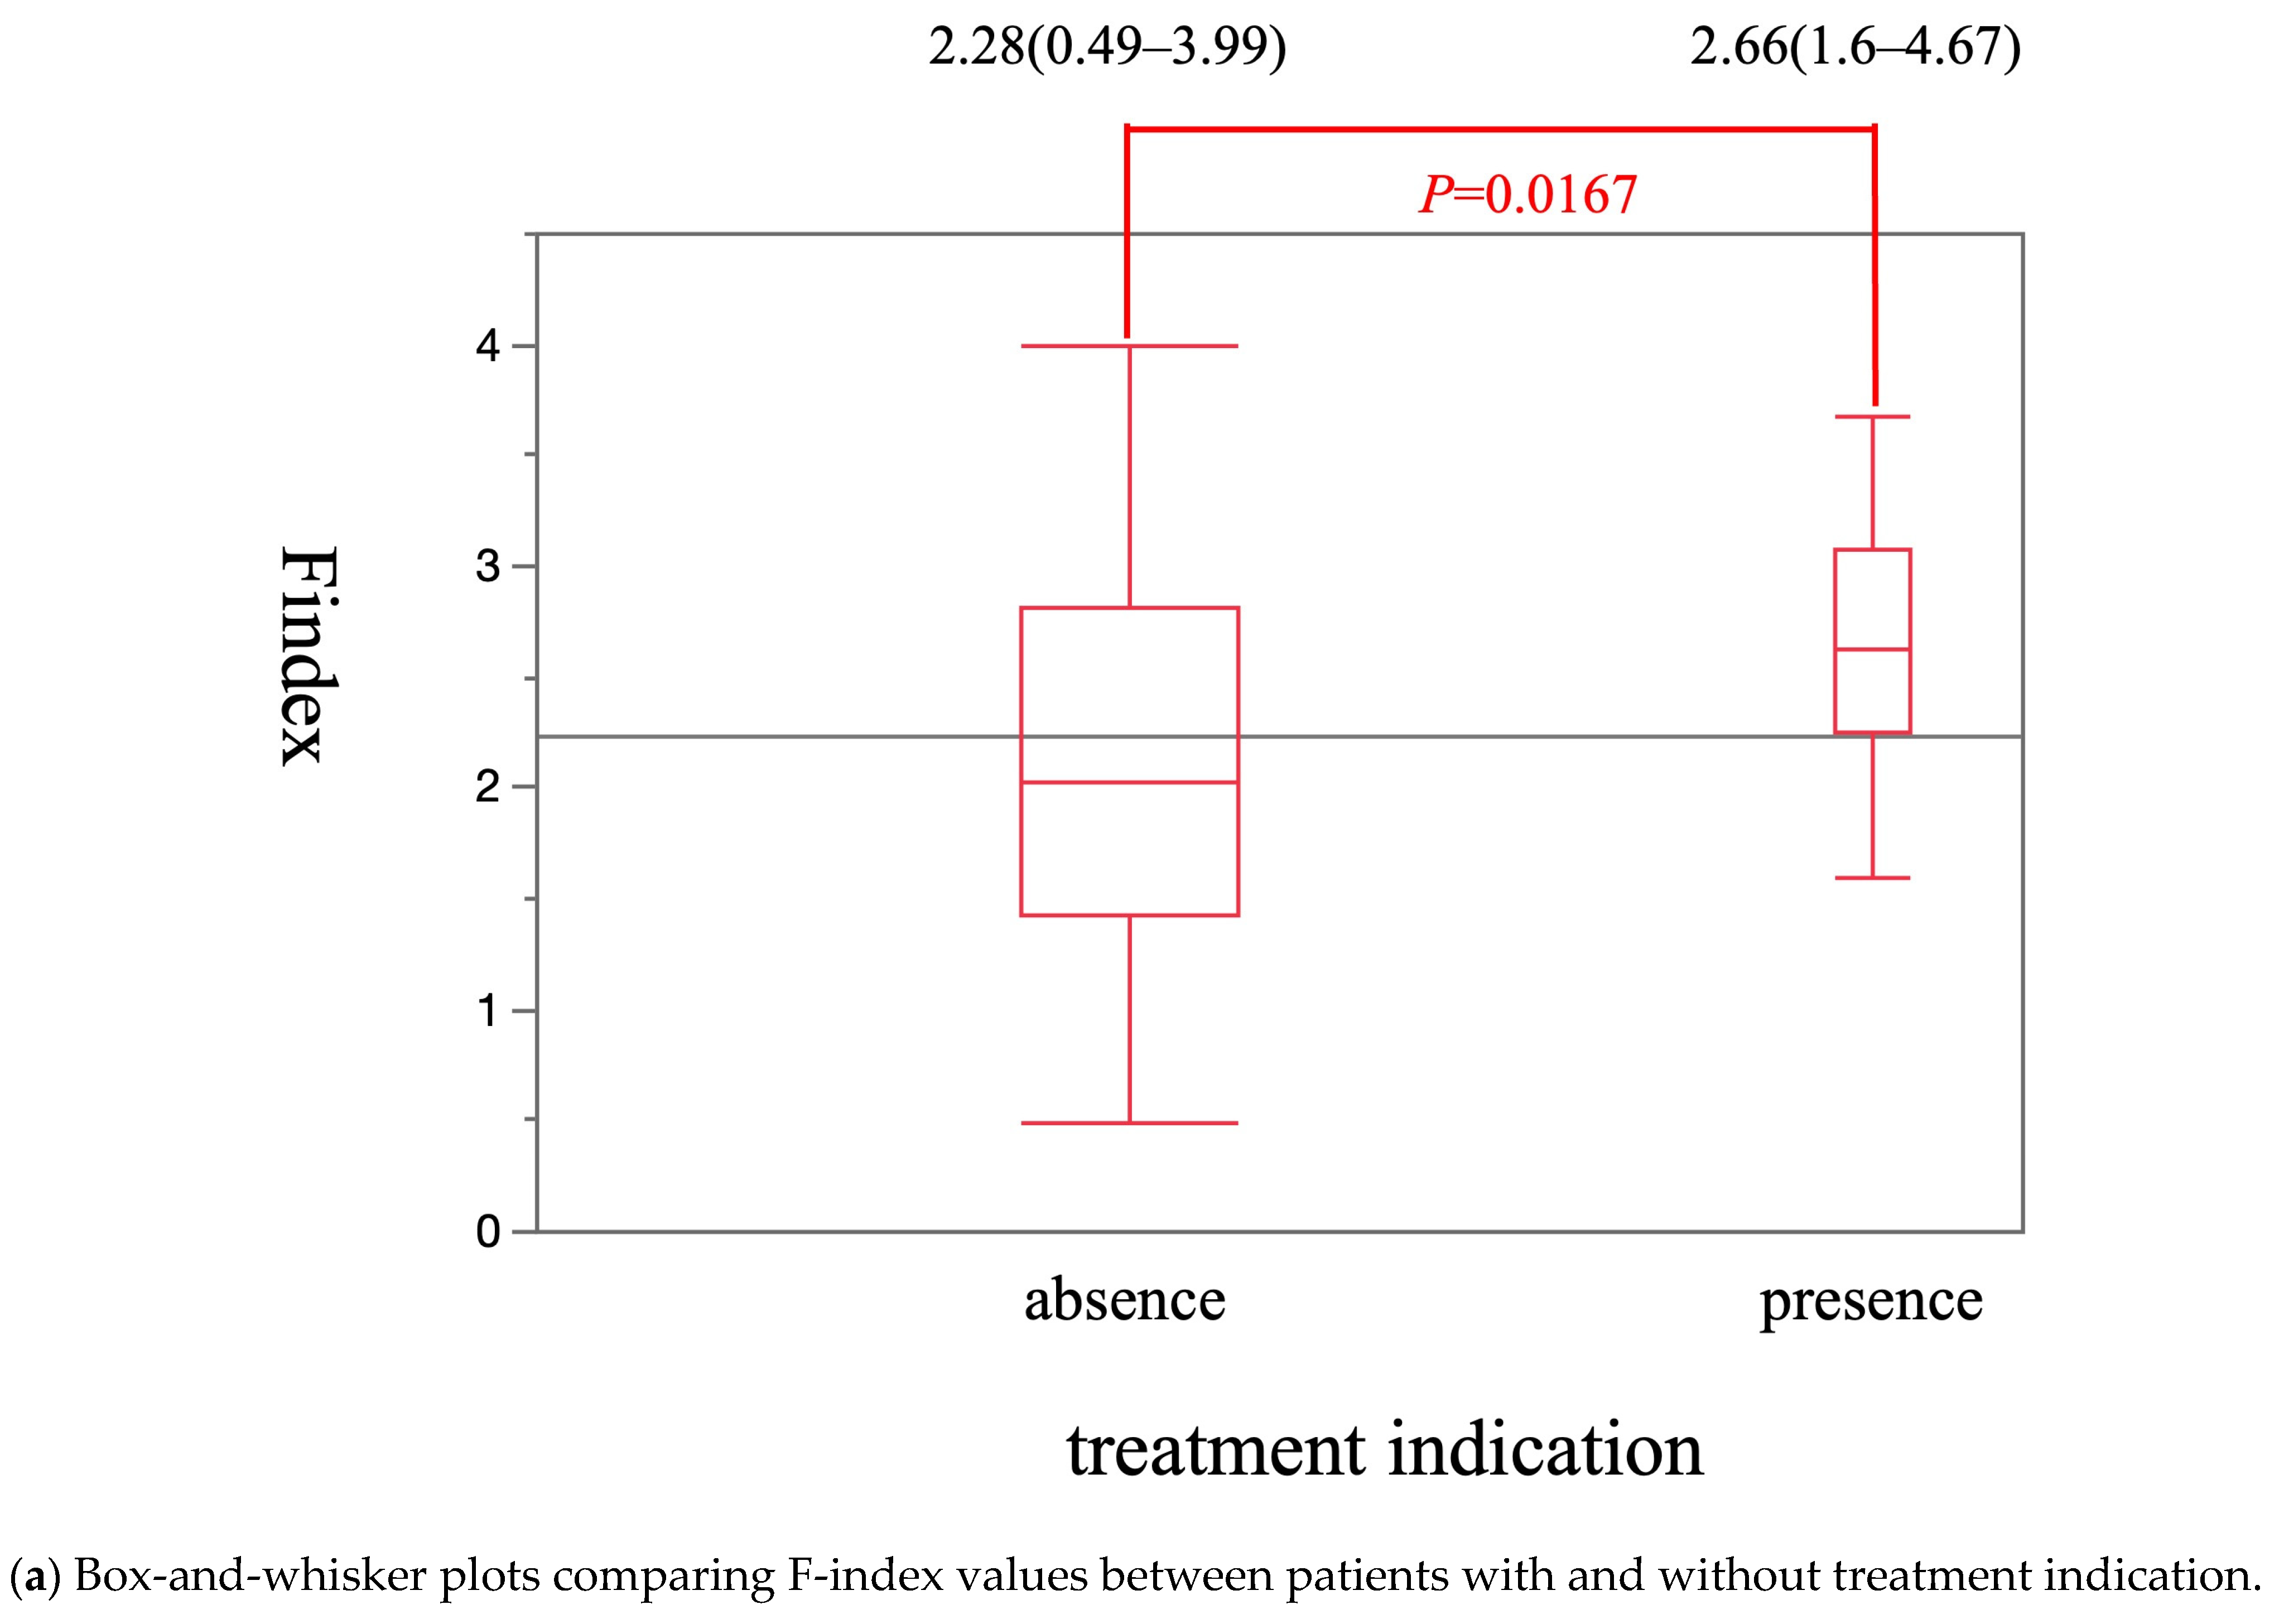
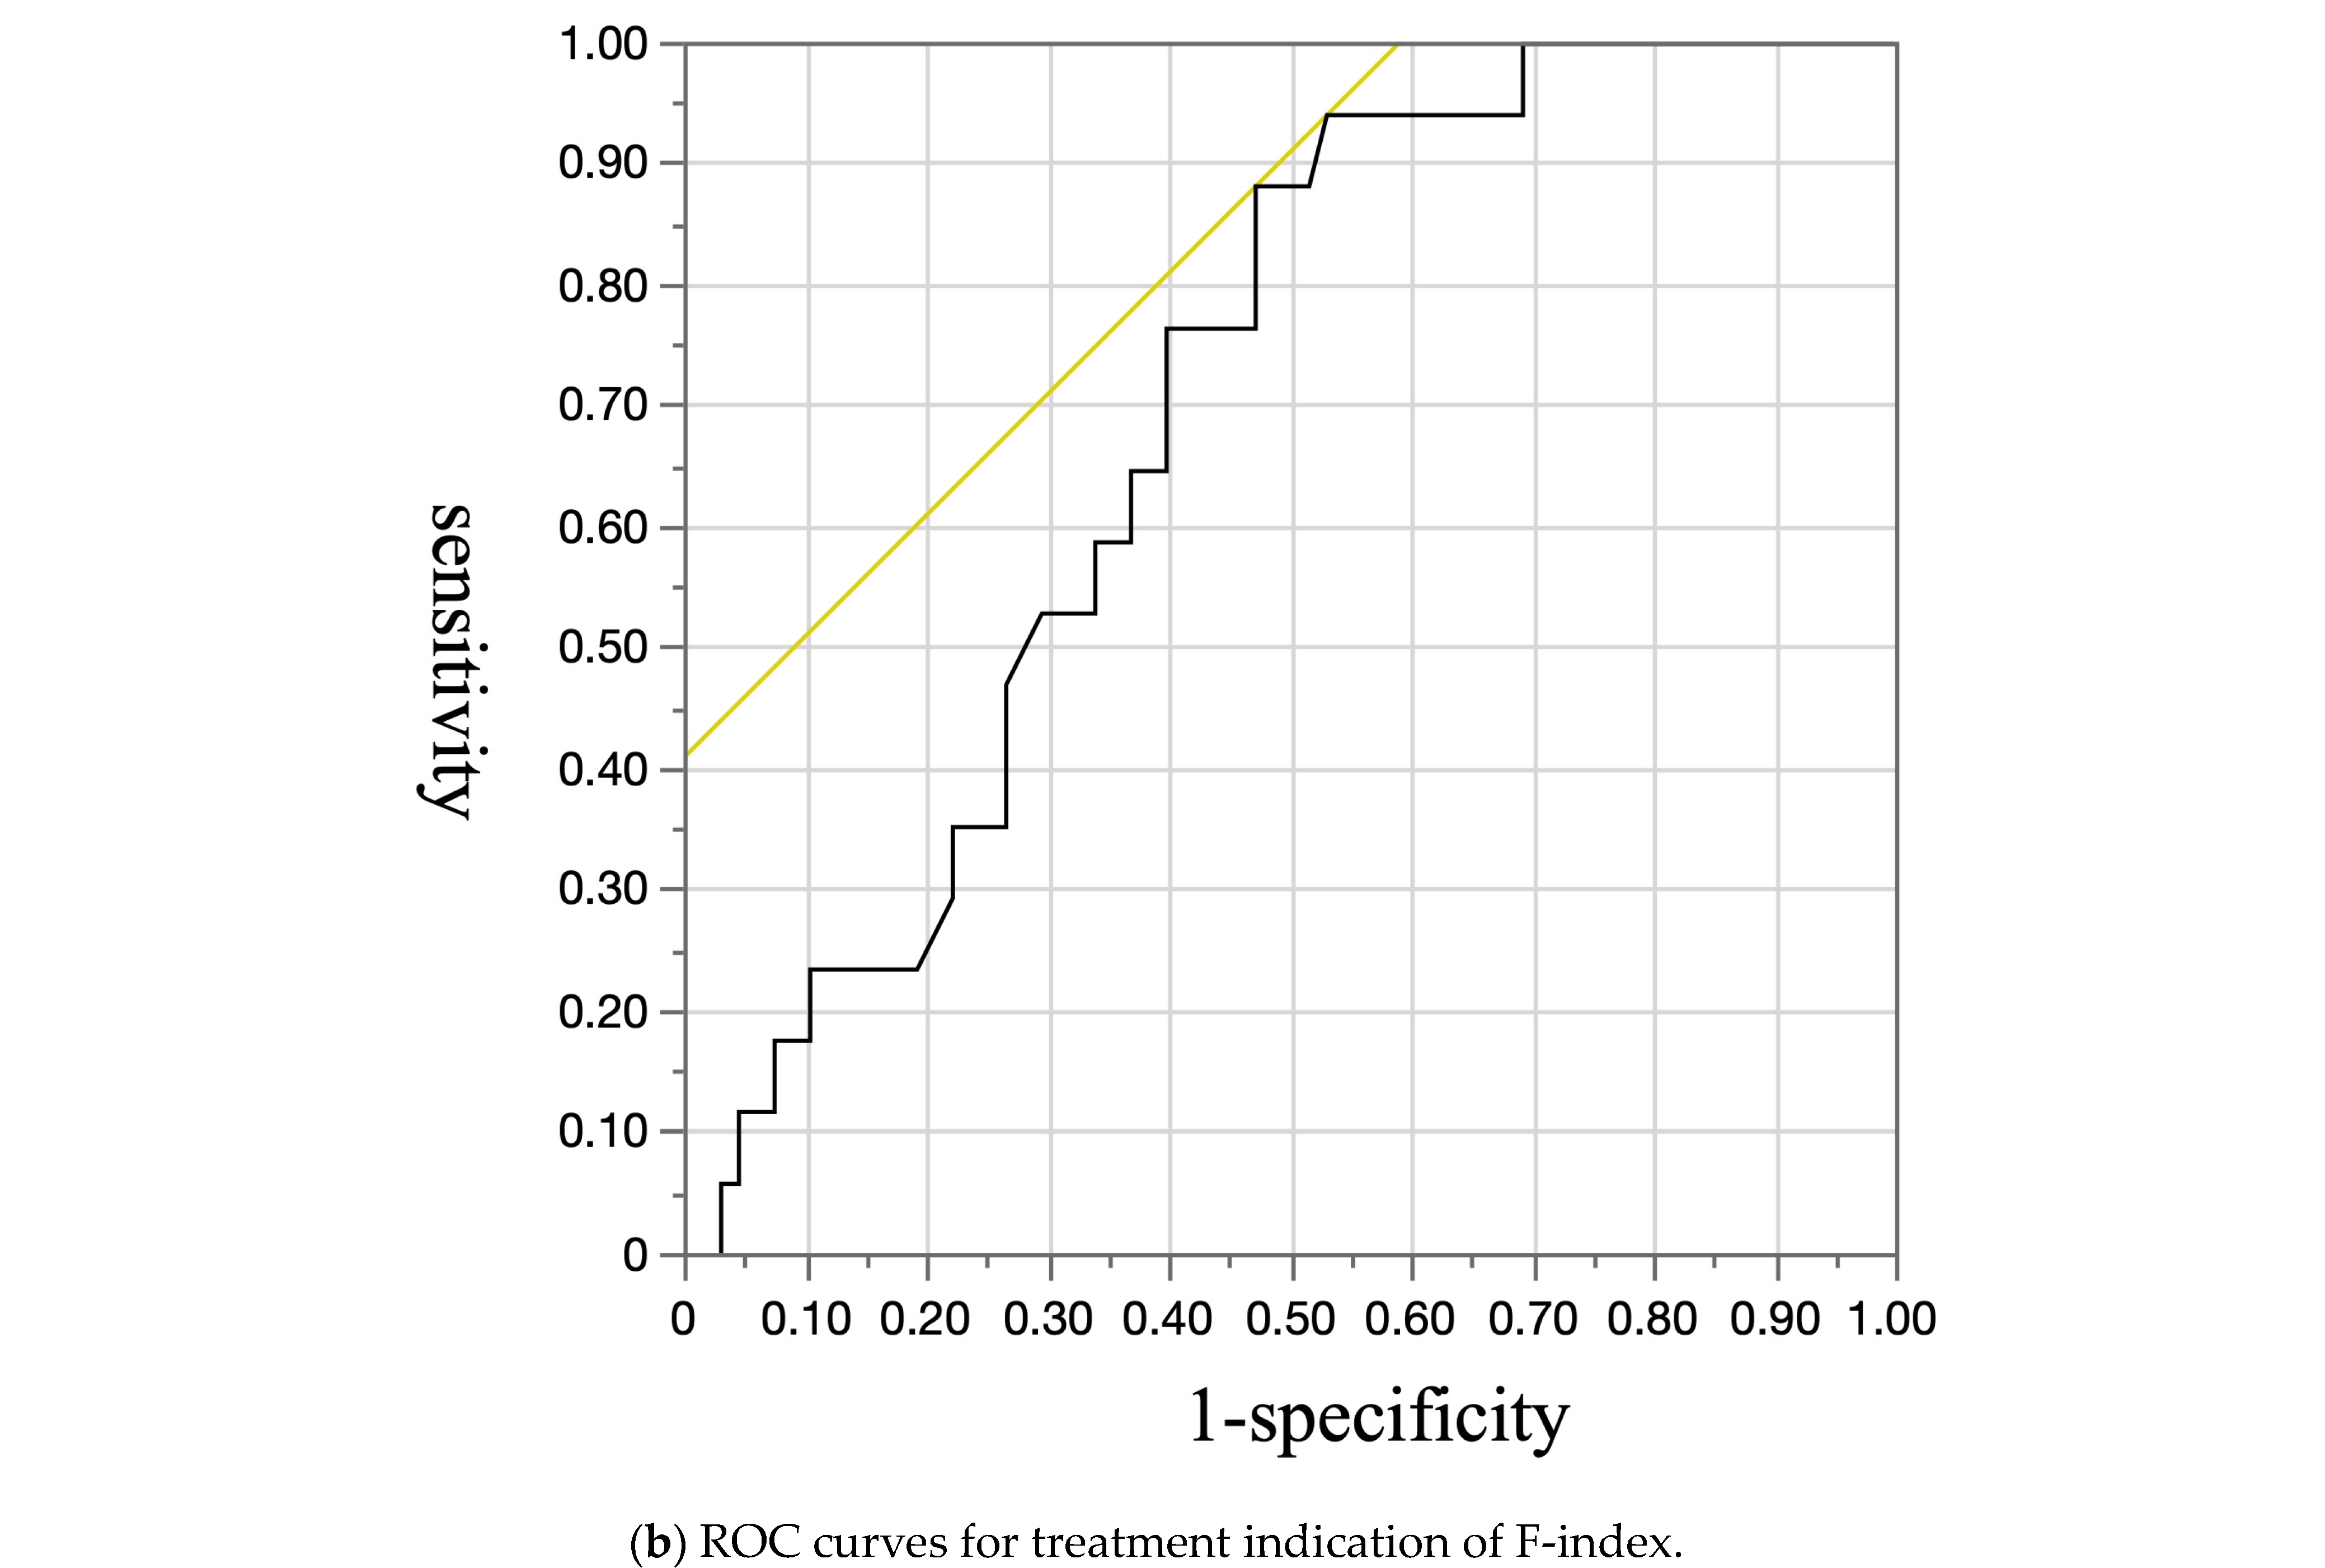
F-Index
2.7. Statistical Analysis
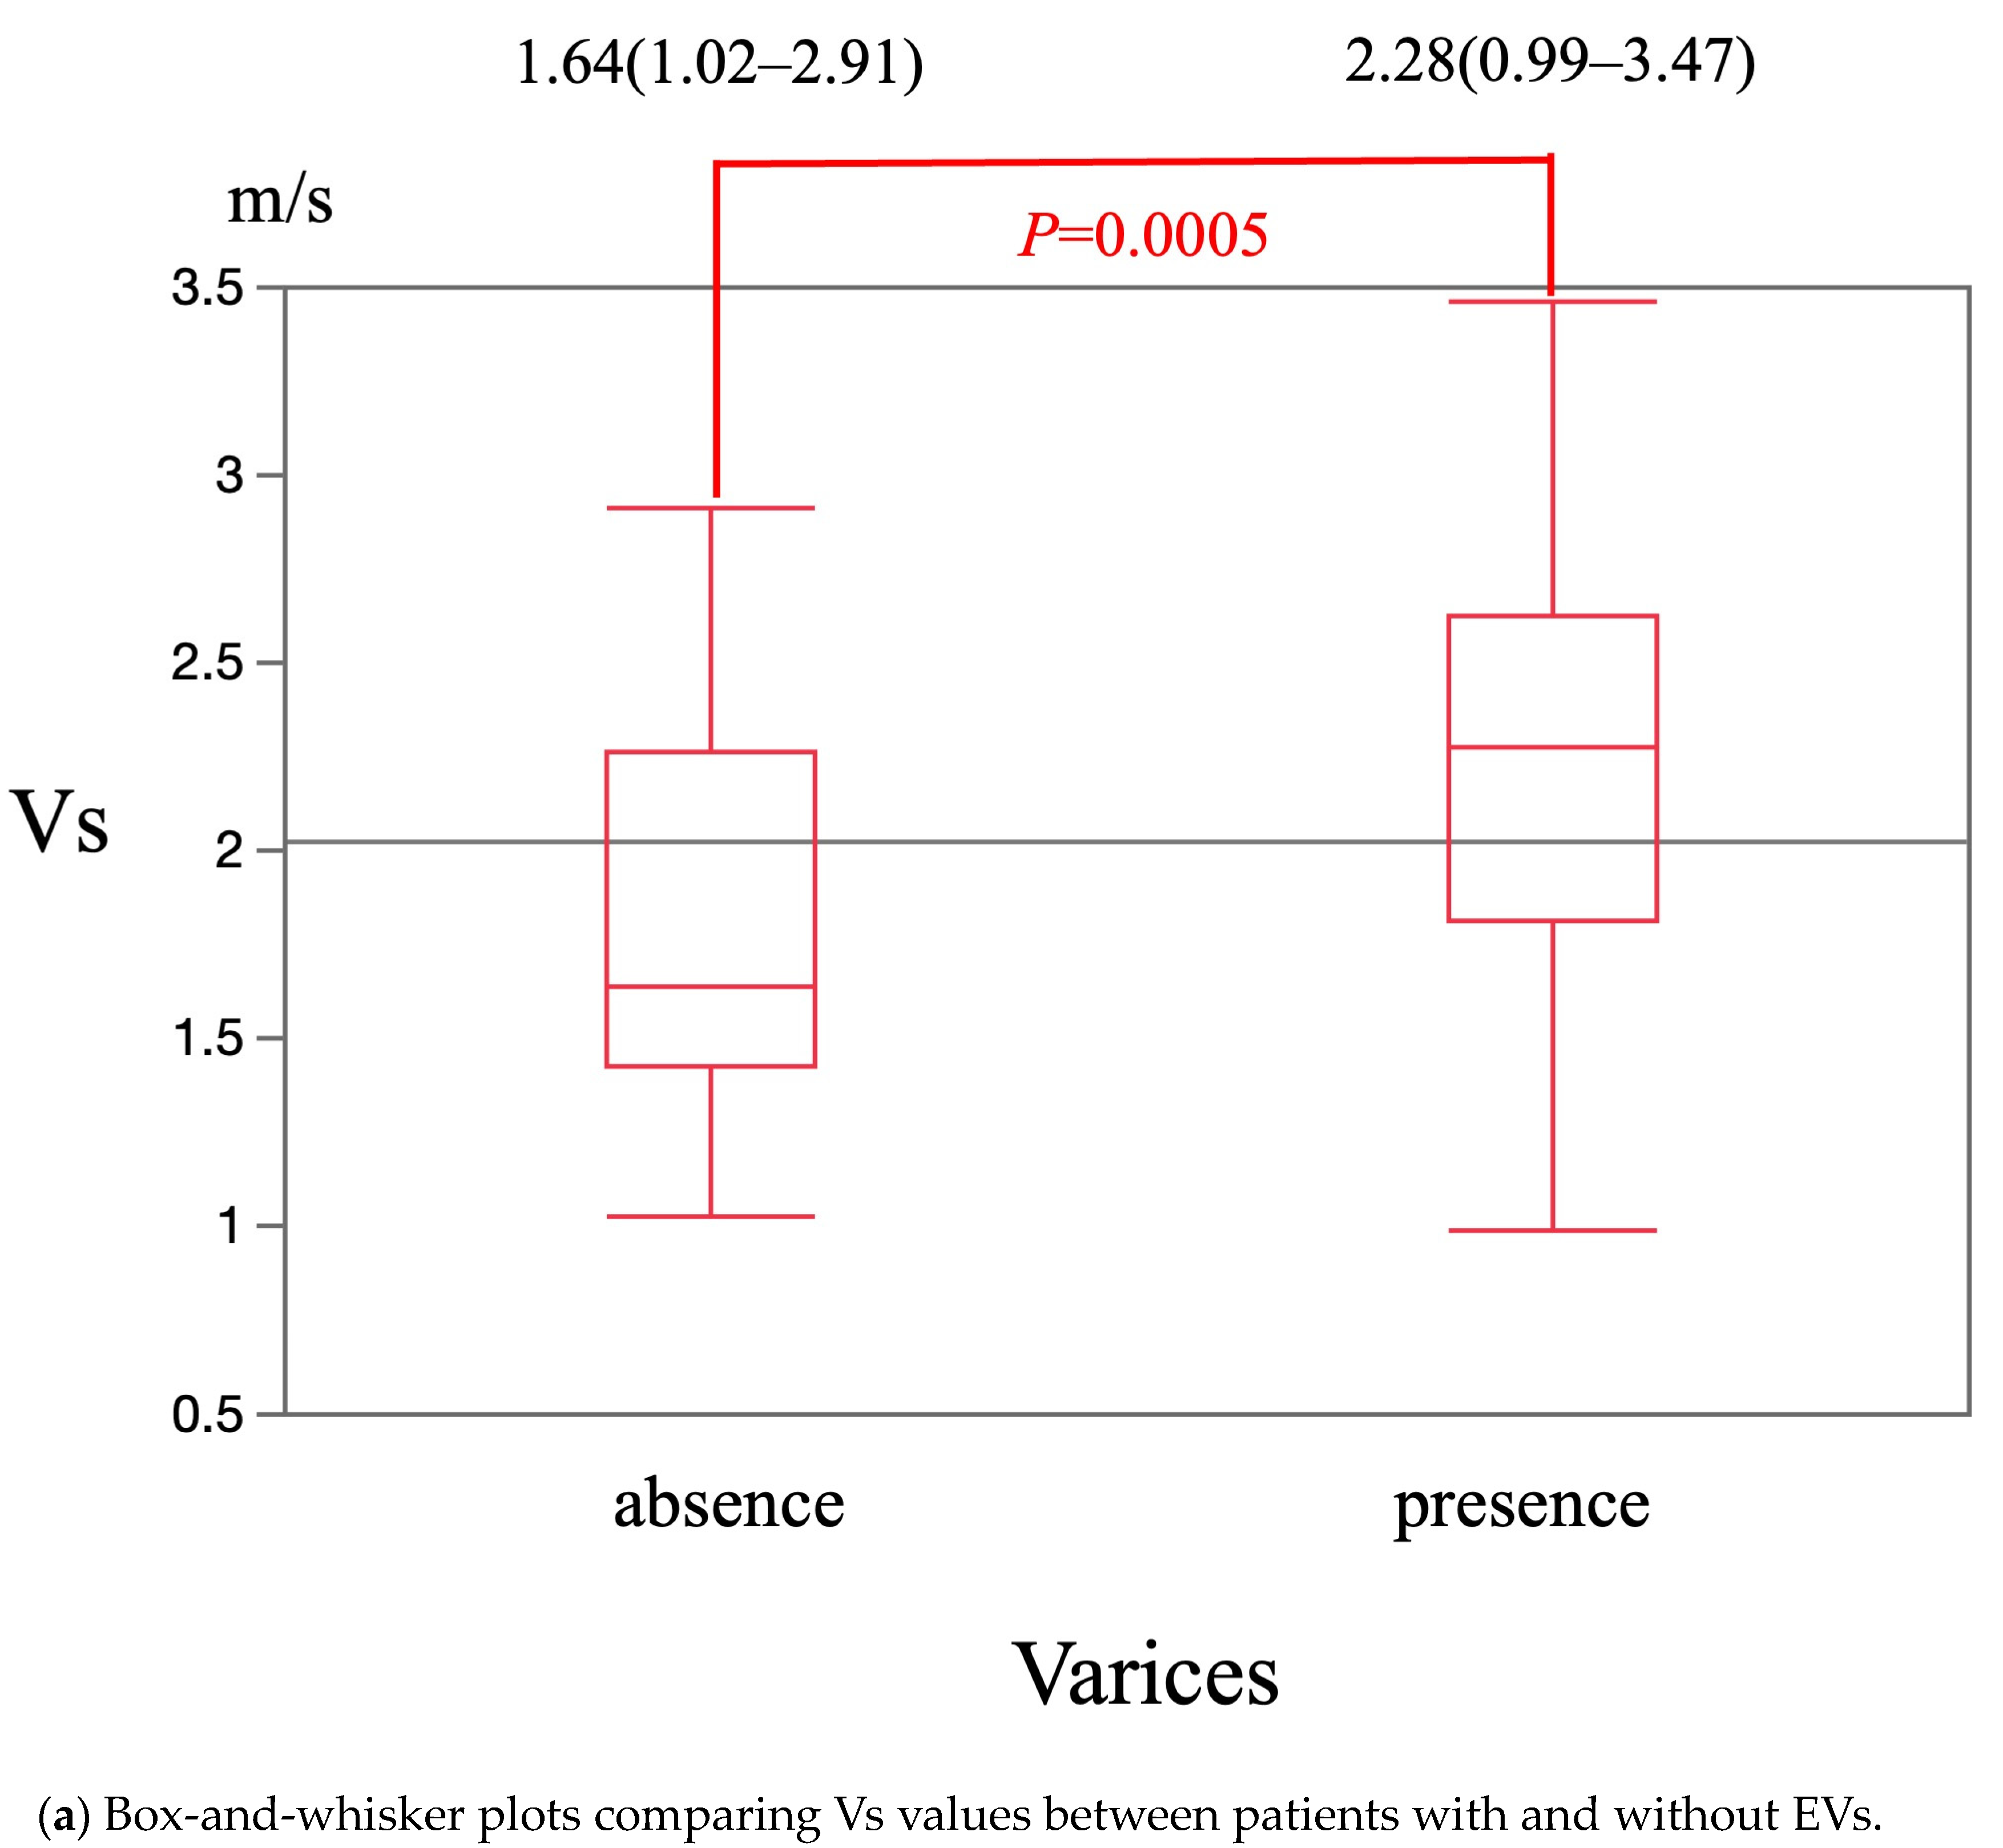
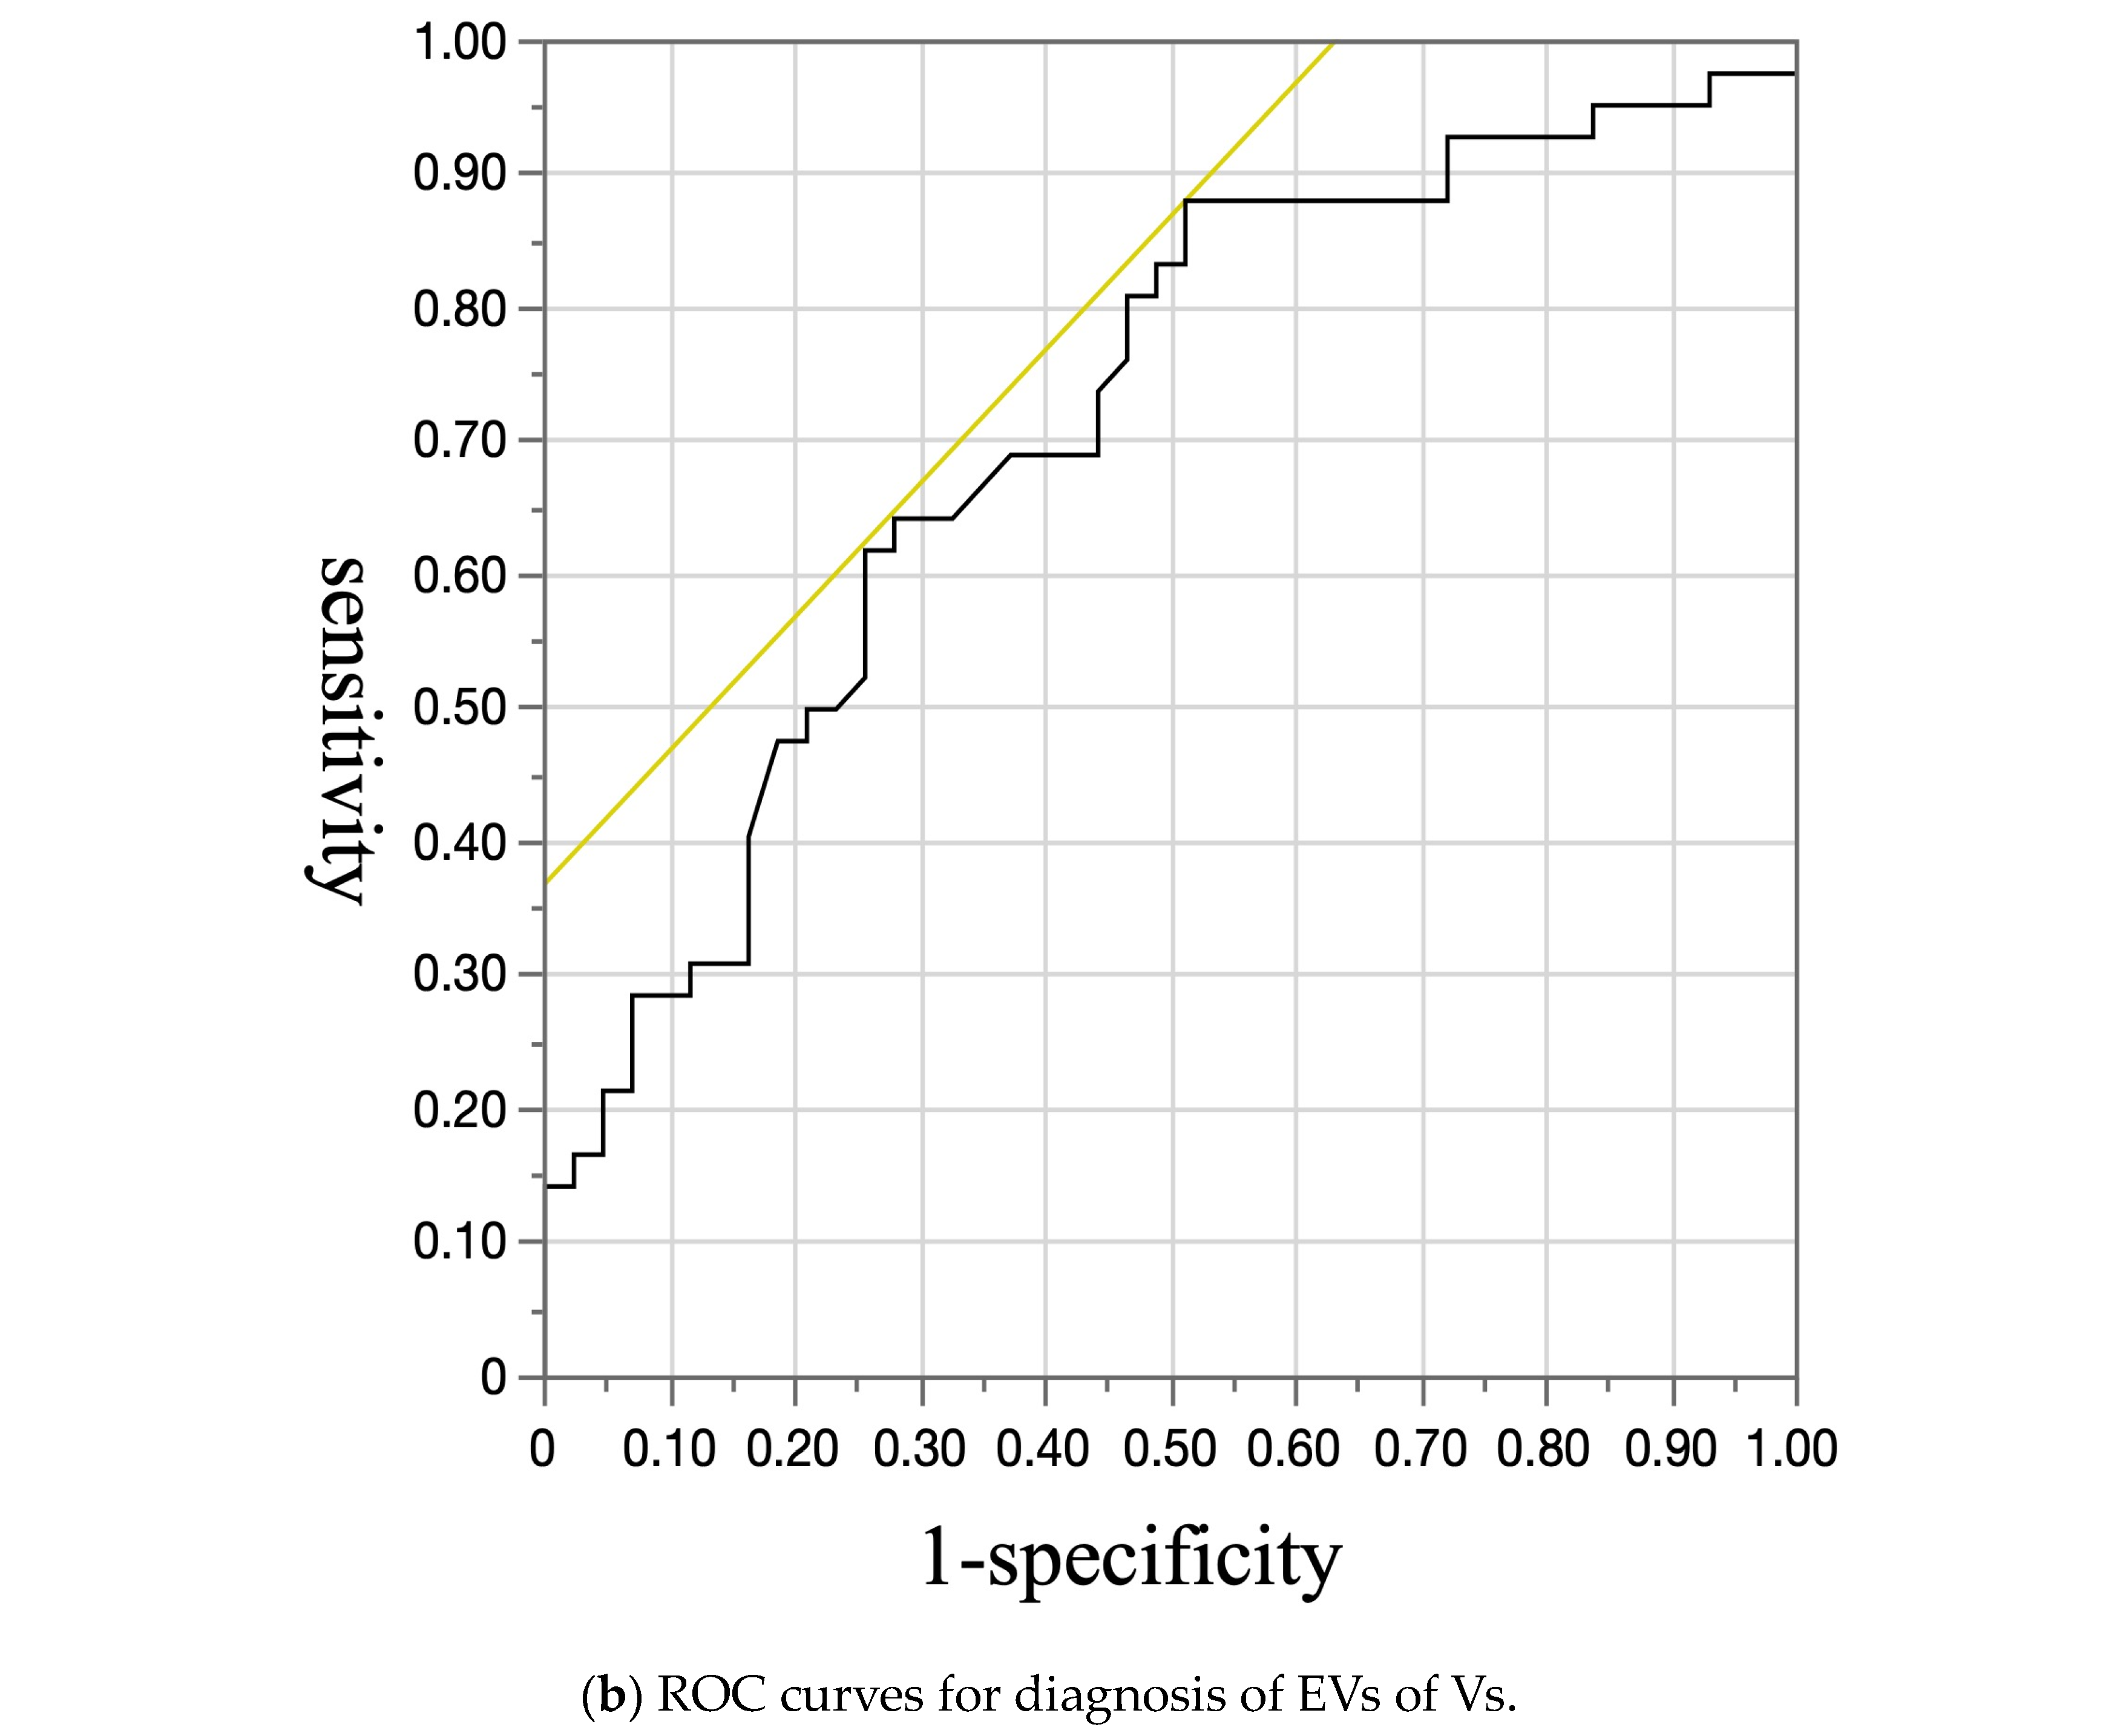
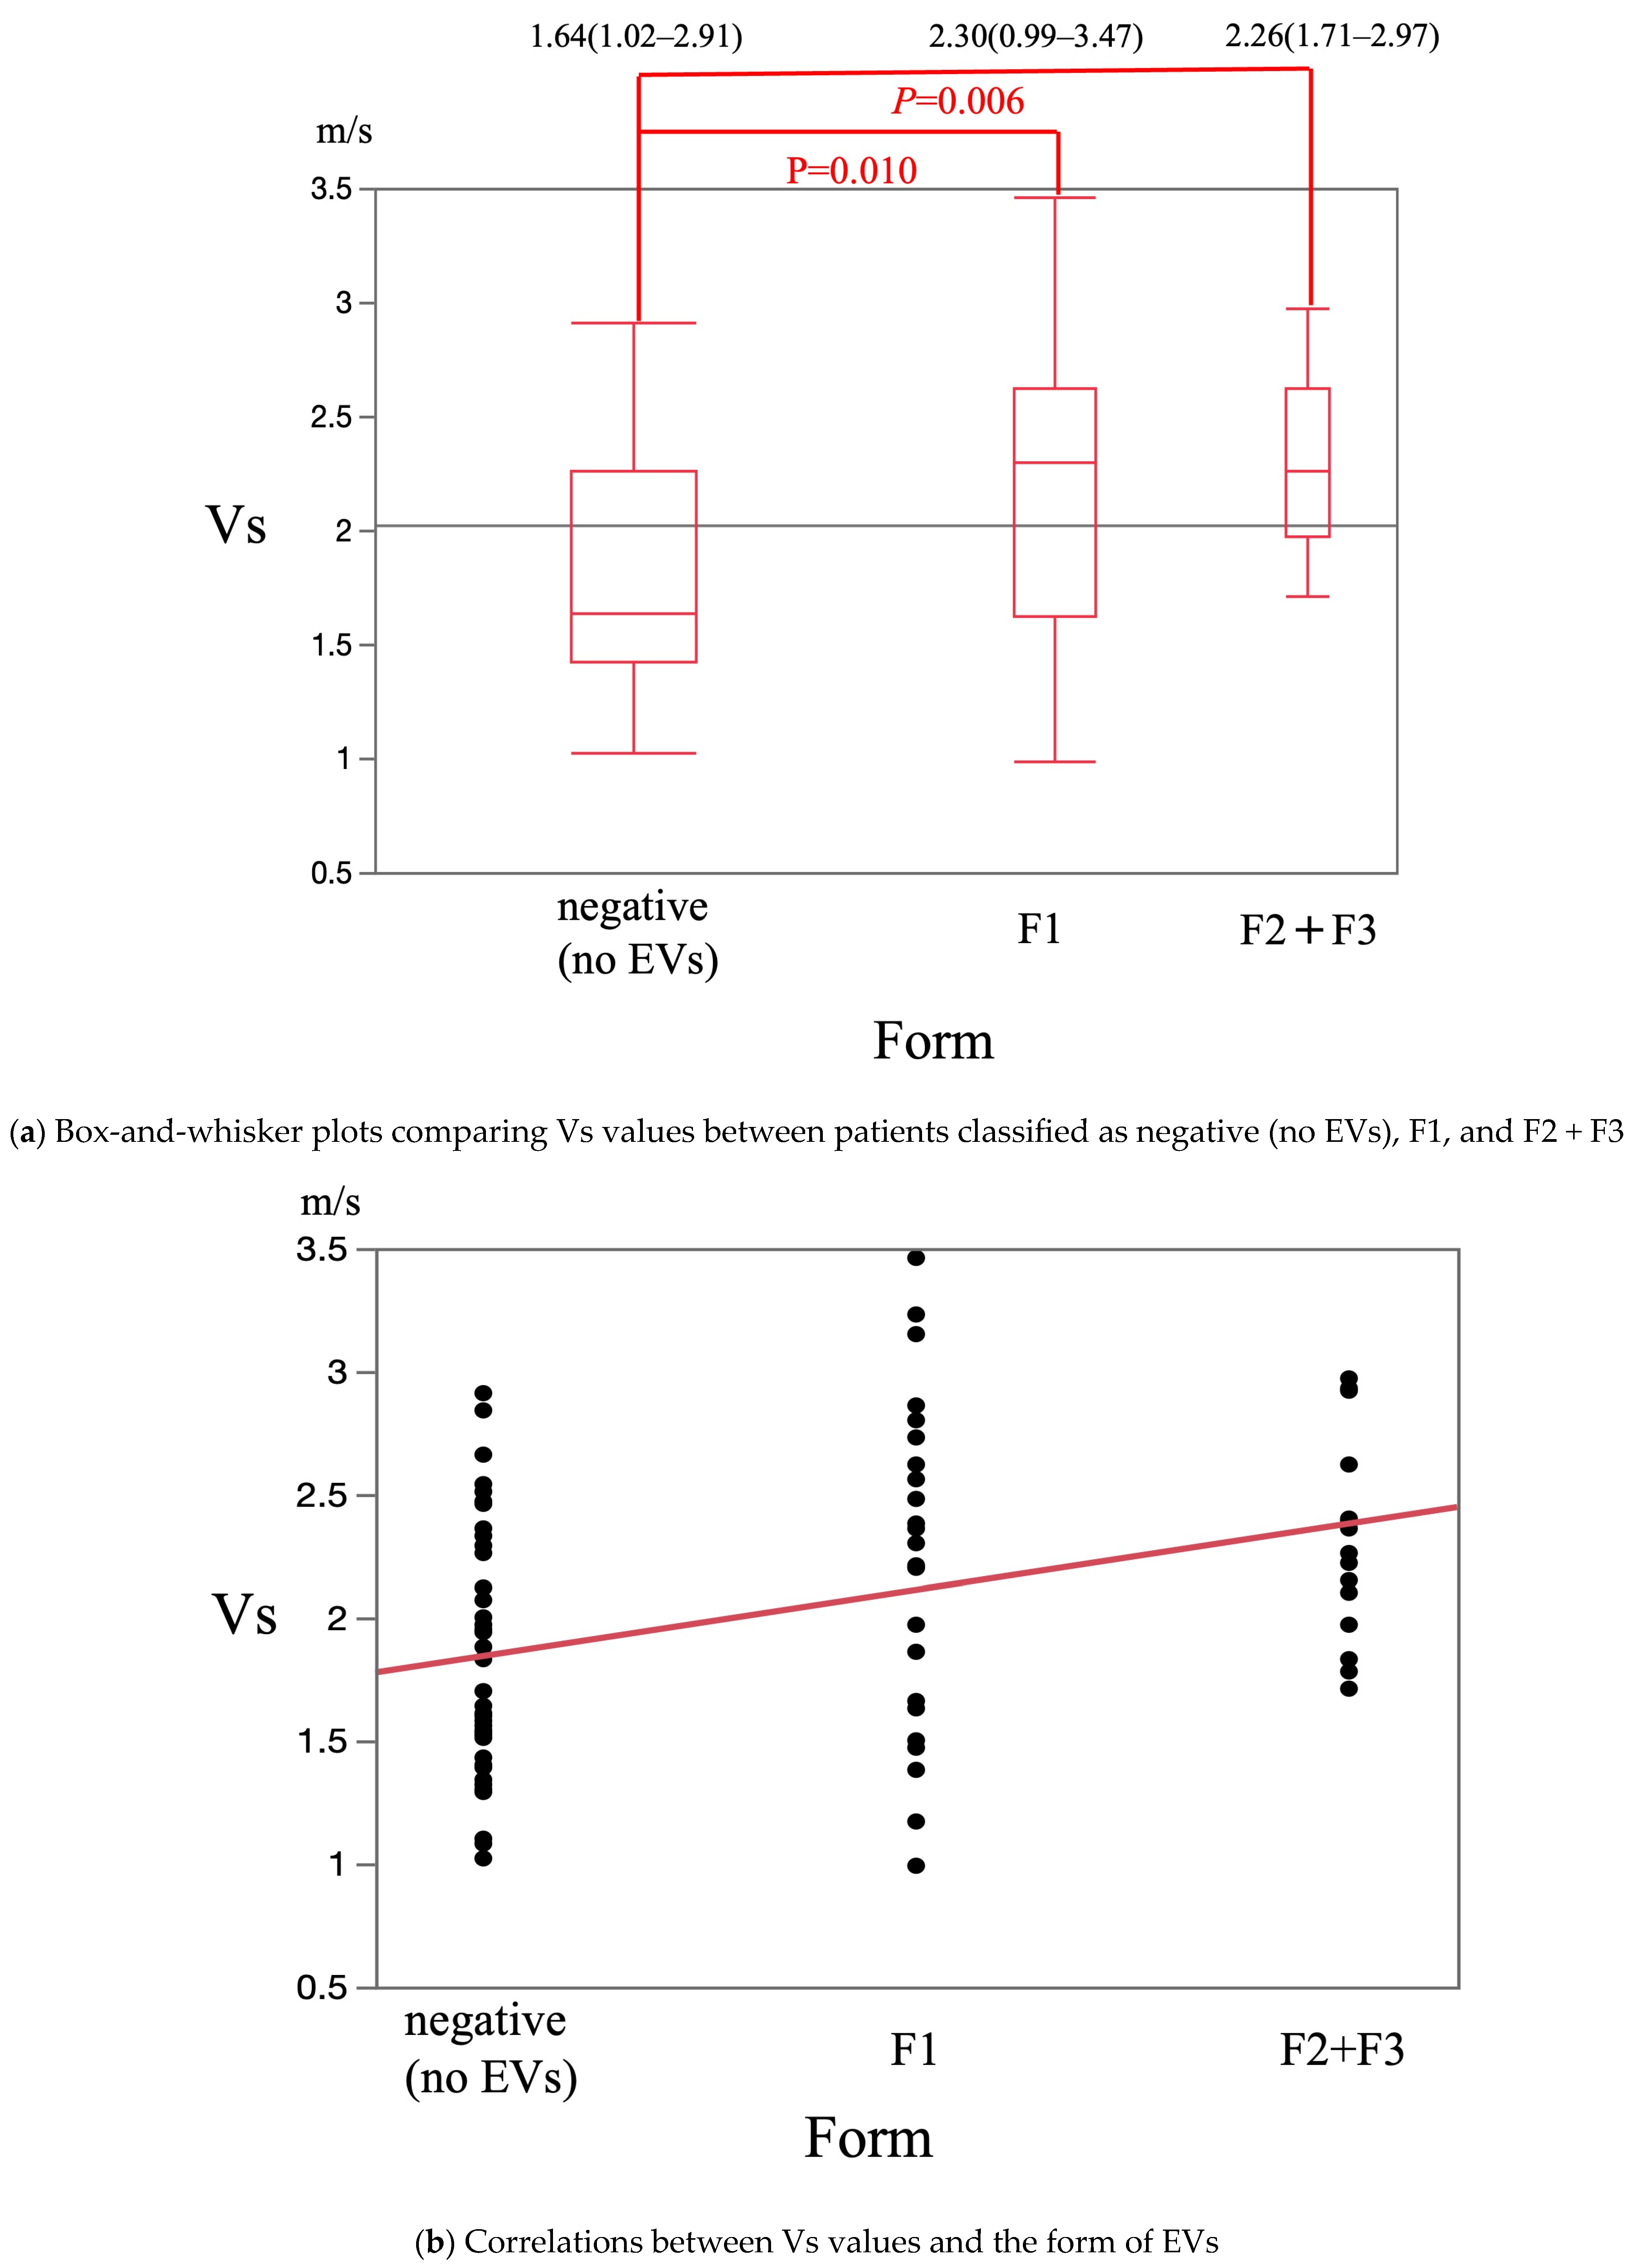
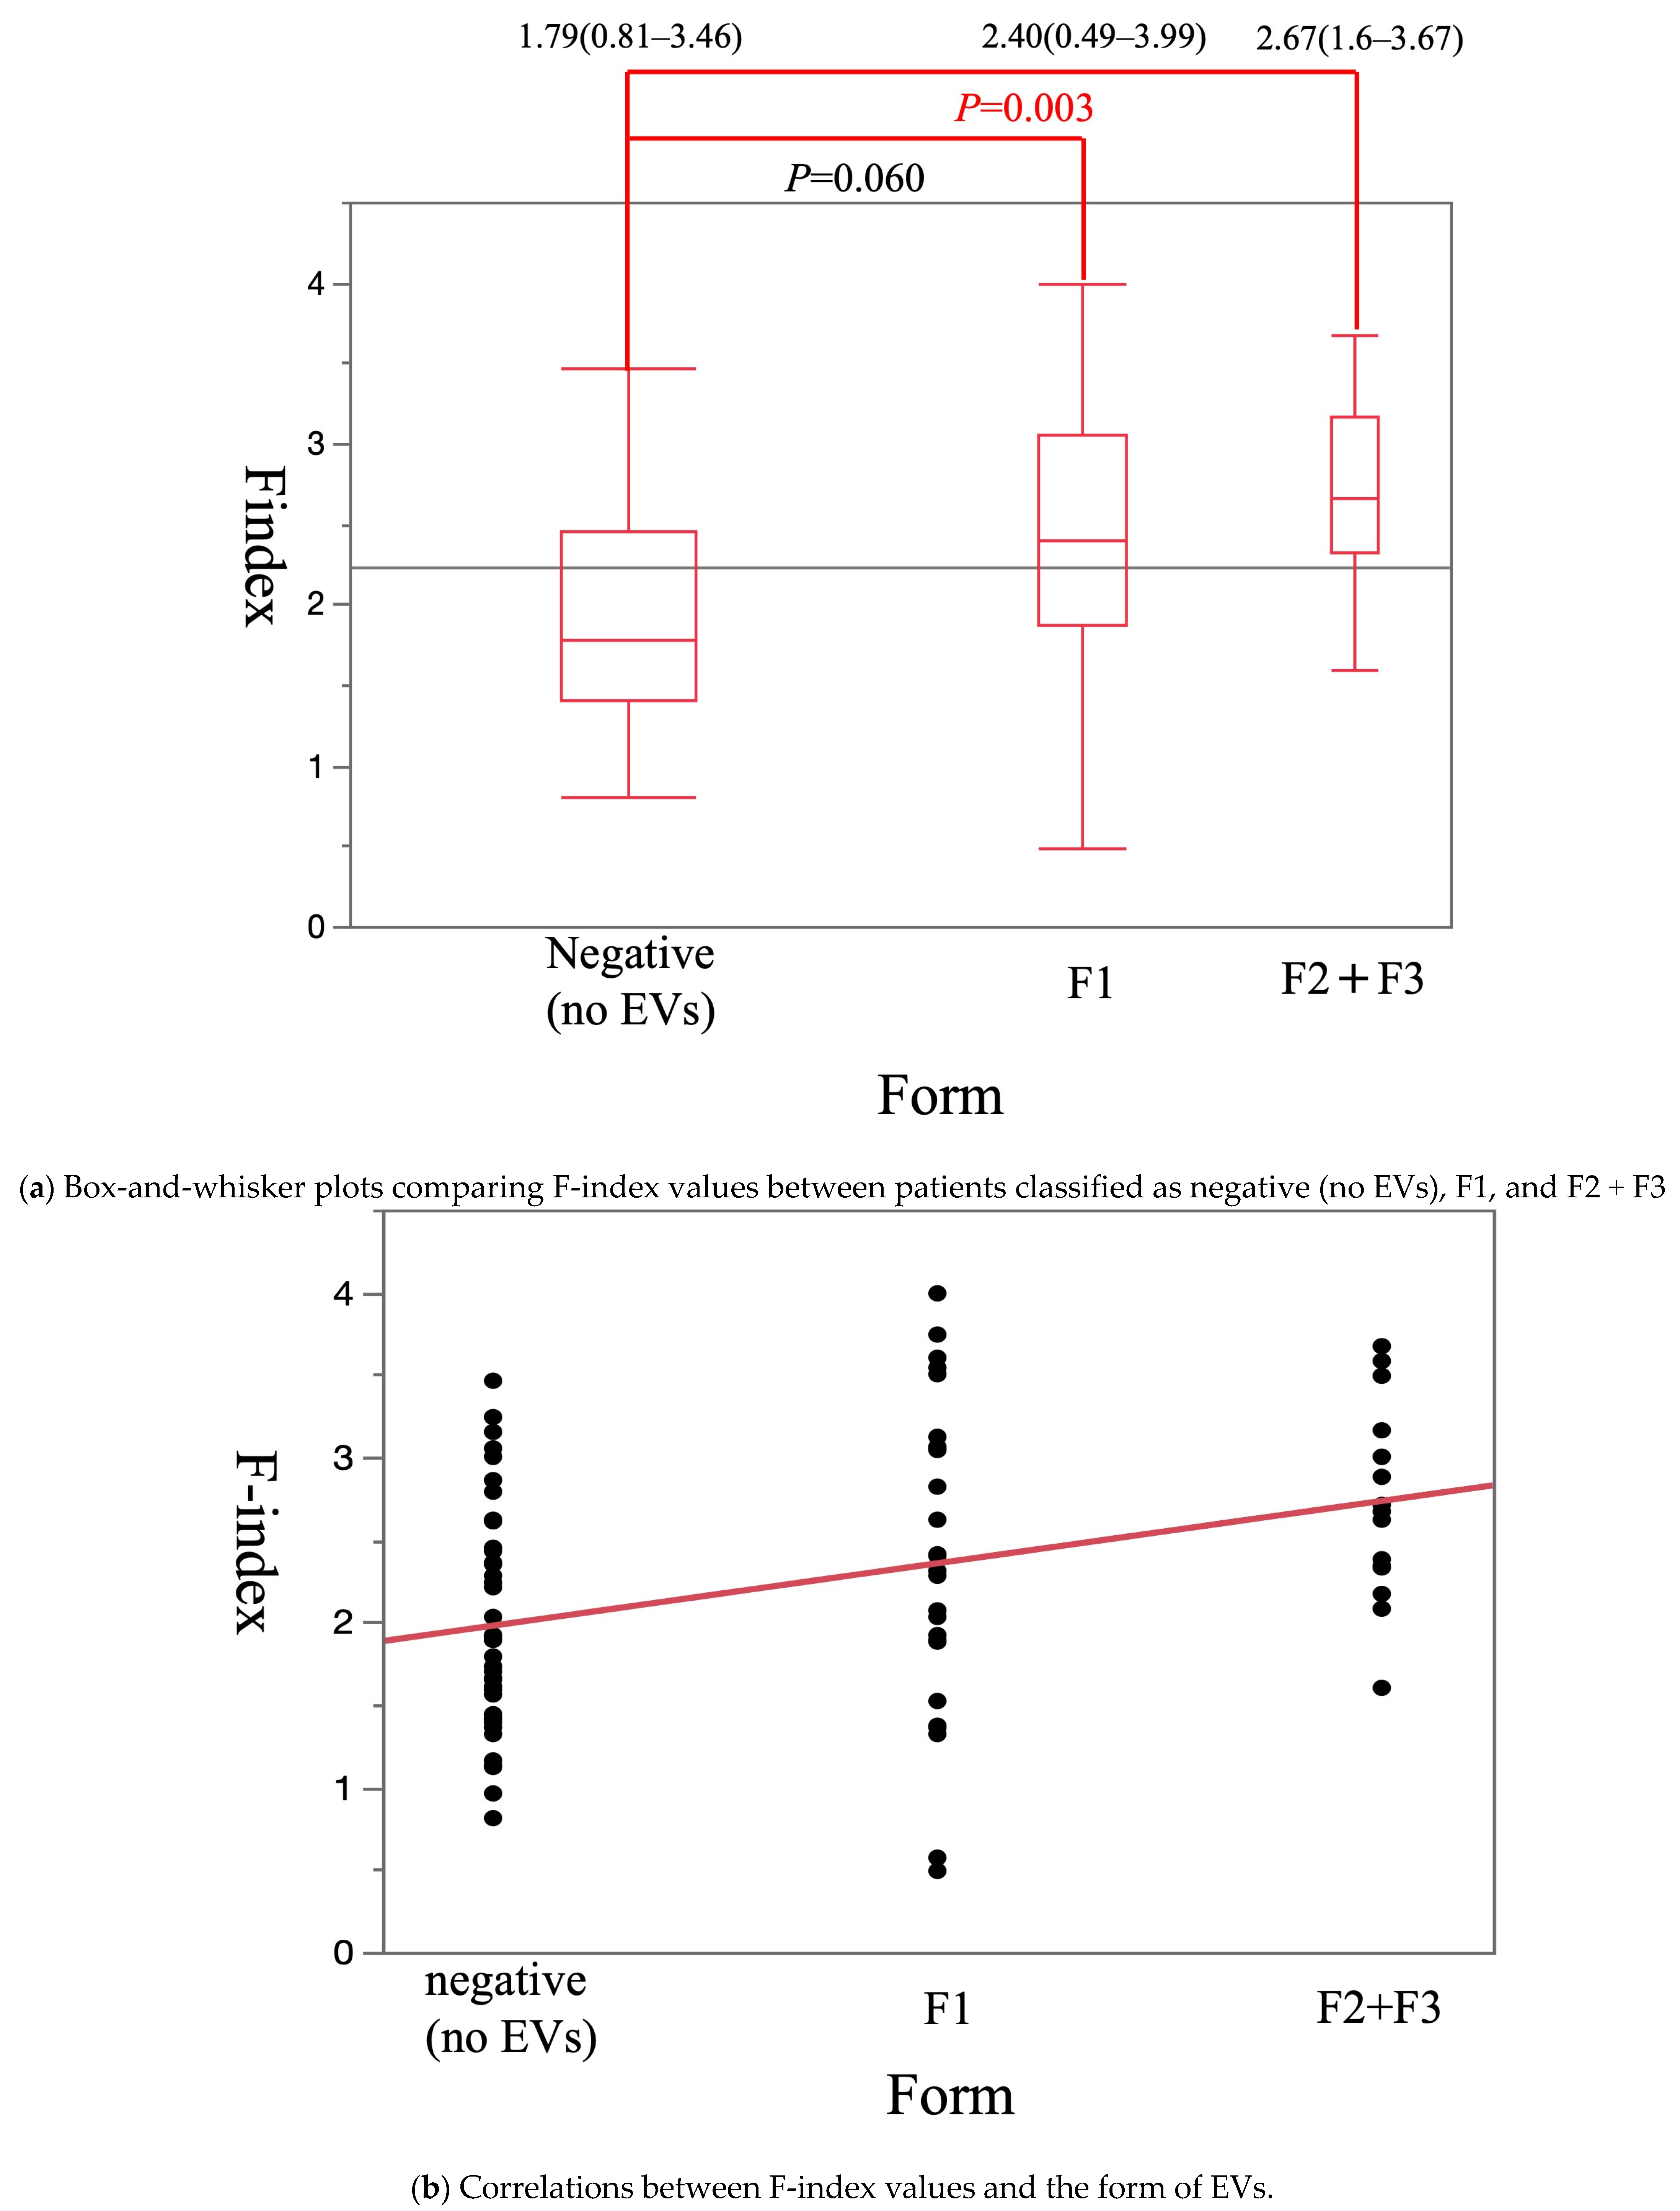
3. Results
4. Discussion
5. Conclusions
Author Contributions
Funding
Institutional Review Board Statement
Informed Consent Statement
Data Availability Statement
Conflicts of Interest
References
- Huang, D.Q.; Terrault, N.A.; Tacke, F.; Gluud, L.L.; Arrese, M.; Bugianesi, E.; Loomba, R. Global epidemiology of cirrhosis—Aetiology, trends and predictions. Nat. Rev. Gastroenterol. Hepatol. 2023, 20, 388–398. [Google Scholar] [CrossRef] [PubMed]
- Garcia-Tsao, G.; Bosch, J. Management of varices and variceal hemorrhage in cirrhosis. N. Engl. J. Med. 2010, 362, 823–832. [Google Scholar] [CrossRef] [PubMed]
- Garcia-Tsao, G. Current management of the complications of cirrhosis and portal hypertension: Variceal hemorrhage, ascites, and spontaneous bacterial peritonitis. Gastroenterology 2001, 120, 726–748. [Google Scholar] [CrossRef] [PubMed]
- Jensen, D.M. Endoscopic screening for varices in cirrhosis: Findings, implications, and outcomes. Gastroenterology 2002, 122, 1620–1630. [Google Scholar] [CrossRef] [PubMed]
- De Franchis, R. Revising consensus in portal hypertension: Report of the Baveno V consensus workshop on methodology of diagnosis and therapy in portal hypertension. J. Hepatol. 2010, 53, 762–768. [Google Scholar] [CrossRef] [PubMed]
- European Association for the Study of the Liver. EASL recommendations on treatment of hepatitis C 2016. J. Hepatol. 2017, 66, 153–194. [Google Scholar] [CrossRef] [PubMed]
- Onar, M.A.; Nural, M.S.; Deveci, A.; Meydan, B.C. Evaluation of liver fibrosis using diffusion-weighted virtual magnetic resonance elastography and ultrasound elastography. Abdom. Radiol. 2025, 1–11. [Google Scholar] [CrossRef] [PubMed]
- BUNKYODO. Japan Society of Portal Hypertension Guide-Line 2022; BUNKYODO: Tokyo, Japan, 2022; pp. 24–26. [Google Scholar]
- Obara, K.; Toyonaga, A.; Kokubu, S. Guidelines for Endoscopic Treatment of Esophagogastric Varices. In Guidelines for Gastrointestinal Endoscopy, 3rd ed.; Society for Japanese Gastroenterological Endoscopy, Ed.; Igaku-Shoin: Tokyo, Japan, 2006; pp. 215–233. (In Japanese) [Google Scholar]
- Garcia-Tsao, G.; Abraldes, J.G.; Berzigotti, A. 2016 practice guidance by American Association for the study of liver diseases. Hepatology 2016, 65, 310–335. [Google Scholar] [CrossRef] [PubMed]
- European Association for the Study of liver. EASL Clinical practice Guideline for the management of patients with decompensated cirrhosis. J. Hepatol. 2018, 69, 406–460. [Google Scholar] [CrossRef] [PubMed]
- Yada, N.; Sakurai, T.; Minami, T.; Arizumi, T.; Takita, M.; Hagiwara, S.; Ueshima, K.; Ida, H.; Nishida, N.; Kudo, M. A newly developed shearwave elastography modality: With a unique reliability index. Oncology 2015, 89, 53–59. [Google Scholar] [CrossRef] [PubMed]
- Yada, N.; Tamaki, N.; Koizumi, Y.; Hirooka, M.; Nakashima, O.; Hiasa, Y.; Izumi, N.; Kudo, M. Diagnosis of Fibrosis and Activity by a Combined Use of Strain and Shear Wave Imaging in Patients with Liver Disease. Dig. Dis. 2017, 35, 515–520. [Google Scholar] [CrossRef] [PubMed]
- ASGE Standards of Practice Committee; Ben-Menachem, T.; Decker, G.A.; Early, D.S.; Evans, J.; Fanelli, R.D.; Fisher, D.A.; Fisher, L.; Fukami, N.; Hwang, J.H.; et al. Adverse events of upper GI endoscopy. Gastrointest. Endosc. 2012, 76, 707–718. [Google Scholar] [CrossRef] [PubMed]
- Tanaka, H. Current role of ultrasound in the diagnosis of hepatocellular carcinoma. J. Med. Ultrason. 2020, 47, 239–255. [Google Scholar] [CrossRef] [PubMed]
- Japan Society of Hepatology. Clinical Practice Guidelines for Hepatocellular Carcinoma 2021; KANEHARA & Co., Ltd.: Tokyo, Japan, 2021; pp. 25–33. [Google Scholar]
- Ferraioli, G.; Filice, C.; Castera, L.; Choi, B.I.; Sporea, I.; Wilson, S.R.; Cosgrove, D.; Dietrich, C.F.; Amy, D.; Bamber, J.C.; et al. WFUMB guidelines and recommendations for clinical use of ultrasound elastography: Part 3: Liver. Ultrasound Med. Biol. 2015, 41, 1161–1179. [Google Scholar] [CrossRef] [PubMed]
- AASLD/IDSA HCV Guidance Panel. Hepatitis C guidance: AASLD-IDSA recommendations for testing, managing, and treating adults infected with hepatitis C virus. Hepatology 2015, 62, 932–954. [Google Scholar] [CrossRef] [PubMed]
- Min, K.; Karuppannan, S.K.; Tae, G. The impact of matrix stiffness on hepatic cell function, liver fibrosis, and hepatocellular carcinoma-Based on quantitative data. Biophys. Rev. 2024, 5, 021306. [Google Scholar] [CrossRef] [PubMed]
- Kazemi, F.; Kettaneh, A.; N’kontchou, G.; Pinto, E.; Ganne-Carrie, N.; Trinchet, J.C.; Beaugrand, M. Liver stiffness measurement selects patients with cirrhosis at risk of bearing large oesophageal varices. J. Hepatol. 2006, 45, 230–235. [Google Scholar] [CrossRef] [PubMed]
- Foucher, J.; Chanteloup, E.; Vergniol, J.; Castéra, L.; Le Bail, B.; Adhoute, X.; Bertet, J.; Couzigou, P.; de Lédinghen, V. Diagnosis of cirrhosis by transient elastography (FibroScan): A prospective study. Gut 2006, 55, 403–408. [Google Scholar] [CrossRef] [PubMed]
- Abraldes, J.G.; Bureau, C.; Stefanescu, H.; Augustin, S.; Ney, M.; Blasco, H.; Procopet, B.; Bosch, J.; Genesca, J.; Berzigotti, A.; et al. Noninvasive tools and risk of clinically significant portal hypertension and varices in compensated cirrhosis: The “Anticipate” study. Hepatology 2016, 64, 2173–2184. [Google Scholar] [CrossRef] [PubMed]
- Fujimoto, K.; Kato, M.; Kudo, M.; Yada, N.; Shiina, T.; Ueshima, K.; Yamada, Y.; Ishida, T.; Azuma, M.; Yamasaki, M.; et al. Novel image analysis method using ultrasound elastography for non-invasive evaluation of hepatic fibrosis in patients with chronic hepatitis C. Oncology 2013, 84 (Suppl. 1), 3–12. [Google Scholar] [CrossRef] [PubMed]
- Petta, S.; Sebastiani, G.; Bugianesi, E.; Viganò, M.; Wong, V.W.; Berzigotti, A.; Fracanzani, A.L.; Anstee, Q.M.; Marra, F.; Barbara, M.; et al. Non-invasive prediction of esophageal varices by stiffness and platelet in non-alcoholic fatty liver disease cirrhosis. J. Hepatol. 2018, 69, 878–885. [Google Scholar] [CrossRef] [PubMed]
- Stefanescu, H.; Grigorescu, M.; Lupsor, M.; Maniu, A.; Crisan, D.; Procopet, B.; Feier, D.; Badea, R. A new and simple algorithm for the noninvasive assessment of esophageal varices in cirrhotic patients using serum fibrosis markers and transient elastography. J. Gastrointest. Liver Dis. 2011, 20, 57–64. [Google Scholar] [PubMed]
- Chen, Y.P.; Zhang, Q.; Dai, L.; Liang, X.E.; Peng, J.; Hou, J.L. Is transient elastography valuable for high-risk esophageal varices prediction in patients with hepatitis-B-related cirrhosis? J. Gastroenterol. Hepatol. 2012, 27, 533–539. [Google Scholar] [CrossRef] [PubMed]
- Arena, U.; Vizzutti, F.; Corti, G.; Ambu, S.; Stasi, C.; Bresci, S.; Moscarella, S.; Boddi, V.; Petrarca, A.; Laffi, G.; et al. Acute viral hepatitis increases liver stiffness values measured by transient elastography. Hepatology 2008, 47, 380–384. [Google Scholar] [CrossRef] [PubMed]
- Millonig, G.; Reimann, F.M.; Friedrich, S.; Fonouni, H.; Mehrabi, A.; Buchler, M.W.; Seitz, H.K.; Mueller, S. Extrahepatic cholestasis increases liver stiffness (FibroScan) irrespective of fi- brosis. Hepatology 2008, 48, 1718–1723. [Google Scholar] [CrossRef] [PubMed]
- Colli, A.; Pozzoni, P.; Berzuini, A.; Gerosa, A.; Canovi, C.; Molteni, E.E.; Barbarini, M.; Bonino, F.; Prati, D. Decompensated chronic heart fail- ure: Increased liver stiffness measured by means of transient elastography. Radiology 2010, 257, 872–878. [Google Scholar] [CrossRef] [PubMed]
- Yada, N.; Kudo, M.; Morikawa, H.; Fujimoto, K.; Kato, M.; Kawada, N. Assessment of liver fibro- sis with real-time tissue elastography in chronic viral hepatitis. Oncology 2013, 84 (Suppl. 1), 13–20. [Google Scholar] [CrossRef] [PubMed]
- Yada, N.; Kudo, M.; Kawada, N.; Sato, S.; Osaki, Y.; Ishikawa, A.; Miyoshi, H.; Sakamoto, M.; Kage, M.; Nakashima, O.; et al. Noninvasive diagnosis of liver fibrosis: Utility of data mining of both ultrasound elastography and sero- logical findings to construct a decision tree. Oncology 2014, 87 (Suppl. 1), 63–72. [Google Scholar] [CrossRef] [PubMed]
- Yada, N.; Sakurai, T.; Minami, T.; Arizumi, T.; Takita, M.; Hagiwara, S.; Ida, H.; Ueshima, K.; Nishida, N.; Kudo, M. Influence of liver inflammation on liver stiffness measurement in patients with autoimmune hepatitis evaluation by combinational elastography. Oncology 2017, 92 (Suppl. 1), 10–15. [Google Scholar] [CrossRef] [PubMed]


| Variable | Esophageal Varices | p-Value | |
|---|---|---|---|
| Absent (n = 43) | Present (n = 42) | ||
| Sex (male/female) | 19/24 | 28/14 | 0.0371 |
| Age (years) | 70.47 ± 11.20 | 67.26 ± 13.41 | |
| Etiology | |||
| HBV | 0 | 4 | 0.0382 |
| HCV | 16 | 12 | 0.3969 |
| Alcoholic hepatitis | 4 | 12 | 0.0231 |
| NASH | 8 | 7 | 0.8147 |
| AIH | 5 | 1 | 0.0961 |
| PBC | 8 | 2 | 0.0477 |
| Others | 2 | 4 | 0.3805 |
| Child-Pugh | |||
| A | 39 | 34 | 0.1970 |
| B | 4 | 8 | 0.1970 |
| C | 0 | 0 | |
| Presence of hepatocellular carcinoma | 17 | 14 | 0.5526 |
| Presence of ascites | 2 | 7 | 0.0719 |
| Platelet count (×104/µL) | 19.85 ± 6.2358 | 13.83 ± 7.315 | <0.0001 |
Disclaimer/Publisher’s Note: The statements, opinions and data contained in all publications are solely those of the individual author(s) and contributor(s) and not of MDPI and/or the editor(s). MDPI and/or the editor(s) disclaim responsibility for any injury to people or property resulting from any ideas, methods, instructions or products referred to in the content. |
© 2025 by the authors. Licensee MDPI, Basel, Switzerland. This article is an open access article distributed under the terms and conditions of the Creative Commons Attribution (CC BY) license (https://creativecommons.org/licenses/by/4.0/).
Share and Cite
Wada, A.; Yamashita, Y.; Iguchi, M.; Ida, Y.; Maekita, T.; Ashida, R.; Kitano, M. Ultrasonography Elastography to Predict the Diagnosis, Severity, and Treatment Indication of Esophageal Varices in Patients with Chronic Liver Diseases. Diagnostics 2025, 15, 1867. https://doi.org/10.3390/diagnostics15151867
Wada A, Yamashita Y, Iguchi M, Ida Y, Maekita T, Ashida R, Kitano M. Ultrasonography Elastography to Predict the Diagnosis, Severity, and Treatment Indication of Esophageal Varices in Patients with Chronic Liver Diseases. Diagnostics. 2025; 15(15):1867. https://doi.org/10.3390/diagnostics15151867
Chicago/Turabian StyleWada, Azusa, Yasunobu Yamashita, Mikitaka Iguchi, Yoshiyuki Ida, Takao Maekita, Reiko Ashida, and Masayuki Kitano. 2025. "Ultrasonography Elastography to Predict the Diagnosis, Severity, and Treatment Indication of Esophageal Varices in Patients with Chronic Liver Diseases" Diagnostics 15, no. 15: 1867. https://doi.org/10.3390/diagnostics15151867
APA StyleWada, A., Yamashita, Y., Iguchi, M., Ida, Y., Maekita, T., Ashida, R., & Kitano, M. (2025). Ultrasonography Elastography to Predict the Diagnosis, Severity, and Treatment Indication of Esophageal Varices in Patients with Chronic Liver Diseases. Diagnostics, 15(15), 1867. https://doi.org/10.3390/diagnostics15151867