


The Diagnostic Value of High-Frequency Ultrasound in Unclarified Lesions at the End of Extremities
 , ,
, ,
Abstract
1. Introduction
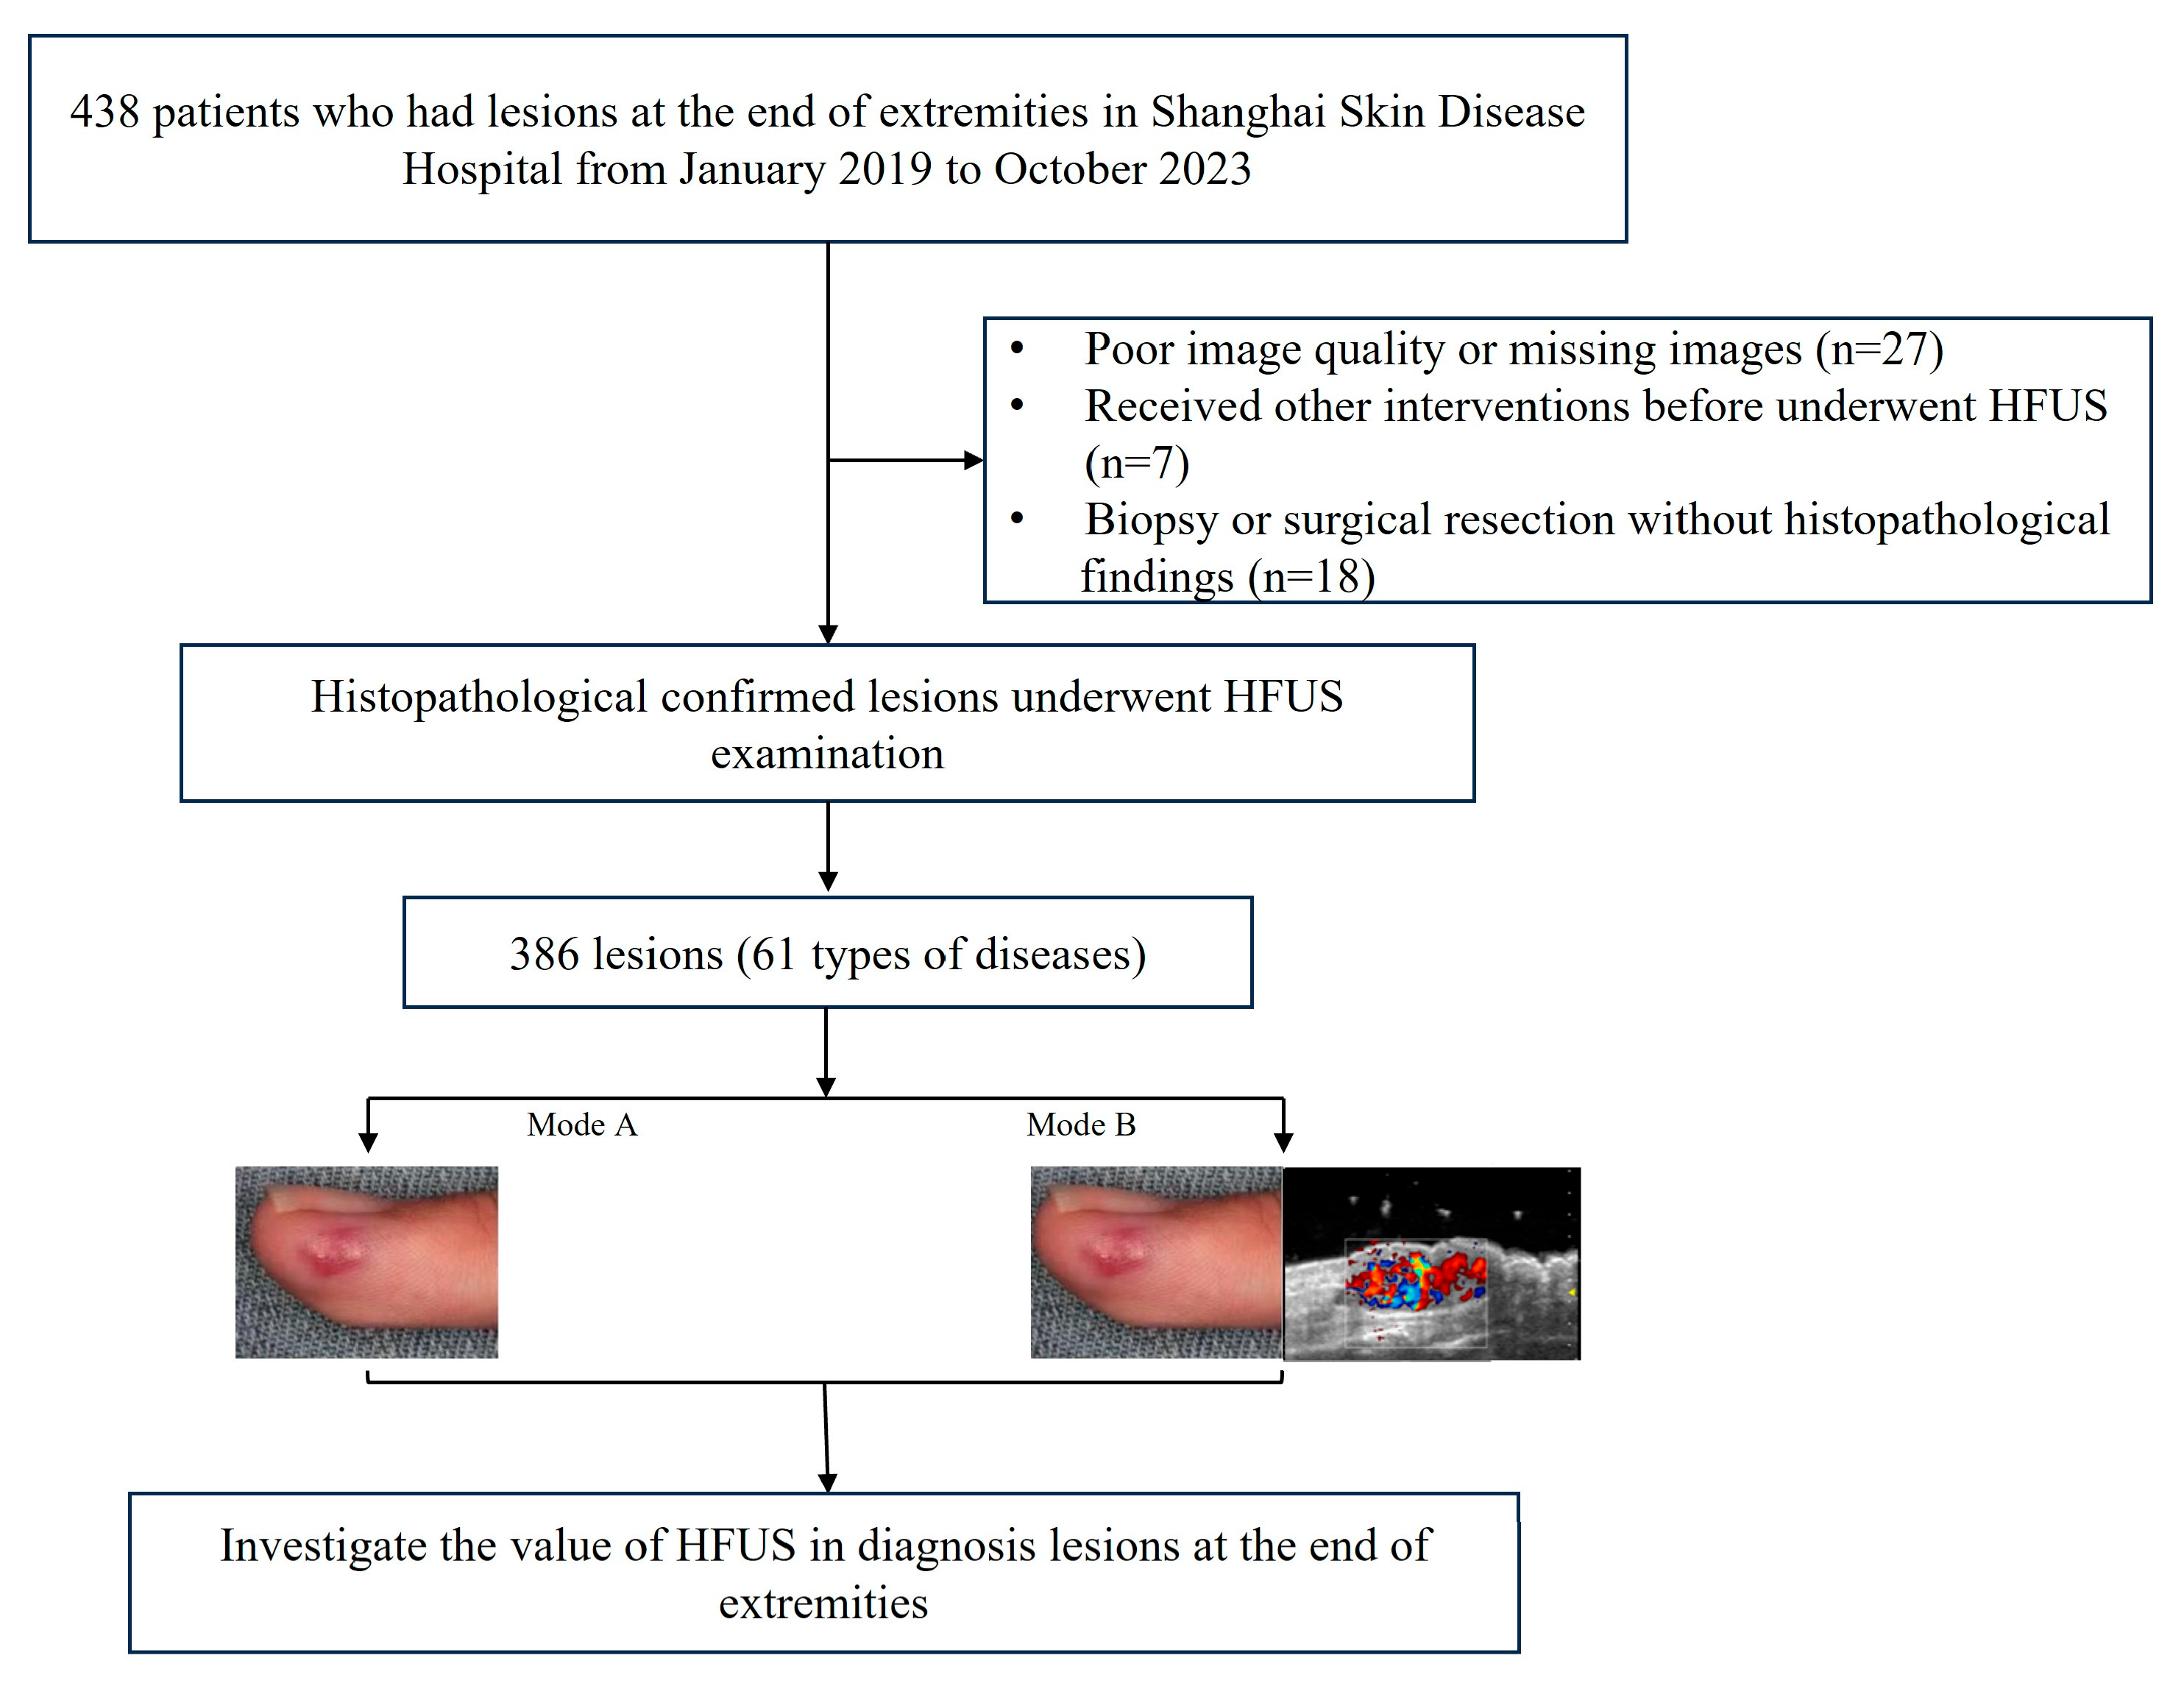
2. Method
2.1. Patients
- (I)
- Having grayscale images, color Doppler flow imaging (CDFI), and dynamic scanning images simultaneously;
- (II)
- Histopathological results from biopsy or surgical resection as the gold standard.
- (I)
- Poor image quality;
- (II)
- The histopathological results were unclear;
- (III)
- Patients received other interventions before undergoing HFUS examination.
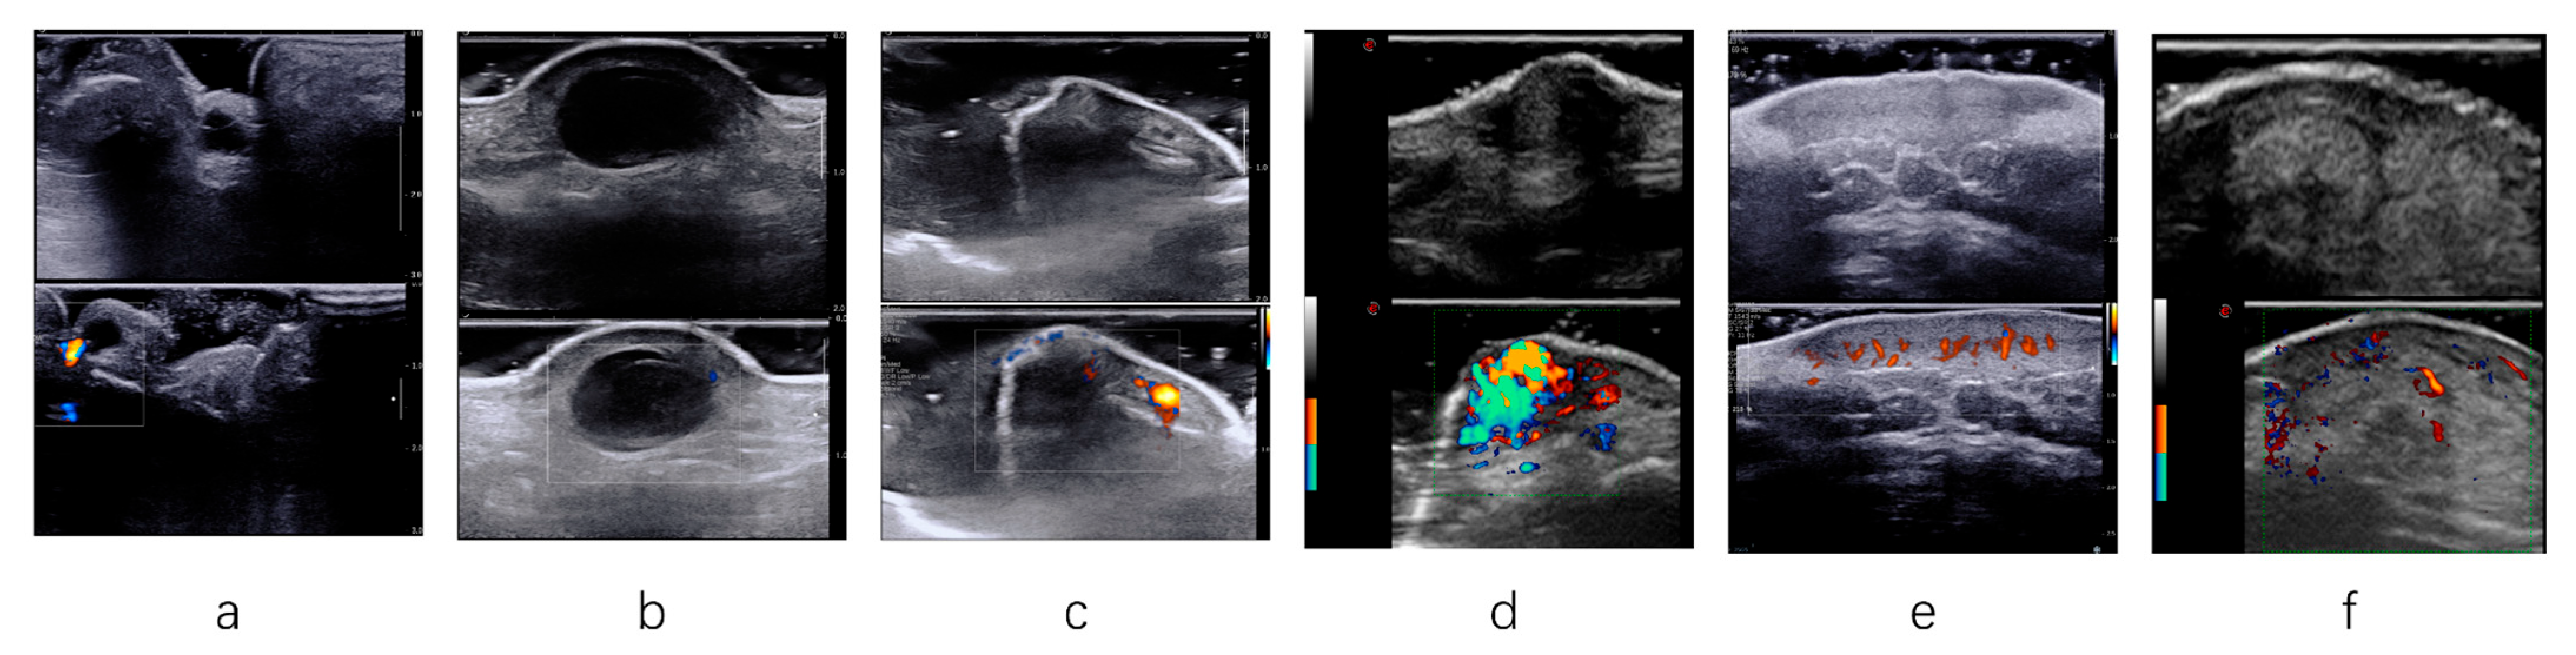
2.2. Acquisition and Analysis of HFUS Findings
- (I)
- Before each examination, the radiologist helped the patients position their bodies in a way that fully exposed the lesions.
- (II)
- If the lesion was located superficially, the radiologist applied sufficient amounts of gel and gently placed the transducer on the lesion’s surface.
- (III)
- Appropriate pressure was applied to the transducer for deep or large lesions to ensure high-quality lesion imaging. Each lesion was thoroughly scanned during the examination, and adjustments were made to the gain, depth, and focus to display each lesion.
- (IV)
- CDFI parameters were also adjusted to suppress noise artifacts and display color Doppler flow signals.
2.3. Clinical Diagnoses
- (I)
- Mode A: only referenced clinical information, which includes features such as clinical manifestations, regional palpation, past medical history, and treatment history for diagnosis.
- (II)
- Mode B: the combination of clinical information and HFUS image information, which includes assessing the lesion’s size, boundary clarity, internal echo characteristics, the characteristics of the skin layer, the involved range of the lesion, and CDFI features.
2.4. Classification Analysis
2.5. Statistical Analysis
3. Results
3.1. Baseline Characteristics
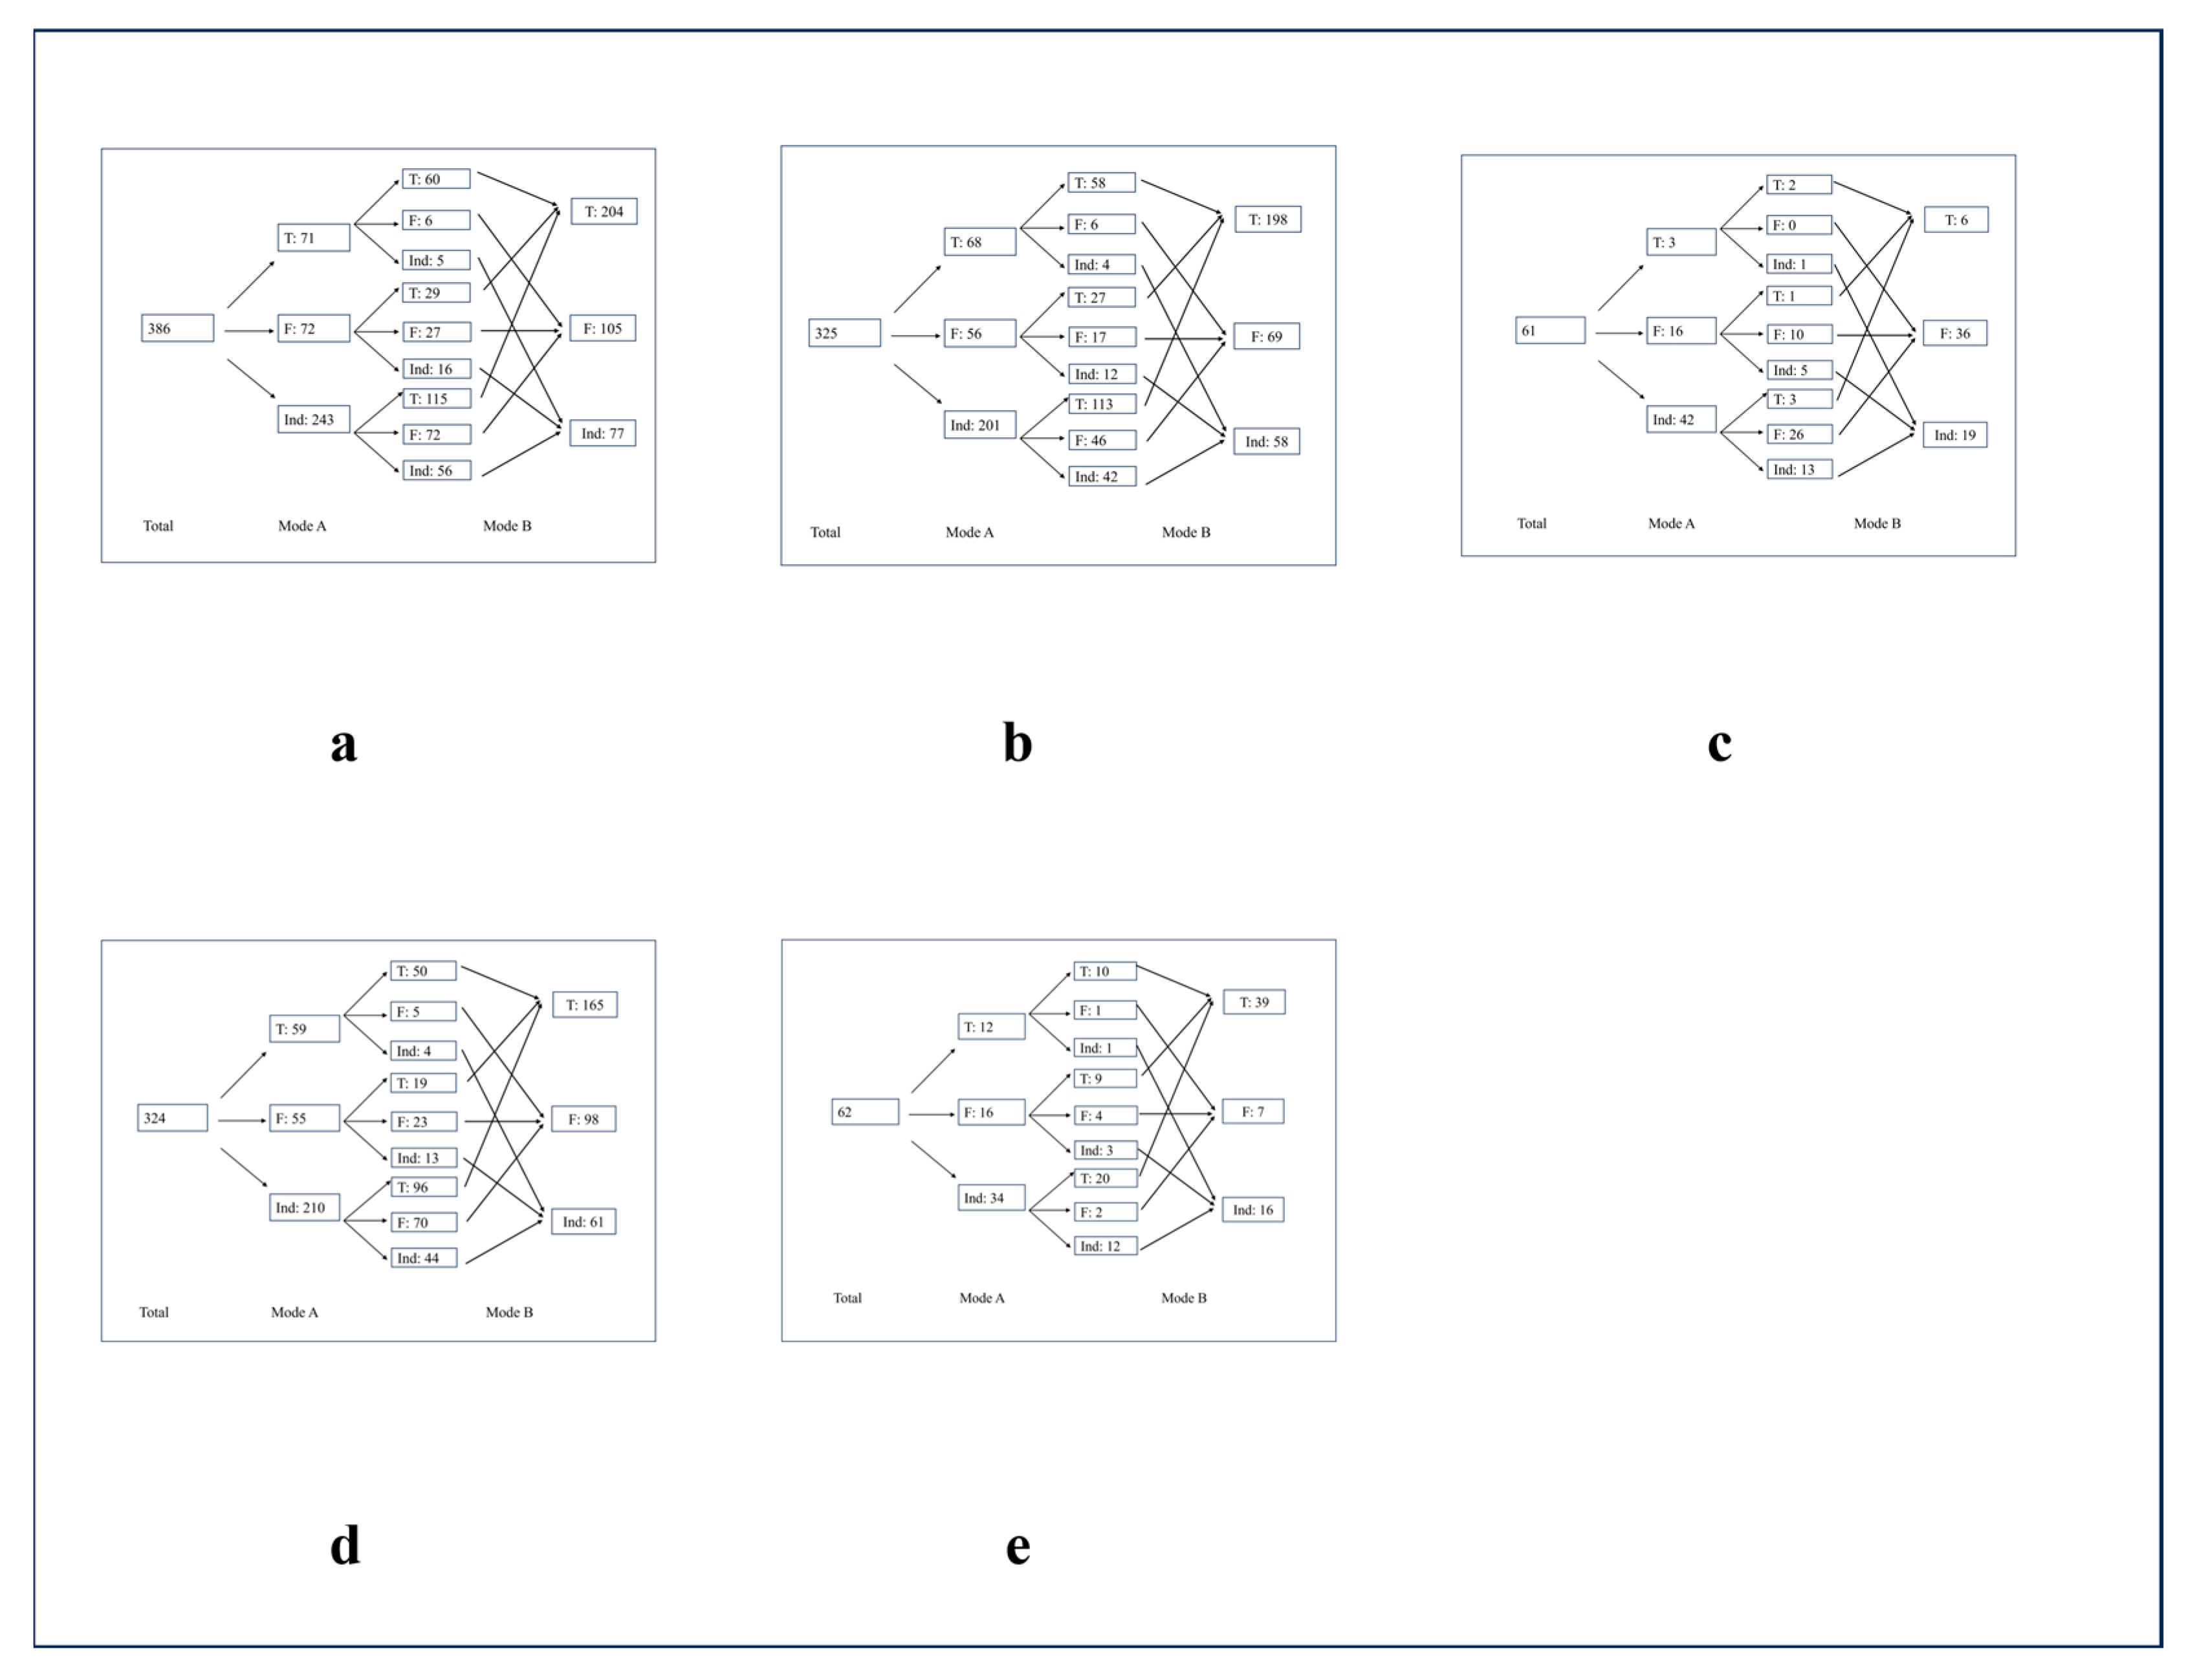
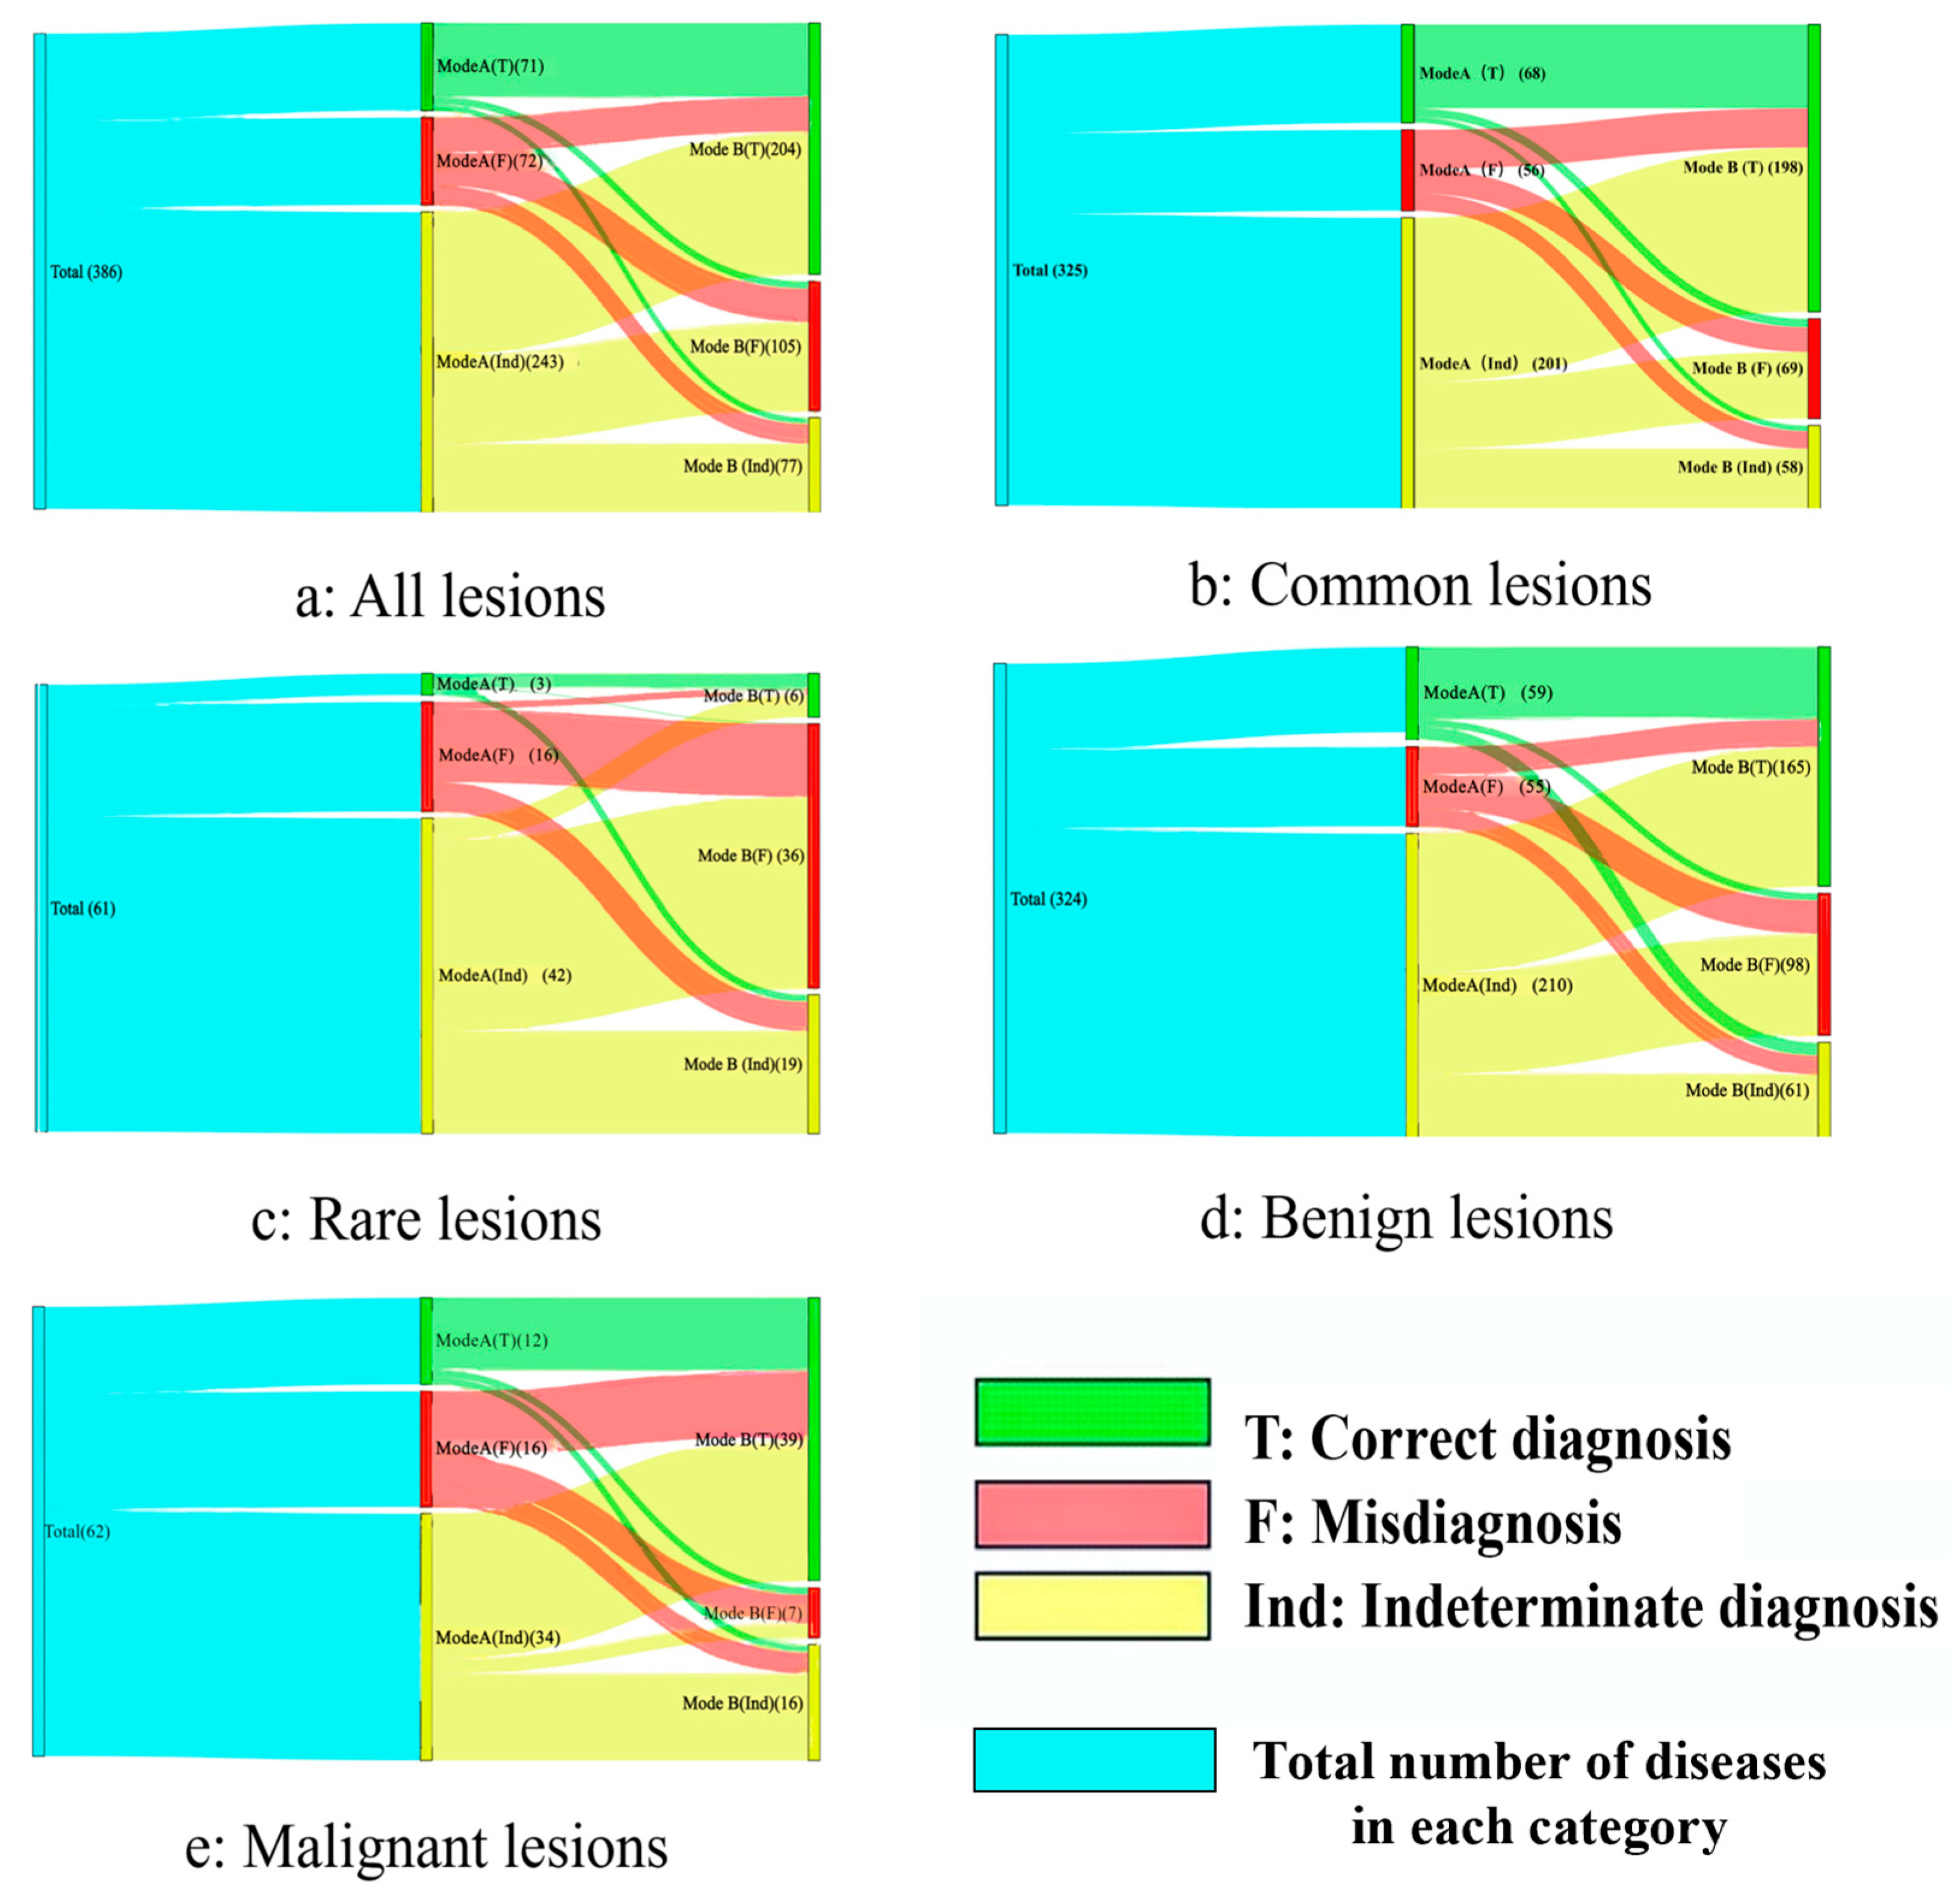
3.2. Performance of Different Diagnosis Modes
3.3. Common and Rare Lesions
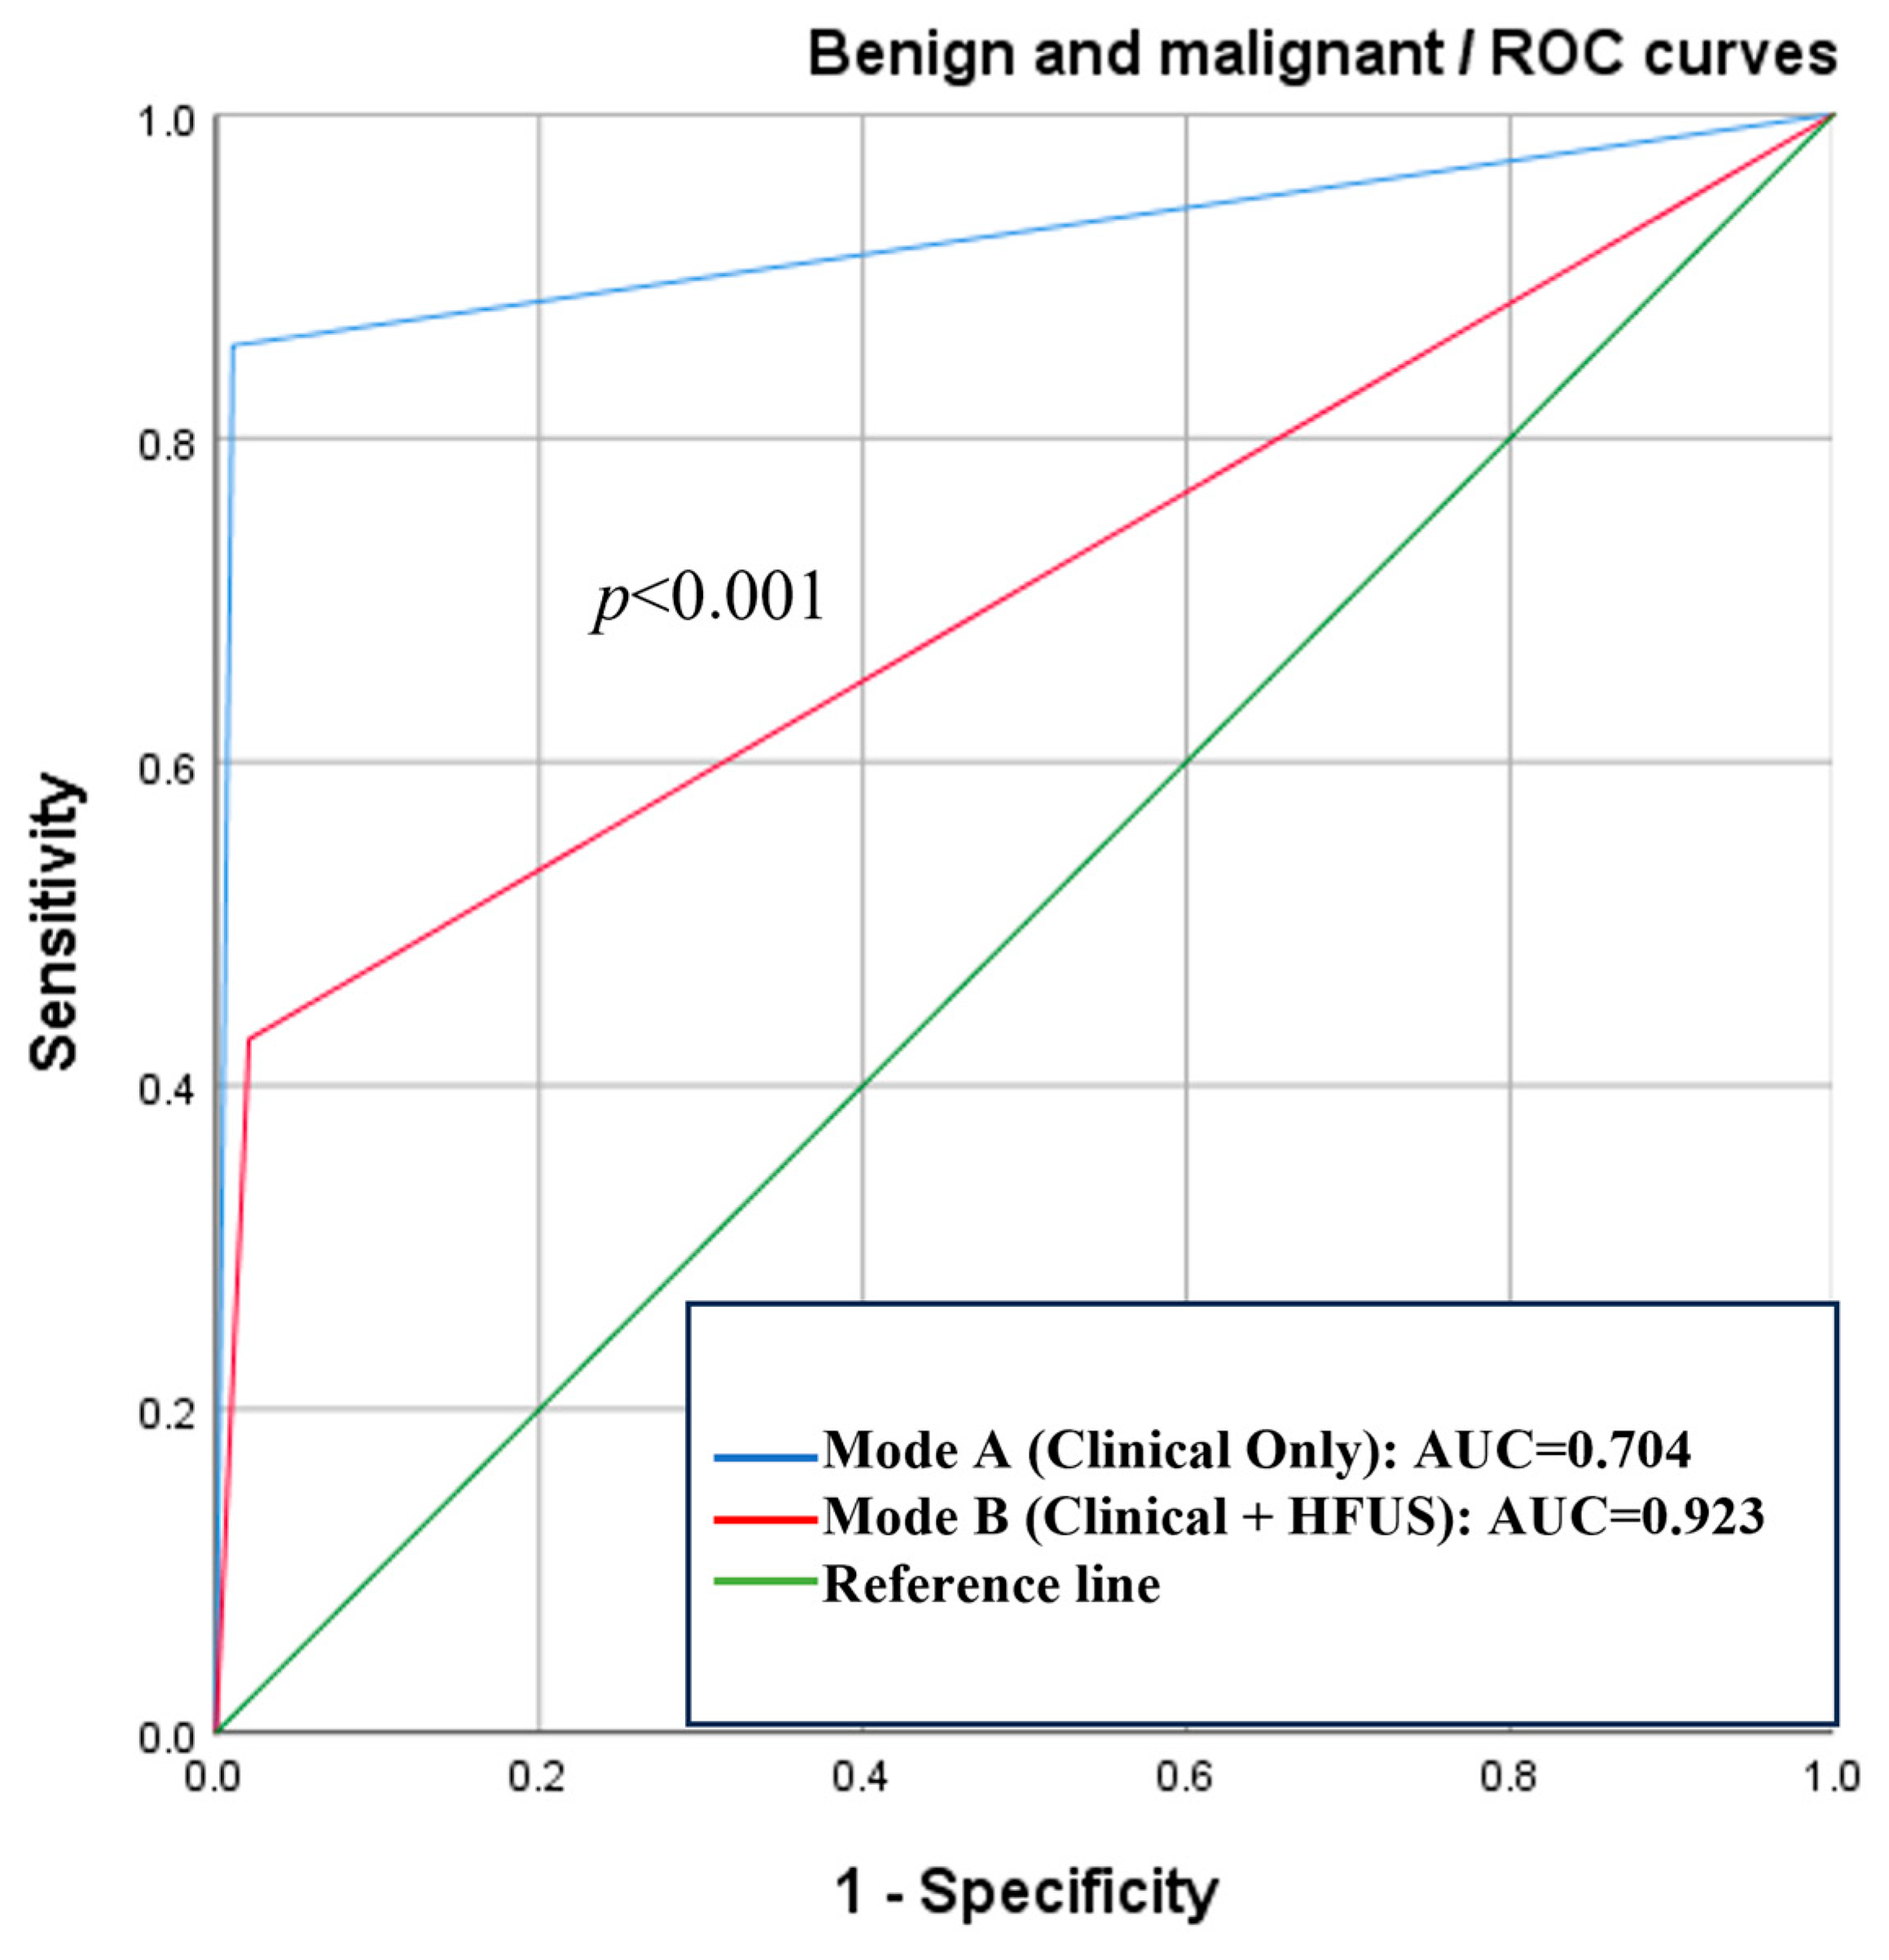
3.4. Benign and Malignant Lesions
3.5. Subungual and Non-Subungual Lesions
3.6. Anatomical Site Analysis
3.7. Correlation Analysis
4. Discussion
5. Conclusions
Author Contributions
Funding
Institutional Review Board Statement
Informed Consent Statement
Data Availability Statement
Acknowledgments
Conflicts of Interest
Abbreviations
| HFUS | High-frequency ultrasound |
| ROC | Receiver operating characteristic curve |
| AUC | Areas under the curve |
| CDFI | Color Doppler flow imaging |
Appendix A

| Type | Total (n) | Mode A | Mode B | ||||
|---|---|---|---|---|---|---|---|
| T | F | Ind | T | F | Ind | ||
| Neurilemoma | 4 | 0 (0.0) | 1 (25.0) | 3 (75.0) | 0 (0.0) | 3 (75.0) | 1 (25.0) |
| Fungal infection | 4 | 0 (0.0) | 1 (25.0) | 3 (75.0) | 0 (0.0) | 2 (50.0) | 2 (50.0) |
| Periungual fibroma | 4 | 0 (0.0) | 2 (50.0) | 2 (50.0) | 1 (25.0) | 0 (0.0) | 3 (75.0) |
| Eccrine poroma | 2 | 1 (50.0) | 1 (50.0) | 0 (0.0) | 1 (50.0) | 1 (50.0) | 0 (0.0) |
| Calcium deposition disease | 2 | 0 (0.0) | 0 (0.0) | 2 (100.0) | 2 (100.0) | 0 (0.0) | 0 (0.0) |
| Onychopapilloma | 2 | 0 (0.0) | 1 (50.0) | 1 (50.0) | 0 (0.0) | 2 (100.0) | 0 (0.0) |
| Neurofibromatosis (NF) | 2 | 0 (0.0) | 0 (0.0) | 2 (100.0) | 1 (50.0) | 1 (50.0) | 0 (0.0) |
| Lipoma | 2 | 1 (50.0) | 0 (0.0) | 1 (50.0) | 1 (50.0) | 1 (50.0) | 0 (0.0) |
| Myofibroma | 2 | 0 (0.0) | 1 (50.0) | 1 (50.0) | 0 (0.0) | 1 (50.0) | 1 (50.0) |
| Seborrheickeratosis | 2 | 0 (0.0) | 1 (50.0) | 1 (50.0) | 0 (0.0) | 2 (100.0) | 0 (0.0) |
| Morphea | 2 | 0 (0.0) | 0 (0.0) | 2 (100.0) | 0 (0.0) | 0 (0.0) | 2 (100.0) |
| Infection | 2 | 1 (50.0) | 0 (0.0) | 1 (50.0) | 0 (0.0) | 0 (0.0) | 2 (100.0) |
| Scar | 1 | 0 (0.0) | 0 (0.0) | 1 (100.0) | 0 (0.0) | 1 (100.0) | 0 (0.0) |
| HPV infection | 1 | 0 (0.0) | 0 (0.0) | 1(100.0) | 0 (0.0) | 1(100.0) | 0 (0.0) |
| Ankyloblastoma | 1 | 0 (0.0) | 0 (0.0) | 1(100.0) | 0 (0.0) | 0 (0.0) | 1(100.0) |
| Traumatic neuroma | 1 | 0 (0.0) | 0 (0.0) | 1(100.0) | 0 (0.0) | 1(100.0) | 0 (0.0) |
| Malignant proliferating trichilemmal tumor | 1 | 0 (0.0) | 0 (0.0) | 1(100.0) | 0 (0.0) | 0 (0.0) | 1(100.0) |
| Malignant eccrine poroma | 1 | 0 (0.0) | 0 (0.0) | 1(100.0) | 0 (0.0) | 0 (0.0) | 1(100.0) |
| Sarcoidosis | 1 | 0 (0.0) | 0 (0.0) | 1(100.0) | 0 (0.0) | 1(100.0) | 0 (0.0) |
| Osteochonfroma | 1 | 0 (0.0) | 1(100.0) | 0 (0.0) | 0 (0.0) | 1(100.0) | 0 (0.0) |
| Angiokeratoma | 1 | 0 (0.0) | 0 (0.0) | 1(100.0) | 0 (0.0) | 1(100.0) | 0 (0.0) |
| Angiolipoma | 1 | 0 (0.0) | 0 (0.0) | 1(100.0) | 0 (0.0) | 0 (0.0) | 1(100.0) |
| Benign lichenoid keratosis | 1 | 0 (0.0) | 0 (0.0) | 1(100.0) | 0 (0.0) | 1(100.0) | 0 (0.0) |
| Chronic fibroid and myofibromatous hyperplasia | 1 | 0 (0.0) | 0 (0.0) | 1(100.0) | 0 (0.0) | 1(100.0) | 0 (0.0) |
| Chronic inflammatory changes | 1 | 0 (0.0) | 1(100.0) | 0 (0.0) | 0 (0.0) | 1(100.0) | 0 (0.0) |
| Chronic hyperplastic inflammation | 1 | 0 (0.0) | 1(100.0) | 0 (0.0) | 0 (0.0) | 1(100.0) | 0 (0.0) |
| Corpus callosum | 1 | 0 (0.0) | 1(100.0) | 0 (0.0) | 0 (0.0) | 1(100.0) | 0 (0.0) |
| Smooth muscle hamartomas | 1 | 0 (0.0) | 0 (0.0) | 1(100.0) | 0 (0.0) | 1(100.0) | 0 (0.0) |
| Soft tissue chondroma | 1 | 0 (0.0) | 0 (0.0) | 1(100.0) | 0 (0.0) | 1(100.0) | 0 (0.0) |
| melanonychia | 1 | 0 (0.0) | 0 (0.0) | 1(100.0) | 0 (0.0) | 1(100.0) | 0 (0.0) |
| Lichenoid dermatitis | 1 | 0 (0.0) | 0 (0.0) | 1(100.0) | 0 (0.0) | 1(100.0) | 0 (0.0) |
| Pemphigus | 1 | 0 (0.0) | 0 (0.0) | 1(100.0) | 0 (0.0) | 1(100.0) | 0 (0.0) |
| Gout | 1 | 0 (0.0) | 1(100.0) | 0 (0.0) | 0 (0.0) | 1(100.0) | 0 (0.0) |
| Angiokeratoma | 1 | 0 (0.0) | 0 (0.0) | 1(100.0) | 0 (0.0) | 1(100.0) | 0 (0.0) |
| Intravascular papillary endothelial hyperplasia | 1 | 0 (0.0) | 0 (0.0) | 1(100.0) | 0 (0.0) | 1(100.0) | 0 (0.0) |
| Angiopericytoma | 1 | 0 (0.0) | 0 (0.0) | 1(100.0) | 0 (0.0) | 1(100.0) | 0 (0.0) |
| Acroangiodermatitis | 1 | 0 (0.0) | 0 (0.0) | 1(100.0) | 0 (0.0) | 1(100.0) | 0 (0.0) |
| Atypical fibrous histiocytoma | 1 | 0 (0.0) | 0 (0.0) | 1(100.0) | 0 (0.0) | 1(100.0) | 0 (0.0) |
| Molluscumfibrosum | 1 | 0 (0.0) | 0 (0.0) | 1(100.0) | 0 (0.0) | 0 (0.0) | 1(100.0) |
| Acrokeratoelastoidosis | 1 | 0 (0.0) | 1(100.0) | 0 (0.0) | 0 (0.0) | 1(100.0) | 0 (0.0) |
| Reactive angioendotheliomatosis | 1 | 0 (0.0) | 1(100.0) | 0 (0.0) | 0 (0.0) | 0 (0.0) | 1(100.0) |
| Unilateral lentiginosis | 1 | 0 (0.0) | 0 (0.0) | 1(100.0) | 0 (0.0) | 0 (0.0) | 1(100.0) |
| Myopericytoma | 1 | 0 (0.0) | 0 (0.0) | 1(100.0) | 0 (0.0) | 0 (0.0) | 1(100.0) |
| Rare diseases | 61 | 3 (4.9) | 16 (26.2) | 42 (68.9) | 6 (9.8) | 36 (59.0) | 19 (31.1) |
References
- Cheng, T.Y.; Tarng, D.C.; Liao, Y.M.; Lin, P.C. Effects of systematic nursing instruction on a low-phosphorus diet, serum phosphorus level and pruritus of patients on haemodialysis. J. Clin. Nurs. 2017, 26, 485–494. [Google Scholar] [CrossRef] [PubMed]
- Fracs, P.C. Bone and Soft Tissue Tumours. ANZ J. Surg. 2002, 72, 694–699. [Google Scholar]
- Alhaskawi, A.; Ezzi, S.H.A.; Dong, Y.; Zhou, H.; Wang, Z.; Lai, J.; Yao, C.; Kota, V.G.; Abdulla, M.H.A.H.; Lu, H. Recent advancements in the diagnosis and treatment of acral melanoma. J. Zhejiang Univ.-Sci. B 2024, 25, 106–122. [Google Scholar]
- Slominski, R.M.; Kim, T.-K.; Janjetovic, Z.; Brożyna, A.A.; Podgorska, E.; Dixon, K.M.; Mason, R.S.; Tuckey, R.C.; Sharma, R.; Crossman, D.K.; et al. Malignant Melanoma: An Overview, New Perspectives, and Vitamin D Signaling. Cancers 2024, 16, 2262. [Google Scholar] [CrossRef]
- Levy, J.; Barrett, D.L.; Harris, N.; Jeong, J.J.; Yang, X.; Chen, S.C. High-frequency ultrasound in clinical dermatology: A review. Ultrasound J. 2021, 13, 24. [Google Scholar] [CrossRef] [PubMed]
- McQueen, A.S.; Bhatia, K.S. Head and neck ultrasound: Technical advances, novel applications and the role of elastography. Clin. Radiol. 2018, 73, 81–93. [Google Scholar] [CrossRef]
- Miao, Y.; Ren, W.W.; Yang, F.Y.; Li, L.; Wu, L.; Dan Shan, D.; Chen, Z.T.; Wang, L.F.; Wang, Q.; Guo, L.H. Diagnostic value of high-frequency ultrasound (HFUS) in evaluation of subcutaneous lesions. Ski. Res. Technol. 2023, 29, e13464. [Google Scholar] [CrossRef]
- Dinnes, J.; Bamber, J.; Chuchu, N.; E Bayliss, S.; Takwoingi, Y.; Davenport, C.; Godfrey, K.; O’SUllivan, C.; Matin, R.N.; Deeks, J.J.; et al. High-frequency ultrasound for diagnosing skin cancer in adults. Cochrane Database Syst. Rev. 2018, 2018, CD013188. [Google Scholar] [CrossRef]
- Zhu, A.-Q.; Wang, Q.; Shi, Y.-L.; Ren, W.-W.; Cao, X.; Ren, T.-T.; Wang, J.; Zhang, Y.-Q.; Sun, Y.-K.; Chen, X.-W.; et al. A deep learning fusion network trained with clinical and high-frequency ultrasound images in the multi-classification of skin diseases in comparison with dermatologists: A prospective and multicenter study. eClinicalMedicine 2024, 67, 102391. [Google Scholar] [CrossRef] [PubMed]
- Chen, L.; Gao, Y.-H.; Chen, J.; Yao, Y.-J.; Wang, R.; Yu, Q.; Hu, B.; Jiang, L.-X. Diagnosis of Subungual Glomus Tumors with 18 MHz Ultrasound and CDFI. Sci. Rep. 2020, 10, 17848. [Google Scholar] [CrossRef]
- Mattioli, M.A.; Aromolo, I.F.; Spigariolo, C.B.; Marzano, A.V.; Nazzaro, G. Sonographic Features of Onychopapilloma: A Single Center Retrospective Observational Study. J. Clin. Med. 2023, 12, 1795. [Google Scholar] [CrossRef]
- Womack, M.E.; Fisher, O.J.; Landrum, M.R.; Rose, R.A. Subungual Exostosis of the Hand: A Case Report in a 5-Year-Old Boy and Literature Review. J. Am. Acad. Orthop. Surg. Glob. Res. Rev. 2022, 6, e21.00239. [Google Scholar] [CrossRef] [PubMed]
- Wang, S.; Hsu, C.J.; Trent, L.; Ryan, T.; Kearns, N.T.; Civillico, E.F.; Kontson, K.L. Evaluation of Performance-Based Outcome Measures for the Upper Limb: A Comprehensive Narrative Review. PM&R 2018, 10, 951–962. [Google Scholar]
- Piraccini, B.M.; Alessandrini, A.; Starace, M.A. Alessandrini, and M. Starace, Onychoscopy: Dermoscopy of the Nails. Dermatol. Clin. 2018, 36, 431–438. [Google Scholar] [CrossRef]
- Liang, H.Y.; Hu, X.E.; Xu, W.L.; Han, Y.S. Ultrasound and MRI features of malignant fibrous histiocytoma of soft tissue. Zhongguo Gu Shang 2019, 32, 736–741. [Google Scholar]
- Loizides, A.; Peer, S.; Plaikner, M.; Djurdjevic, T.; Gruber, H. Perfusion pattern of musculoskeletal masses using contrast-enhanced ultrasound: A helpful tool for characterisation? Eur. Radiol. 2012, 22, 1803–1811. [Google Scholar] [CrossRef] [PubMed]
- Weekes, R.G.; McLeod, R.A.; Reiman, H.M.; Pritchard, D.J. CT of soft-tissue neoplasms. AJR Am. J. Roentgenol. 1985, 144, 355–360. [Google Scholar] [CrossRef]
- Jacobson, J.A.; Middleton, W.D.; Allison, S.J.; Dahiya, N.; Lee, K.S.; Levine, B.D.; Lucas, D.R.; Murphey, M.D.; Nazarian, L.N.; Siegel, G.W.; et al. Ultrasonography of Superficial Soft-Tissue Masses: Society of Radiologists in Ultrasound Consensus Conference Statement. Radiology 2022, 304, 18–30. [Google Scholar] [CrossRef] [PubMed]
- Gómez, M.P.A.; Errani, C.; Lalam, R.; Nikodinovska, V.V.; Fanti, S.; Tagliafico, A.S.; Sconfienza, L.M.; Bazzocchi, A. The Role of Ultrasound in the Diagnosis of Soft Tissue Tumors. Semin. Musculoskelet. Radiol. 2020, 24, 135–155. [Google Scholar]
- Hung, E.H.; Griffith, J.F.; Ng, A.W.; Lee, R.K.; Lau, D.T.; Leung, J.C. Ultrasound of musculoskeletal soft-tissue tumors superficial to the investing fascia. AJR Am. J. Roentgenol. 2014, 202, W532–W540. [Google Scholar] [CrossRef]
- Stieger-Vanegas, S. Focused Ultrasound of Superficial-Soft Tissue Swellings, Masses, and Fluid Collections in Dogs and Cats. Vet. Clin. N. Am. Small Anim. Pract. 2021, 51, 1283–1293. [Google Scholar] [CrossRef]
- Wortsman, X.; Wortsman, J. Clinical usefulness of variable-frequency ultrasound in localized lesions of the skin. J. Am. Acad. Dermatol. 2010, 62, 247–256. [Google Scholar] [CrossRef]
- Long, B.; Zhang, H.; Zhang, H.; Chen, W.; Sun, Y.; Tang, R.; Lin, Y.; Fu, Q.; Yang, X.; Cui, L.; et al. Deep learning models of ultrasonography significantly improved the differential diagnosis performance for superficial soft-tissue masses: A retrospective multicenter study. BMC Med. 2023, 21, 405. [Google Scholar] [CrossRef]
- Zhang, Y.-Q.; Wang, L.-F.; Ni, N.; Li, X.-L.; Zhu, A.-Q.; Guo, L.-H.; Wang, Q.; Xu, H.-X. The Value of Ultra-High-Frequency Ultrasound for the Differentiation between Superficial Basal Cell Carcinoma and Bowen’s Disease. Dermatology 2023, 239, 572–583. [Google Scholar] [CrossRef] [PubMed]
- Akhdari, N. Bowen disease. Can. Med. Assoc. J. 2006, 175, 739. [Google Scholar] [CrossRef] [PubMed]
- Aryan, A.; Alaeen, H.; Dadgostar, M.; Rostamian, A.; Ghajarzadeh, M. Sonoelastography for Skin Evaluation in Sclerodermic Patients. Int. J. Prev. Med. 2019, 10, 91. [Google Scholar] [PubMed]
- Bansal, A.G.; Rosenberg, H.K. Sonography of pediatric superficial lumps and bumps: Illustrative examples from head to toe. Pediatr. Radiol. 2017, 47, 1171–1183. [Google Scholar] [CrossRef]
- Gong, W.; Wang, J.; Zhao, R.; Zheng, M.; Chen, D. Rare malignant melanotic nerve sheath tumors of the upper limb nerves: Utility of high-frequency ultrasonography in preoperative imaging. Skelet. Radiol. 2022, 51, 2201–2204. [Google Scholar] [CrossRef]
- Sharma, B.P.D.; Sharma, P.N. Fibrolipoma of Flexor Digitorum Profundus Tendon of Ring Finger Causing Triggering and Intermittent Carpal Tunnel Syndrome. J. Orthop. Case Rep. 2023, 13, 84–88. [Google Scholar] [CrossRef]
- Tamborini, F.; Cherubino, M.; Scamoni, S.; Valdatta, L.A. Granular cell tumor of the toe: A case report. Dermatol. Res. Pract. 2010, 2010, 184125. [Google Scholar] [CrossRef]
- Fitzmaurice, C.; Abate, D.; Abbasi, N.; Abbastabar, H.; Abd-Allah, F.; Abdel-Rahman, O.; Abdelalim, A.; Abdoli, A.; Abdollahpour, I.; Abdulle, A.S.M.; et al. Global, Regional, and National Cancer Incidence, Mortality, Years of Life Lost, Years Lived with Disability, and Disability-Adjusted Life-Years for 29 Cancer Groups, 1990 to 2017: A Systematic Analysis for the Global Burden of Disease Study. JAMA Oncol. 2019, 5, 1749–1768. [Google Scholar]
- Mayerson, J.L.; Scharschmidt, T.J.; Lewis, V.O.; Morris, C.D. Diagnosis and Management of Soft-tissue Masses. Instr. Course Lect. 2015, 64, 95–103. [Google Scholar] [CrossRef]
- Hashem, A.; Al Kalaawy, B. The feasibility of high-resolution ultrasonography and MRI in diagnosing finger lesions. J. Ultrasound 2022, 25, 133–144. [Google Scholar] [CrossRef] [PubMed]
- Shen, T.; Lee, A.; Shen, C.; Lin, C.J. The long tail and rare disease research: The impact of next-generation sequencing for rare Mendelian disorders. Genet. Res. 2015, 97, e15. [Google Scholar] [CrossRef] [PubMed]
| Characteristics | |
|---|---|
| No. of patients | 386 |
| Sex, n (%) | |
| Male | 154 (39.9%) |
| Female | 232 (60.1%) |
| Age (years) | 50.4 ± 20.1 |
| Type | Total (n) | Mode A | Mode B | p * | ||||
|---|---|---|---|---|---|---|---|---|
| T | F | Ind | T | F | Ind | |||
| Digital mucous cyst | 55 | 16 (29.1) | 8 (14.5) | 31(56.4) | 45 (81.8) | 9 (16.4) | 1 (1.8) | <0.001 |
| Angioneoplasm | 52 | 23 (44.2) | 7 (13.5) | 22 (42.3) | 45 (86.5) | 5 (9.6) | 2 (3.9) | <0.001 |
| Malignant melanoma | 32 | 9 (28.1) | 8 (25.0) | 15 (46.9) | 19 (59.4) | 3 (9.4) | 10 (31.2) | 0.003 |
| Wart | 22 | 6 (27.3) | 4 (18.2) | 12 (54.5) | 12 (54.6) | 5 (22.7) | 5 (22.7) | 0.039 |
| Cutaneous squamous cell carcinoma | 20 | 3 (15.0) | 5 (25.0) | 12 (60.0) | 13 (65.0) | 3 (15.0) | 4 (20.0) | <0.001 |
| Nevus | 20 | 7 (35.0) | 2 (10.0) | 11 (55.0) | 9 (45.0) | 2 (10.0) | 9 (45.0) | 0.109 |
| Nail matrix nevi | 18 | 1 (5.6) | 1 (5.6) | 16 (88.8) | 7 (38.9) | 2 (11.1) | 9 (50.0) | 0.765 |
| Thecal cyst | 16 | 1 (6.3) | 1 (6.3) | 14 (87.4) | 14 (87.4) | 2 (12.6) | 0 (0.0) | 0.008 |
| Papillary endothelial hyperplasia | 14 | 0 (0.0) | 3 (21.4) | 11 (78.6) | 5 (35.7) | 8 (57.1) | 1 (7.2) | / |
| Dermatofibroma | 14 | 0 (0.0) | 0 (0.0) | 14 (100.0) | 4 (28.6) | 10 (71.4) | 0 (0.0) | / |
| Subungual exostosis | 12 | 0 (0.0) | 3 (25.0) | 9 (75.0) | 8 (66.7) | 4 (33.3) | 0 (0.0) | 0.236 |
| Giant cell tumor of the tendon sheath | 10 | 1 (10.0) | 1 (20.0) | 8 (80.0) | 5 (50.0) | 5 (50.0) | 0 (0.0) | 0.444 |
| Granuloma | 9 | 0 (0.0) | 0 (0.0) | 9 (100.0) | 4 (44.4) | 2 (22.2) | 3 (33.4) | / |
| Bowen’s disease | 8 | 0 (0.0) | 3 (37.5) | 5 (62.5) | 7 (87.5) | 1 (12.5) | 0 (0.0) | / |
| Acquired fibrokeratoma of the finger/toe | 5 | 1 (20.0) | 2 (40.0) | 2 (40.0) | 1 (20.0) | 3 (60.0) | 1 (20.0) | 0.600 |
| Acral fibromyoma | 8 | 0 (0.0) | 4 (50.0) | 4 (50.0) | 0 (0.0) | 3 (37.5) | 5 (62.5) | / |
| Nail black spot | 5 | 0 (0.0) | 2 (40.0) | 3 (60.0) | 0 (0.0) | 1 (20.0) | 4 (80.0) | / |
| Chronic proliferative changes | 5 | 0 (0.0) | 3 (60.0) | 2 (40.0) | 0 (0.0) | 1 (20.0) | 4 (80.0) | / |
| Rare diseases ^ | 61 | 3 (4.9) | 16 (26.2) | 42 (68.9) | 6 (9.8) | 36 (59.0) | 19 (31.1) | 0.060 |
| Total | 386 | 71 (18.4) | 72 (18.7) | 243 (62.9) | 204 (52.8) | 105 (27.2) | 77 (20.0) | <0.001 |
| Type | Total (n) | Mode A | Mode B | p | ||||
|---|---|---|---|---|---|---|---|---|
| T | F | Ind | T | F | Ind | |||
| Total | 386 | 71 (18.4) | 72 (18.7) | 243 (62.9) | 204 (52.8) | 105 (27.2) | 77 (20.0) | <0.001 * |
| Incidence rate # | ||||||||
| Common lesions | 325 | 68 (20.9) | 56 (17.2) | 201 (61.9) | 198 (60.9) | 69 (21.2) | 58 (17.9) | <0.001 * |
| Rare lesions | 61 | 3 (4.9) | 16 (26.2) | 42 (68.9) | 6 (9.8) | 36 (59.0) | 19 (31.2) | 0.06 |
| Benign and malignant lesions | ||||||||
| Benign | 324 | 59 (18.2) | 55 (17.0) | 210 (64.8) | 165 (51.0) | 98 (30.2) | 61 (18.8) | <0.001 * |
| Malignant | 62 | 12 (19.4) | 16 (28.8) | 34 (54.8) | 39 (62.9) | 7 (11.3) | 16 (25.8) | 0.198 |
| Location | ||||||||
| Subungual lesions | 71 | 15(21.1) | 11 (15.5) | 45 (63.4) | 29 (40.8) | 11 (15.5) | 31 (43.7) | 0.009 * |
| Non-subungual lesions | 315 | 56 (17.8) | 61 (19.4) | 198 (62.8) | 175 (55.6) | 94 (29.8) | 46 (14.6) | <0.001 * |
| Anatomical | ||||||||
| Finger | 247 | 55 (22.3) | 50 (20.2) | 142 (57.5) | 140 (56.7) | 68 (27.5) | 39 (15.8) | <0.001 * |
| Toe | 139 | 16 (11.5) | 22 (15.8) | 101 (72.7) | 64 (46.0) | 37 (26.7) | 38 (27.3) | 0.036 * |
| Visible lesions (Mode B) | 335 | 65 (19.4) | 58 (17.3%) | 212 (63.3%) | 204 (60.9) | 105 (31.3%) | 26 (7.8%) | <0.001 * |
| Type | Mode | Sensitivity | Specificity | AUC (95% CI) | Delong Test (p) |
|---|---|---|---|---|---|
| Malignant and benign lesions | A | 42.9% | 98.0% | 0.704 (0.559~0.849) | <0.001 * |
| B | 85.7% | 99.0% | 0.923 (0.834~1.000) |
Disclaimer/Publisher’s Note: The statements, opinions and data contained in all publications are solely those of the individual author(s) and contributor(s) and not of MDPI and/or the editor(s). MDPI and/or the editor(s) disclaim responsibility for any injury to people or property resulting from any ideas, methods, instructions or products referred to in the content. |
© 2025 by the authors. Licensee MDPI, Basel, Switzerland. This article is an open access article distributed under the terms and conditions of the Creative Commons Attribution (CC BY) license (https://creativecommons.org/licenses/by/4.0/).
Share and Cite
Yang, H.; Ni, N.; Ren, W.; Wang, Q.; Lu, M.; Gao, Y.; Zhang, G.; Lai, Y.; Zhao, Y.; Guo, L.; et al. The Diagnostic Value of High-Frequency Ultrasound in Unclarified Lesions at the End of Extremities. Diagnostics 2025, 15, 1605. https://doi.org/10.3390/diagnostics15131605
Yang H, Ni N, Ren W, Wang Q, Lu M, Gao Y, Zhang G, Lai Y, Zhao Y, Guo L, et al. The Diagnostic Value of High-Frequency Ultrasound in Unclarified Lesions at the End of Extremities. Diagnostics. 2025; 15(13):1605. https://doi.org/10.3390/diagnostics15131605
Chicago/Turabian StyleYang, Haojie, Na Ni, Weiwei Ren, Qiao Wang, Mengyu Lu, Yincheng Gao, Guanqun Zhang, Yongxian Lai, Yujing Zhao, Lehang Guo, and et al. 2025. "The Diagnostic Value of High-Frequency Ultrasound in Unclarified Lesions at the End of Extremities" Diagnostics 15, no. 13: 1605. https://doi.org/10.3390/diagnostics15131605
APA StyleYang, H., Ni, N., Ren, W., Wang, Q., Lu, M., Gao, Y., Zhang, G., Lai, Y., Zhao, Y., Guo, L., Shan, D., & Sun, L. (2025). The Diagnostic Value of High-Frequency Ultrasound in Unclarified Lesions at the End of Extremities. Diagnostics, 15(13), 1605. https://doi.org/10.3390/diagnostics15131605