


The Teacher–Assistant–Student Collaborative and Competitive Network for Brain Tumor Segmentation with Missing Modalities


Abstract
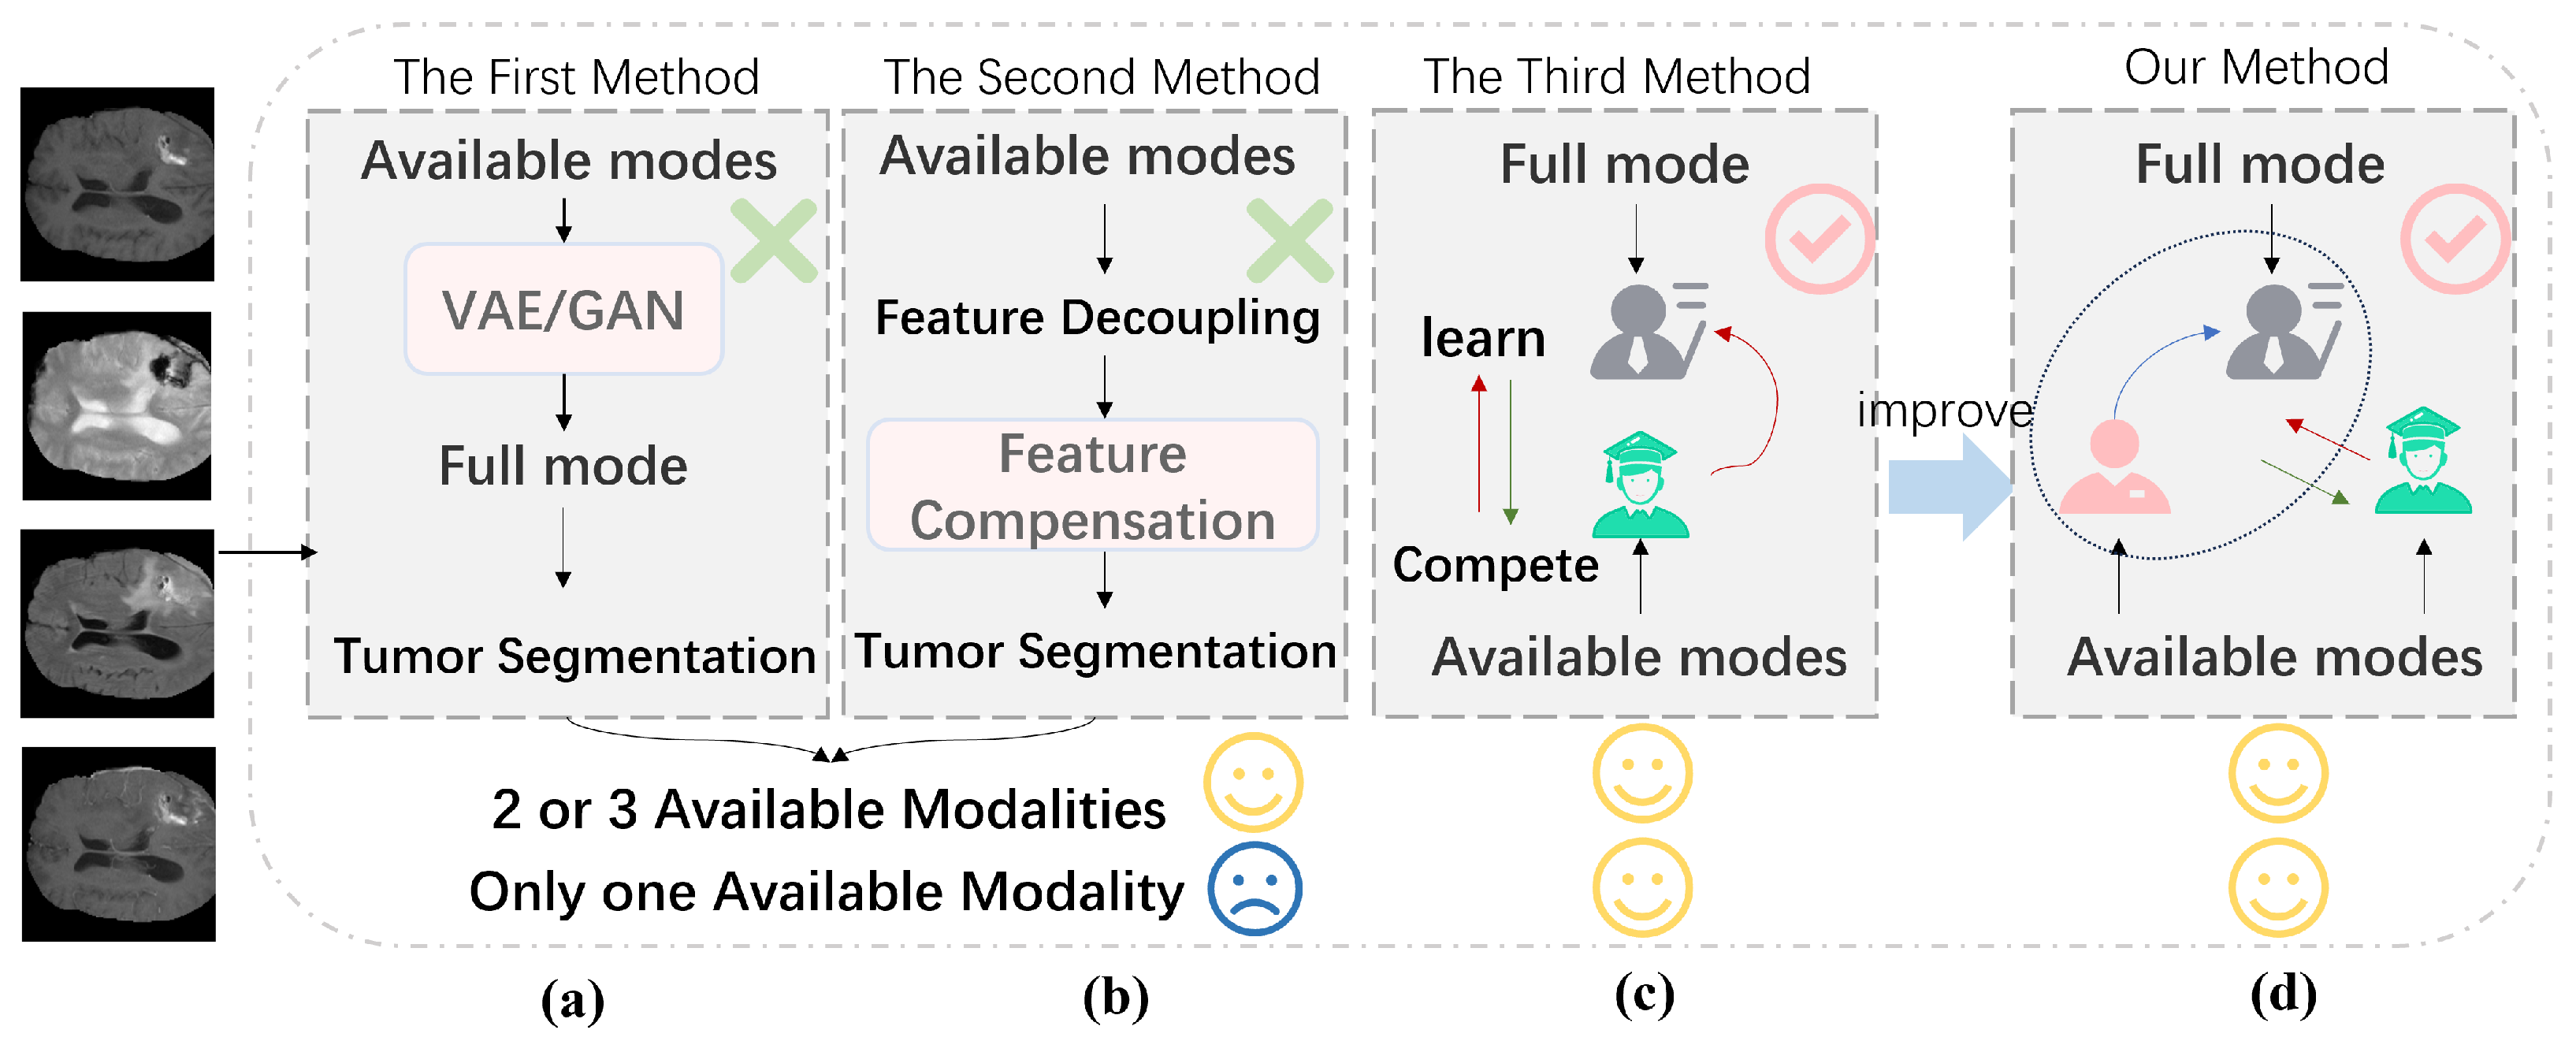
1. Introduction
- A Multihead Mixture of Experts (MHMoE) mechanism was introduced to enhance the model’s feature representation.
- The competitive function was effectively integrated into the model, improving the student network’s performance.
- An auxiliary network inspired by the human visual system was proposed to address the limitations of knowledge updating in the teacher network.
- Experimental results demonstrated that both the teacher model and the student network performed well, with the student network surpassing the teacher network in some cases.
2. Materials and Methods
2.1. CGAMHMoE-UNet Teacher Model
2.2. Assistant Module
2.3. Competitive Knowledge Distillation
3. Results
3.1. Materials and Methods
3.1.1. Dataset
3.1.2. Evaluation Metrics
3.1.3. Implementation Details
3.2. Comparison with State-of-the-Art Methods
3.2.1. Quantitative Analysis
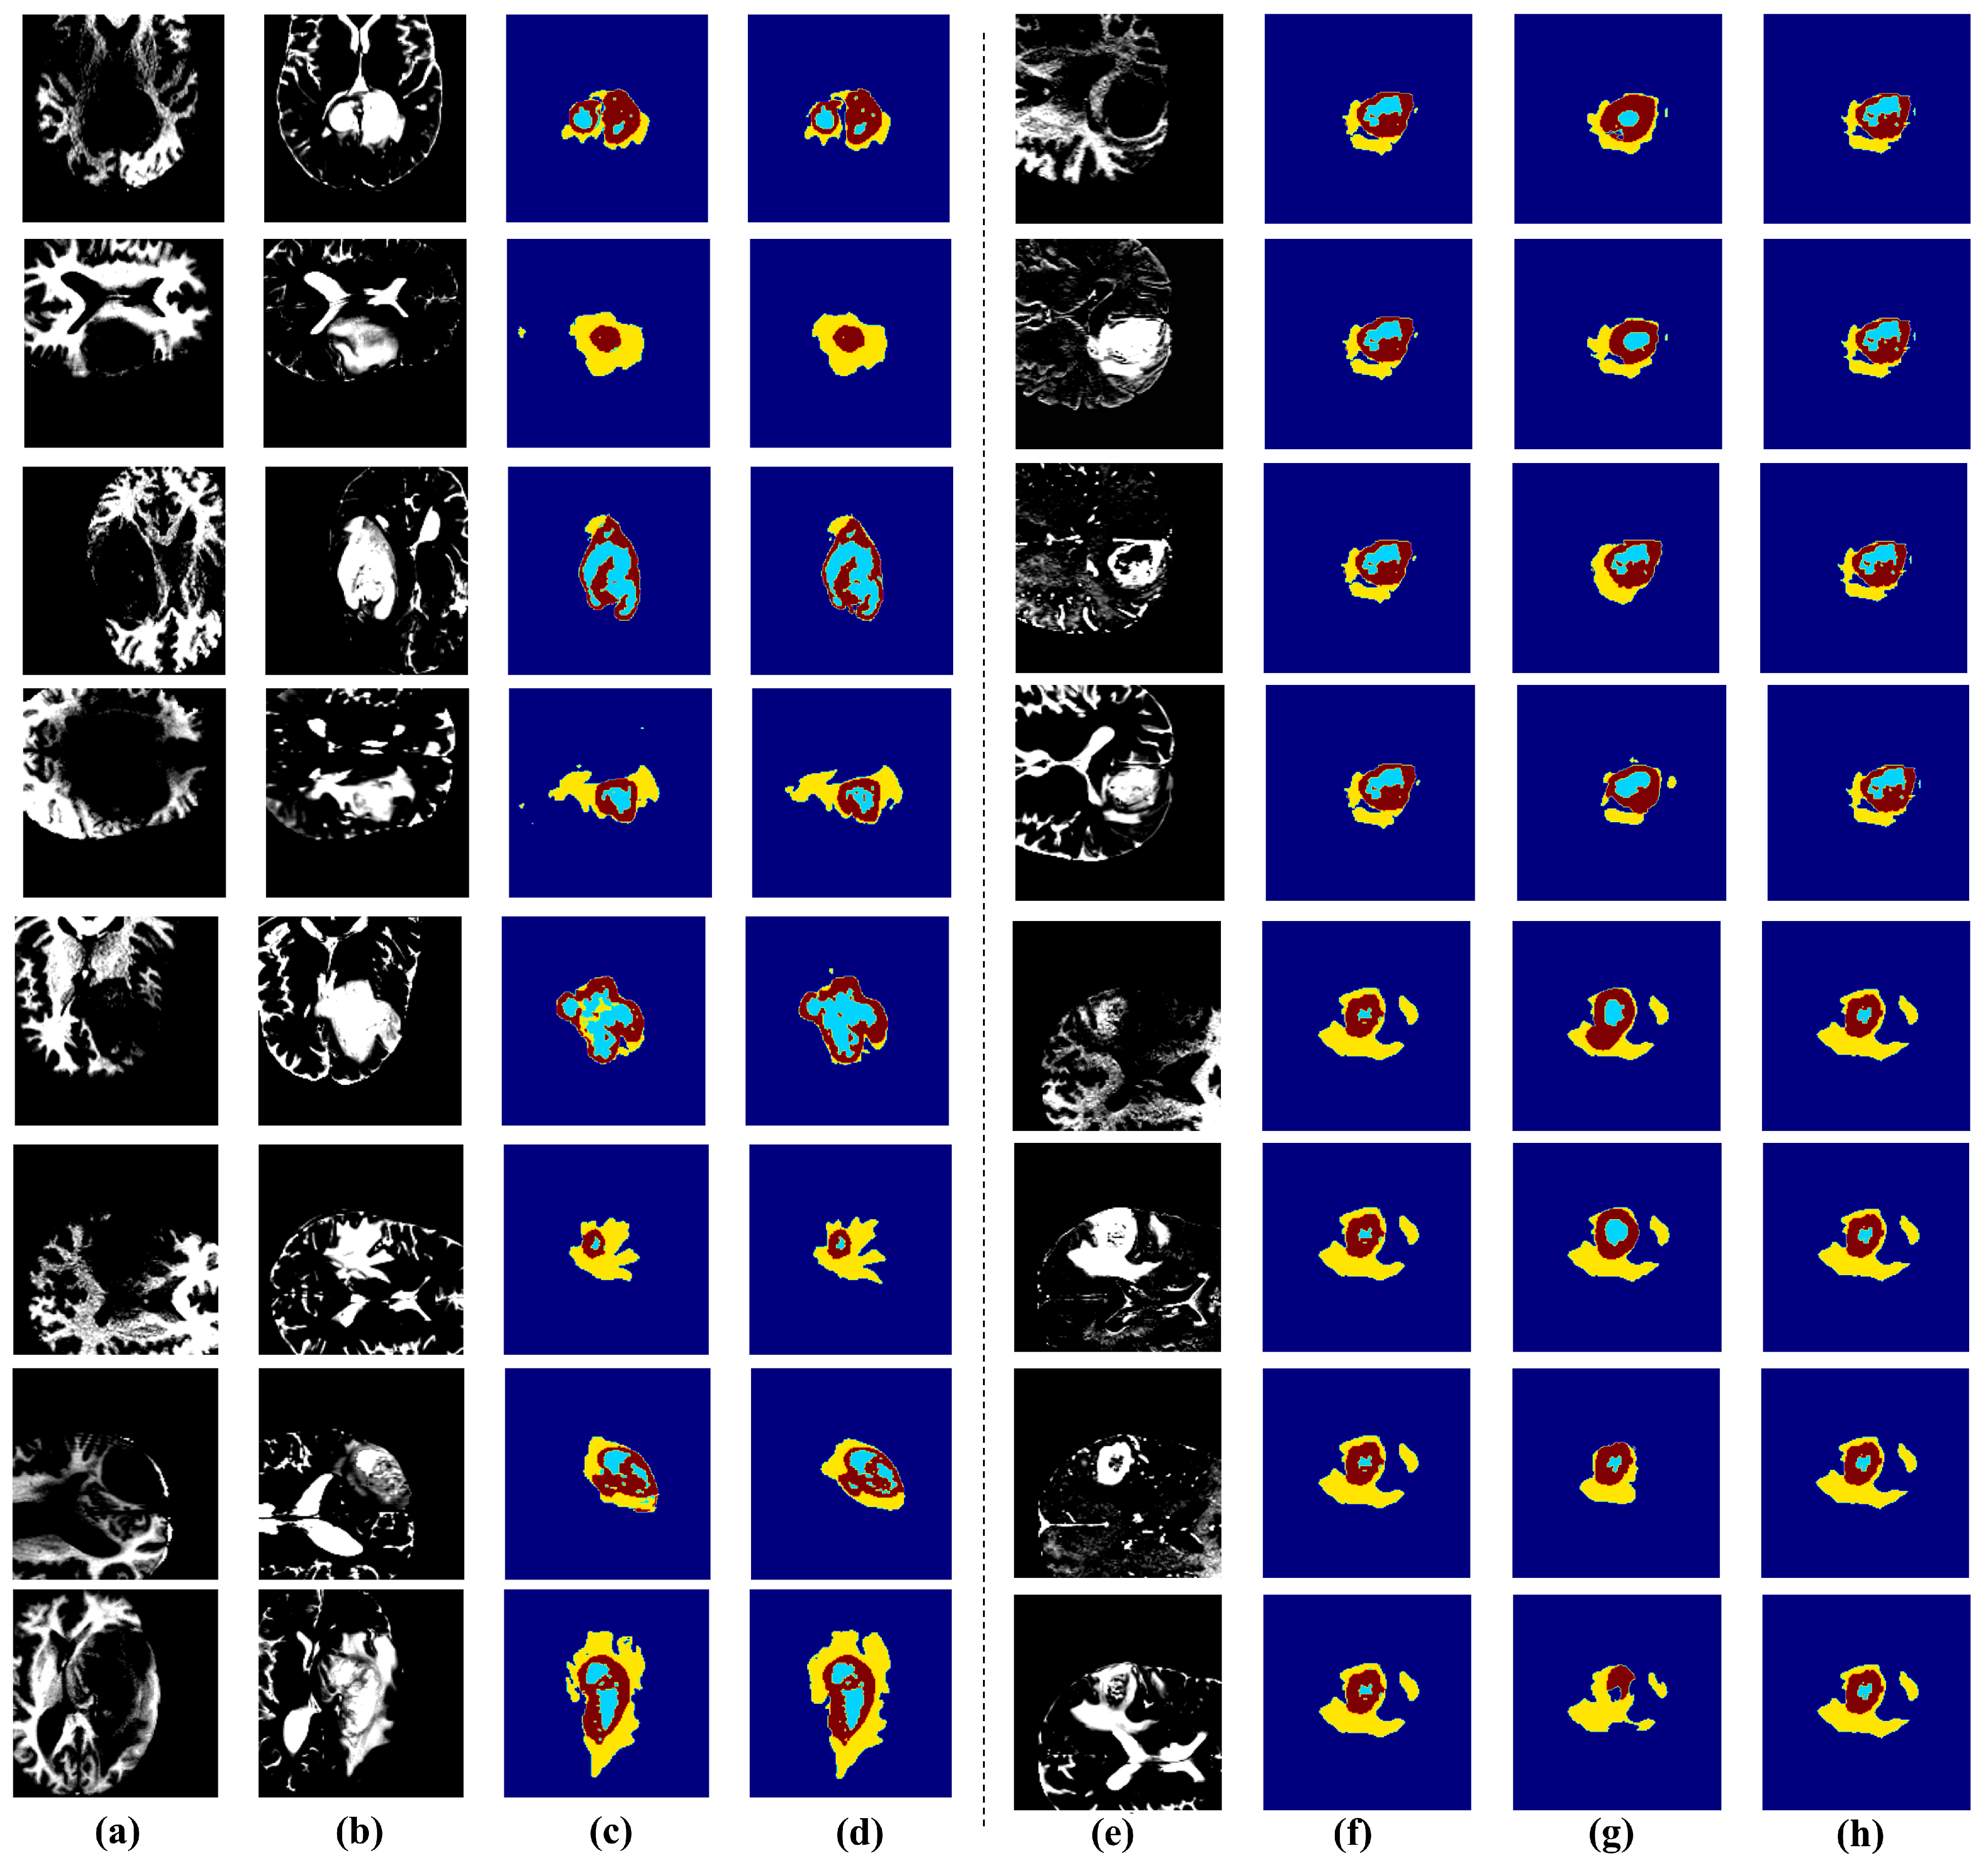
3.2.2. Qualiative Analysis
3.3. Ablation Experiments
3.3.1. MHMoE
3.3.2. Assistant
3.3.3. Compete
3.4. Discussion
4. Conclusions
Author Contributions
Funding
Institutional Review Board Statement
Informed Consent Statement
Data Availability Statement
Conflicts of Interest
References
- Liu, Y.; Ma, Y.; Zhu, Z.; Cheng, J.; Chen, X. TransSea: Hybrid CNN-Transformer with Semantic Awareness for 3D Brain Tumor Segmentation. IEEE Trans. Instrum. Meas. 2024, 73, 16–31. [Google Scholar] [CrossRef]
- Yang, L.; Gu, Y.; Bian, G.; Liu, Y. TMF-Net: A transformer-based multiscale fusion network for surgical instrument segmentation from endoscopic images. IEEE Trans. Instrum. Meas. 2022, 72, 5001715. [Google Scholar] [CrossRef]
- Yue, G.; Wu, S.; Du, J.; Zhou, T.; Jiang, B.; Wang, T. Adaptive context aggregation network with prediction-aware decoding for multi-modal brain tumor segmentation. IEEE Trans. Instrum. Meas. 2024, 73, 4008411. [Google Scholar] [CrossRef]
- Zhang, X.; Liu, A.; Jiang, P.; Qian, R.; Wei, W.; Chen, X. MSAIF-Net: A Multi-Stage Spatial Attention based Invertible Fusion Network for MR Images. IEEE Trans. Instrum. Meas. 2023, 72, 5025813. [Google Scholar] [CrossRef]
- Zhang, J.; Chen, D.; Ma, D.; Ying, C.; Sun, X.; Xu, X.; Cheng, Y. CdcSegNet: Automatic COVID-19 infection segmentation from CT images. IEEE Trans. Instrum. Meas. 2023, 72, 5012313. [Google Scholar] [CrossRef]
- Jiang, Z.; Li, X.; Chu, X.; Karlas, A.; Bi, Y.; Cheng, Y.; Au, K.S.; Navab, N. Needle segmentation using gan: Restoring thin instrument visibility in robotic ultrasound. IEEE Trans. Instrum. Meas. 2024, 73, 4012211. [Google Scholar] [CrossRef]
- Hu, K.; Zhu, Y.; Zhou, T.; Zhang, Y.; Cao, C.; Xiao, F.; Gao, X. DSC-Net: A novel interactive two-stream network by combining transformer and CNN for ultrasound image segmentation. IEEE Trans. Instrum. Meas. 2023, 72, 5030012. [Google Scholar] [CrossRef]
- Xin, B.; Hu, Y.; Zheng, Y.; Liao, H. Multi-modality generative adversarial networks with tumor consistency loss for brain mr image synthesis. In Proceedings of the 2020 IEEE 17th International Symposium on Biomedical Imaging (ISBI), Iowa City, IA, USA, 3–7 April 2020; pp. 1803–1807. [Google Scholar]
- Sharma, A.; Hamarneh, G. Missing MRI pulse sequence synthesis using multi-modal generative adversarial network. IEEE Trans. Med. Imaging 2019, 39, 1170–1183. [Google Scholar] [CrossRef]
- Havaei, M.; Guizard, N.; Chapados, N.; Bengio, Y. Hemis: Hetero-modal image segmentation. In Proceedings of the Medical Image Computing and Computer-Assisted Intervention–MICCAI 2016: 19th International Conference, Athens, Greece, 17–21 October 2016; Proceedings, Part II 19. Springer: Cham, Switzerland, 2016; pp. 469–477. [Google Scholar]
- Dorent, R.; Joutard, S.; Modat, M.; Ourselin, S.; Vercauteren, T. Hetero-modal variational encoder-decoder for joint modality completion and segmentation. In Proceedings of the Medical Image Computing and Computer Assisted Intervention–MICCAI 2019: 22nd International Conference, Shenzhen, China, 13–17 October 2019; Proceedings, Part II 22. Springer: Cham, Switzerland, 2019; pp. 74–82. [Google Scholar]
- Chen, C.; Dou, Q.; Jin, Y.; Chen, H.; Qin, J.; Heng, P.A. Robust multimodal brain tumor segmentation via feature disentanglement and gated fusion. In Proceedings of the Medical Image Computing and Computer Assisted Intervention–MICCAI 2019: 22nd International Conference, Shenzhen, China, 13–17 October 2019; Proceedings, Part III 22. Springer: Cham, Switzerland, 2019; pp. 447–456. [Google Scholar]
- Zhou, T.; Canu, S.; Vera, P.; Ruan, S. Brain tumor segmentation with missing modalities via latent multi-source correlation representation. In Proceedings of the Medical Image Computing and Computer Assisted Intervention–MICCAI 2020: 23rd International Conference, Lima, Peru, 4–8 October 2020; Proceedings, Part IV 23. Springer: Cham, Switzerland, 2020; pp. 533–541. [Google Scholar]
- Ding, Y.; Yu, X.; Yang, Y. RFNet: Region-aware fusion network for incomplete multi-modal brain tumor segmentation. In Proceedings of the IEEE/CVF International Conference on Computer Vision, Montreal, BC, Canada, 11–17 October 2021; pp. 3975–3984. [Google Scholar]
- Hinton, G.; Vinyals, O.; Dean, J. Distilling the Knowledge in a Neural Network. arXiv 2015, arXiv:1503.02531. [Google Scholar]
- Zhang, Y.; He, N.; Yang, J.; Li, Y.; Wei, D.; Huang, Y.; Zhang, Y.; He, Z.; Zheng, Y. mmformer: Multimodal medical transformer for incomplete multimodal learning of brain tumor segmentation. In Proceedings of the International Conference on Medical Image Computing and Computer-Assisted Intervention–MICCAI 2022, 25th International Conference, Singapore, 18–22 September 2022; Proceedings, Part V. Springer: Cham, Switzerland, 2022; pp. 107–117. [Google Scholar]
- Liu, H.; Wei, D.; Lu, D.; Sun, J.; Wang, L.; Zheng, Y. M3AE: Multimodal representation learning for brain tumor segmentation with missing modalities. In Proceedings of the AAAI Conference on Artificial Intelligence, Washington, DC, USA, 7–14 February 2023; Volume 37, pp. 1657–1665. [Google Scholar]
- Wang, S.; Yan, Z.; Zhang, D.; Wei, H.; Li, Z.; Li, R. Prototype knowledge distillation for medical segmentation with missing modality. In Proceedings of the ICASSP 2023-2023 IEEE International Conference on Acoustics, Speech and Signal Processing (ICASSP), Rhodes Island, Greece, 4–10 June 2023; pp. 1–5. [Google Scholar]
- Hu, M.; Maillard, M.; Zhang, Y.; Ciceri, T.; La Barbera, G.; Bloch, I.; Gori, P. Knowledge distillation from multi-modal to mono-modal segmentation networks. In Proceedings of the Medical Image Computing and Computer Assisted Intervention–MICCAI 2020: 23rd International Conference, Lima, Peru, 4–8 October 2020; Proceedings, Part I 23. Springer: Cham, Switzerland, 2020; pp. 772–781. [Google Scholar]
- Yang, Q.; Guo, X.; Chen, Z.; Woo, P.Y.; Yuan, Y. D 2-Net: Dual disentanglement network for brain tumor segmentation with missing modalities. IEEE Trans. Med. Imaging 2022, 41, 2953–2964. [Google Scholar] [CrossRef]
- Hu, W.; Tan, Y. Generating adversarial malware examples for black-box attacks based on GAN. In Proceedings of the International Conference on Data Mining and Big Data: 7th International Conference, DMBD 2022, Beijing, China, 21–24 November 2022; Proceedings, Part II. Springer: Singapore, 2022; pp. 409–423. [Google Scholar]
- Xu, Y.; Yan, S.; Zhang, Y. Object recognition in primates using deep neural networks. IEEE Trans. Cogn. Dev. Syst. 2024, 6, 101–110. [Google Scholar]
- Zhou, Y.; Lei, T.; Liu, H.; Du, N.; Huang, Y.; Zhao, V.; Dai, A.M.; Chen, Z.; Le, Q.V.; Laudon, J. Mixture-of-experts with expert choice routing. Adv. Neural Inf. Process. Syst. 2022, 35, 7103–7114. [Google Scholar]
- Wu, X.; Huang, S.; Wang, W.; Wei, F. Multi-head mixture-of-experts. arXiv 2024, arXiv:2404.15045. [Google Scholar]
- Chen, Z.; He, Z.; Lu, Z.M. DEA-Net: Single image dehazing based on detail-enhanced convolution and content-guided attention. IEEE Trans. Image Process. 2024, 33, 1002–1015. [Google Scholar] [CrossRef] [PubMed]
- Ronneberger, O.; Fischer, P.; Brox, T. U-Net: Convolutional Networks for Biomedical Image Segmentation. arXiv 2015, arXiv:1505.04597. [Google Scholar]
- Balas, B.; Nakano, L.; Rosenholtz, R. A summary-statistic representation in peripheral vision explains visual crowding. J. Vis. 2009, 9, 13. [Google Scholar] [CrossRef]
- Min, J.; Zhao, Y.; Luo, C.; Cho, M. Peripheral vision transformer. Adv. Neural Inf. Process. Syst. 2022, 35, 32097–32111. [Google Scholar]
- Zhu, J.; Zhang, X.; Fang, X.; Wang, Y.; Tan, P.; Liu, J. Perception-and-Regulation Network for Salient Object Detection. IEEE Trans. Multimed. 2022, 25, 6525–6537. [Google Scholar] [CrossRef]
- Vaswani, A.; Shazeer, N.; Parmar, N.; Uszkoreit, J.; Jones, L.; Gomez, A.N.; Kaiser, L.; Polosukhin, I. Attention is all you need. Adv. Neural Inf. Process. Syst. 2017, 30, 5998–6008. [Google Scholar]
- Menze, B.H.; Jakab, A.; Bauer, S.; Kalpathy-Cramer, J.; Farahani, K.; Kirby, J.; Burren, Y.; Porz, N.; Slotboom, J.; Wiest, R.; et al. The multimodal brain tumor image segmentation benchmark (BRATS). IEEE Trans. Med. Imaging 2014, 34, 1993–2024. [Google Scholar] [CrossRef]
- Baid, U.; Ghodasara, S.; Mohan, S.; Bilello, M.; Calabrese, E.; Colak, E.; Farahani, K.; Kalpathy-Cramer, J.; Kitamura, F.C.; Pati, S.; et al. The RSNA-ASNR-MICCAI BraTS 2021 Benchmark on Brain Tumor Segmentation and Radiogenomic Classification. arXiv 2021, arXiv:2107.02314. [Google Scholar]
- Chen, C.; Dou, Q.; Jin, Y.; Liu, Q.; Heng, P.A. Learning with privileged multimodal knowledge for unimodal segmentation. IEEE Trans. Med. Imaging 2022, 41, 621–632. [Google Scholar] [CrossRef]
- Li, K.; Yu, L.; Wang, S.; Heng, P.A. Towards cross-modality medical image segmentation with online mutual knowledge distillation. In Proceedings of the AAAI Conference on Artificial Intelligence, New York, NY, USA, 7–12 February 2020; Volume 34, pp. 775–783. [Google Scholar]
- Zhang, X.; Ou, N.; Basaran, B.D.; Visentin, M.; Qiao, M.; Gu, R.; Ouyang, C.; Liu, Y.; Matthew, P.M.; Ye, C.; et al. A Foundation Model for Brain Lesion Segmentation with Mixture of Modality Experts. arXiv 2024, arXiv:2405.10246. [Google Scholar]


| Method | T1 | T2 | T1ce | Flair | ||||||||||||
|---|---|---|---|---|---|---|---|---|---|---|---|---|---|---|---|---|
| WT | TC | ET | Avg | WT | TC | ET | Avg | WT | TC | ET | Avg | WT | TC | ET | Avg | |
| Teacher | 89.77 | 82.93 | 70.65 | 81.12 | – | – | – | – | – | – | – | – | – | – | – | – |
| M3AE [17] | 74.4 | 66.1 | 37.1 | 59.20 | 84.8 | 69.4 | 47.6 | 67.27 | 78.01 | 80.13 | 66.3 | 74.81 | 88.1 | 64.4 | 36.1 | 62.87 |
| KD-Net [19] | 72.62 | 59.13 | 38.1 | 56.62 | 82.47 | 66.17 | 45.66 | 64.77 | 73.6 | 81.5 | 67.7 | 74.27 | 85.8 | 62.6 | 38.1 | 62.17 |
| RF-Net [14] | 74.8 | 65.2 | 35.3 | 58.43 | 84.9 | 66.1 | 38.11 | 63.04 | 67.8 | 73.21 | 67.2 | 69.40 | 77.3 | 51.1 | 20.8 | 49.73 |
| U-HVED [31] | 54.4 | 41.7 | 12.3 | 36.13 | 81.8 | 57.66 | 38.7 | 59.39 | 67.8 | 73.21 | 67.2 | 69.40 | 77.3 | 51.1 | 20.8 | 49.73 |
| PMKL [32] | 71.31 | 65.2 | 38.37 | 58.29 | 82.1 | 67.82 | 48.1 | 66.01 | 70.5 | 75.92 | 70.36 | 72.23 | 84.64 | 64.56 | 36.35 | 61.85 |
| MKD [33] | 74.71 | 59.49 | 39.31 | 57.84 | 81.43 | 66.7 | 45.5 | 64.54 | 72.96 | 77.41 | 70.82 | 73.75 | 86.8 | 63.77 | 34.5 | 61.69 |
| Our | 75.53 | 63.25 | 41.02 | 59.93 | 83.42 | 66.16 | 46.12 | 65.23 | 78.2 | 80.14 | 71.3 | 76.55 | 88.24 | 66.2 | 38.9 | 64.45 |
| Method | T1 | T2 | T1ce | Flair | ||||||||||||
|---|---|---|---|---|---|---|---|---|---|---|---|---|---|---|---|---|
| WT | TC | ET | Avg | WT | TC | ET | Avg | WT | TC | ET | Avg | WT | TC | ET | Avg | |
| Teacher | 90.67 | 84.37 | 72.1 | 82.38 | – | – | – | – | – | – | – | – | – | – | – | – |
| M3AE [17] | 77.82 | 67.3 | 40.1 | 61.74 | 85.8 | 71.25 | 48.61 | 68.55 | 77.84 | 81.9 | 72.43 | 77.39 | 86.8 | 68.2 | 40.29 | 65.10 |
| KD-Net [19] | 75.82 | 62.18 | 42.74 | 60.25 | 84.8 | 67.57 | 46.52 | 66.30 | 79.86 | 82.73 | 68.32 | 76.97 | 87.1 | 62.82 | 38.92 | 62.95 |
| RF-Net [14] | 77.1 | 66 | 37.3 | 60.13 | 86 | 72.12 | 46.2 | 68.11 | 76.7 | 82.5 | 68.2 | 75.80 | 87.3 | 69.1 | 38.1 | 64.83 |
| U-HVED [31] | 55.13 | 43.81 | 19.95 | 39.63 | 80.02 | 62.35 | 37.3 | 59.89 | 68.5 | 73 | 66.6 | 69.37 | 81.91 | 52.92 | 21.32 | 52.05 |
| PMKL [32] | 74.32 | 66.7 | 41.22 | 60.75 | 84.1 | 70.32 | 48.83 | 67.75 | 74.71 | 79.87 | 72.57 | 75.72 | 85.86 | 67.47 | 39.75 | 64.36 |
| MKD [33] | 76.47 | 63.12 | 43.15 | 60.91 | 83.43 | 69.43 | 45.9 | 66.25 | 74.62 | 80.12 | 71.9 | 75.55 | 86.1 | 67.1 | 32.78 | 61.99 |
| Our | 78.83 | 65.11 | 44.31 | 62.75 | 86.12 | 69.34 | 49.42 | 68.29 | 81.02 | 81.14 | 73.3 | 78.49 | 89.64 | 69.31 | 41.9 | 66.95 |
| MHMoE | Assistant | Compete | BraTS2018 | BraTS2021 | ||||||
|---|---|---|---|---|---|---|---|---|---|---|
| T1 Avg | T2 Avg | T1ce Avg | Flair Avg | T1 Avg | T2 Avg | T1ce Avg | Flair Avg | |||
| 🗸 | × | × | 1.24 | 1.10 | 1.20 | 0.98 | 2.41 | 1.07 | 0.54 | 1.23 |
| × | 🗸 | × | 2.12 | 1.98 | 1.43 | 1.74 | 2.62 | 1.18 | 0.42 | 2.82 |
| × | × | 🗸 | 0.30 | 0.96 | 0.26 | 0.75 | 1.12 | −0.45 | 0.26 | 0.75 |
| 🗸 | 🗸 | × | 2.76 | 2.34 | 1.78 | 1.92 | 2.74 | 1.98 | 1.66 | 3.14 |
| 🗸 | × | 🗸 | 2.35 | 2.17 | 1.33 | 1.20 | 2.58 | 1.55 | 1.33 | 1.98 |
| × | 🗸 | 🗸 | 2.11 | 1.97 | 1.20 | 1.57 | 2.67 | 1.61 | 0.75 | 1.79 |
| 🗸 | 🗸 | 🗸 | 2.81 | 3.01 | 1.92 | 1.89 | 3.13 | 2.05 | 1.74 | 3.61 |
Disclaimer/Publisher’s Note: The statements, opinions and data contained in all publications are solely those of the individual author(s) and contributor(s) and not of MDPI and/or the editor(s). MDPI and/or the editor(s) disclaim responsibility for any injury to people or property resulting from any ideas, methods, instructions or products referred to in the content. |
© 2025 by the authors. Licensee MDPI, Basel, Switzerland. This article is an open access article distributed under the terms and conditions of the Creative Commons Attribution (CC BY) license (https://creativecommons.org/licenses/by/4.0/).
Share and Cite
Wang, J.; Kang, H.; Liu, T. The Teacher–Assistant–Student Collaborative and Competitive Network for Brain Tumor Segmentation with Missing Modalities. Diagnostics 2025, 15, 1552. https://doi.org/10.3390/diagnostics15121552
Wang J, Kang H, Liu T. The Teacher–Assistant–Student Collaborative and Competitive Network for Brain Tumor Segmentation with Missing Modalities. Diagnostics. 2025; 15(12):1552. https://doi.org/10.3390/diagnostics15121552
Chicago/Turabian StyleWang, Junjie, Huanlan Kang, and Tao Liu. 2025. "The Teacher–Assistant–Student Collaborative and Competitive Network for Brain Tumor Segmentation with Missing Modalities" Diagnostics 15, no. 12: 1552. https://doi.org/10.3390/diagnostics15121552
APA StyleWang, J., Kang, H., & Liu, T. (2025). The Teacher–Assistant–Student Collaborative and Competitive Network for Brain Tumor Segmentation with Missing Modalities. Diagnostics, 15(12), 1552. https://doi.org/10.3390/diagnostics15121552