
The Role of Muscle Density in Predicting the Amputation Risk in Peripheral Arterial Disease: A Tissue Composition Study Using Lower Extremity CT Angiography

 ,
,  , , and
Abstract
1. Introduction
2. Methods
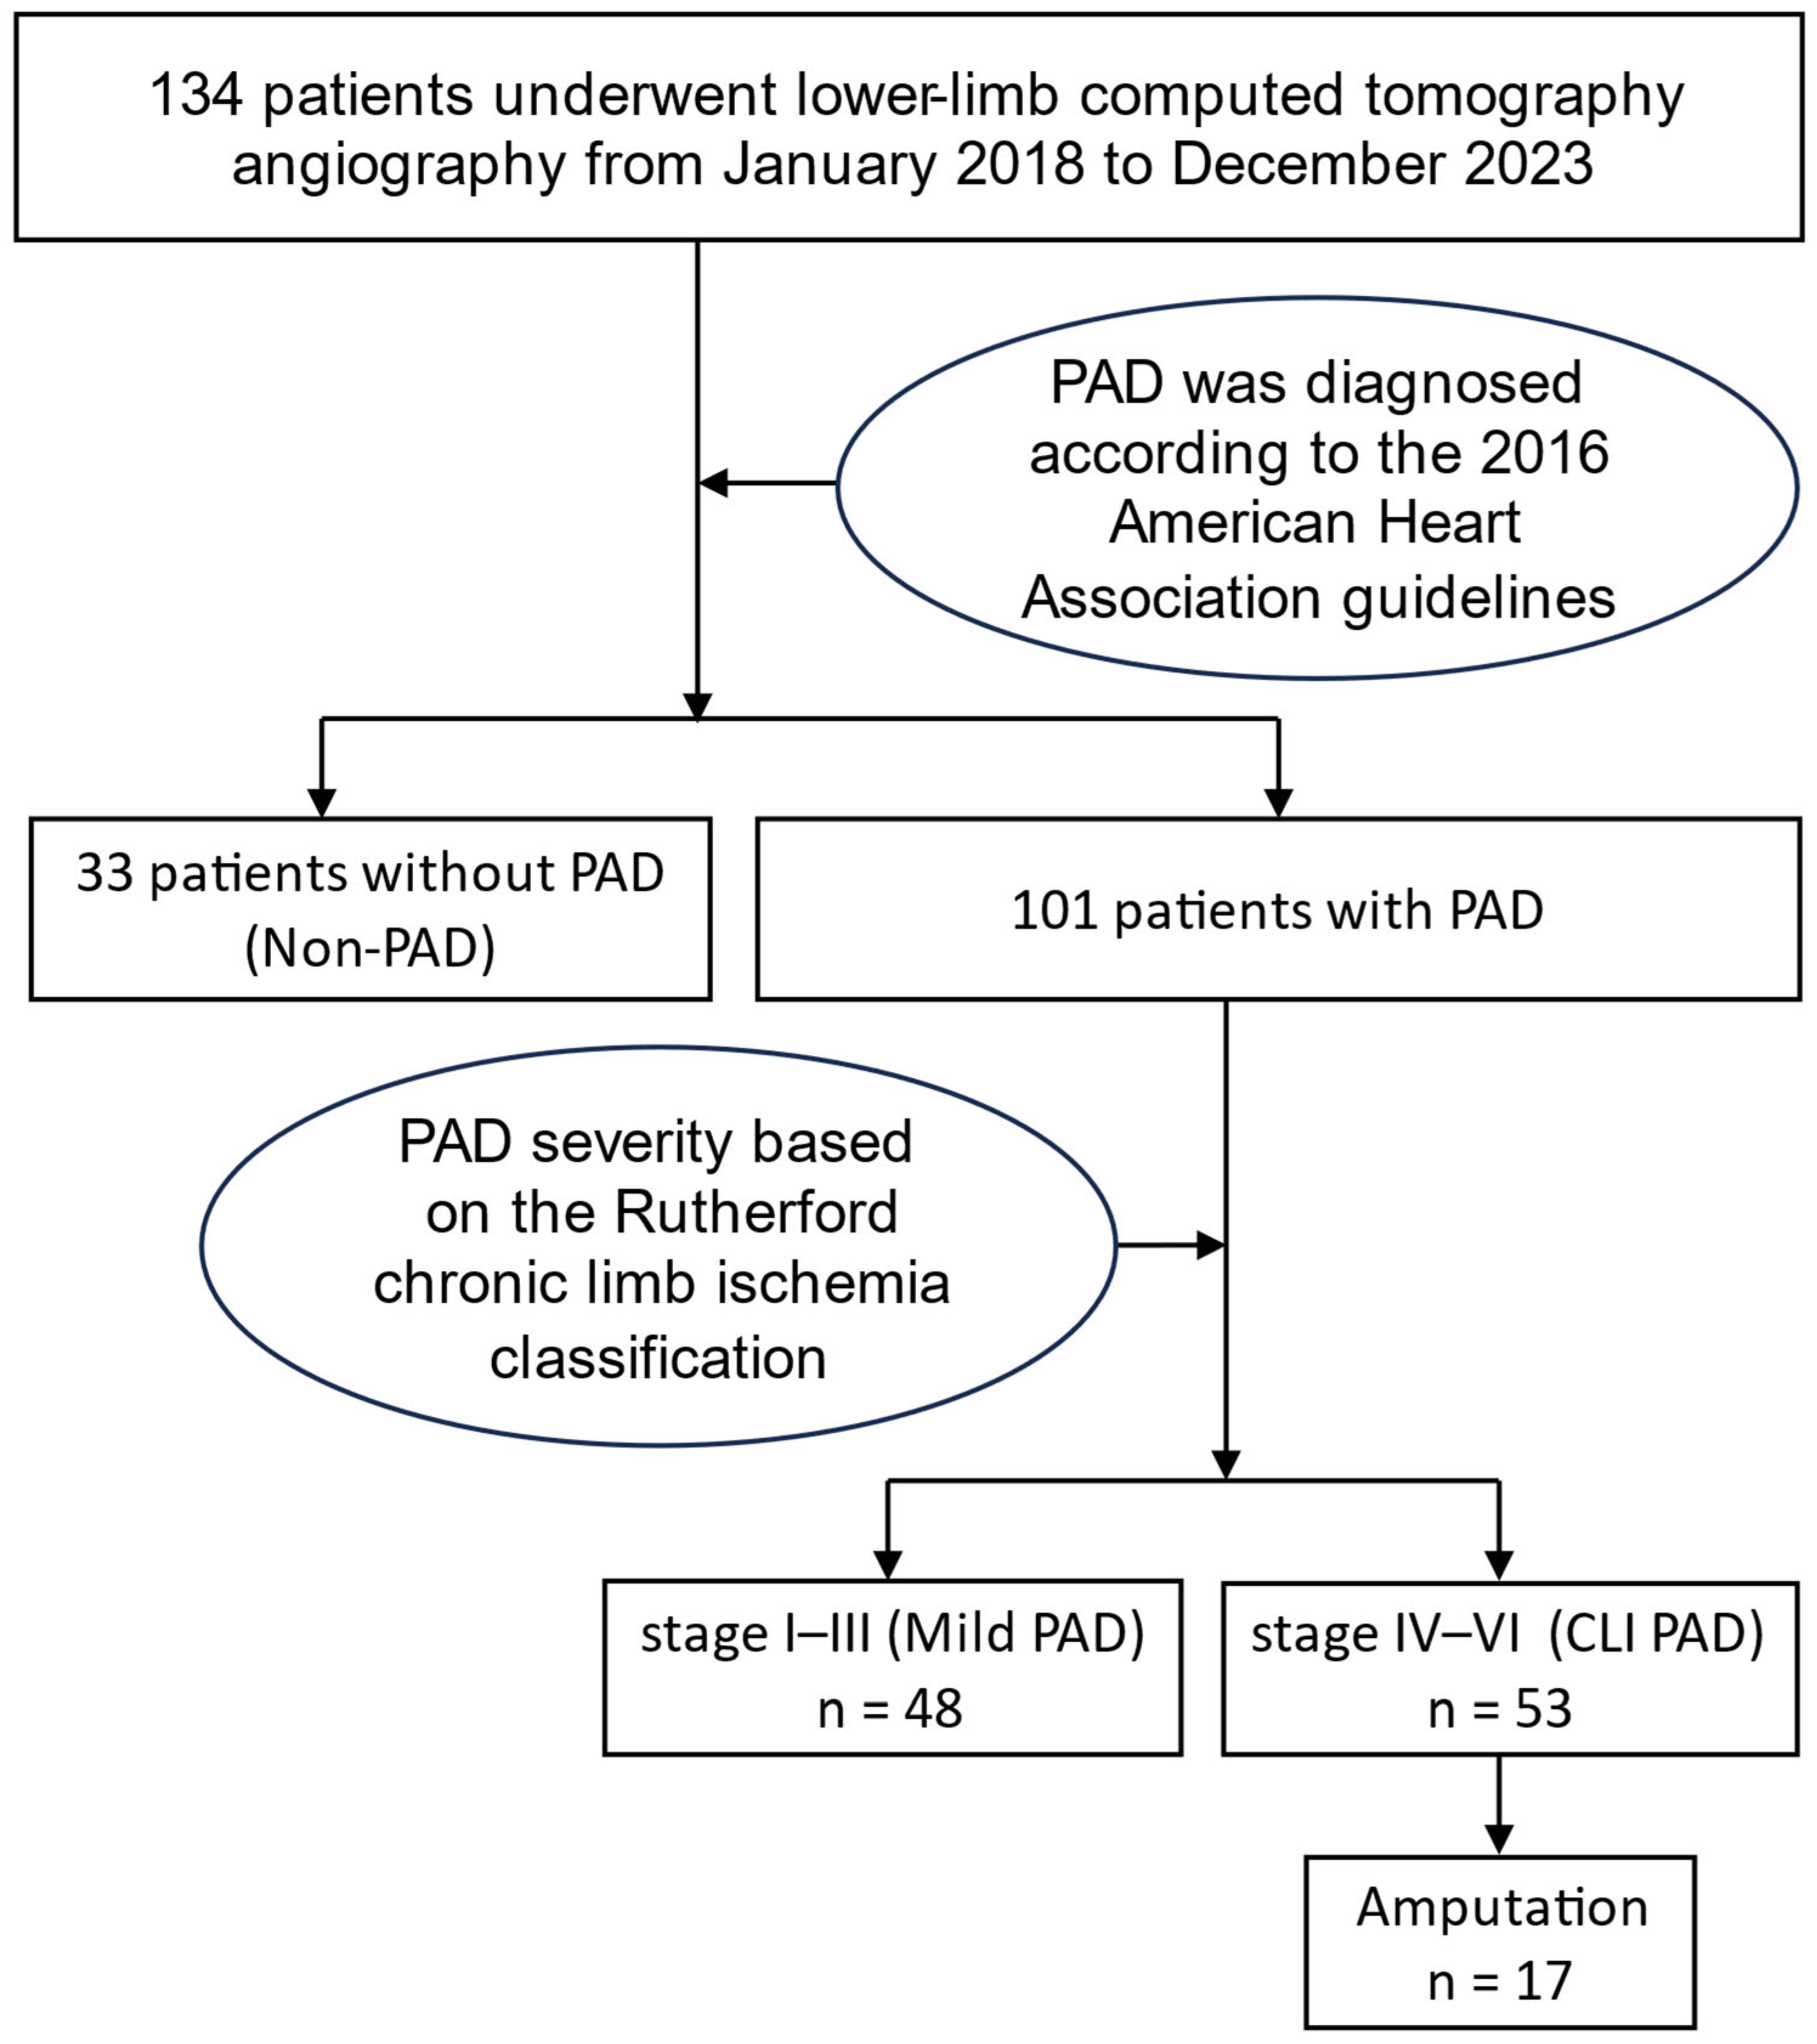
2.1. Study Subjects and Design
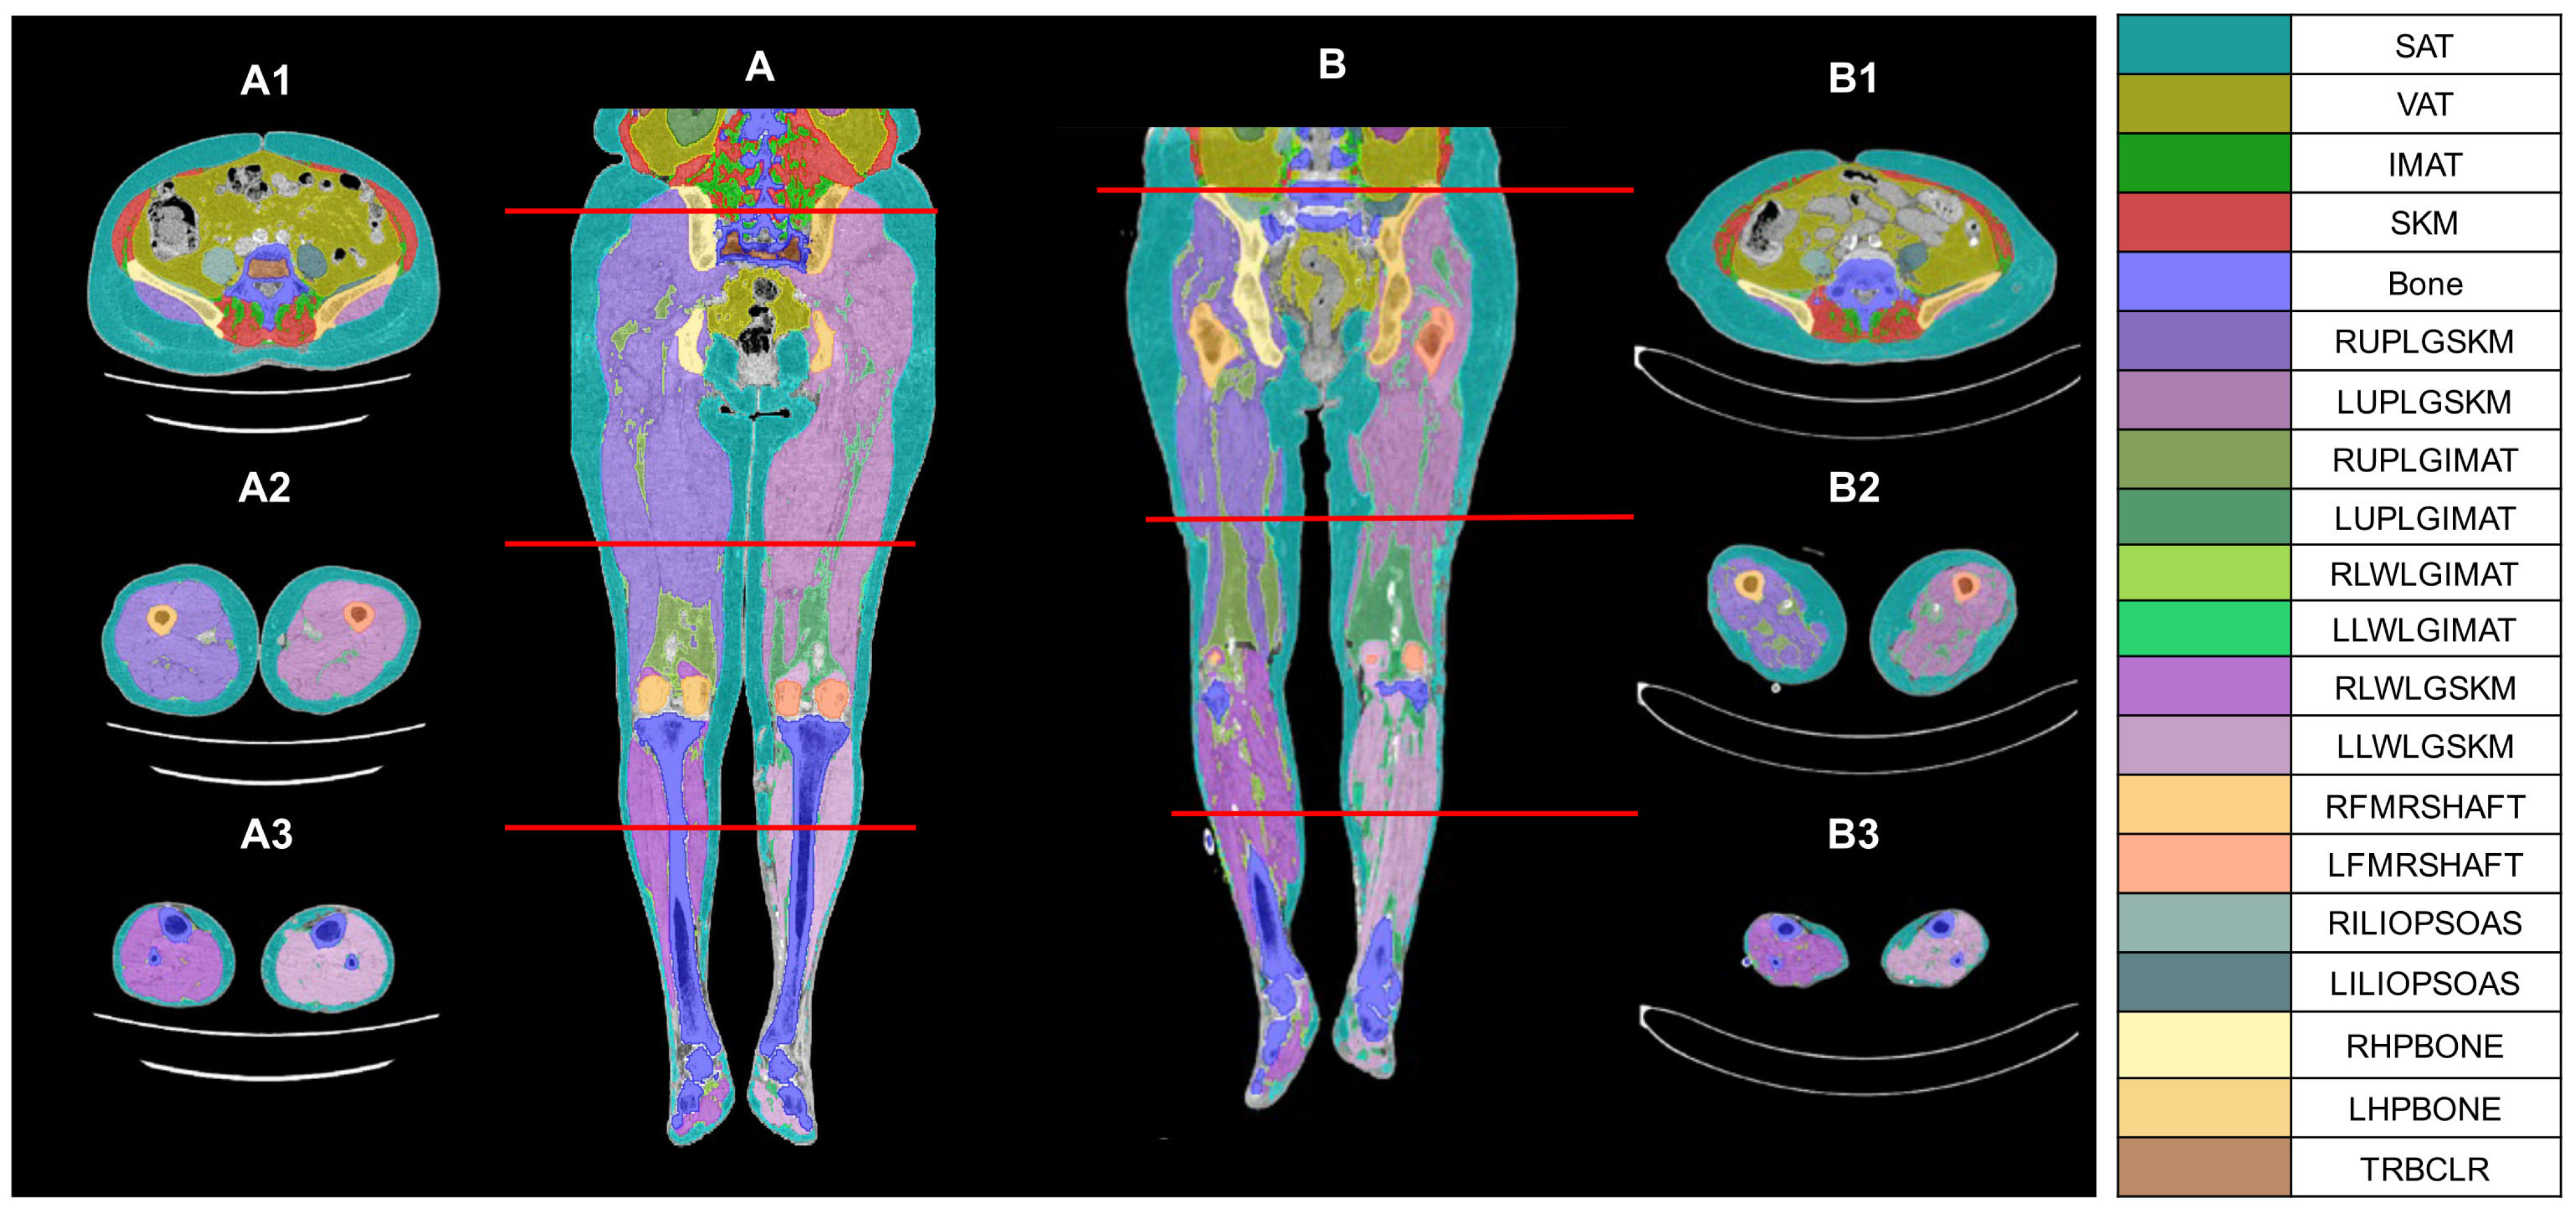
2.2. CT Image Analysis, Processing, and Parameter Measurement
2.3. Laboratory Measurements
2.4. Outcome Measure
2.5. Statistical Analysis
3. Results
3.1. Baseline Characteristics
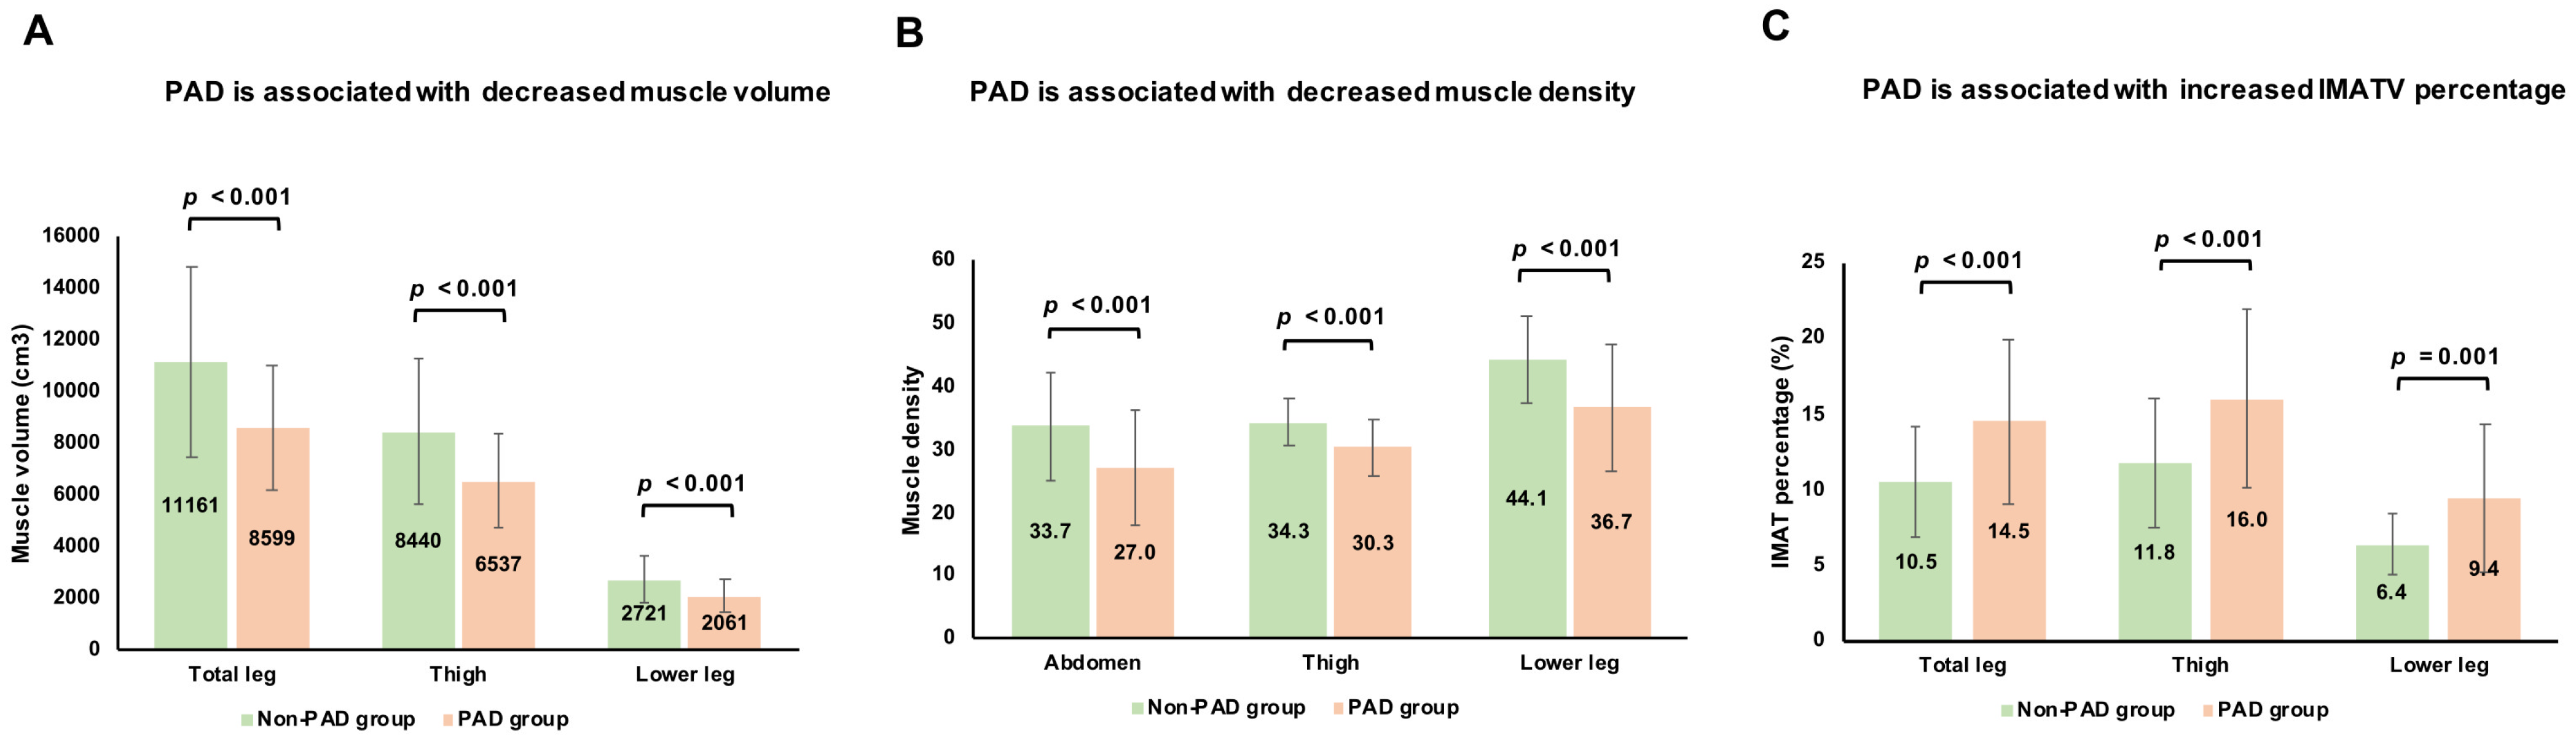
3.2. Associations Between Muscle Volume, Muscle Density, and PAD
3.3. Associations Between IMATV, IMATV Percentage, and PAD
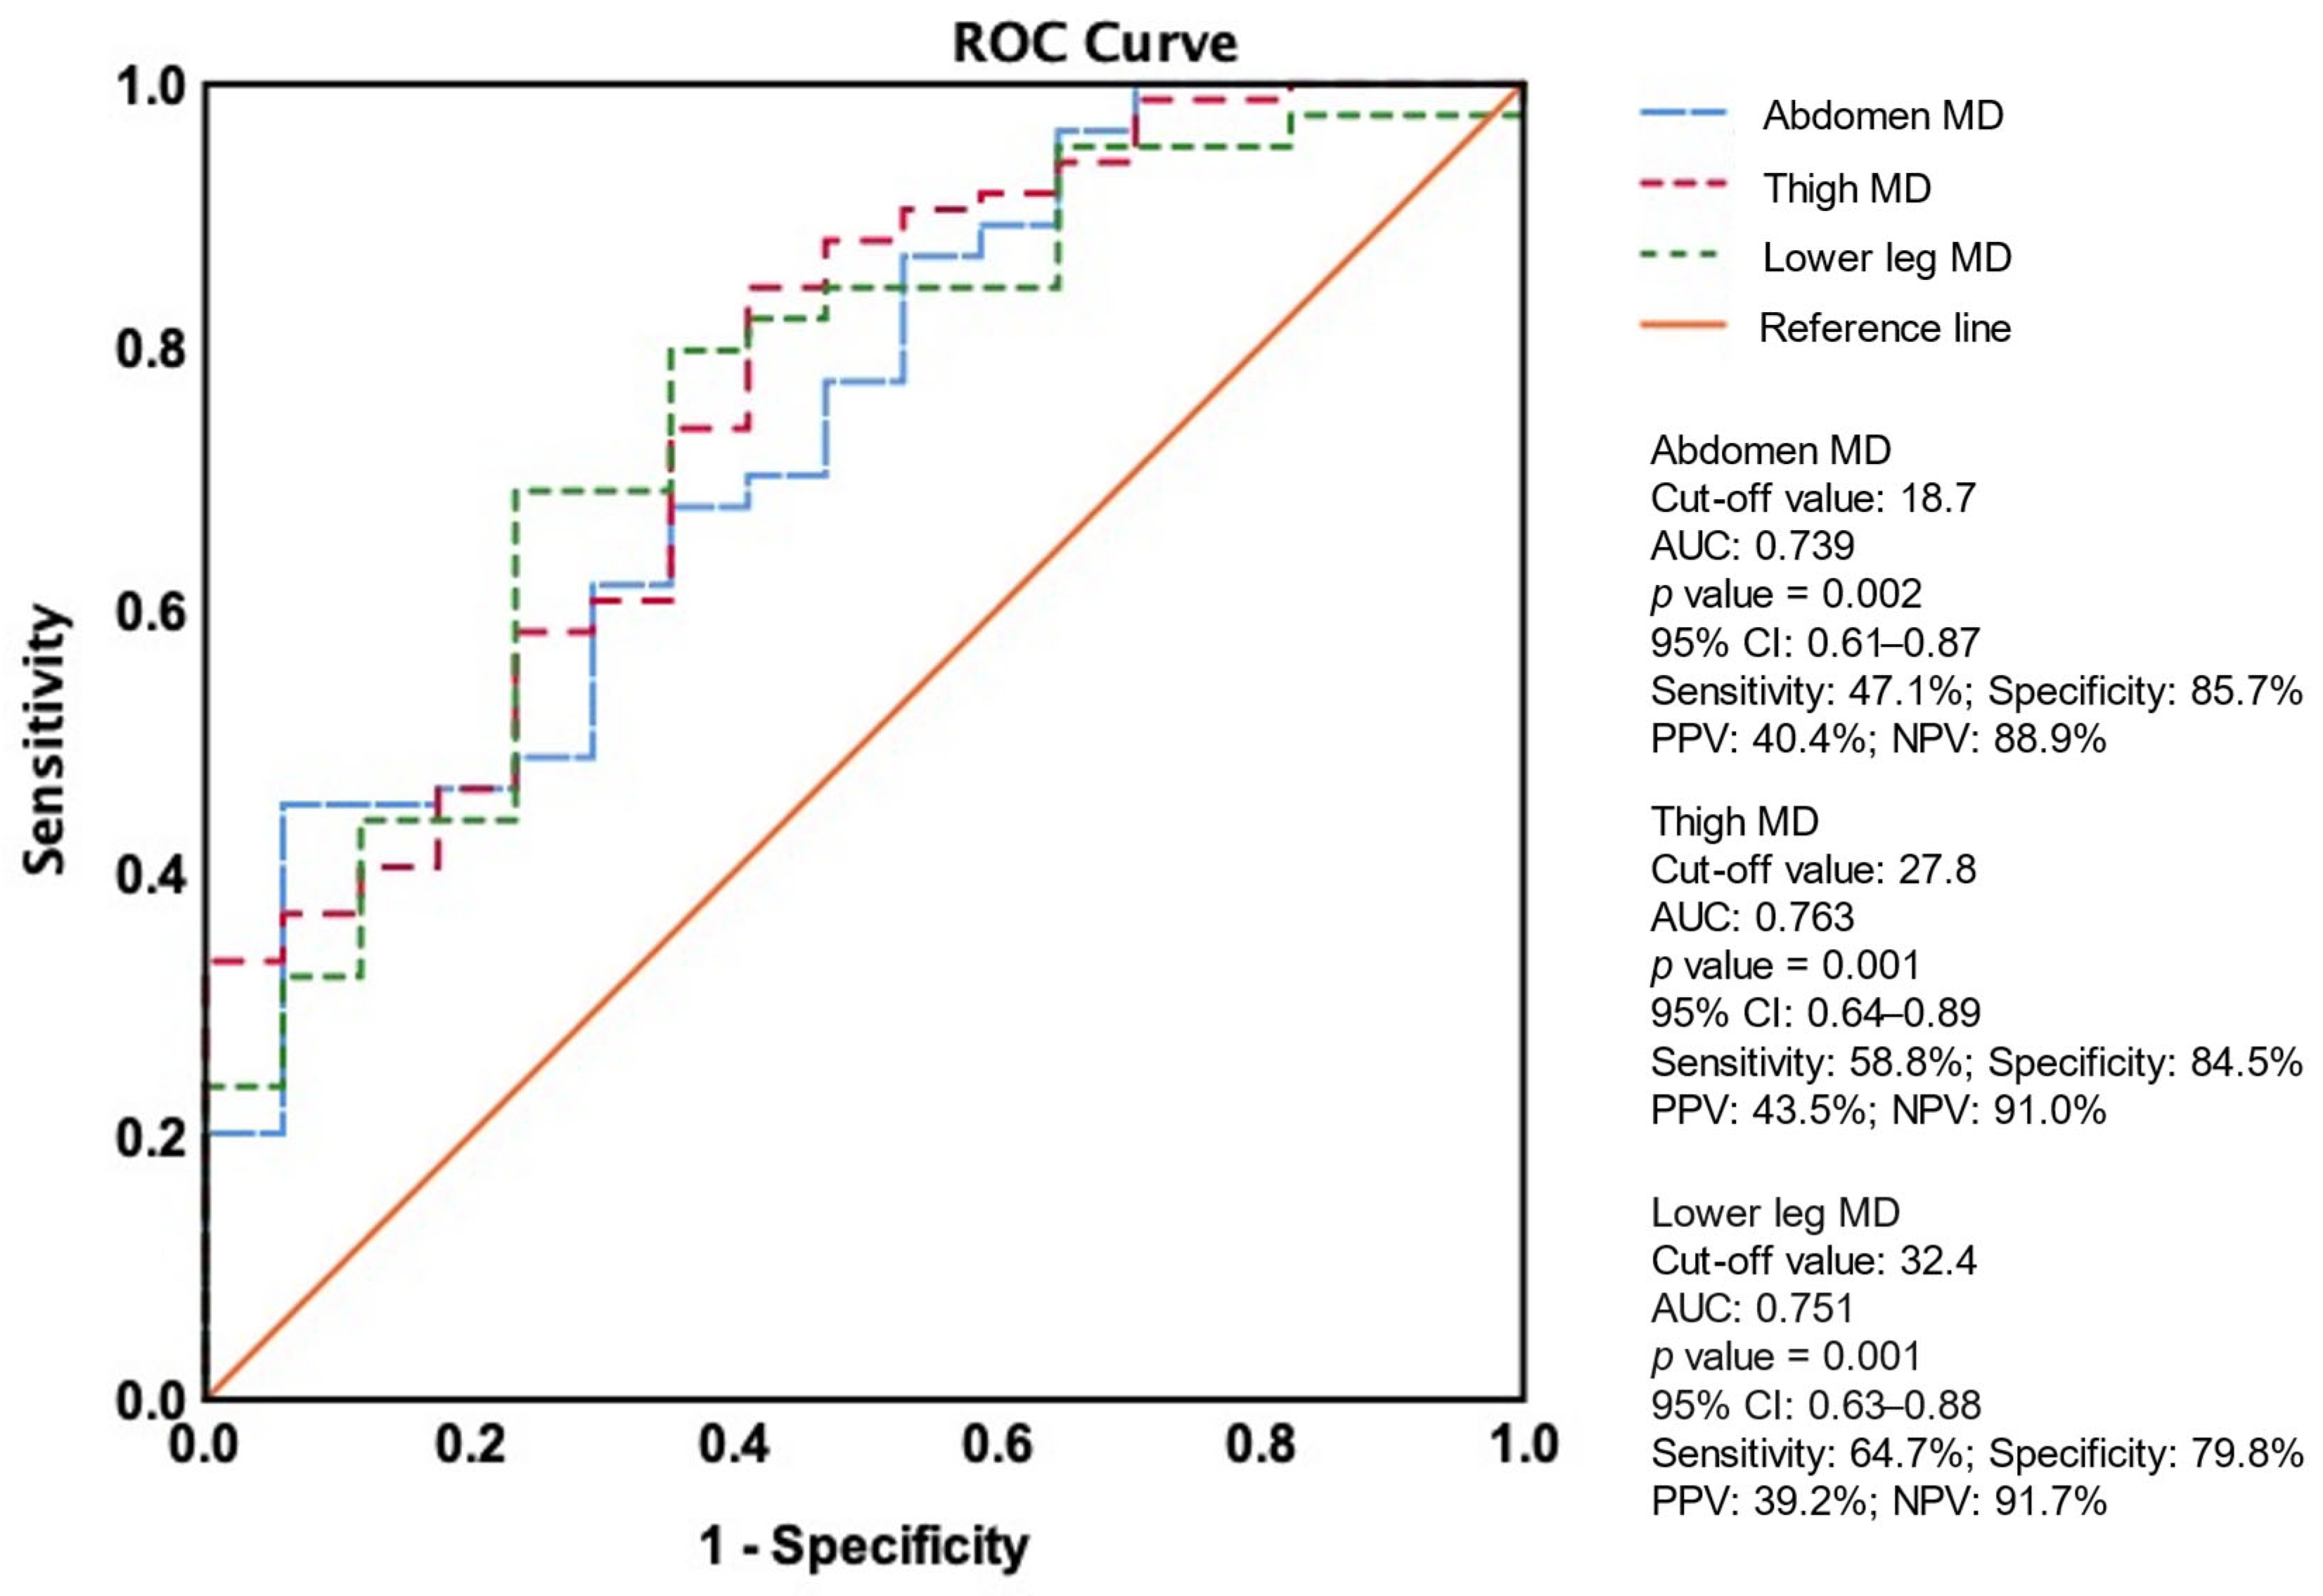
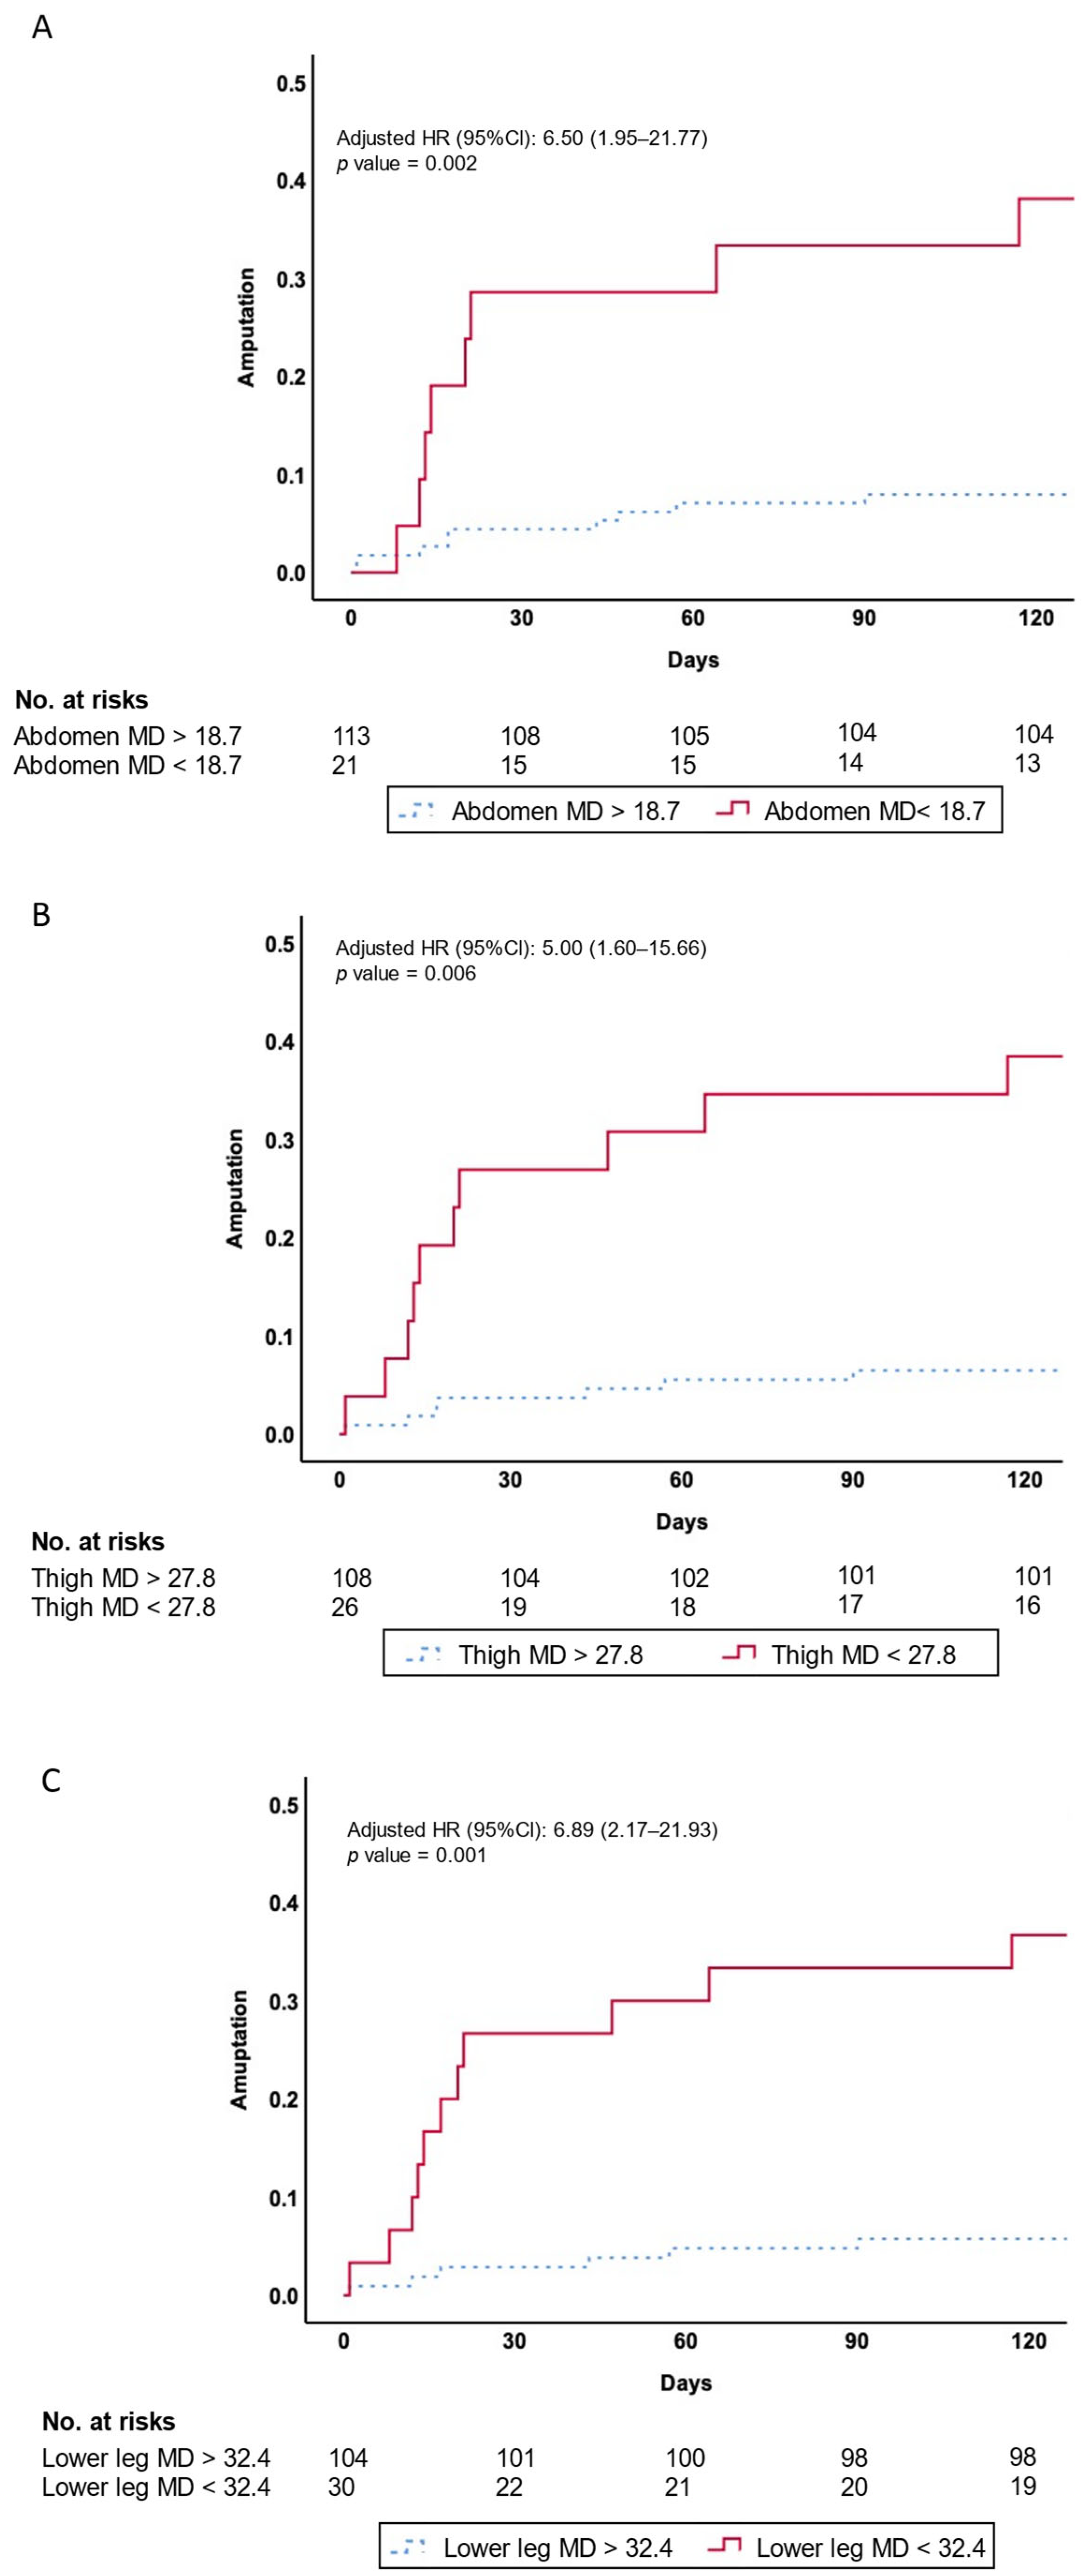
3.4. Association Between PAD and Amputation Events
4. Discussion
Limitations
5. Conclusions
Author Contributions
Funding
Institutional Review Board Statement
Informed Consent Statement
Data Availability Statement
Acknowledgments
Conflicts of Interest
Abbreviations
References
- Jones, W.S.; Patel, M.R.; Dai, D.; Vemulapalli, S.; Subherwal, S.; Stafford, J.; Peterson, E.D. High mortality risks after major lower extremity amputation in Medicare patients with peripheral artery disease. Am. Heart J. 2013, 165, 809–815.e1. [Google Scholar] [CrossRef] [PubMed]
- Hardman, R.L.; Jazaeri, O.; Yi, J.; Smith, M.; Gupta, R. Overview of classification systems in peripheral artery disease. Semin. Interv. Radiol. 2014, 31, 378–388. [Google Scholar] [CrossRef] [PubMed]
- Bevan, G.H.; White Solaru, K.T. Evidence-Based Medical Management of Peripheral Artery Disease. Arterioscler. Thromb. Vasc. Biol. 2020, 40, 541–553. [Google Scholar] [CrossRef] [PubMed]
- Cruz-Jentoft, A.J.; Sayer, A.A. Sarcopenia. Lancet 2019, 393, 2636–2646. [Google Scholar] [CrossRef]
- Santilli, V.; Bernetti, A.; Mangone, M.; Paoloni, M. Clinical definition of sarcopenia. Clin. Cases Miner. Bone Metab. 2014, 11, 177–180. [Google Scholar] [CrossRef]
- Gerhard-Herman, M.D.; Gornik, H.L.; Barrett, C.; Barshes, N.R.; Corriere, M.A.; Drachman, D.E.; Fleisher, L.A.; Fowkes, F.G.R.; Hamburg, N.M.; Kinlay, S.; et al. 2016 AHA/ACC Guideline on the Management of Patients With Lower Extremity Peripheral Artery Disease: Executive Summary: A Report of the American College of Cardiology/American Heart Association Task Force on Clinical Practice Guidelines. Am. Coll. Cardiol. 2017, 69, 1465–1508. [Google Scholar] [CrossRef]
- Soulez, G.; Therasse, E.; Giroux, M.F.; Bouchard, L.; Gilbert, P.; Perreault, P.; Cloutier, G.; Oliva, V.L. Management of peripheral arterial disease: Role of computed tomography angiography and magnetic resonance angiography. Presse Med. 2011, 40, e437–e452. [Google Scholar] [CrossRef]
- Morris, D.R.; Skalina, T.A.; Singh, T.P.; Moxon, J.V.; Golledge, J. Association of Computed Tomographic Leg Muscle Characteristics With Lower Limb and Cardiovascular Events in Patients With Peripheral Artery Disease. J. Am. Heart Assoc. 2018, 7, e009943. [Google Scholar] [CrossRef]
- Ma, K.F.; Levolger, S.; Vedder, I.R.; El Moumni, M.; de Vries, J.P.M.; Bokkers, R.P.H.; Viddeleer, A.R. The Impact of Lower Extremity Skeletal Muscle Atrophy and Myosteatosis on Revascularization Outcomes in Patients with Peripheral Arterial Disease. J. Clin. Med. 2021, 10, 3963. [Google Scholar] [CrossRef]
- Csore, J.; Drake, M.; Roy, T.L. Peripheral arterial disease treatment planning using noninvasive and invasive imaging methods. J. Vasc. Surg. Cases Innov. Techol. 2023, 9, 101263. [Google Scholar] [CrossRef]
- Tsai, P.S.; Lin, D.C.; Jan, Y.T.; Liu, Y.P.; Wu, T.H.; Huang, S.C. Lower-extremity muscle wasting in patients with peripheral arterial disease: Quantitative measurement and evaluation with CT. Eur. Radiol. 2023, 33, 4063–4072. [Google Scholar] [CrossRef]
- Lee, Y.S.; Hong, N.; Witanto, J.N.; Choi, Y.R.; Park, J.; Decazes, P.; Eude, F.; Kim, C.O.; Chang Kim, H.; Goo, J.M.; et al. Deep neural network for automatic volumetric segmentation of whole-body CT images for body composition assessment. Clin. Nutr. 2021, 40, 5038–5046. [Google Scholar] [CrossRef]
- Da, M.; Chow, V.; Popuri, K.; Beg, M.F. Comprehensive Validation of Automated Whole Body Skeletal Muscle, Adipose Tissue, and Bone Segmentation from 3D CT images for Body Composition Analysis: Towards Extended Body Composition. arXiv 2021, arXiv:2106.00652. [Google Scholar]
- Amini, B.; Boyle, S.P.; Boutin, R.D.; Lenchik, L. Approaches to Assessment of Muscle Mass and Myosteatosis on Computed Tomography: A Systematic Review. J. Gerontol. A Biol. Sci. Med. Sci. 2019, 74, 1671–1678. [Google Scholar] [CrossRef]
- Chen, L.K.; Liu, L.K.; Woo, J.; Assantachai, P.; Auyeung, T.W.; Bahyah, K.S.; Chou, M.Y.; Chen, L.Y.; Hsu, P.S.; Krairit, O.; et al. Sarcopenia in Asia: Consensus report of the Asian Working Group for Sarcopenia. J. Am. Med. Dir. Assoc. 2014, 15, 95–101. [Google Scholar] [CrossRef]
- McDermott, M.M.; Ferrucci, L.; Gonzalez-Freire, M.; Kosmac, K.; Leeuwenburgh, C.; Peterson, C.A.; Saini, S.; Sufit, R. Skeletal Muscle Pathology in Peripheral Artery Disease: A Brief Review. Arterioscler. Thromb. Vasc. Biol. 2020, 40, 2577–2585. [Google Scholar] [CrossRef]
- Taniguchi, R.; Deguchi, J.; Hashimoto, T.; Sato, O. Sarcopenia as a Possible Negative Predictor of Limb Salvage in Patients with Chronic Limb-Threatening Ischemia. Ann. Vasc. Dis. 2019, 12, 194–199. [Google Scholar] [CrossRef]
- Pizzimenti, M.; Meyer, A.; Charles, A.L.; Giannini, M.; Chakfe, N.; Lejay, A.; Geny, B. Sarcopenia and peripheral arterial disease: A systematic review. J. Cachexia Sarcopenia Muscle 2020, 11, 866–886. [Google Scholar] [CrossRef]
- Ferreira, J.M.M.; Cunha, P.; Carneiro, A.; Vila, I.; Cunha, C.; Silva, C.; Longatto-Filho, A.; Mesquita, A.; Cotter, J.; Mansilha, A.; et al. Sarcopenia as a Prognostic Factor in Peripheral Arterial Disease: Descriptive Review. Ann. Vasc. Surg. 2021, 74, 460–474. [Google Scholar] [CrossRef]
- Matsubara, Y.; Matsumoto, T.; Aoyagi, Y.; Tanaka, S.; Okadome, J.; Morisaki, K.; Shirabe, K.; Maehara, Y. Sarcopenia is a prognostic factor for overall survival in patients with critical limb ischemia. J. Vasc. Surg. 2015, 61, 945–950. [Google Scholar] [CrossRef]
- Kim, D.W.; Kim, K.W.; Ko, Y.; Park, T.; Khang, S.; Jeong, H.; Koo, K.; Lee, J.; Kim, H.K.; Ha, J.; et al. Assessment of Myosteatosis on Computed Tomography by Automatic Generation of a Muscle Quality Map Using a Web-Based Toolkit: Feasibility Study. JMIR Med. Inform. 2020, 8, e23049. [Google Scholar] [CrossRef] [PubMed]
- Lortie, J.; Gage, G.; Rush, B.; Heymsfield, S.B.; Szczykutowicz, T.P.; Kuchnia, A.J. The effect of computed tomography parameters on sarcopenia and myosteatosis assessment: A scoping review. J. Cachexia Sarcopenia Muscle 2022, 13, 2807–2819. [Google Scholar] [CrossRef] [PubMed]
- Ahn, H.; Kim, D.W.; Ko, Y.; Ha, J.; Shin, Y.B.; Lee, J.; Sung, Y.S.; Kim, K.W. Updated systematic review and meta-analysis on diagnostic issues and the prognostic impact of myosteatosis: A new paradigm beyond sarcopenia. Ageing Res. Rev. 2021, 70, 101398. [Google Scholar] [CrossRef]
- Reinders, I.; Murphy, R.A.; Brouwer, I.A.; Visser, M.; Launer, L.; Siggeirsdottir, K.; Eiriksdottir, G.; Gudnason, V.; Jonsson, P.V.; Lang, T.F.; et al. Muscle Quality and Myosteatosis: Novel Associations With Mortality Risk: The Age, Gene/Environment Susceptibility (AGES)-Reykjavik Study. Am. J. Epidemiol. 2016, 183, 53–60. [Google Scholar] [CrossRef] [PubMed]
- Kim, H.K.; Kim, C.H. Quality Matters as Much as Quantity of Skeletal Muscle: Clinical Implications of Myosteatosis in Cardiometabolic Health. Endocrinol. Metab. 2021, 36, 1161–1174. [Google Scholar] [CrossRef]
- Vedder, I.R.; Levolger, S.; Dierckx, R.; Zeebregts, C.J.; de Vries, J.P.M.; Viddeleer, A.R.; Bokkers, R.P.H. Effect of muscle depletion on survival in peripheral arterial occlusive disease: Quality over quantity. J. Vasc. Surg. 2020, 72, 2006–2016.e1. [Google Scholar] [CrossRef]
- Ebadi, M.; Tsien, C.; Bhanji, R.A.; Dunichand-Hoedl, A.R.; Rider, E.; Motamedrad, M.; Mazurak, V.C.; Baracos, V.; Montano-Loza, A.J. Skeletal Muscle Pathological Fat Infiltration (Myosteatosis) Is Associated with Higher Mortality in Patients with Cirrhosis. Cells 2022, 11, 1345. [Google Scholar] [CrossRef]
- Collino, M.; Mastrocola, R.; Nigro, D.; Chiazza, F.; Aragno, M.; D’Antona, G.; Minetto, M.A. Variability in myosteatosis and insulin resistance induced by high-fat diet in mouse skeletal muscles. Biomed. Res. Int. 2014, 2014, 569623. [Google Scholar] [CrossRef]
- Bradley, C.E.; Fletcher, E.; Wilkinson, T.; Ring, A.; Ferrer, L.; Miserlis, D.; Pacher, P.; Koutakis, P. Mitochondrial fatty acid beta-oxidation: A possible therapeutic target for skeletal muscle lipotoxicity in peripheral artery disease myopathy. EXCLI J. 2024, 23, 523–533. [Google Scholar] [CrossRef]
- Coll, T.; Eyre, E.; Rodriguez-Calvo, R.; Palomer, X.; Sanchez, R.M.; Merlos, M.; Laguna, J.C.; Vazquez-Carrera, M. Oleate reverses palmitate-induced insulin resistance and inflammation in skeletal muscle cells. J. Biol. Chem. 2008, 283, 11107–11116. [Google Scholar] [CrossRef]
- Hirabara, S.M.; Curi, R.; Maechler, P. Saturated fatty acid-induced insulin resistance is associated with mitochondrial dysfunction in skeletal muscle cells. J. Cell. Physiol. 2010, 222, 187–194. [Google Scholar] [CrossRef] [PubMed]
- Park, S.S.; Seo, Y.K. Excess Accumulation of Lipid Impairs Insulin Sensitivity in Skeletal Muscle. Int. J. Mol. Sci. 2020, 21, 1949. [Google Scholar] [CrossRef] [PubMed]

| Non-PAD | Mild PAD | CLI PAD | p Value | |
|---|---|---|---|---|
| Number of patients (n) | 33 | 48 | 53 | |
| Age (years) | 66.4 ± 12.8 | 69.8 ± 10.3 | 73.1 ± 10.71 | 0.026 |
| Sex (male, %) | 19 (57.6%) | 34 (70.8%) | 31 (58.5%) | 0.345 |
| Height (cm) | 159.8 ± 9.0 | 162.6 ± 8.4 | 159.1 ± 9.2 | 0.121 |
| Weight (kg) | 70.2 ± 14.7 | 64.2 ± 11.1 | 61.7 ± 12.3 | 0.010 |
| BMI | 27.5 ± 5.2 | 24.3 ± 3.7 | 24.3 ± 4.0 | 0.001 |
| Medical history | ||||
| CVD (%) | 5 (15.2%) | 22 (45.8%) | 12 (22.6%) | 0.005 |
| Hypertension (%) | 25 (75.8%) | 43 (89.6%) | 46 (86.8%) | 0.207 |
| DM (%) | 14 (42.4%) | 25 (52.1%) | 43 (81.8%) | <0.001 |
| Dyslipidemia (%) | 22 (66.7%) | 28 (58.3%) | 26 (49.1%) | 0.266 |
| Atrial fibrillation (%) | 2 (6.3%) | 7 (17.1%) | 16 (33.3%) | 0.011 |
| CKD (%) | 8 (24.2%) | 28(58.3%) | 37(69.8%) | <0.001 |
| ESRD (%) | 3 (10.3%) | 7 (24.1%) | 19 (65.5%) | 0.005 |
| Smoking history (%) | 13 (39.4%) | 22(45.8%) | 21 (39.6%) | 0.893 |
| Laboratory data | ||||
| HbA1C (%) | 6.4 ± 2.0 | 7.2 ± 1.9 | 7.3 ± 1.5 | 0.063 |
| eGFR (MDRD), (mL/min/1.73 m2) | 70.6 ± 29.2 | 58.3 ± 28.4 | 43.1 ± 32.6 | <0.001 |
| Non-PAD Group | Mild PAD | CLI PAD | p Value | |
|---|---|---|---|---|
| Number of patients (n) | 33 | 48 | 53 | |
| Muscle volume | ||||
| AMV (cm3) | 1120.8 ± 408.8 | 943.29 ± 252.7 * | 920.6 ± 261.0 @ | 0.008 |
| AMV/Ht2 (cm3/m2) | 432.6 ± 132.4 | 355.2 ± 84.2 * | 361.0 ± 87.4 @ | 0.001 |
| PMV (cm3) | 620.0 ± 231.4 | 528.3 ± 152.0 * | 502.3 ± 26.5 @ | 0.006 |
| PMV/Ht2 (cm3/m2) | 238.1 ± 72.7 | 197.6 ± 47.1 * | 196.2 ± 36.3 @ | <0.001 |
| TLMV (cm3) | 11,161.6 ± 4670.4 | 9320.9 ± 2601.2 * | 7945.3 ± 2012.5 @# | <0.001 |
| TLMV/Ht2 (cm3/m2) | 4314.9 ± 1164.4 | 3502.5 ± 846.1 * | 3121.3 ± 659.4 @ | <0.001 |
| TMV (cm3) | 8440.4 ± 2833.9 | 7040.6 ± 2037.4 * | 6082.2 ± 1482.4 @ | <0.001 |
| TMV/Ht2 (cm3/m2) | 3259.9 ± 900.2 | 2644.7 ± 664.3 * | 2390.9 ± 491.3 @ | <0.001 |
| LLMV (cm3) | 2721.2 ± 877.4 | 2280.3 ± 626.4 * | 1863.1 ± 581.4 @# | <0.001 |
| LLMV/Ht2 (cm3/m2) | 1055.0 ± 284.2 | 857.7 ± 208.6 @ | 730.4 ± 191.6 @# | <0.001 |
| Muscle density | ||||
| Abdomen MD (HU) | 33.7 ± 8.6 | 29.1 ± 9.4 | 25.1 ± 8.4 @ | <0.001 |
| Thigh MD (HU) | 34.3 ± 3.8 | 31.9 ± 4.3 * | 28.8 ± 4.2 @# | <0.001 |
| Lower leg MD (HU) | 44.1 ± 6.9 | 39.6 ± 8.5 | 34.0 ± 10.5 @# | <0.001 |
| Fat volume | ||||
| SATV (cm3) | 4062.1 ± 1822.9 | 3426.8 ± 1625.4 | 3186.1 ± 1647.1 | 0.064 |
| SATV/Ht2 (cm3/m2) | 1627.5 ± 807.6 | 1311.9 ± 635.0 | 1281.8 ± 674.4 | 0.062 |
| VATV (cm3) | 2075.9 ± 1004.8 | 1886.9 ± 886.0 | 1949.5 ± 1180.9 | 0.722 |
| VATV/Ht2 (cm3/m2) | 827.5 ± 440.2 | 716.4 ± 336.3 | 778.5 ± 494.3 | 0.510 |
| IMATV(ABD) (cm3) | 163.3 ± 45.8 | 159.4 ± 53.3 | 161.8 ± 5.7 | 0.935 |
| IMATV(ABD)/Ht2 (cm3/m2) | 64.8 ± 20.8 | 60.8 ± 20.7 | 64.4 ± 18.9 | 0.571 |
| IMATV(TL) (cm3) | 1232.6 ± 366.4 | 1355.1 ± 480.8 | 1428.6 ± 497.8 | 0.165 |
| IMATV(TL)/Ht2 (cm3/m2) | 486.2 ± 155.6 | 516.5 ± 189.6 | 567.5 ± 197.4 | 0.122 |
| IMATV(TM) (cm3) | 1053.6 ± 316.7 | 1157.1 ± 420.9 | 1228.9 ± 427.5 | 0.147 |
| IMATV(TM)/Ht2 (cm3/m2) | 416.6 ± 138.2 | 441.6 ± 167.8 | 489.1 ± 172.4 | 0.111 |
| IMATV(LL) (cm3) | 179.0 ± 63.5 | 198.0 ± 76.9 | 199.7 ± 100.2 | 0.498 |
| IMATV(LL)/Ht2 (cm3/m2) | 69.6 ± 22.8 | 74.8 ± 28.5 | 78.4 ± 36.4 | 0.437 |
| IMATV percentage | ||||
| IMATV(ABD) (%) | 13.9 ± 5.2 | 15.1 ± 5.7 | 15.5 ± 4.7 | 0.357 |
| IMATV(TL) (%) | 10.5 ± 3.6 | 13.2 ± 5.2 | 15.6 ± 5.4 @ | <0.001 |
| IMATV(TM) (%) | 11.8 ± 4.3 | 14.7 ± 5.9 | 17.1 ± 5.7 @ | <0.001 |
| IMATV(LL) (%) | 6.4 ± 2.0 | 8.5 ± 4.0 | 10.2 ± 5.5 @ | 0.001 |
| Vascular severity score | ||||
| Vascular severity score (iliac) | 0.2 ± 0.5 | 13.5 ± 7.8 * | 18.4 ± 7.0 @ | <0.001 |
| Vascular severity score (TL) | 0.1 ± 0.3 | 8.8 ± 5.8 * | 12.6 ± 5.0 @# | <0.001 |
| Vascular severity score (UL) | 0.1 ± 0.3 | 2.0 ± 1.9 * | 1.5 ± 1.6 @ | <0.001 |
| Vascular severity score (LL) | 0.0 ± 0.2 | 4.7 ± 2.7 * | 5.8 ± 3.2 @# | <0.001 |
| Unadjusted | Model 1 | Model 2 | Model 3 | |||||
|---|---|---|---|---|---|---|---|---|
| OR, 95% CI | p Value | OR, 95% CI | p Value | OR, 95% CI | p Value | OR, 95% CI | p Value | |
| AMA | 1.00 (1.00–1.00) | 0.851 | 1.00 (1.00–1.00) | 0.333 | 1.00 (1.00–1.00) | 0.471 | 1.00 (1.00–1.01) | 0.570 |
| PMV | 1.00 (0.99–1.00) | 0.286 | 1.00 (1.00–1.00) | 0.747 | 1.00 (1.00–1.01) | 0.877 | 1.00 (0.99–1.01) | 0.877 |
| TLMV | 1.00 (1.00–1.00) | 0.189 | 1.00 (1.00–1.00) | 0.526 | 1.00 (1.00–1.00) | 0.298 | 1.00 (1.00–1.00) | 0.540 |
| TMV | 1.00 (1.00–1.00) | 0.263 | 1.00 (1.00–1.00) | 0.737 | 1.00 (1.00–1.00) | 0.497 | 1.00 (1.00–1.00) | 0.828 |
| LMV | 1.00 (1.00–1.00) | 0.080 | 1.00 (1.00–1.00) | 0.181 | 1.00 (1.00–1.00) | 0.062 | 1.00 (1.00–1.00) | 0.117 |
| Abdomen MD | 0.89 (0.83–0.96) | 0.001 | 0.87 (0.79–0.96) | 0.004 | 0.86 (0.78–0.95) | 0.002 | 0.85 (0.76–0.95) | 0.003 |
| Thigh MD | 0.76 (0.66–0.89) | <0.001 | 0.78 (0.67–0.92) | 0.004 | 0.77 (0.65–0.92) | 0.004 | 0.77 (0.64–0.93) | 0.007 |
| Lower leg MD | 0.93 (0.88–0.98) | 0.005 | 0.92 (0.87–0.98) | 0.005 | 0.92 (0.87–0.98) | 0.006 | 0.92 (0.86–0.98) | 0.007 |
| IMATV(ABD) (%) | 1.07 (0.97–1.17) | 0.189 | 1.07 (0.94–1.21) | 0.339 | 1.07 (0.94–1.21) | 0.324 | 1.10 (0.95–1.27) | 0.198 |
| IMATV(TL) (%) | 1.11 (1.01–1.22) | 0.026 | 1.09 (0.98–1.21) | 0.118 | 1.11 (0.99–1.24) | 0.080 | 1.08 (0.95–1.22) | 0.244 |
| IMATV(TM) (%) | 1.10 (1.01–1.19) | 0.037 | 1.07 (0.97–1.18) | 0.192 | 1.08 (0.98–1.20) | 0.138 | 1.05 (0.94–1.18) | 0.385 |
| IMATV(LL) (%) | 1.09 (0.99–1.20) | 0.077 | 1.10 (1.00–1.21) | 0.061 | 1.10 (1.00–1.22) | 0.053 | 1.11 (0.99–1.24) | 0.080 |
| Vascular severity score (iliac) | 0.95 (0.70–1.29) | 0.747 | 1.06 (0.77–1.45) | 0.927 | 0.99 (0.72–1.38) | 0.971 | 1.07 (0.74–1.55) | 0.732 |
| Vascular severity score (TL) | 1.11 (1.02–1.21) | 0.019 | 1.10 (1.01–1.20) | 0.032 | 1.11 (1.02–1.22) | 0.022 | 1.09 (0.99–1.21) | 0.078 |
| Vascular severity score (UL) | 1.20 (0.99–1.46) | 0.059 | 1.21 (0.99–1.47) | 0.060 | 1.22 (1.99–1.49) | 0.056 | 1.23 (0.97–1.56) | 0.085 |
| Vascular severity score (LL) | 1.14 (1.02–1.28) | 0.027 | 1.13 (1.00–1.28) | 0.051 | 1.15 (1.01–1.31) | 0.030 | 1.11 (0.97–1.28) | 0.131 |
Disclaimer/Publisher’s Note: The statements, opinions and data contained in all publications are solely those of the individual author(s) and contributor(s) and not of MDPI and/or the editor(s). MDPI and/or the editor(s) disclaim responsibility for any injury to people or property resulting from any ideas, methods, instructions or products referred to in the content. |
© 2025 by the authors. Licensee MDPI, Basel, Switzerland. This article is an open access article distributed under the terms and conditions of the Creative Commons Attribution (CC BY) license (https://creativecommons.org/licenses/by/4.0/).
Share and Cite
Lin, Y.-H.; Tsai, P.-S.; Hung, C.-L.; Beg, M.F.; Yeh, H.-I.; Yun, C.-H.; Wu, M.-T. The Role of Muscle Density in Predicting the Amputation Risk in Peripheral Arterial Disease: A Tissue Composition Study Using Lower Extremity CT Angiography. Diagnostics 2025, 15, 1439. https://doi.org/10.3390/diagnostics15111439
Lin Y-H, Tsai P-S, Hung C-L, Beg MF, Yeh H-I, Yun C-H, Wu M-T. The Role of Muscle Density in Predicting the Amputation Risk in Peripheral Arterial Disease: A Tissue Composition Study Using Lower Extremity CT Angiography. Diagnostics. 2025; 15(11):1439. https://doi.org/10.3390/diagnostics15111439
Chicago/Turabian StyleLin, Yueh-Hung, Pei-Shan Tsai, Chung-Lieh Hung, Mirza Faisal Beg, Hung-I Yeh, Chun-Ho Yun, and Ming-Ting Wu. 2025. "The Role of Muscle Density in Predicting the Amputation Risk in Peripheral Arterial Disease: A Tissue Composition Study Using Lower Extremity CT Angiography" Diagnostics 15, no. 11: 1439. https://doi.org/10.3390/diagnostics15111439
APA StyleLin, Y.-H., Tsai, P.-S., Hung, C.-L., Beg, M. F., Yeh, H.-I., Yun, C.-H., & Wu, M.-T. (2025). The Role of Muscle Density in Predicting the Amputation Risk in Peripheral Arterial Disease: A Tissue Composition Study Using Lower Extremity CT Angiography. Diagnostics, 15(11), 1439. https://doi.org/10.3390/diagnostics15111439