
The Relevance of Optical Coherence Tomography Angiography in Screening and Monitoring Hypertensive Patients with Carotid Artery Stenosis


Abstract
1. Introduction
2. Materials and Methods
2.1. Study Population
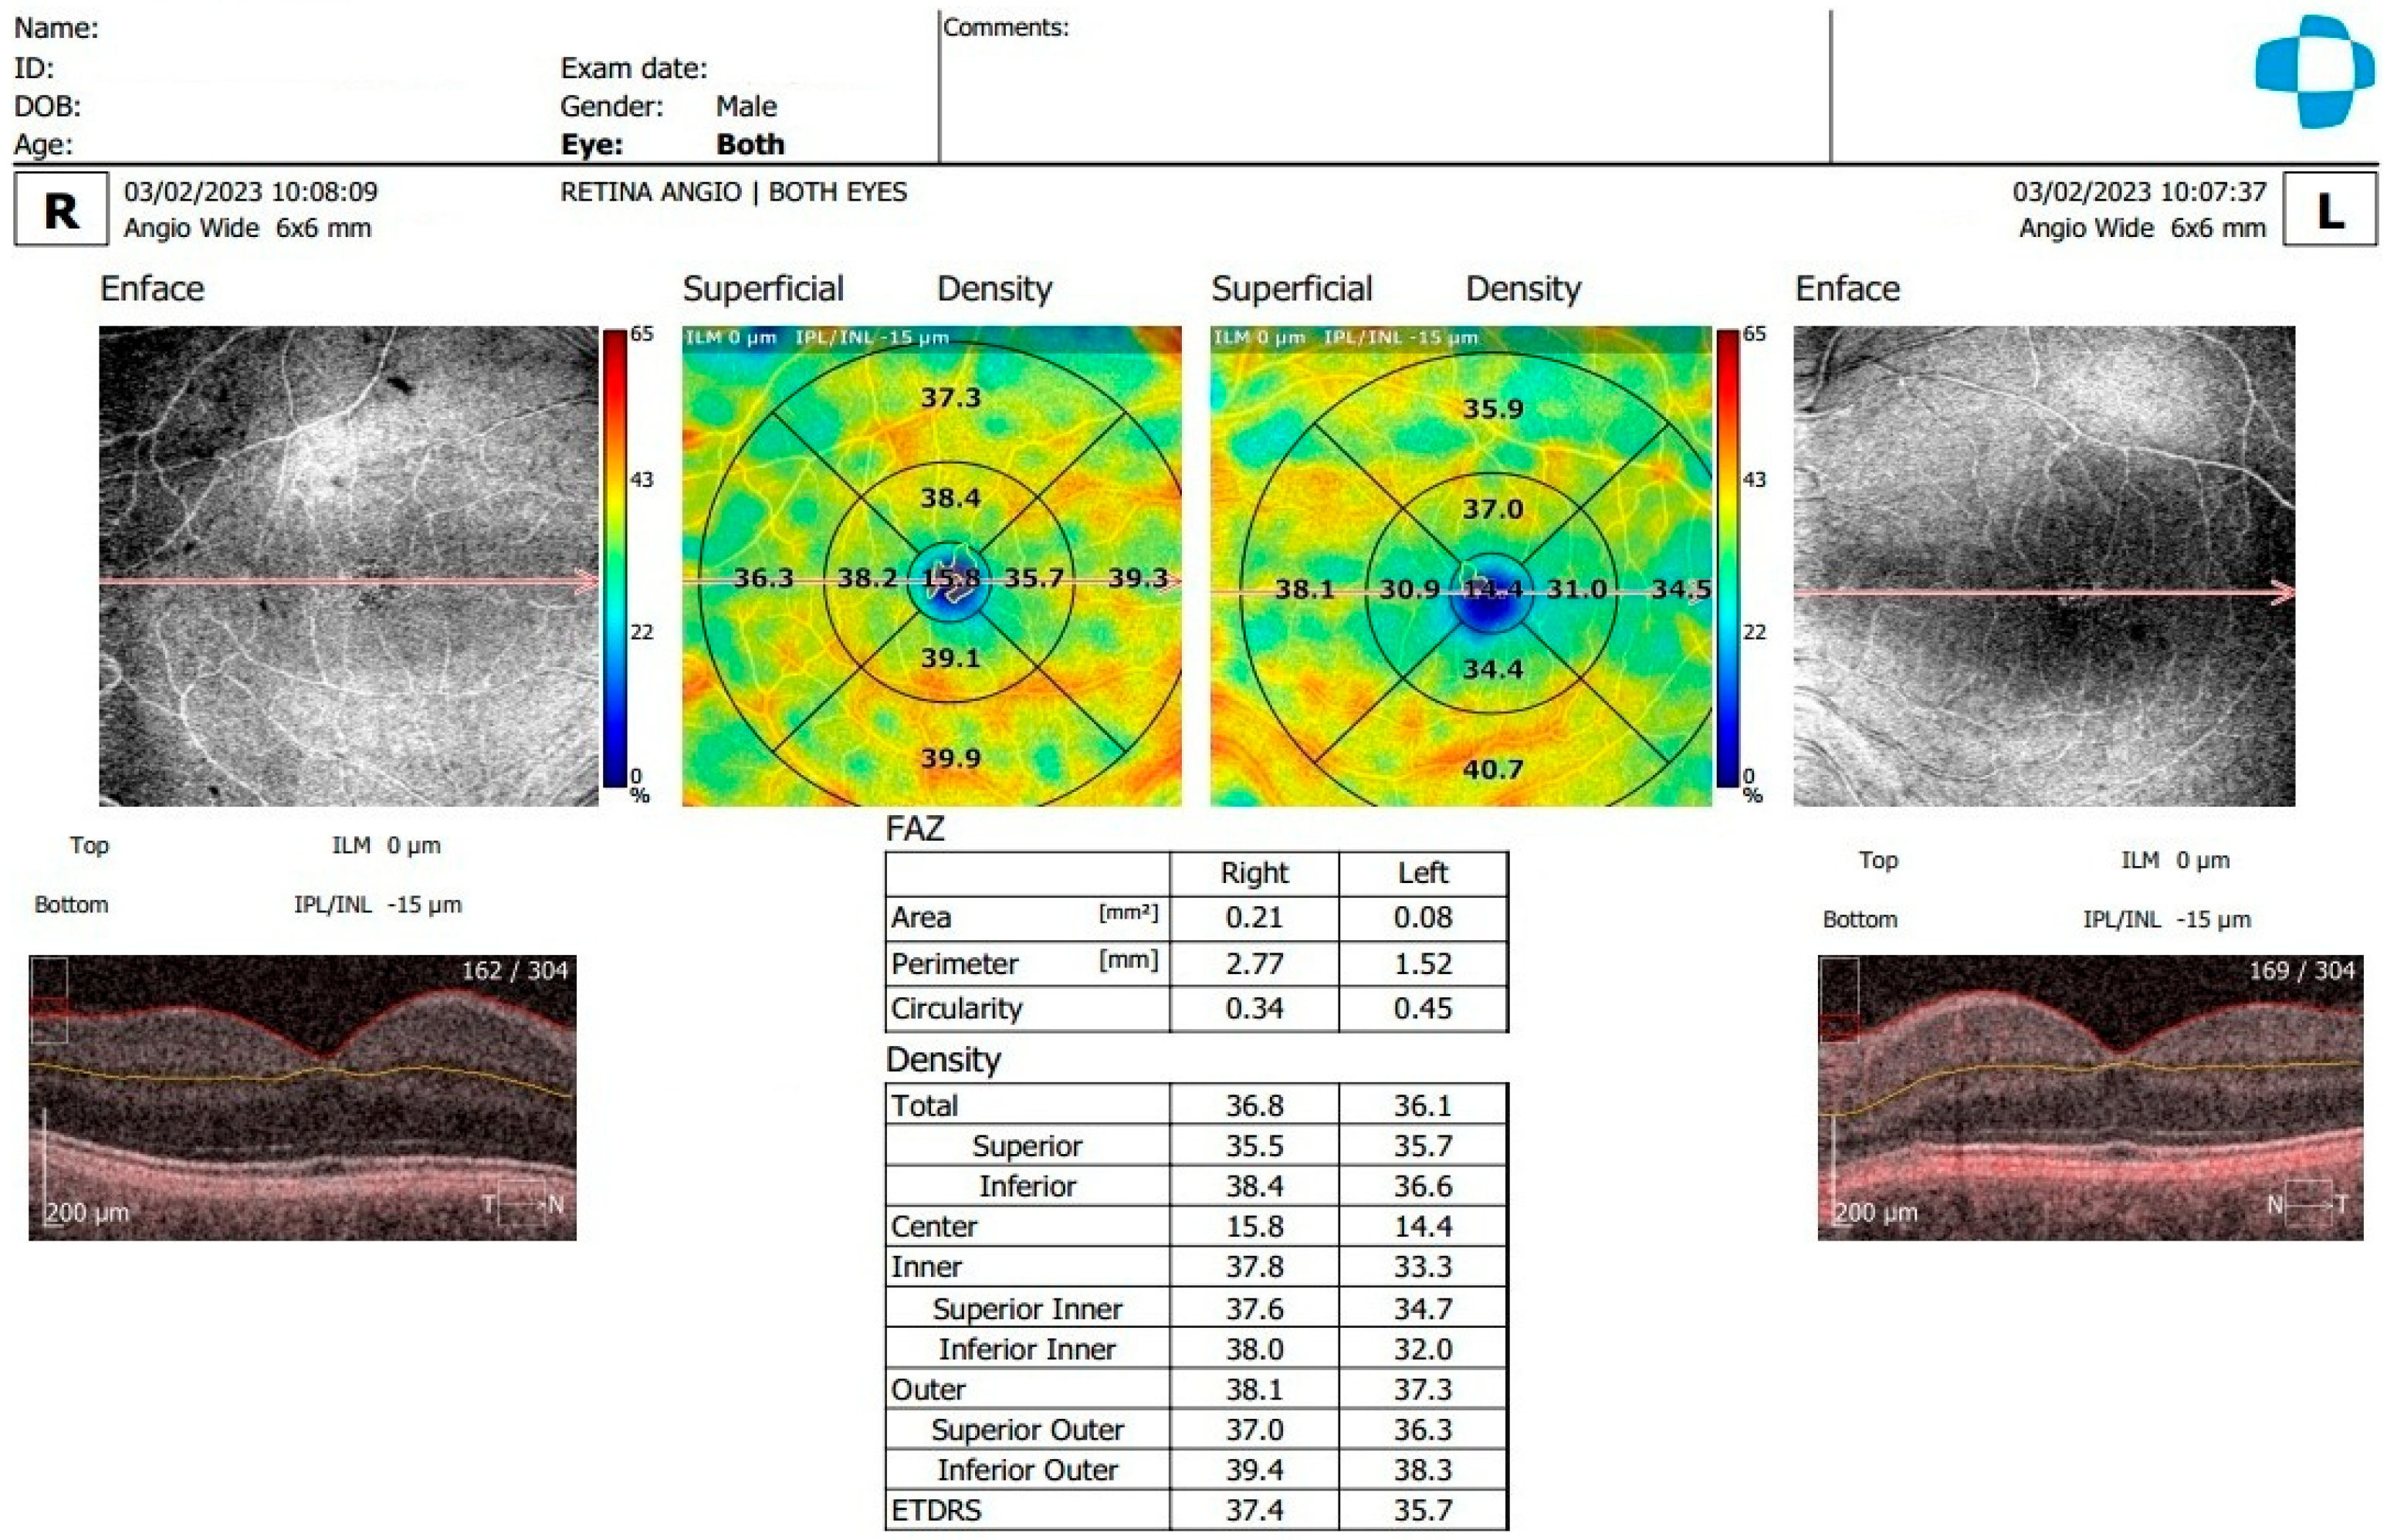
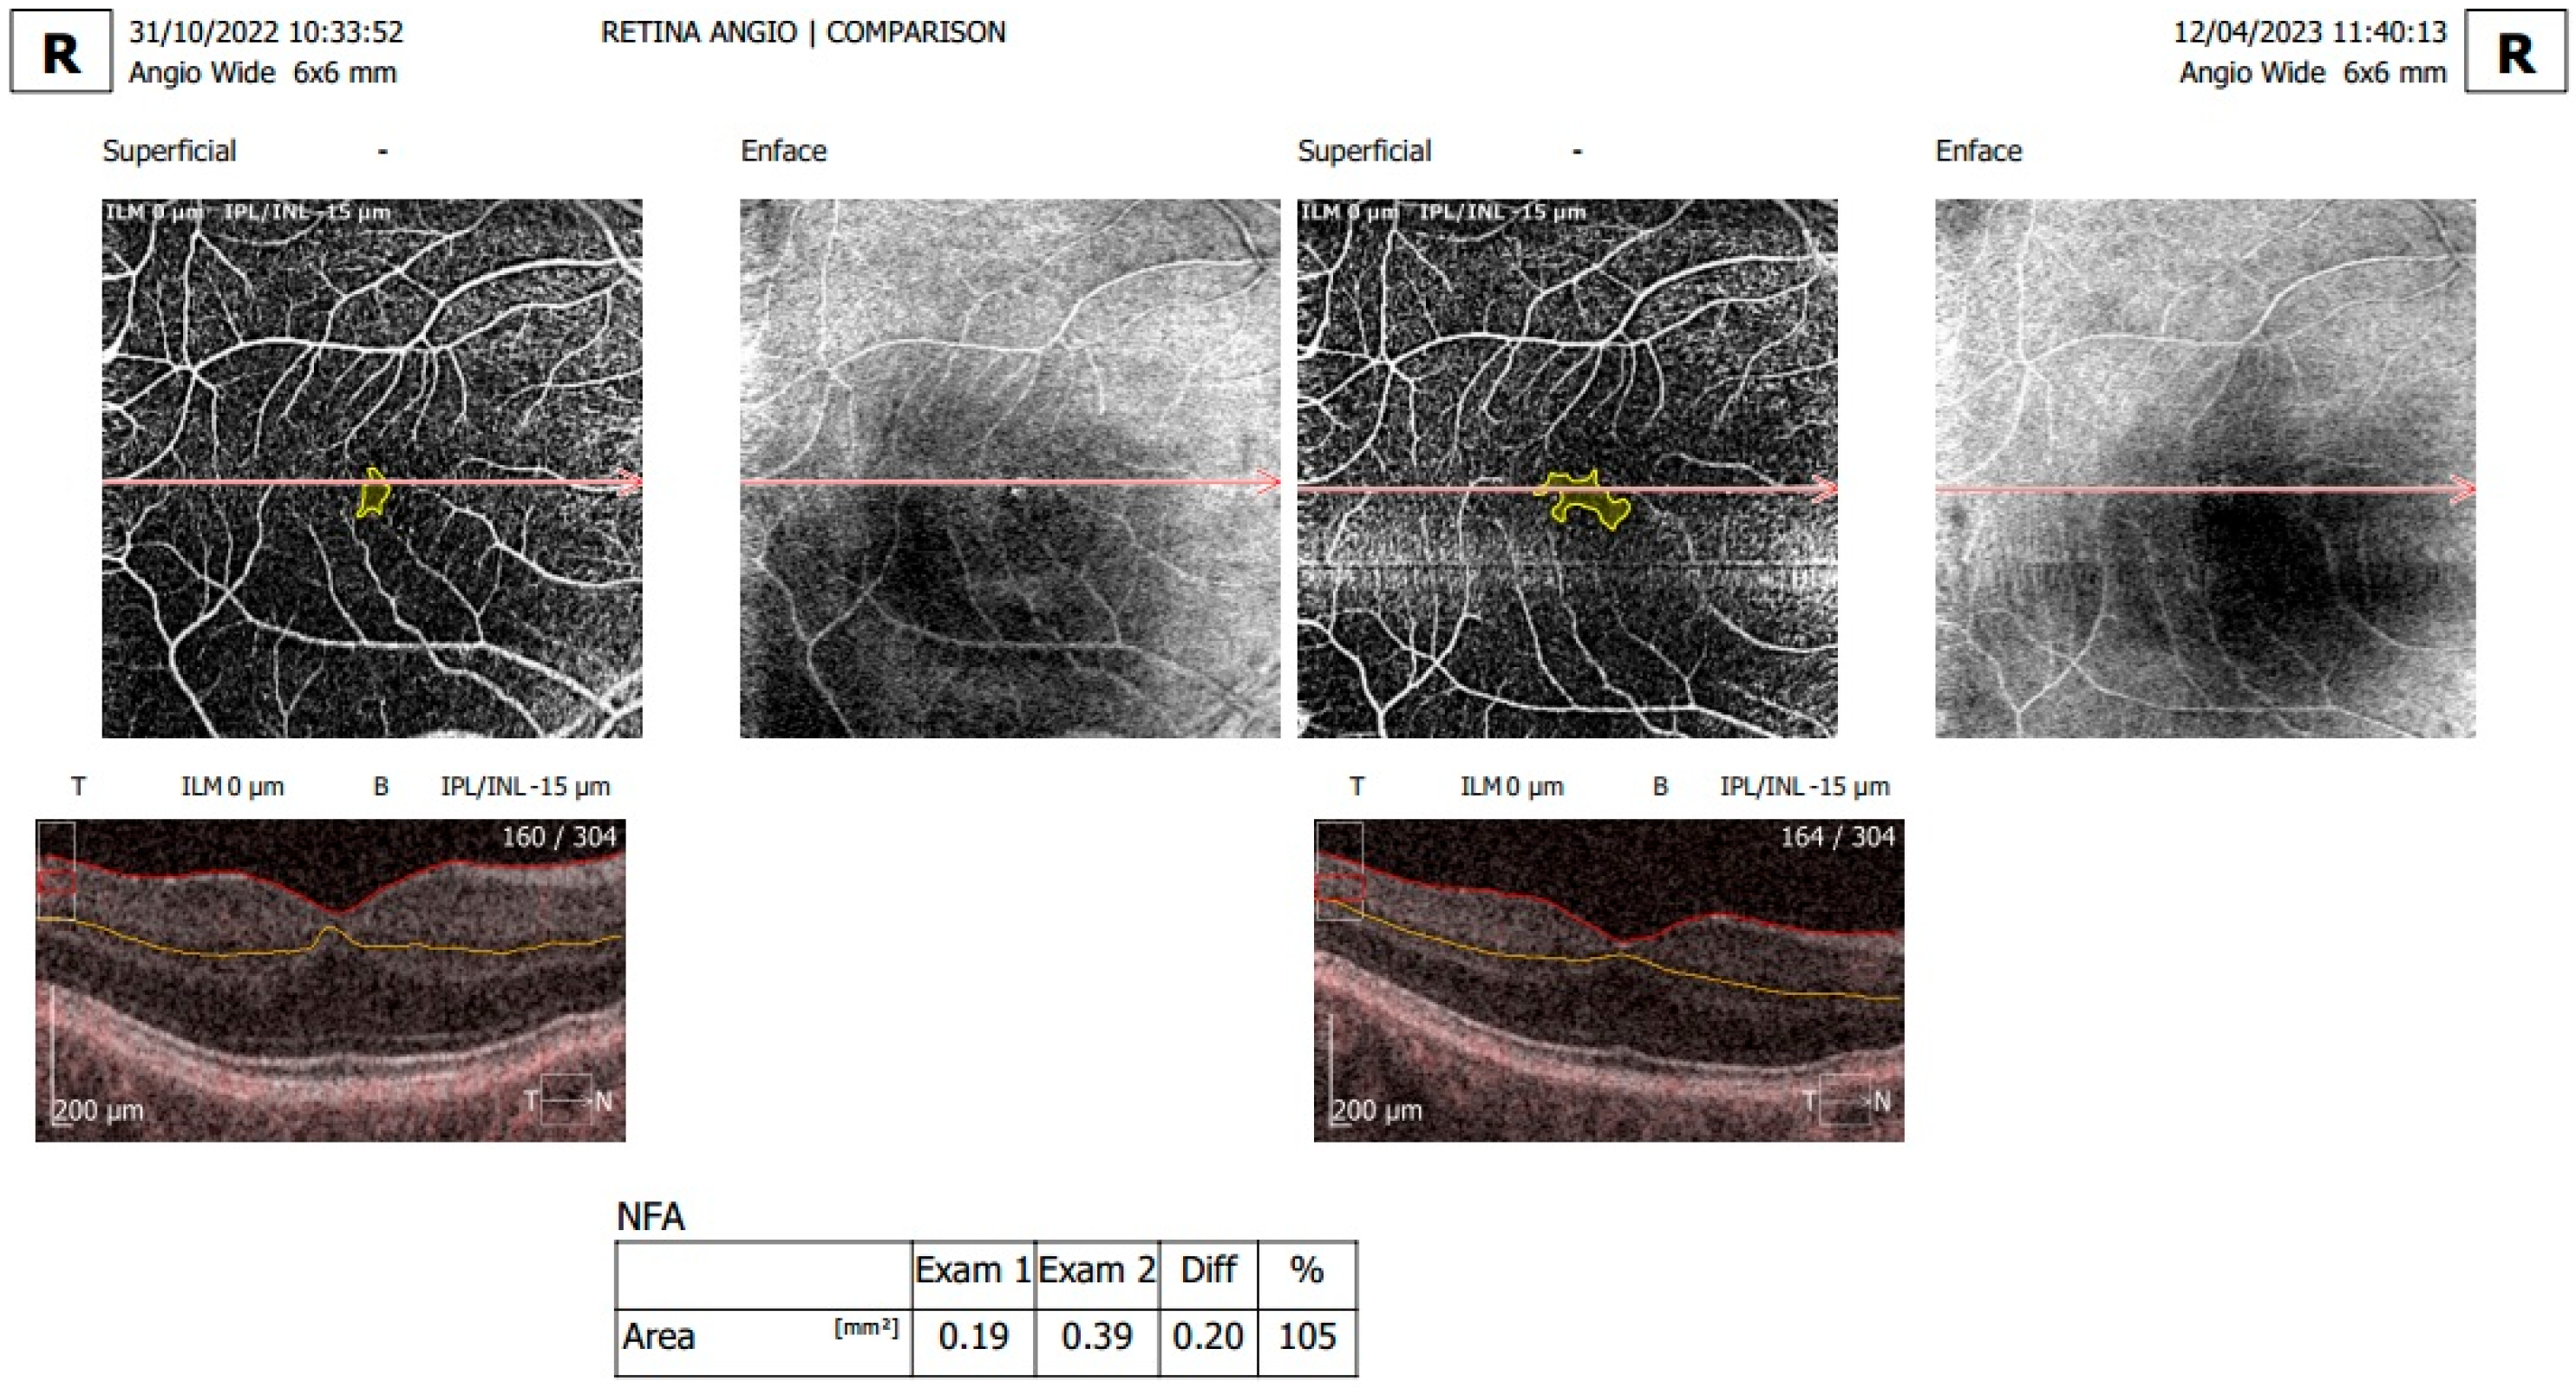
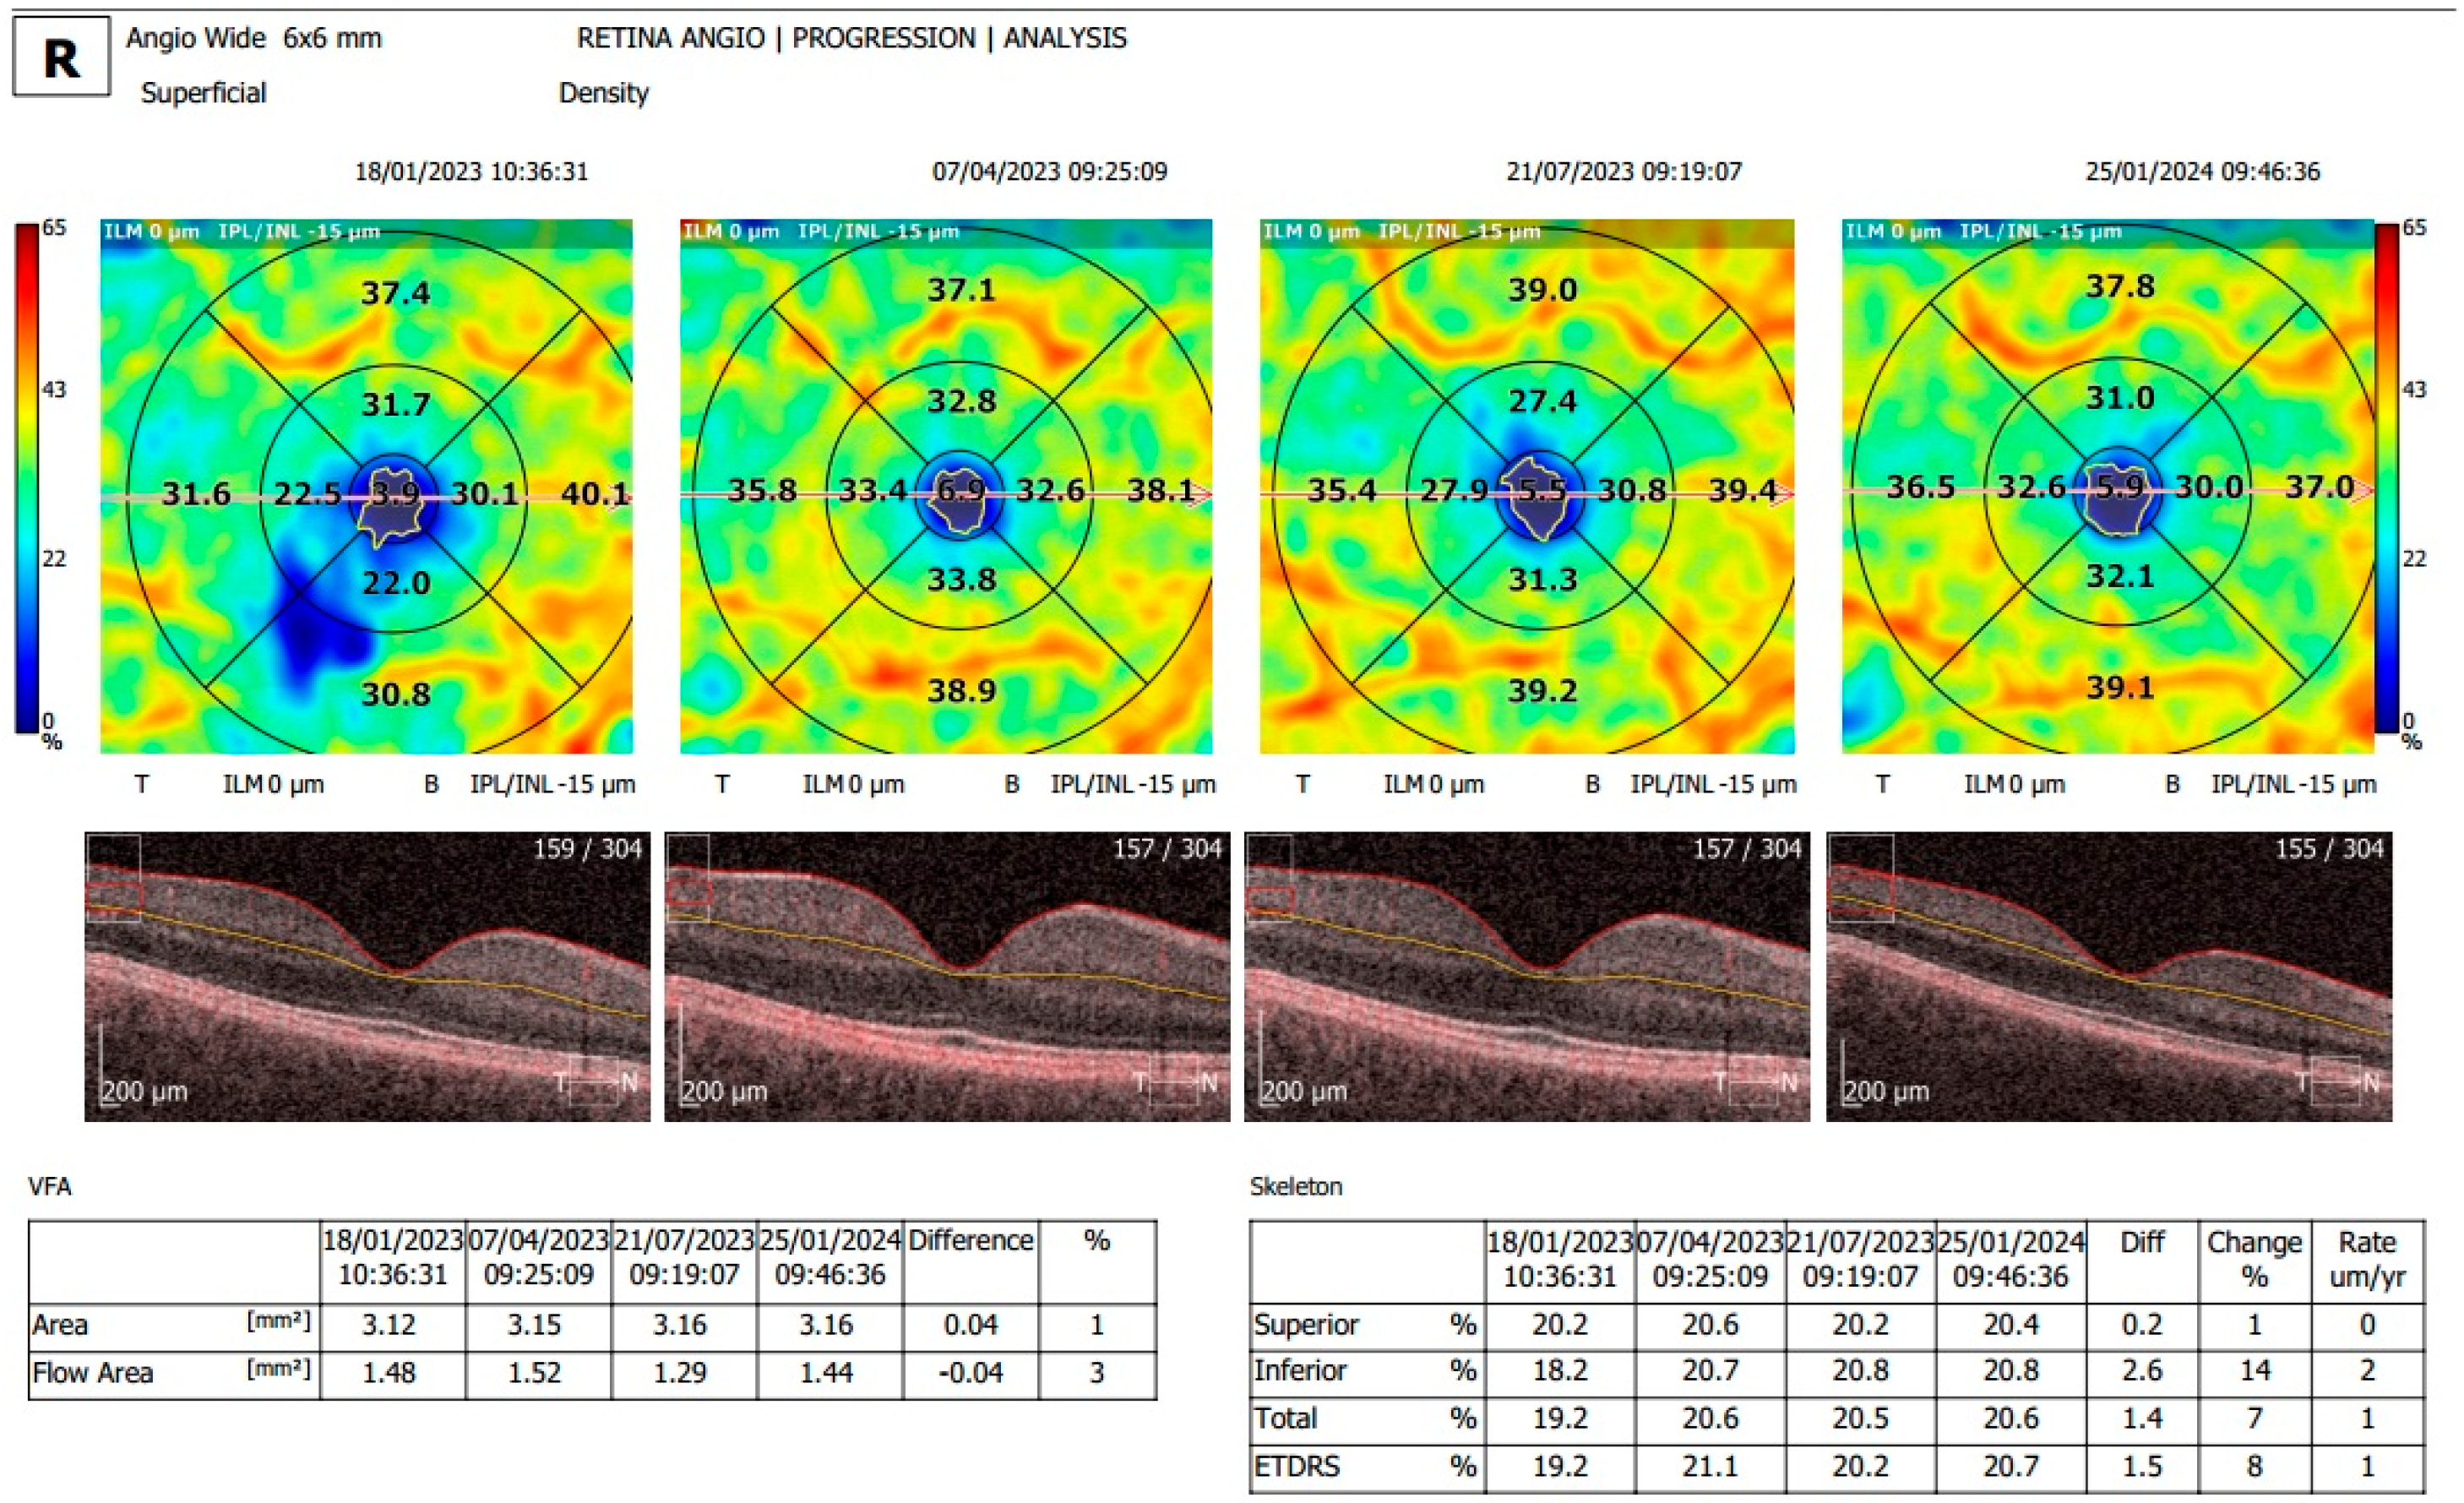
2.2. Examination and OCTA Analysis
2.3. Statistical Analysis
3. Results
3.1. Descriptive Analysis/Study Population
3.2. Analysis of OCTA Parameters in Patients with Carotid Stenosis
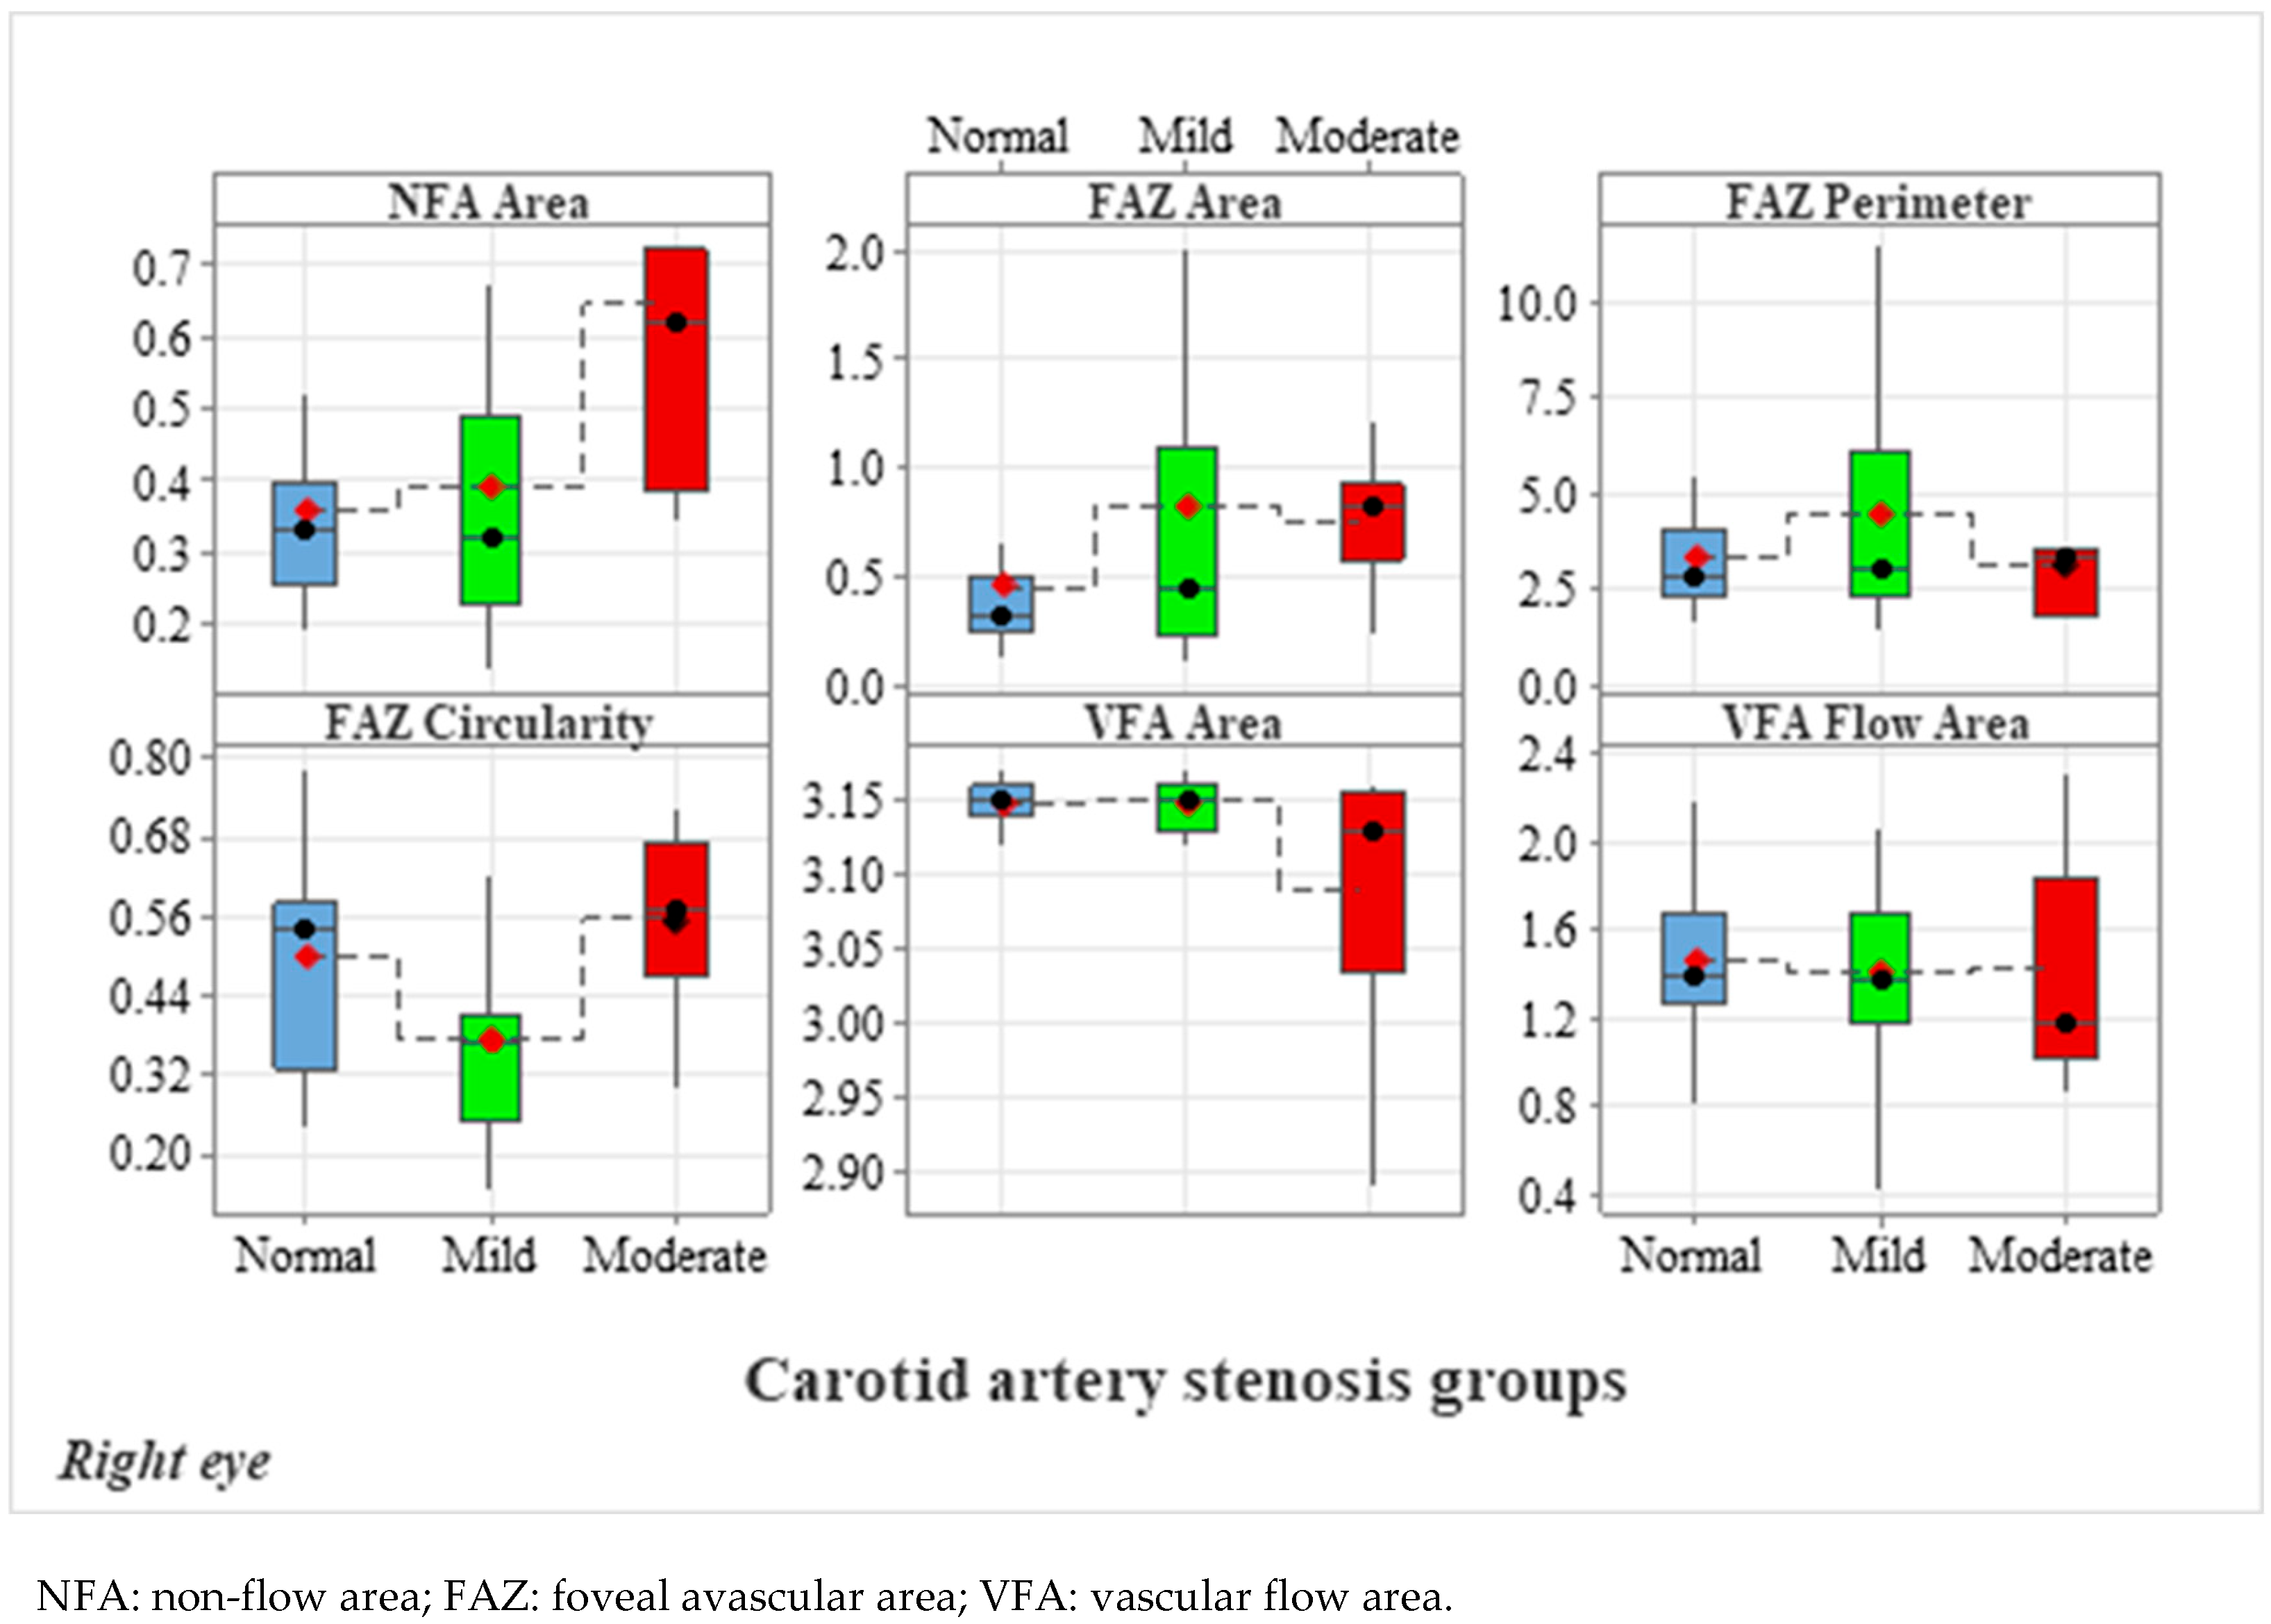
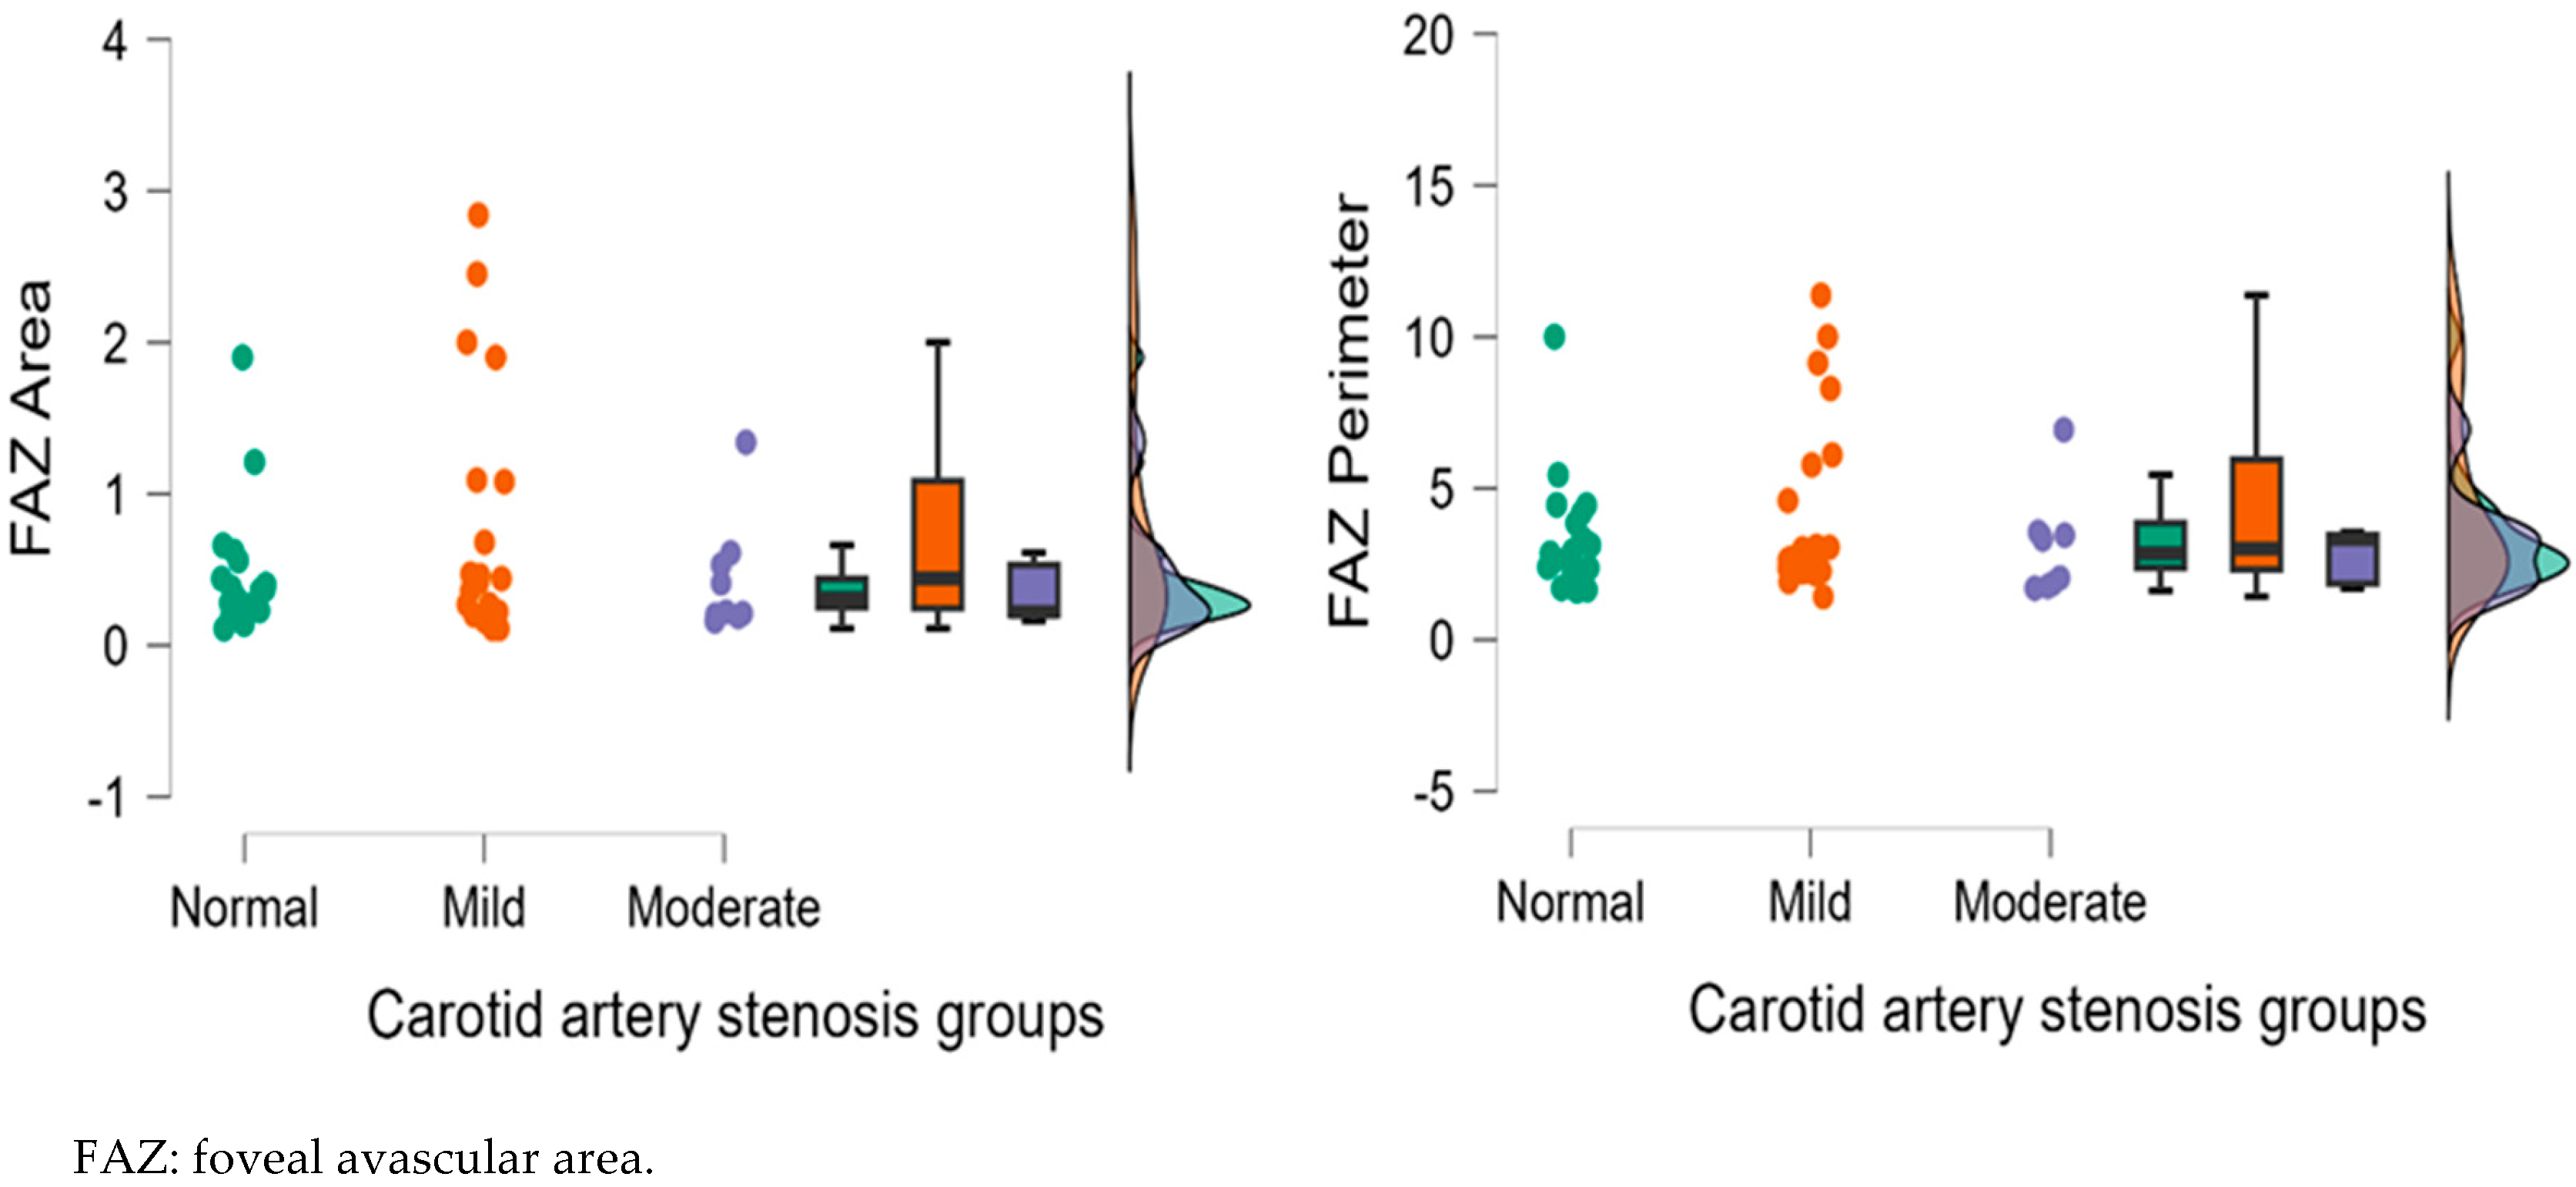
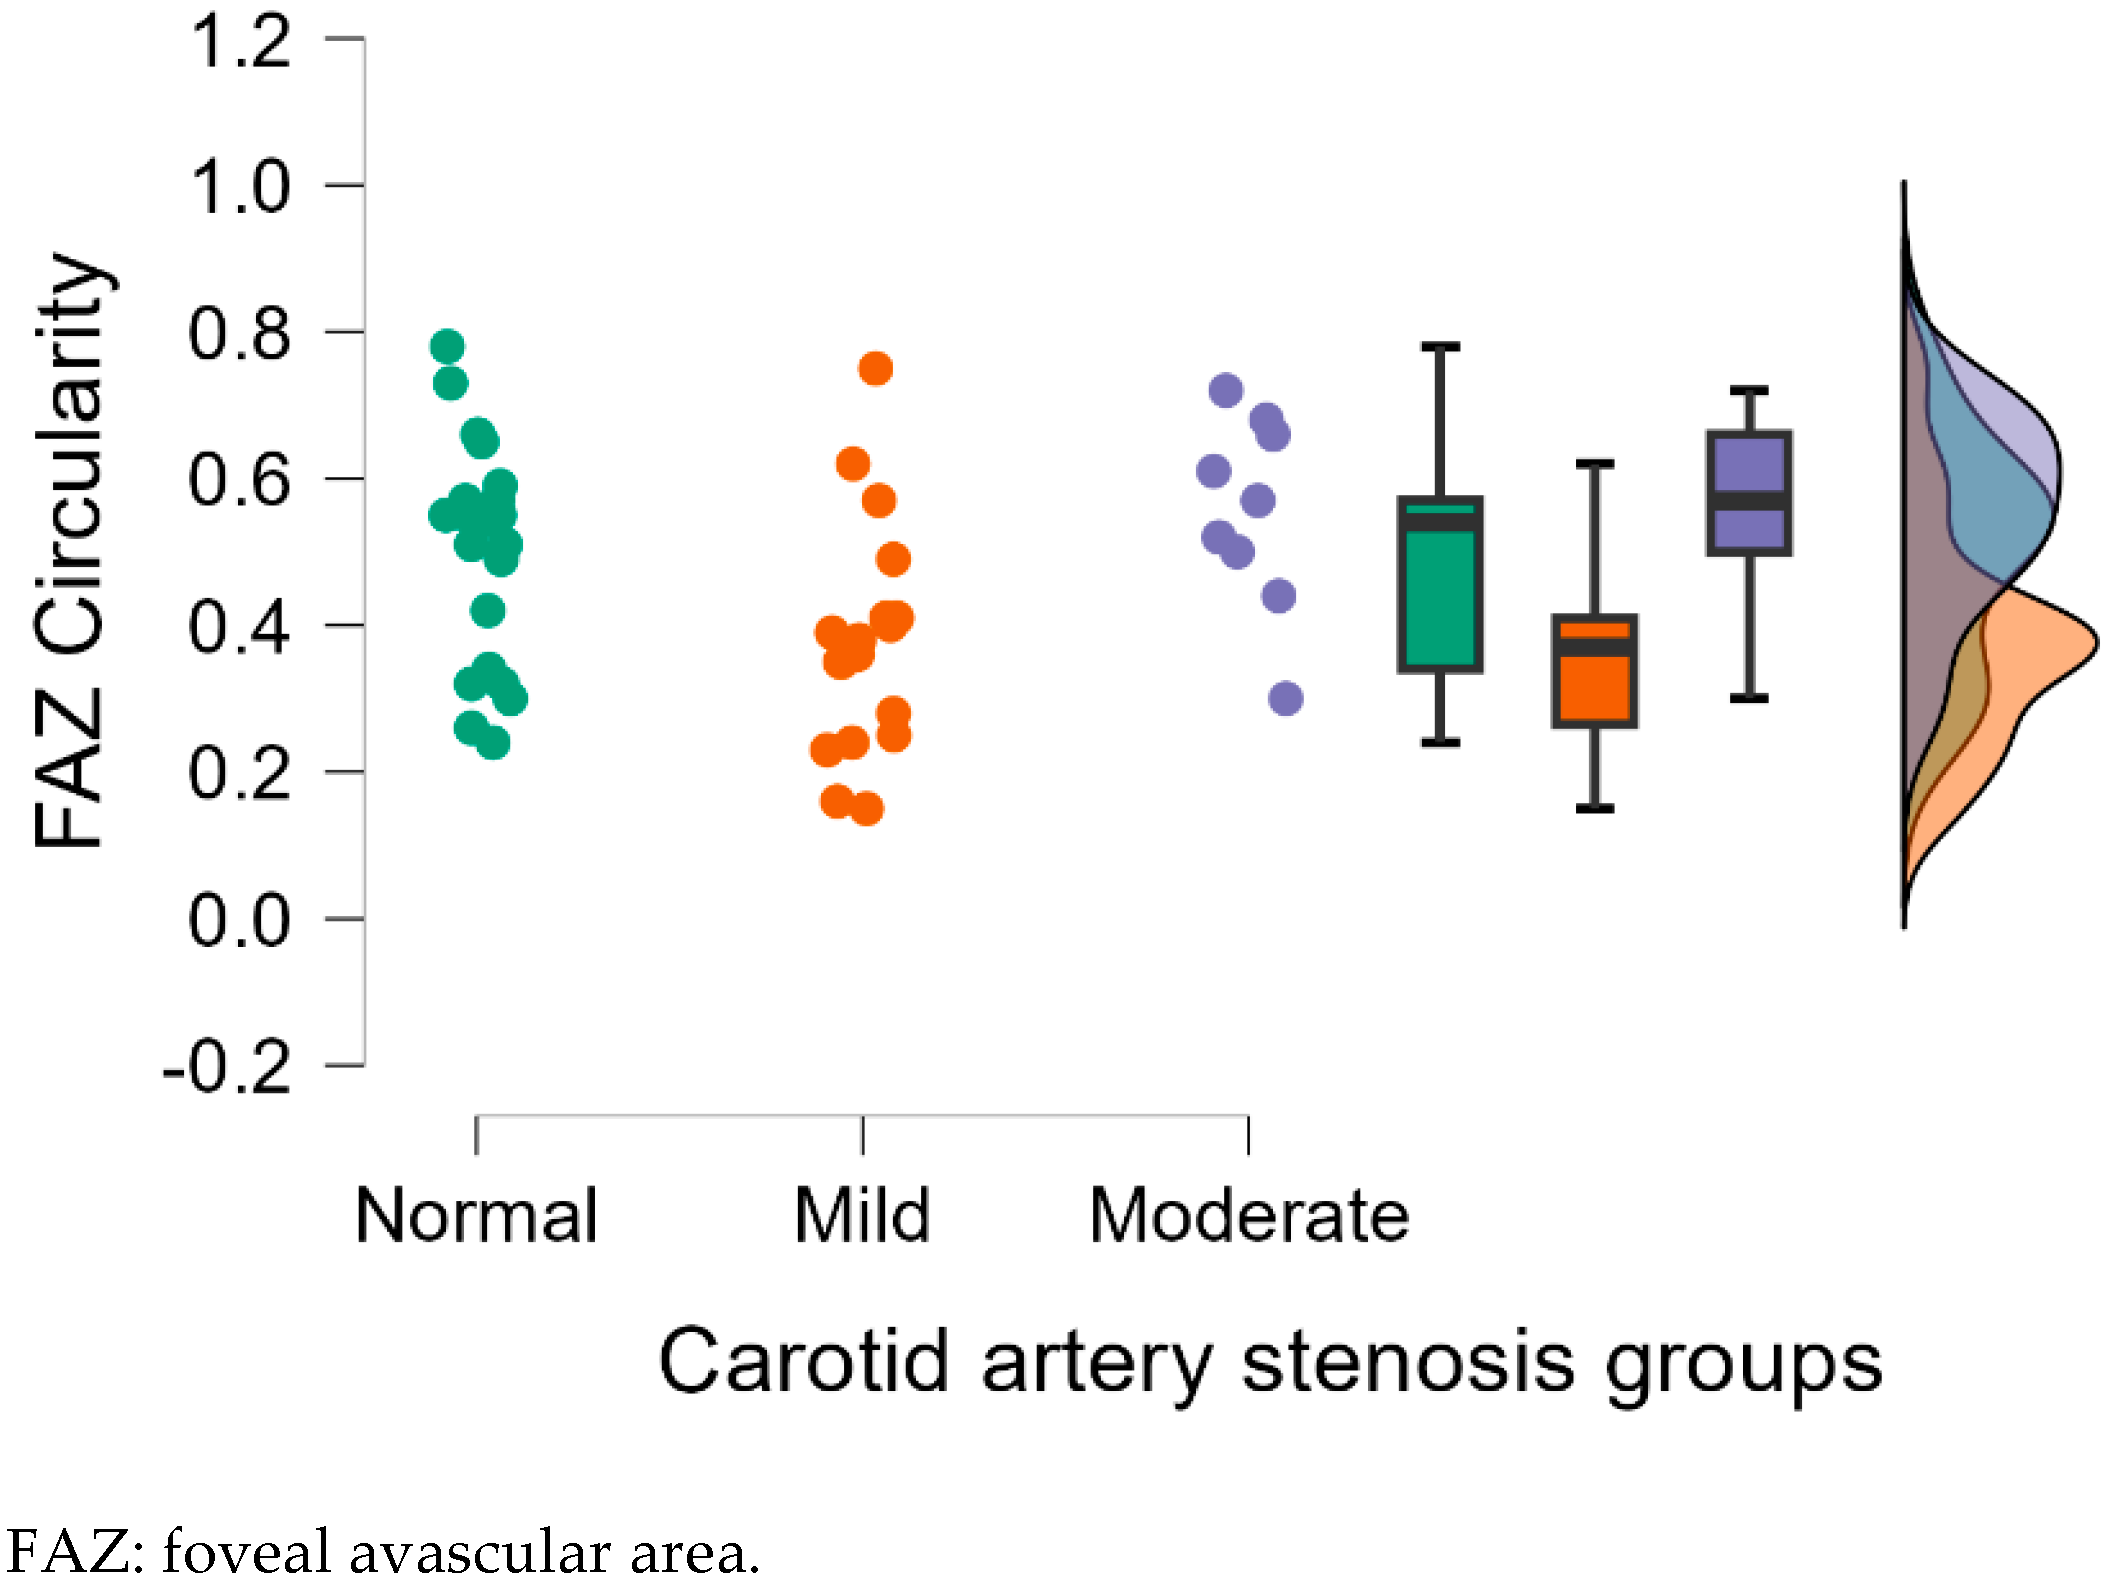
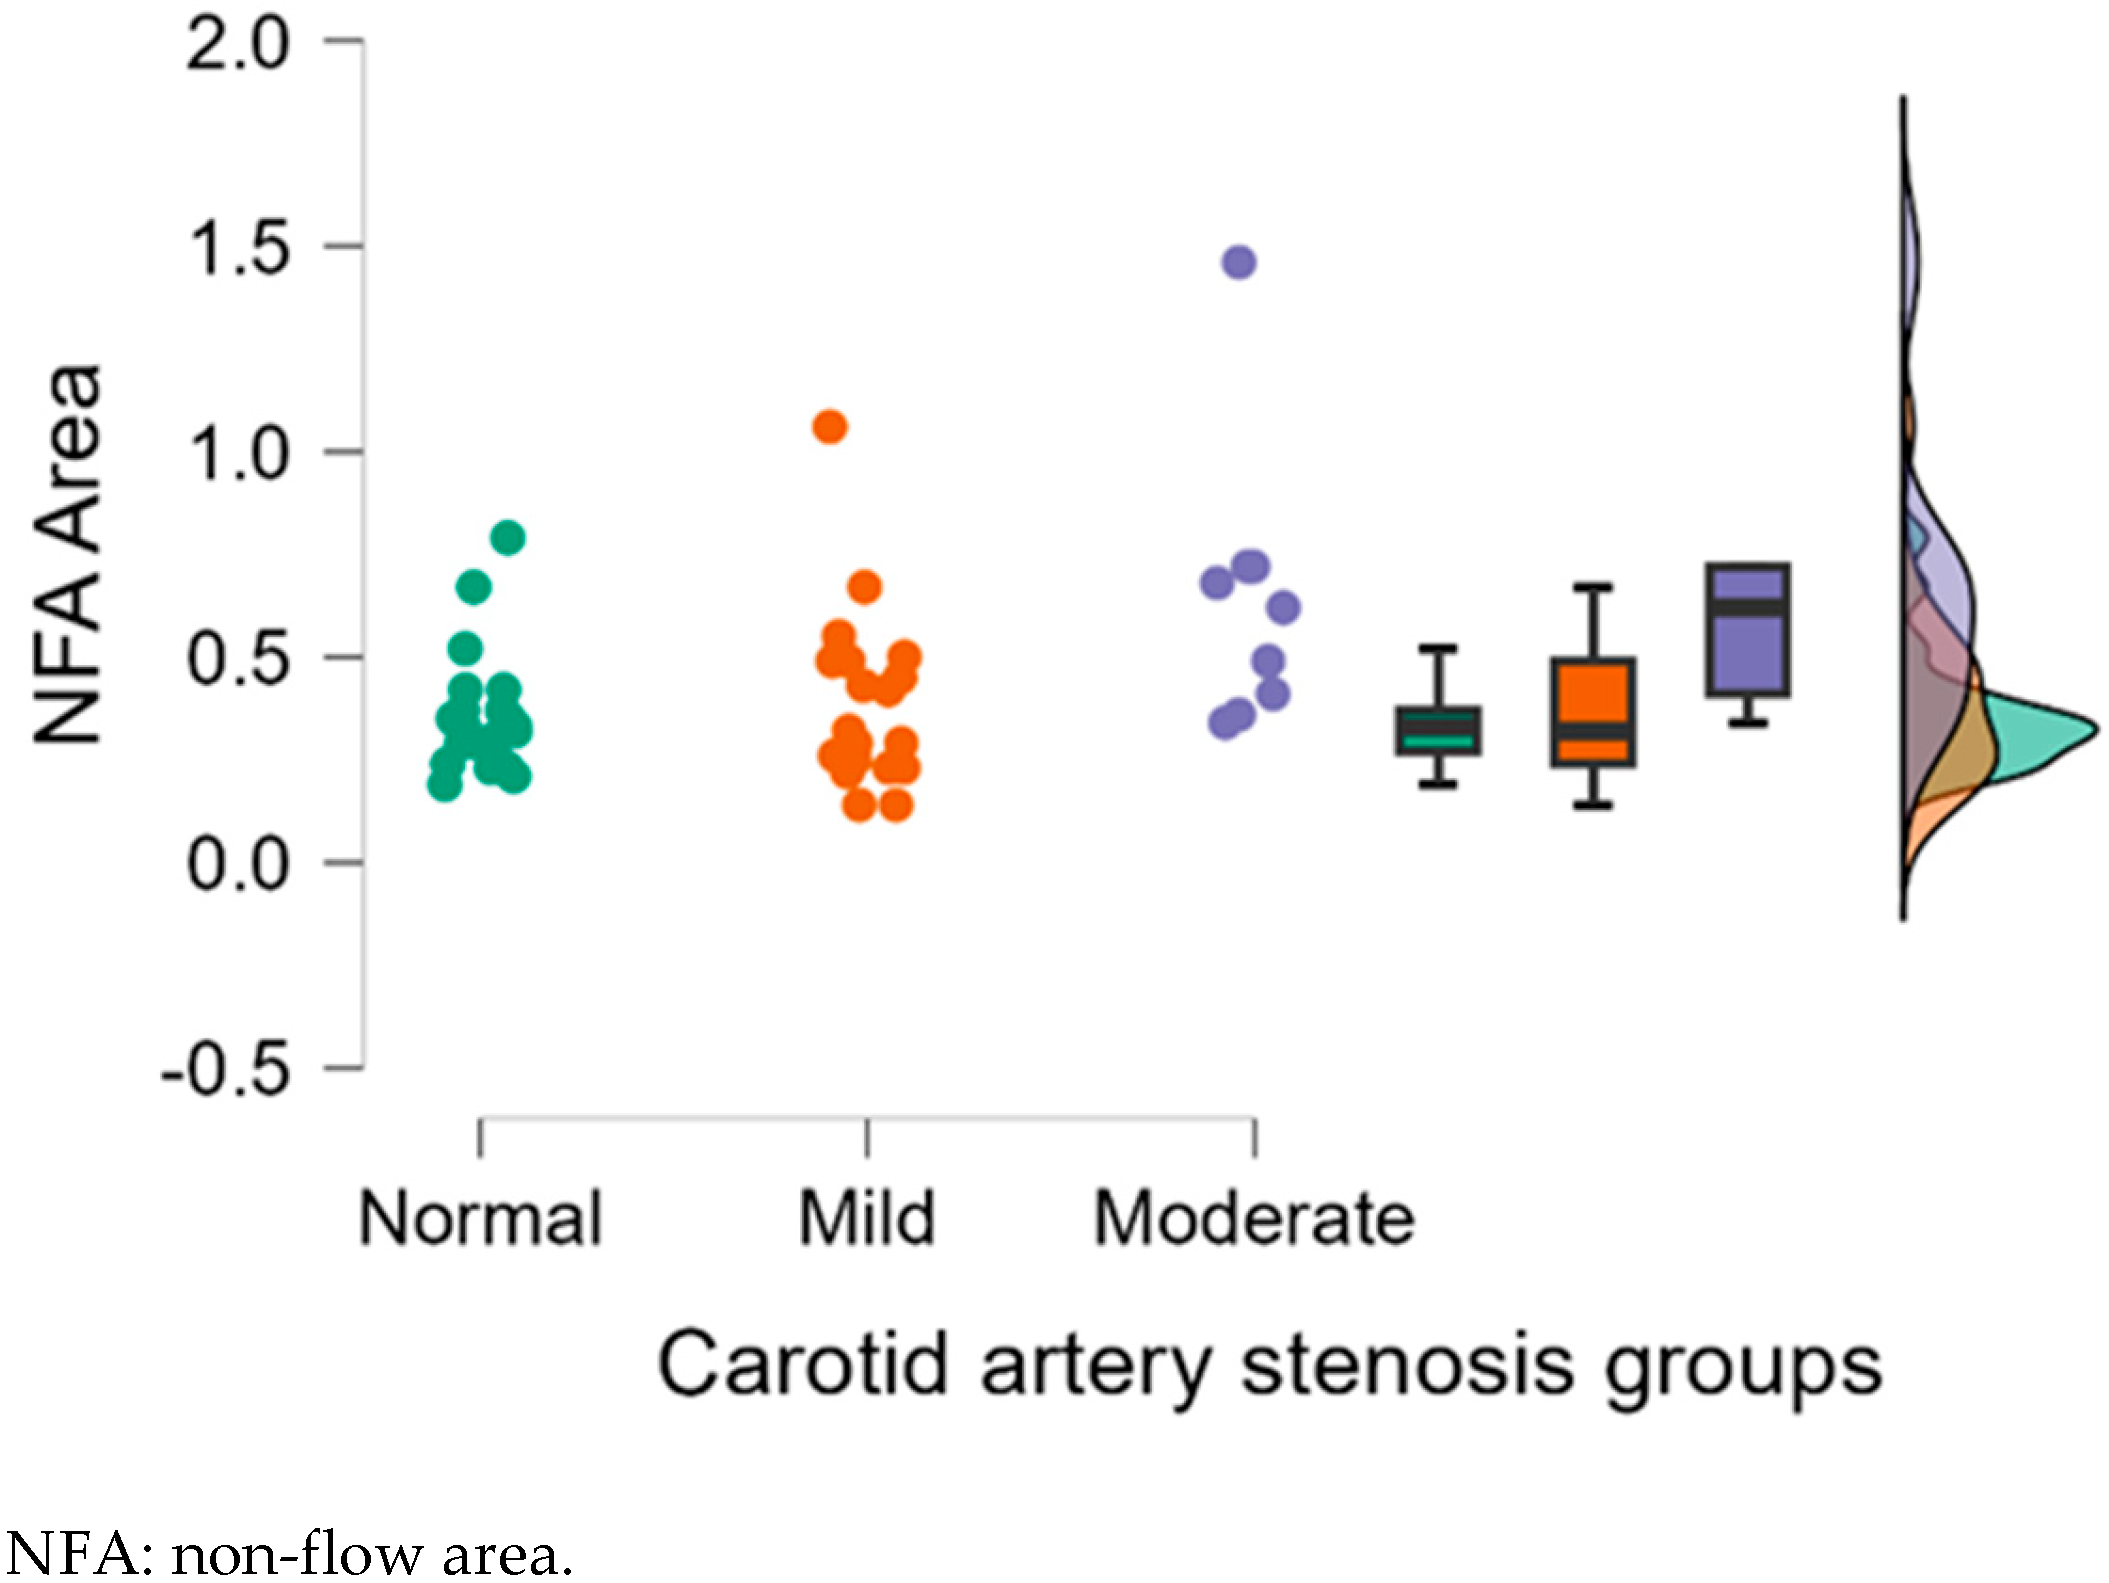
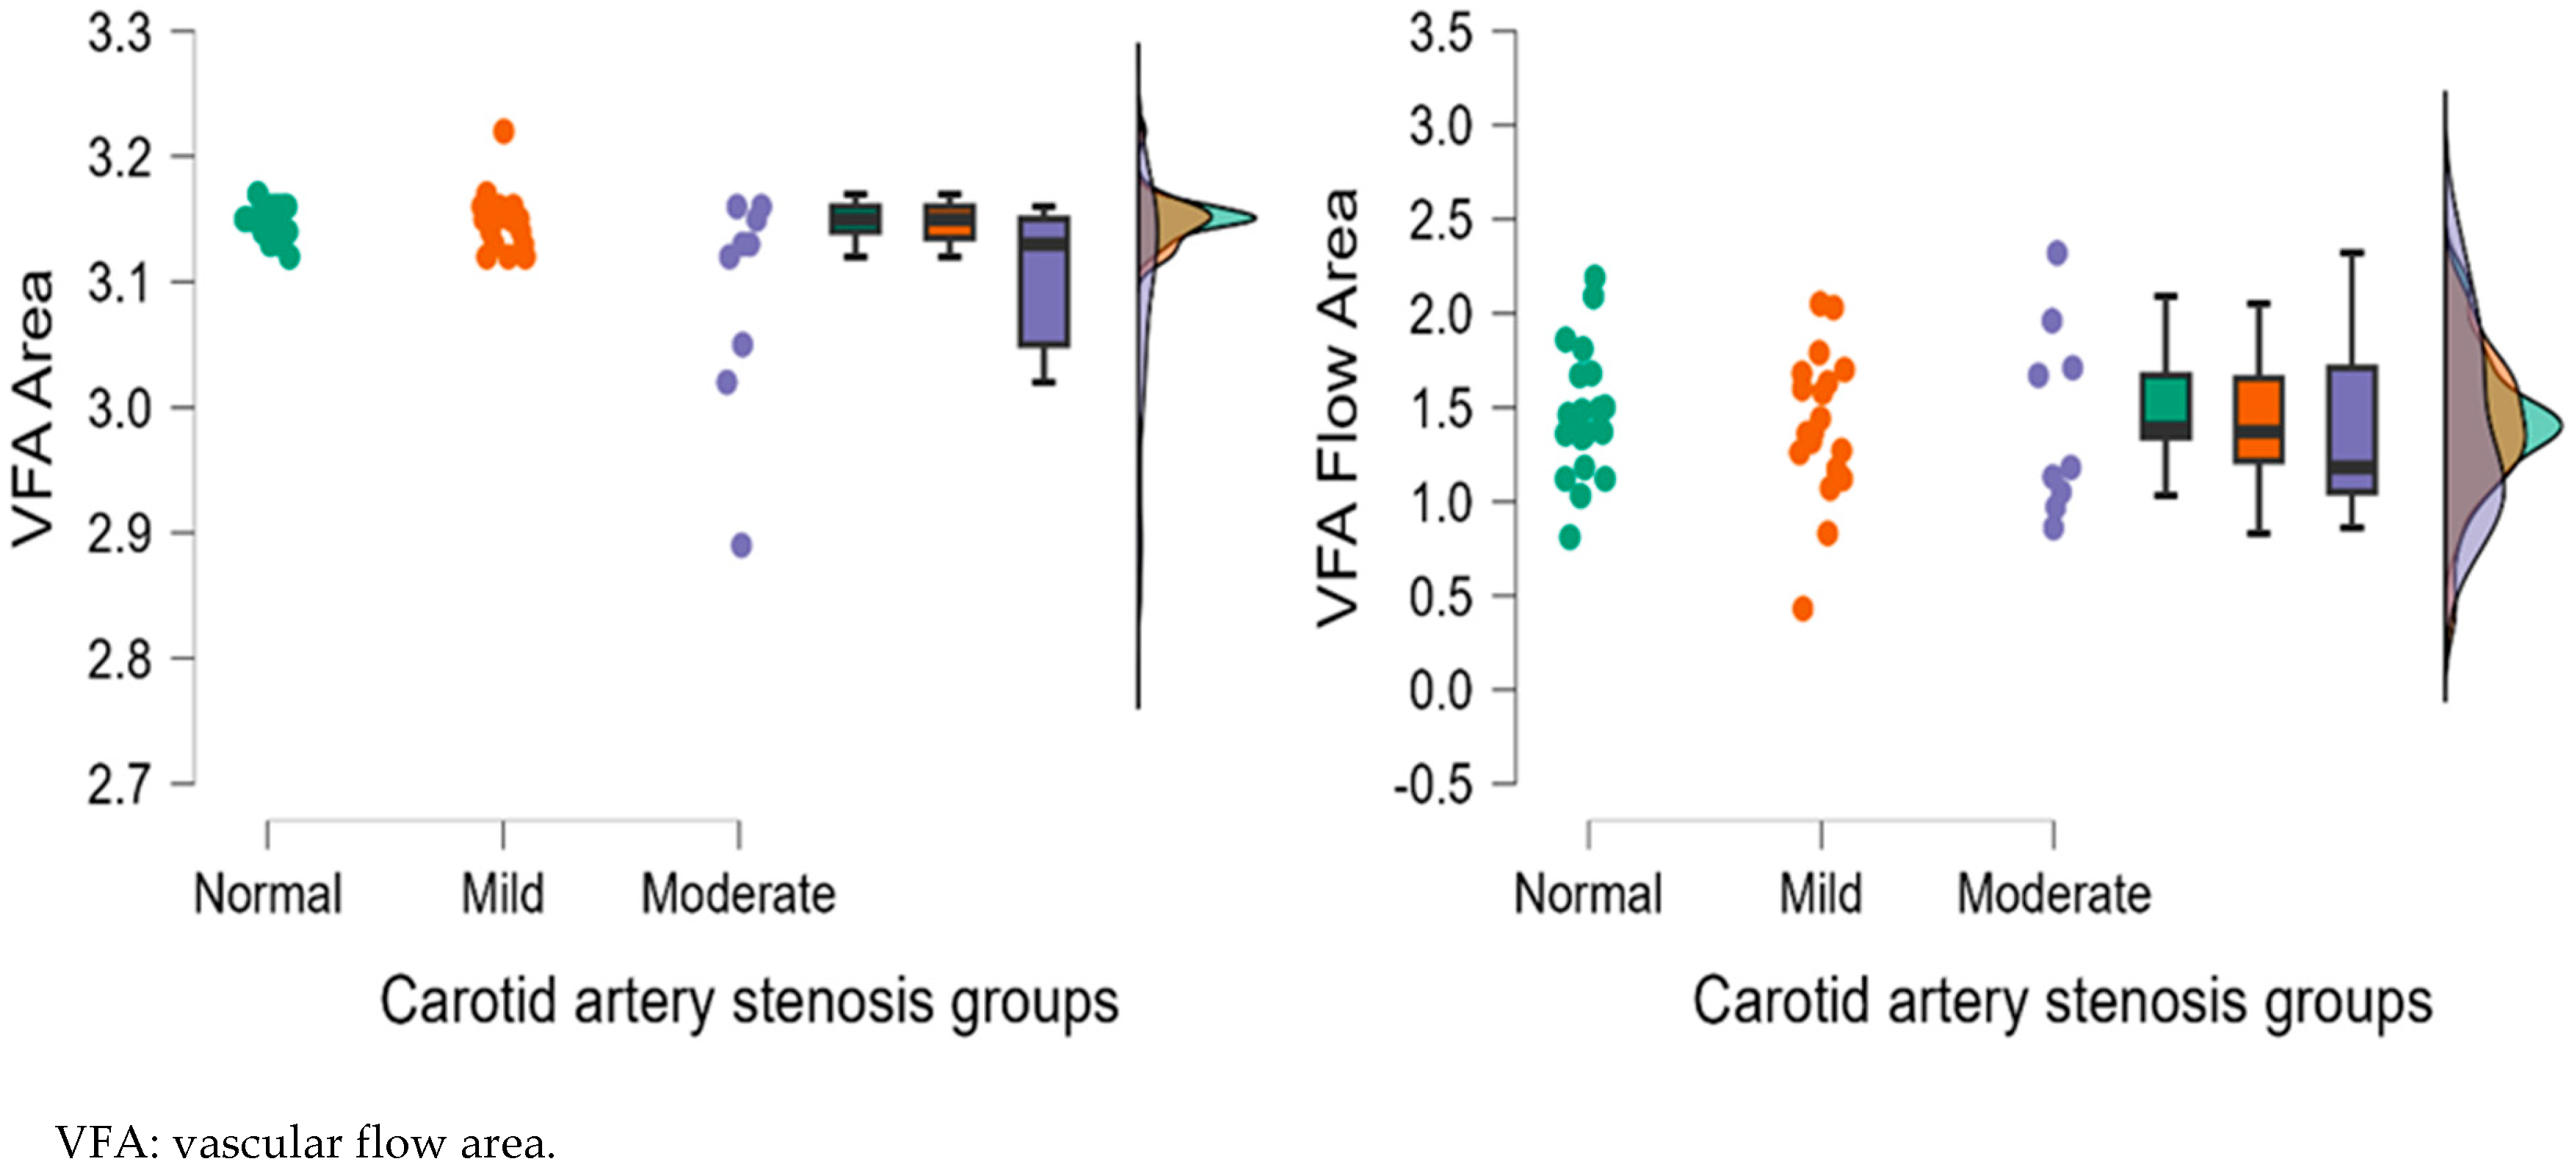
3.2.1. Analysis of Right Eye OCTA Parameters
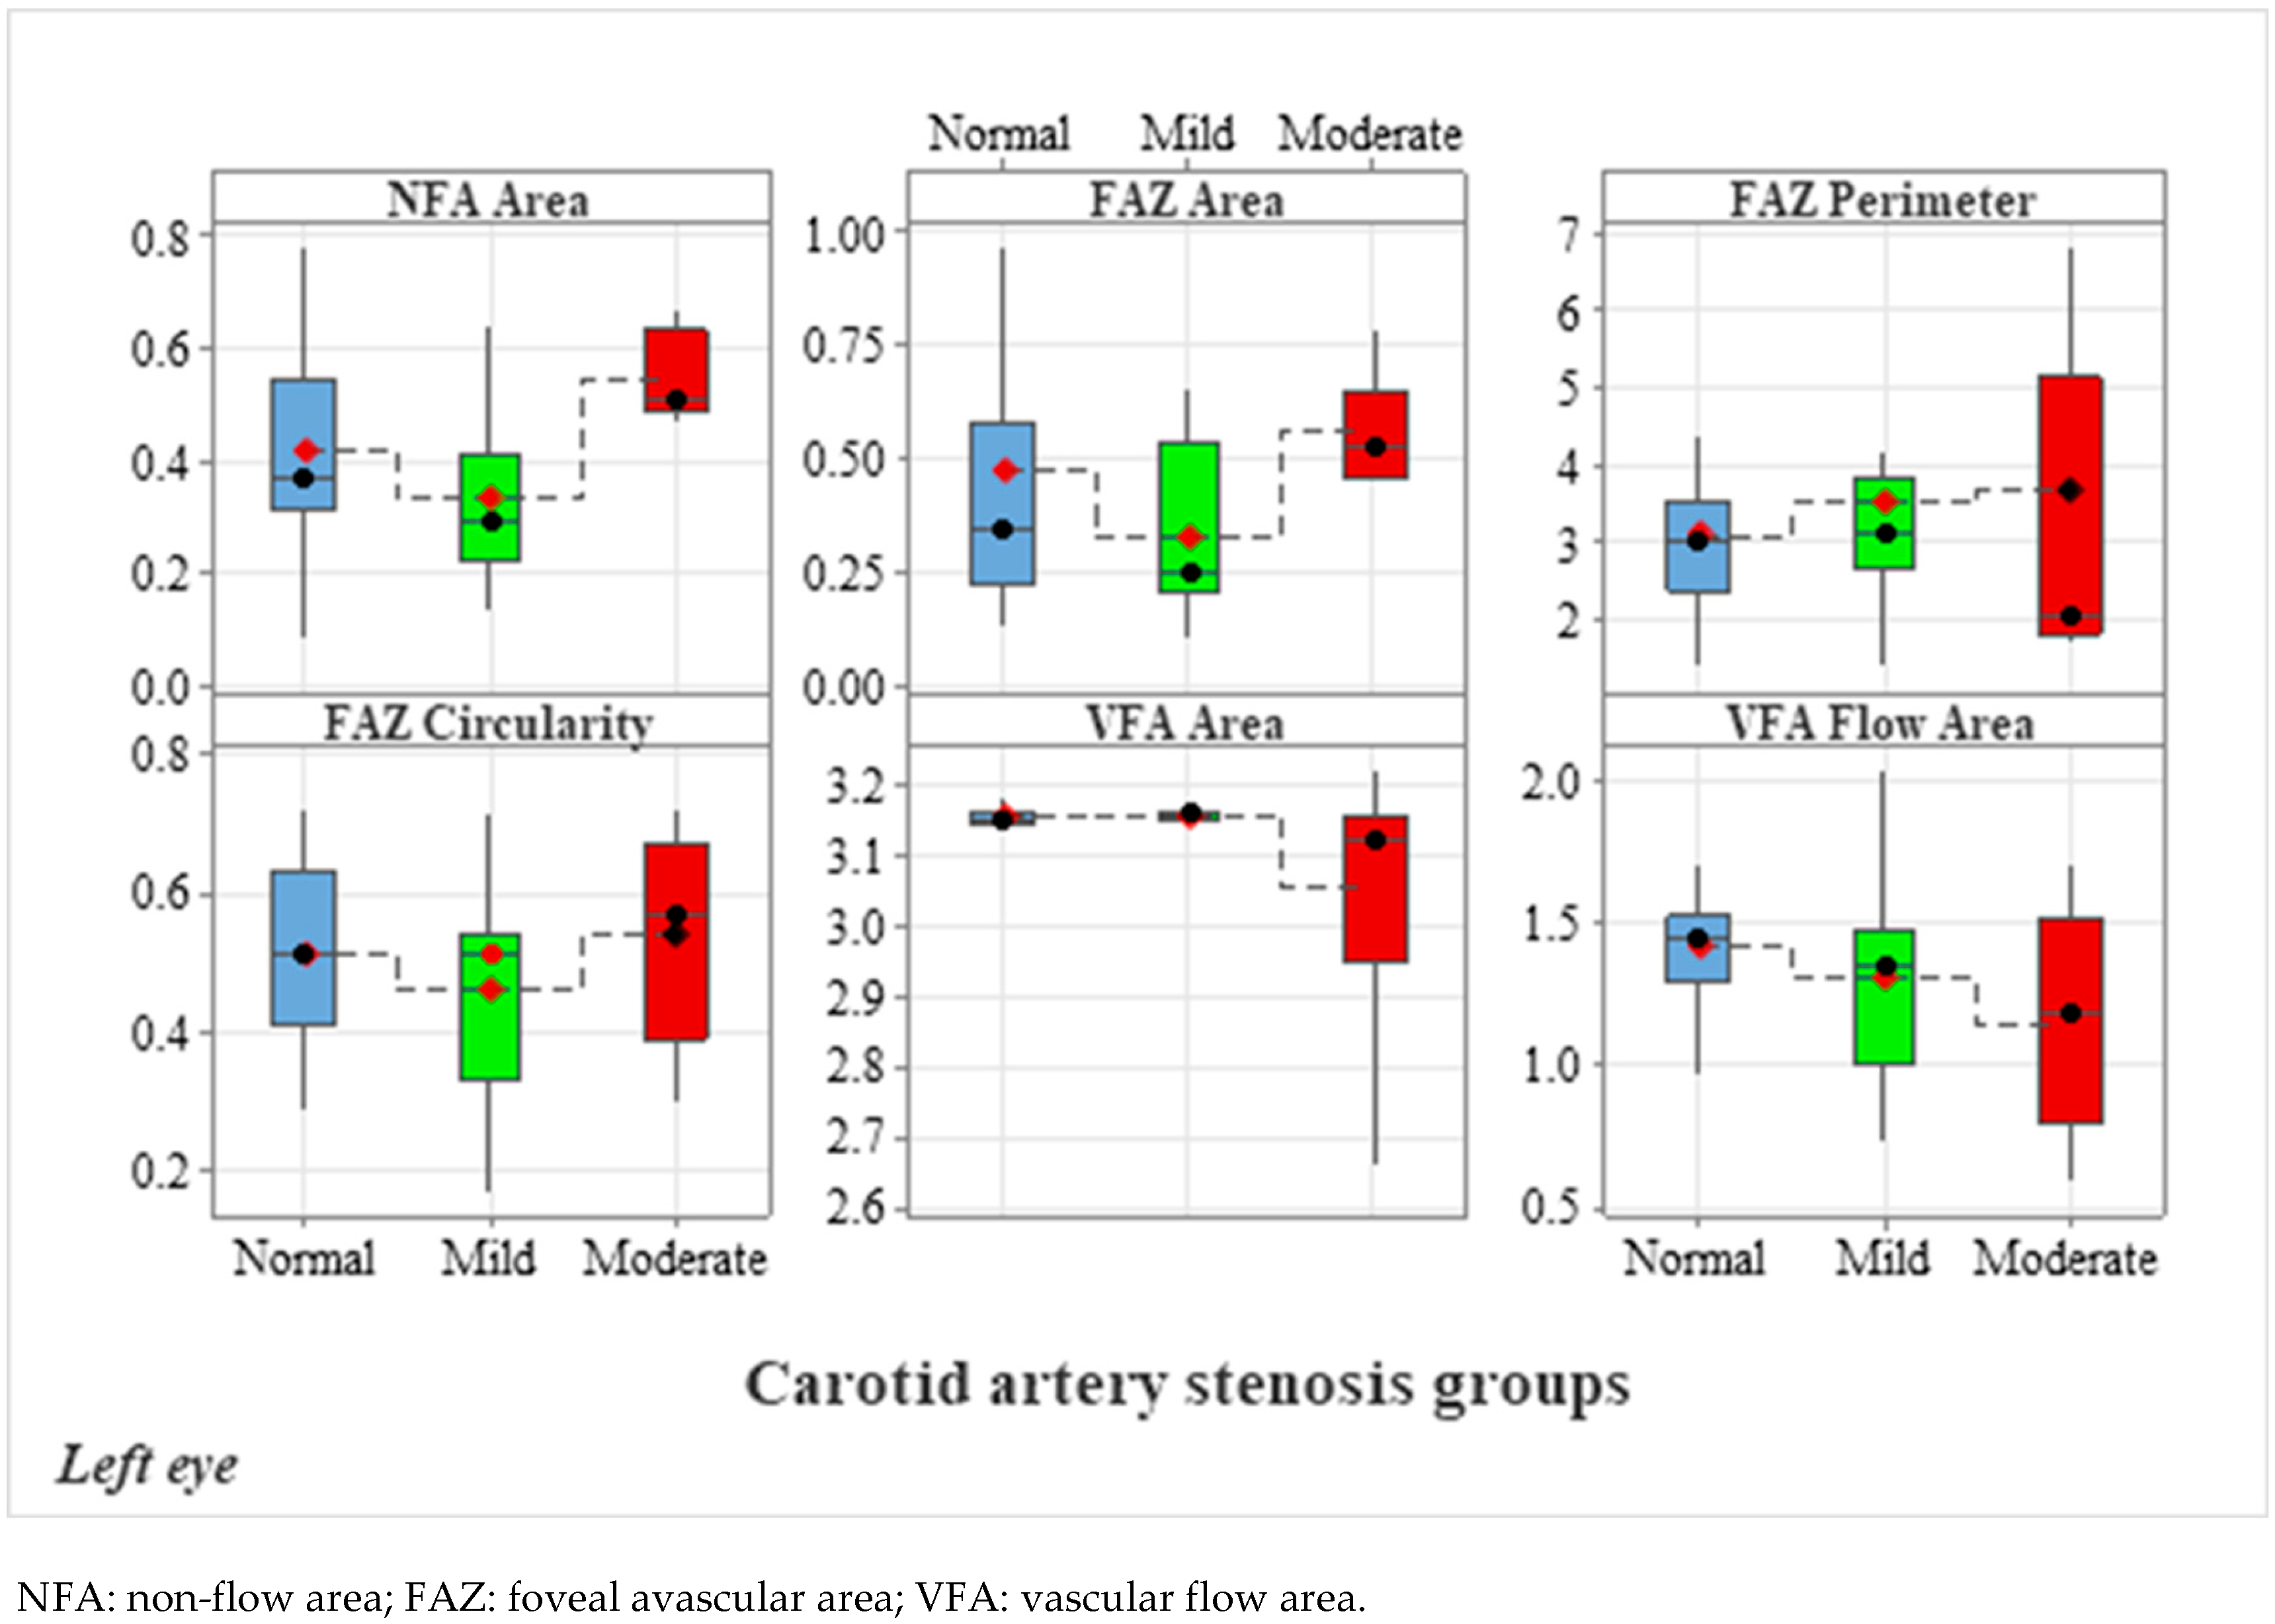
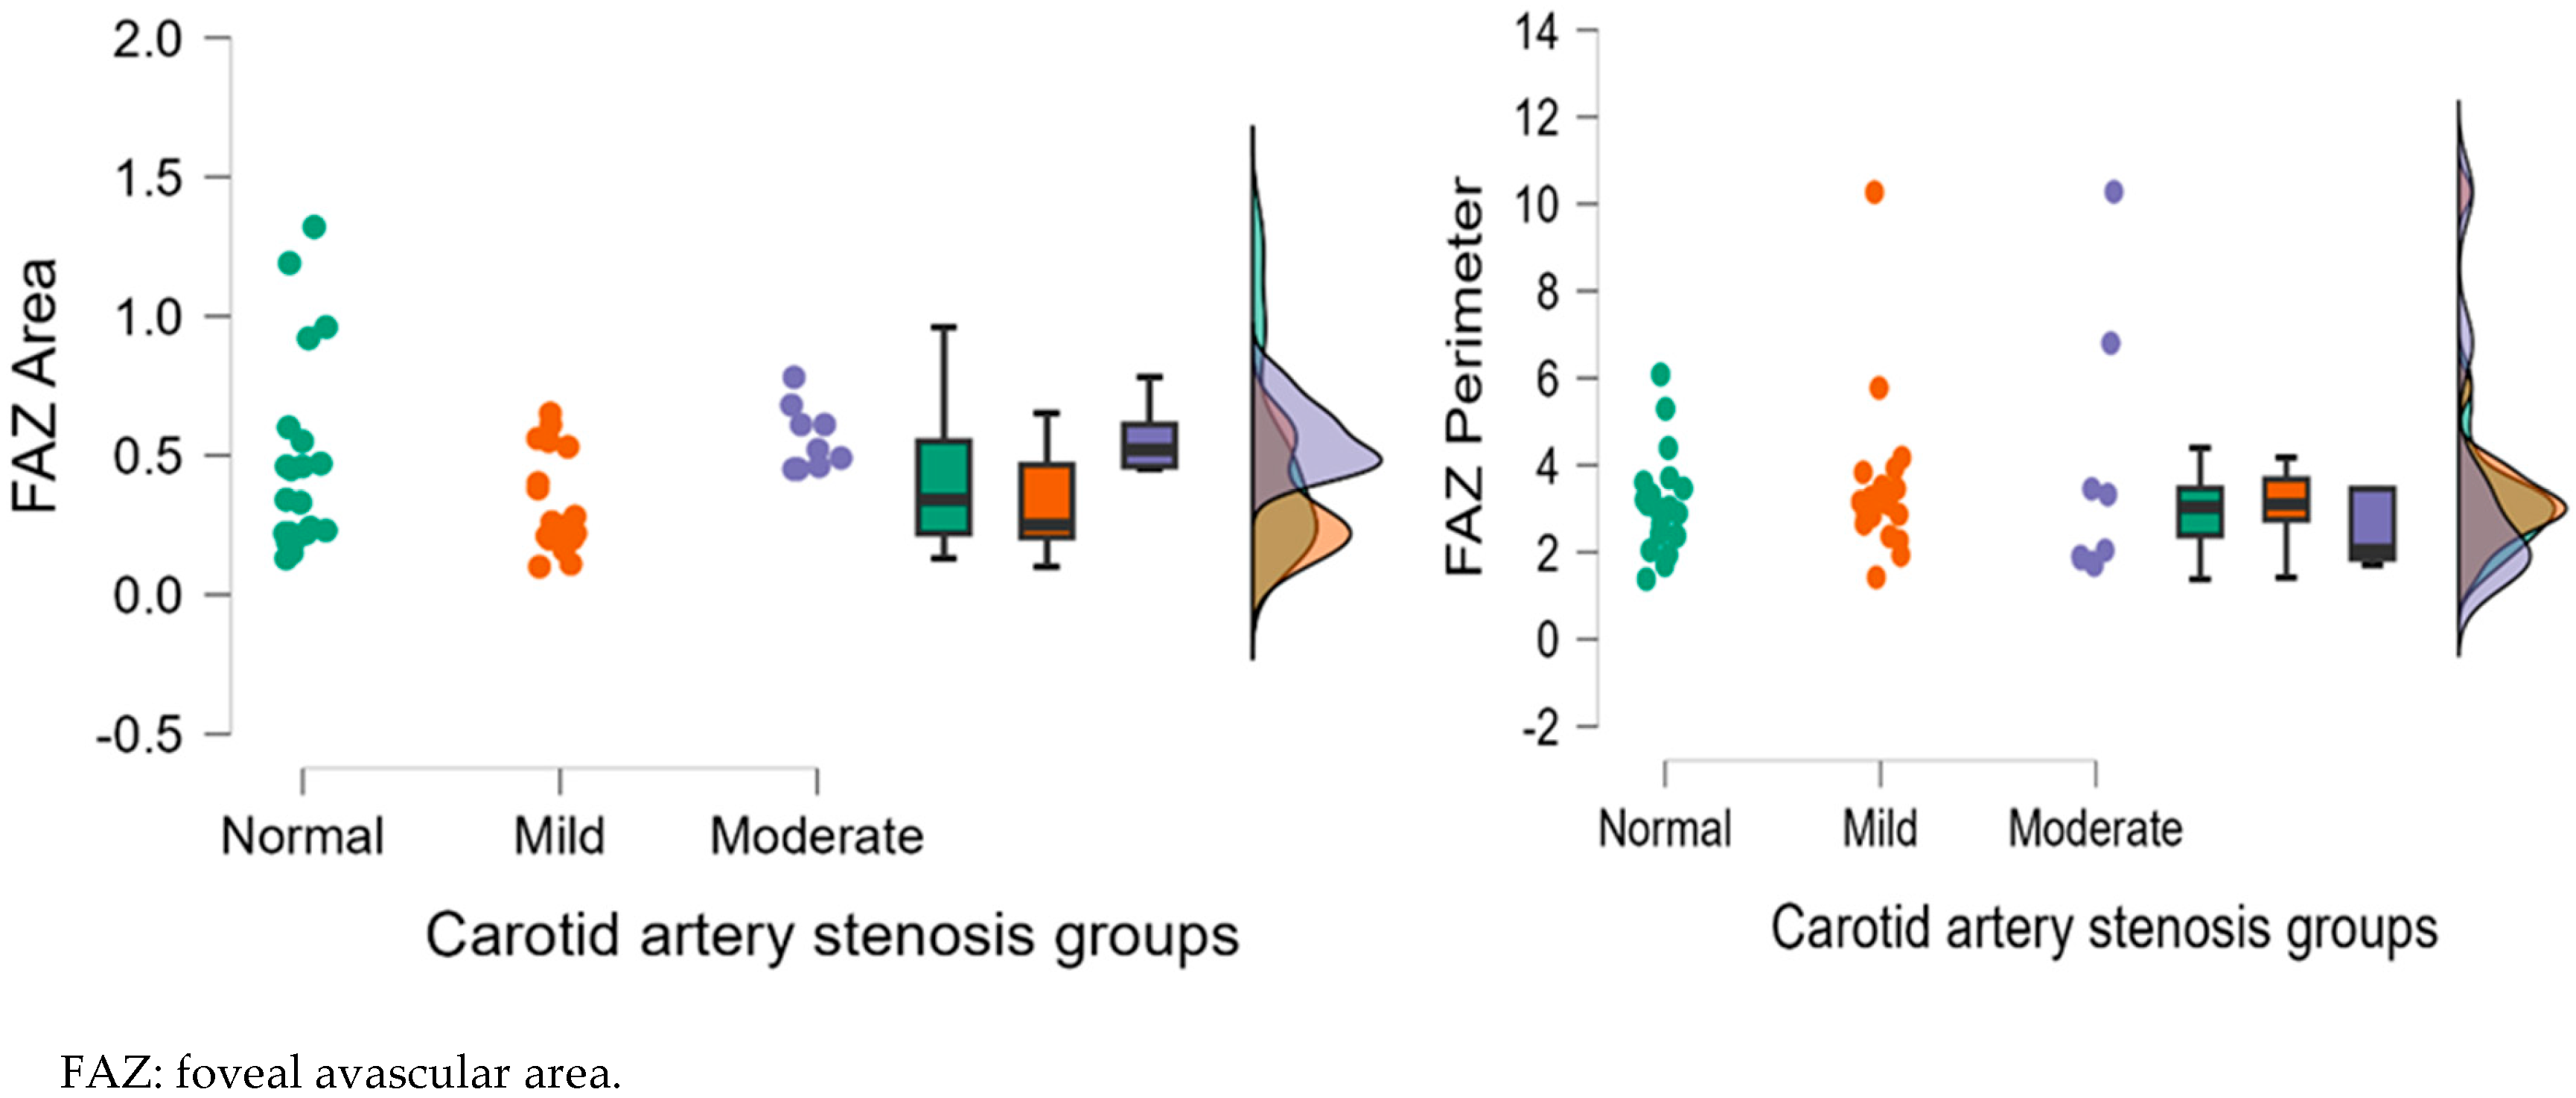
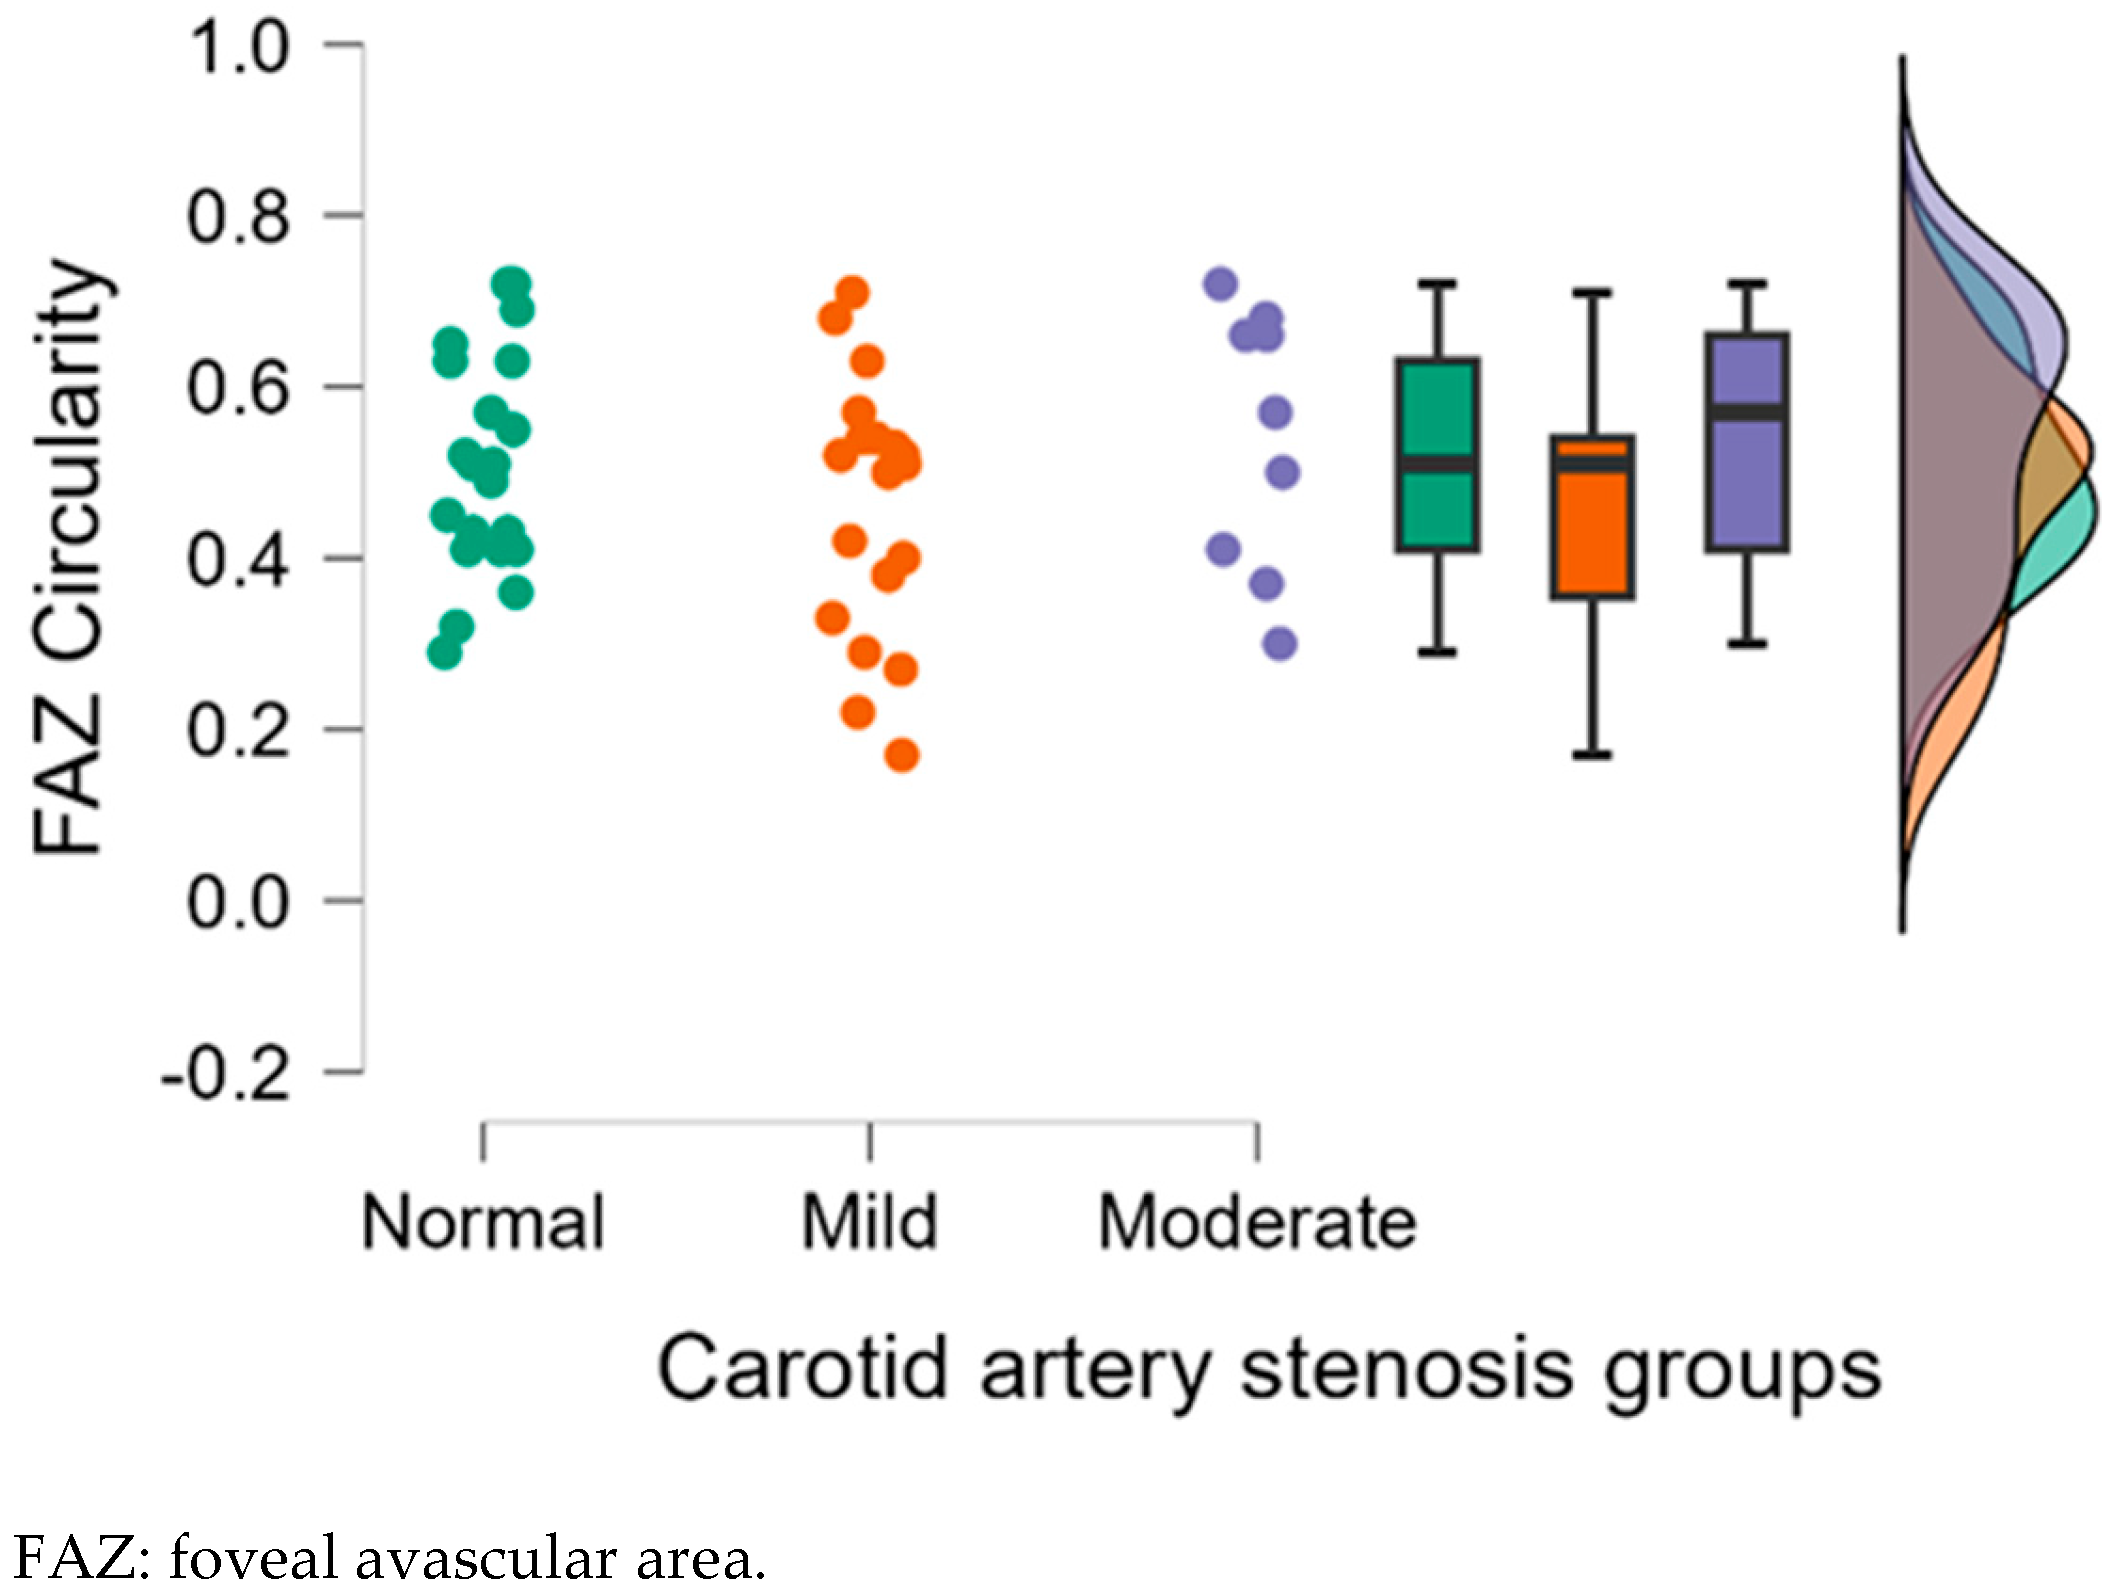
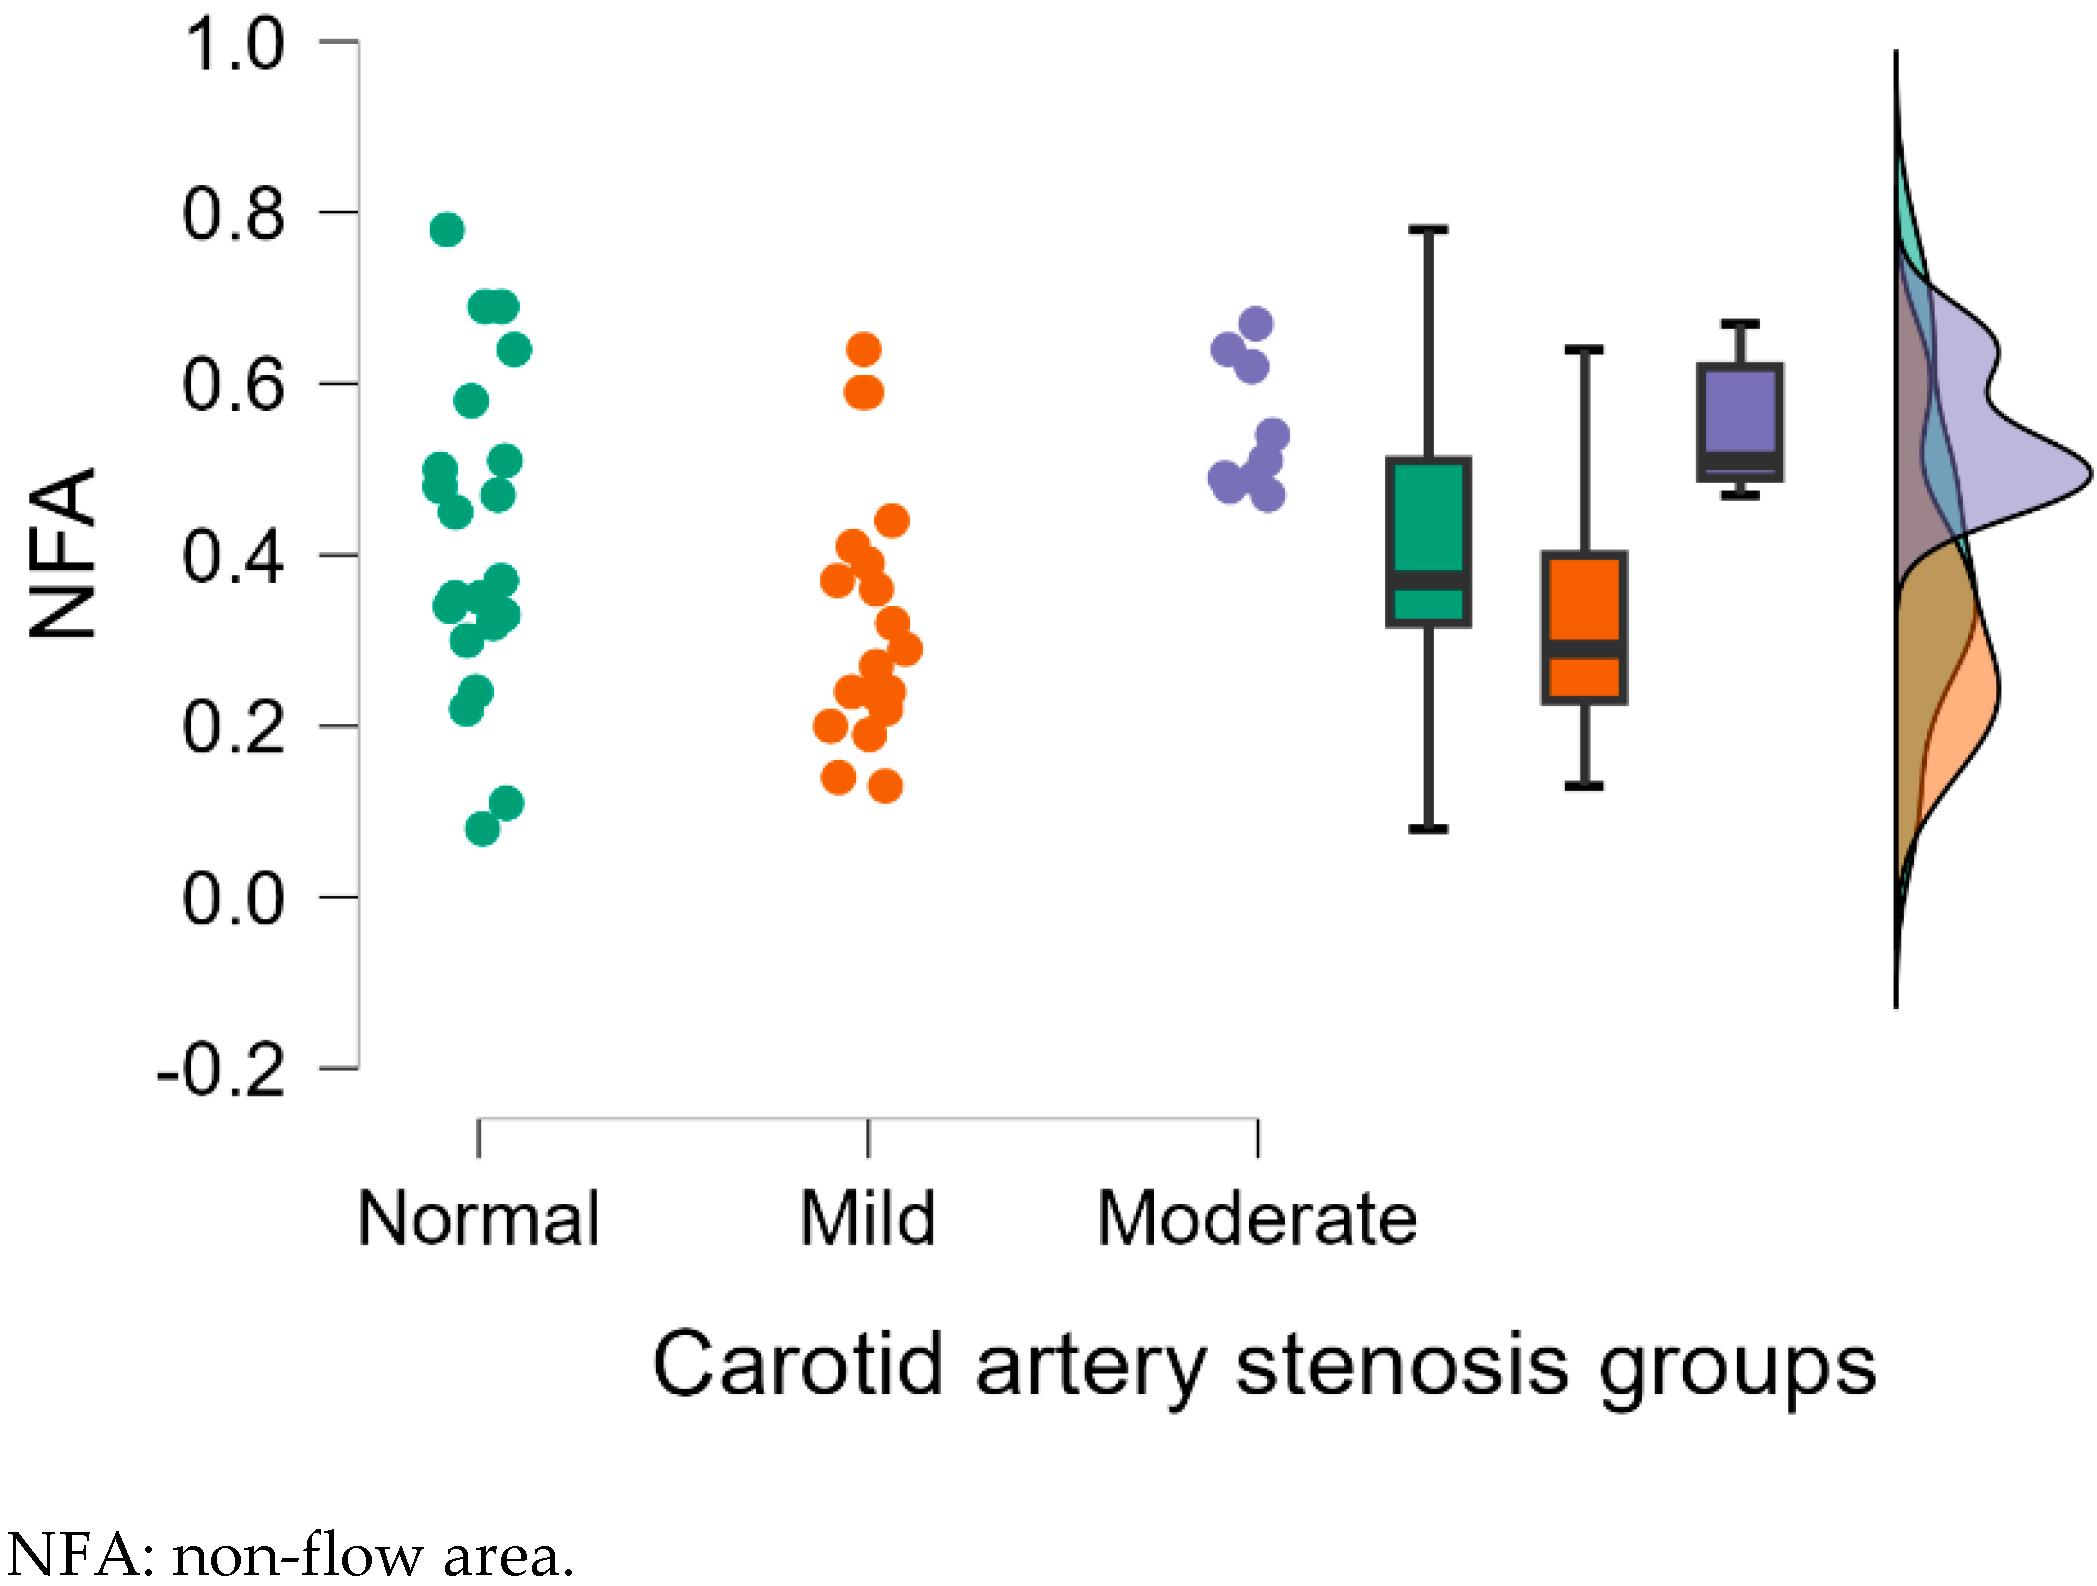
3.2.2. Analysis of Left Eye OCTA Parameters
3.2.3. OCTA Parameters and Correlations for Both Eyes
4. Discussion
5. Conclusions
Supplementary Materials
Author Contributions
Funding
Institutional Review Board Statement
Informed Consent Statement
Data Availability Statement
Acknowledgments
Conflicts of Interest
References
- Lee, C.W.; Cheng, H.C.; Chang, F.C.; Wang, A.G. Optical Coherence Tomography Angiography Evaluation of Retinal Microvasculature Before and After Carotid Angioplasty and Stenting. Sci. Rep. 2019, 9, 14755. [Google Scholar] [CrossRef] [PubMed]
- Liu, X.; Yang, B.; Tian, Y.; Ma, S.; Zhong, J. Quantitative assessment of retinal vessel density and thickness changes in internal Carotid artery stenosis patients using optical coherence tomography angiography. Photodiagn. Photodyn. Ther. 2022, 39, 103006. [Google Scholar] [CrossRef] [PubMed]
- Arnould, L.; Binquet, C.; Guenancia, C.; Alassane, S.; Kawasaki, R.; Daien, V.; Tzourio, C.; Kawasaki, Y.; Bourredjem, A.; Bron, A.; et al. Association between the retinal vascular network with Singapore “I” Vessel Assessment (SIVA) software, cardiovascular history and risk factors in the elderly: The Montrachet study, population-based study. PLoS ONE 2018, 13, e0194694. [Google Scholar] [CrossRef] [PubMed]
- Hughes, S.; Yang, H.; Chan-Ling, T. Vascularization of the human fetal retina: Roles of vasculogenesis and angiogenesis. Investig. Ophthalmol. Vis. Sci. 2000, 41, 1217–1228. [Google Scholar]
- Arnould, L.; Guenancia, C.; Gabrielle, P.-H.; Pitois, S.; Baudin, F.; Pommier, T.; Zeller, M.; Bron, A.; Creuzot-Garcher, C.; Cottin, Y. Influence of cardiac hemodynamic variables on retinal vessel density measurement on optical coherence tomography angiography in patients with myocardial infarction. J. Fr. D’ophtalmol. 2020, 43, 216–221. [Google Scholar] [CrossRef]
- Van Bentum, R.E.; Baniaamam, M.; Kinaci-Tas, B.; Van De Kreeke, J.A.; Kocyigit, M.; Tomassen, J.; den Braber, A.; Visser, P.J.; Ter Wee, M.M.; Serné, E.H.; et al. Microvascular changes of the retina in ankylosing spondylitis, and the association with cardiovascular disease—The eye for a heart study. Semin. Arthritis Rheum. 2020, 50, 1535–1541. [Google Scholar]
- AbuRahma, A.F.; Srivastava, M.; Stone, P.A.; Mousa, A.Y.; Jain, A.; Dean, L.S.; Keiffer, T.; Emmett, M. Critical appraisal of the Carotid Duplex Consensus criteria in the diagnosis of Carotid artery stenosis. J. Vasc. Surg. 2011, 53, 53–60, discussion 59–60. [Google Scholar] [CrossRef]
- Kwon, H.; Kim, H.K.; Kwon, S.U.; Lee, S.W.; Kim, M.J.; Park, J.W.; Noh, M.; Han, Y.; Kwon, T.W.; Cho, Y.P. Risk of major adverse cardiovascular events in subjects with asymptomatic mild Carotid artery stenosis. Sci. Rep. 2018, 8, 4700. [Google Scholar] [CrossRef]
- Frost, S.; Kanagasingam, Y.; Sohrabi, H.; Vignarajan, J.; Bourgeat, P.; Salvado, O.; Villemagne, V.; Rowe, C.C.; Lance Macaulay, S.; Szoeke, C.; et al. Retinal vascular biomarkers for early detection and monitoring of Alzheimer’s disease. Transl. Psychiatry 2013, 3, e233. [Google Scholar]
- Ikram, M.K.; Cheung, C.Y.; Lorenzi, M.; Klein, R.; Jones, T.L.; Wong, T.Y. Retinal Vascular Caliber as a Biomarker for Diabetes Microvascular Complications. Diabetes Care 2013, 36, 750–759. [Google Scholar] [CrossRef]
- Seidelmann, S.B.; Claggett, B.; Bravo, P.E.; Gupta, A.; Farhad, H.; Klein, B.E.; Klein, R.; Di Carli, M.; Solomon, S.D. Retinal Vessel Calibers in Predicting Long-Term Cardiovascular Outcomes. Circulation 2016, 134, 1328–1338. [Google Scholar] [CrossRef] [PubMed]
- Donati, S.; Maresca, A.M.; Cattaneo, J.; Grossi, A.; Mazzola, M.; Caprani, S.M.; Premoli, L.; Docchio, F.; Rizzoni, D.; Guasti, L.; et al. Optical coherence tomography angiography and arterial hypertension: A role in identifying subclinical microvascular damage? Eur. J. Ophthalmol. 2021, 31, 158–165. [Google Scholar] [CrossRef] [PubMed]
- Arthur, A.; Alexander, A.; Bal, S.; Sivadasan, A.; Aaron, S. Ophthalmic masquerades of the atherosclerotic Carotids. Indian J. Ophthalmol. 2014, 62, 472–476. [Google Scholar] [PubMed]
- Dagdelen, K.; Muz, O.E. Investigation of macular and optic nerve head structural changes using spectral domain optical coherence tomography in internal Carotid artery stenosis. Int. Ophthalmol. 2021, 41, 875–882. [Google Scholar] [CrossRef]
- Zhang, W.; Li, L.; Zou, D.; Ren, Q.; Zhang, Y.; Kang, L.; Gu, X.; Wu, H.; Zhang, S.; Zhu, R.; et al. Retinal vessel oxygen saturation in patients with unilateral internal Carotid artery stenosis: A pilot study. Acta Ophthalmol. 2021, 99, e13–e18. [Google Scholar]
- Hessler, H.; Zimmermann, H.; Oberwahrenbrock, T.; Kadas, E.M.; Mikolajczak, J.; Brandt, A.U.; Kauert, A.; Paul, F.; Schreiber, S.J. No Evidence for Retinal Damage Evolving from Reduced Retinal Blood Flow in Carotid Artery Disease. BioMed Res. Int. 2015, 2015, 604028. [Google Scholar] [CrossRef]
- Wang, H.; Li, H.; Zhang, X.; Qiu, L.; Wang, Z.; Wang, Y. Ocular Image and Haemodynamic Features Associated with Different Gradings of Ipsilateral Internal Carotid Artery Stenosis. J. Ophthalmol. 2017, 2017, 1842176. [Google Scholar] [CrossRef]
- Arrigo, A.; Aragona, E.; Capone, L.; Pierro, L.; Romano, F.; Bandello, F.; Parodi, M.B. Advanced Optical Coherence Tomography Angiography Analysis of Age-related Macular Degeneration Complicated by Onset of Unilateral Choroidal Neovascularization. Am. J. Ophthalmol. 2018, 195, 233–242. [Google Scholar] [CrossRef]
- Kashani, A.H.; Chen, C.L.; Gahm, J.K.; Zheng, F.; Richter, G.M.; Rosenfeld, P.J.; Shi, Y.; Wang, R.K. Optical coherence tomography angiography: A comprehensive review of current methods and clinical applications. Prog. Retin. Eye Res. 2017, 60, 66–100. [Google Scholar] [CrossRef]
- Wang, J.; Jiang, J.; Zhang, Y.; Qian, Y.W.; Zhang, J.F.; Wang, Z.L. Retinal and choroidal vascular changes in coronary heart disease: An optical coherence tomography angiography study. Biomed. Opt. Express 2019, 10, 1532–1544. [Google Scholar] [CrossRef]
- Couturier, A.; Mané, V.; Bonnin, S.; Erginay, A.; Massin, P.; Gaudric, A.; Tadayoni, R. Capillary Plexus Anomalies in Diabetic Retinopathy on Optical Coherence Tomography Angiography. Retina 2015, 35, 2384–2391. [Google Scholar] [CrossRef] [PubMed]
- Seknazi, D.; Coscas, F.; Sellam, A.; Rouimi, F.; Coscas, G.; Souied, E.H.; Glacet-Bernard, A. Optical coherence tomography angiography in retinal vein occlusion: Correlations between macular vascular density, visual acuity, and peripheral nonperfusion area on fluorescein angiography. Retina 2018, 38, 1562–1570. [Google Scholar] [CrossRef] [PubMed]
- Incekalan, T.K.; Taktakoğlu, D.; Şimdivar, G.H.N.; Öztürk, İ. Optical cohorence tomography angiography findings in Carotid artery stenosis. Int. Ophthalmol. 2022, 42, 2501–2509. [Google Scholar] [CrossRef]
- Lahme, L.; Marchiori, E.; Panuccio, G.; Nelis, P.; Schubert, F.; Mihailovic, N.; Torsello, G.; Eter, N.; Alnawaiseh, M. Changes in retinal flow density measured by optical coherence tomography angiography in patients with Carotid artery stenosis after Carotid endarterectomy. Sci. Rep. 2018, 8, 17161. [Google Scholar] [CrossRef] [PubMed]
- Pierro, L.; Arrigo, A.; De Crescenzo, M.; Aragona, E.; Chiesa, R.; Castellano, R.; Catenaccio, B.; Bandello, F. Quantitative Optical Coherence Tomography Angiography Detects Retinal Perfusion Changes in Carotid Artery Stenosis. Front. Neurosci. 2021, 15, 640666. [Google Scholar] [CrossRef]
- Rinaldi, M.; Chiosi, F.; Passaro, M.L.; Natale, F.; Riccardo, A.; D’Andrea, L.; Caiazza, M.; Rubino, M.; Monda, E.; Cennamo, G.; et al. Resistive index of central retinal artery, aortic arterial stiffness and OCTA correlated parameters in the early stage of fabry disease. Sci. Rep. 2024, 14, 24047. [Google Scholar]
- Steyerberg, E.W.; Pencina, M.J.; Lingsma, H.F.; Kattan, M.W.; Vickers, A.J.; Van Calster, B. Assessing the incremental value of diagnostic and prognostic markers: A review and illustration. Eur. J. Clin. Investig. 2012, 42, 216–228. [Google Scholar] [CrossRef]
- Cheung, C.Y.; Biousse, V.; Keane, P.A.; Schiffrin, E.L.; Wong, T.Y. Hypertensive eye disease. Nat. Rev. Dis. Primers 2022, 8, 14. [Google Scholar] [CrossRef]
- Takayama, K.; Kaneko, H.; Ito, Y.; Kataoka, K.; Iwase, T.; Yasuma, T.; Matsuura, T.; Tsunekawa, T.; Shimizu, H.; Suzumura, A.; et al. Novel Classification of Early-stage Systemic Hypertensive Changes in Human Retina Based on OCTA Measurement of Choriocapillaris. Sci. Rep. 2018, 8, 15163. [Google Scholar] [CrossRef]
- Williams, B.; Mancia, G.; Spiering, W.; Agabiti Rosei, E.; Azizi, M.; Burnier, M.; Clement, D.; Coca, A.; De Simone, G.; Dominiczak, A.; et al. 2018 Practice Guidelines for the management of arterial hypertension of the European Society of Hypertension and the European Society of Cardiology: ESH/ESC Task Force for the Management of Arterial Hypertension. J. Hypertens. 2018, 36, 2284–2309. [Google Scholar] [CrossRef]
- Williams, B.; Mancia, G.; Spiering, W.; Agabiti Rosei, E.; Azizi, M.; Burnier, M.; Clement, D.L.; Coca, A.; de Simone, G.; Dominiczak, A.; et al. 2018 ESC/ESH Guidelines for the management of arterial hypertension: The Task Force for the management of arterial hypertension of the European Society of Cardiology and the European Society of Hypertension: The Task Force for the management of arterial hypertension of the European Society of Cardiology and the European Society of Hypertension. J. Hypertens. 2018, 36, 1953–2041. [Google Scholar] [PubMed]
- Alastruey, J.; Parker, K.H.; Peiró, J.; Byrd, S.M.; Sherwin, S.J. Modelling the circle of Willis to assess the effects of anatomical variations and occlusions on cerebral flows. J. Biomech. 2007, 40, 1794–1805. [Google Scholar] [CrossRef] [PubMed]
- Liu, H.; Pan, F.; Lei, X.; Hui, J.; Gong, R.; Feng, J.; Zheng, D. Effect of intracranial pressure on photoplethysmographic waveform in different cerebral perfusion territories: A computational study. Front. Physiol. 2023, 14, 1085871. [Google Scholar] [CrossRef]
- Cheung, N.; Bluemke, D.A.; Klein, R.; Sharrett, A.R.; Islam, F.A.; Cotch, M.F.; Klein, B.E.; Criqui, M.H.; Wong, T.Y. Retinal arteriolar narrowing and left ventricular remodeling: The multi-ethnic study of atherosclerosis. J. Am. Coll. Cardiol. 2007, 50, 48–55. [Google Scholar] [CrossRef]
- Cheung, N.; Sharrett, A.R.; Klein, R.; Criqui, M.H.; Islam, F.A.; Macura, K.J.; Cotch, M.F.; Klein, B.E.; Wong, T.Y. Aortic distensibility and retinal arteriolar narrowing: The multi-ethnic study of atherosclerosis. Hypertension 2007, 50, 617–622. [Google Scholar] [CrossRef]
- Mendrinos, E.; Machinis, T.G.; Pournaras, C.J. Ocular Ischemic Syndrome. Surv. Ophthalmol. 2010, 55, 2–34. [Google Scholar] [CrossRef]
- Wu, D.H.; Wu, L.T.; Wang, Y.L.; Wang, J.L. Changes of retinal structure and function in patients with internal Carotid artery stenosis. BMC Ophthalmol. 2022, 22, 123. [Google Scholar] [CrossRef]
- Chiosi, F.; Campagna, G.; Rinaldi, M.; Manzi, G.; dell’Omo, R.; Fiorentino, G.; Toro, M.; Tranfa, F.; D’Andrea, L.; Rejdak, M.; et al. Optical Coherence Tomography Angiography Analysis of Vessel Density Indices in Early Post-COVID-19 Patients. Front. Med. 2022, 9, 927121. [Google Scholar] [CrossRef]
- Qaja, E.; Tadi, P.; Kariyanna, P.T. Symptomatic Carotid Artery Stenosis; StatPearls: Treasure Island, FL, USA, 2025. [Google Scholar]
- Sayin, N.; Kara, N.; Uzun, F.; Akturk, I.F. A quantitative evaluation of the posterior segment of the eye using spectral-domain optical coherence tomography in Carotid artery stenosis: A pilot study. Ophthalmic Surg. Lasers Imaging Retin. 2015, 46, 180–185. [Google Scholar] [CrossRef]
- Hackam, D.G. Optimal Medical Management of Asymptomatic Carotid Stenosis. Stroke 2021, 52, 2191–2198. [Google Scholar] [CrossRef] [PubMed]
- Meschia, J.F.; Bushnell, C.; Boden-Albala, B.; Braun, L.T.; Bravata, D.M.; Chaturvedi, S.; Creager, M.A.; Eckel, R.H.; Elkind, M.S.; Fornage, M.; et al. Guidelines for the primary prevention of stroke: A statement for healthcare professionals from the American Heart Association/American Stroke Association. Stroke 2014, 45, 3754–3832. [Google Scholar]
- Ma, J.; Gelie, N.; Zhu, M.; Ma, X.; Han, C. Quantifying ocular microcirculation in hypertension patients with Carotid artery stenosis. Front. Neurosci. 2024, 18, 1361413. [Google Scholar] [CrossRef] [PubMed]
- Baber, U.; Mehran, R.; Sartori, S.; Schoos, M.M.; Sillesen, H.; Muntendam, P.; Garcia, M.J.; Gregson, J.; Pocock, S.; Falk, E.; et al. Prevalence, impact, and predictive value of detecting subclinical coronary and carotid atherosclerosis in asymptomatic adults: The BioImage study. J. Am. Coll. Cardiol. 2015, 65, 1065–1074. [Google Scholar] [CrossRef]
- de Weerd, M.; Greving, J.P.; de Jong, A.W.; Buskens, E.; Bots, M.L. Prevalence of asymptomatic Carotid artery stenosis according to age and sex: Systematic review and metaregression analysis. Stroke 2009, 40, 1105–1113. [Google Scholar] [CrossRef]

| Demographic Parameters | Carotid Artery Stenosis Groups | p-Value * | ||
|---|---|---|---|---|
| Normal (N = 21) | Mild (N = 19) | Moderate (N = 9) | ||
| Gender | 0.614 | |||
| Female | 10 (47.6%) | 7 (36.8%) | 5 (55.6%) | |
| Male | 11 (52.4%) | 12 (63.2%) | 4 (44.4%) | |
| Smoker? | 0.002 * | |||
| YES | 4 (19.1%) | 7 (36.8%) | 8 (88.9%) | |
| NO | 17 (80.9%) | 12 (63.2%) | 1 (1.1%) | |
| Age ** (years) | 54.4 ± 10.0 | 60.9 ± 8.2 | 58.2 ± 13.1 | 0.057 |
| Right Eye OCTA Parameters | Carotid Artery Stenosis Groups | Kruskal–Wallis Test | ||||
|---|---|---|---|---|---|---|
| Dunn’s Post Hoc Comparisons | ||||||
| Normal (n = 21) | Mild (n = 19) | Moderate (n = 9) | Normal-Mild p-Value | Normal-Moderate p-Value | Mild-Moderate p-Value | |
| M ± SD | M ± SD | M ± SD | ||||
| NFA | 0.36 ± 0.15 | 0.39 ± 0.22 | 0.64 ± 0.34 | 0.754 | 0.004 ** | 0.011 * |
| FAZ area | 0.45 ± 0.41 | 0.82 ± 0.85 | 0.75 ± 0.28 | 0.191 | 0.016 * | 0.178 |
| FAZ Perimeter | 3.31 ± 1.84 | 4.46 ± 3.07 | 3.11 ± 1.64 | 0.447 | 0.820 | 0.413 |
| FAZ Circularity | 0.50 ± 0.15 | 0.38 ± 0.15 | 0.56 ± 0.13 | 0.025 * | 0.325 | 0.006 ** |
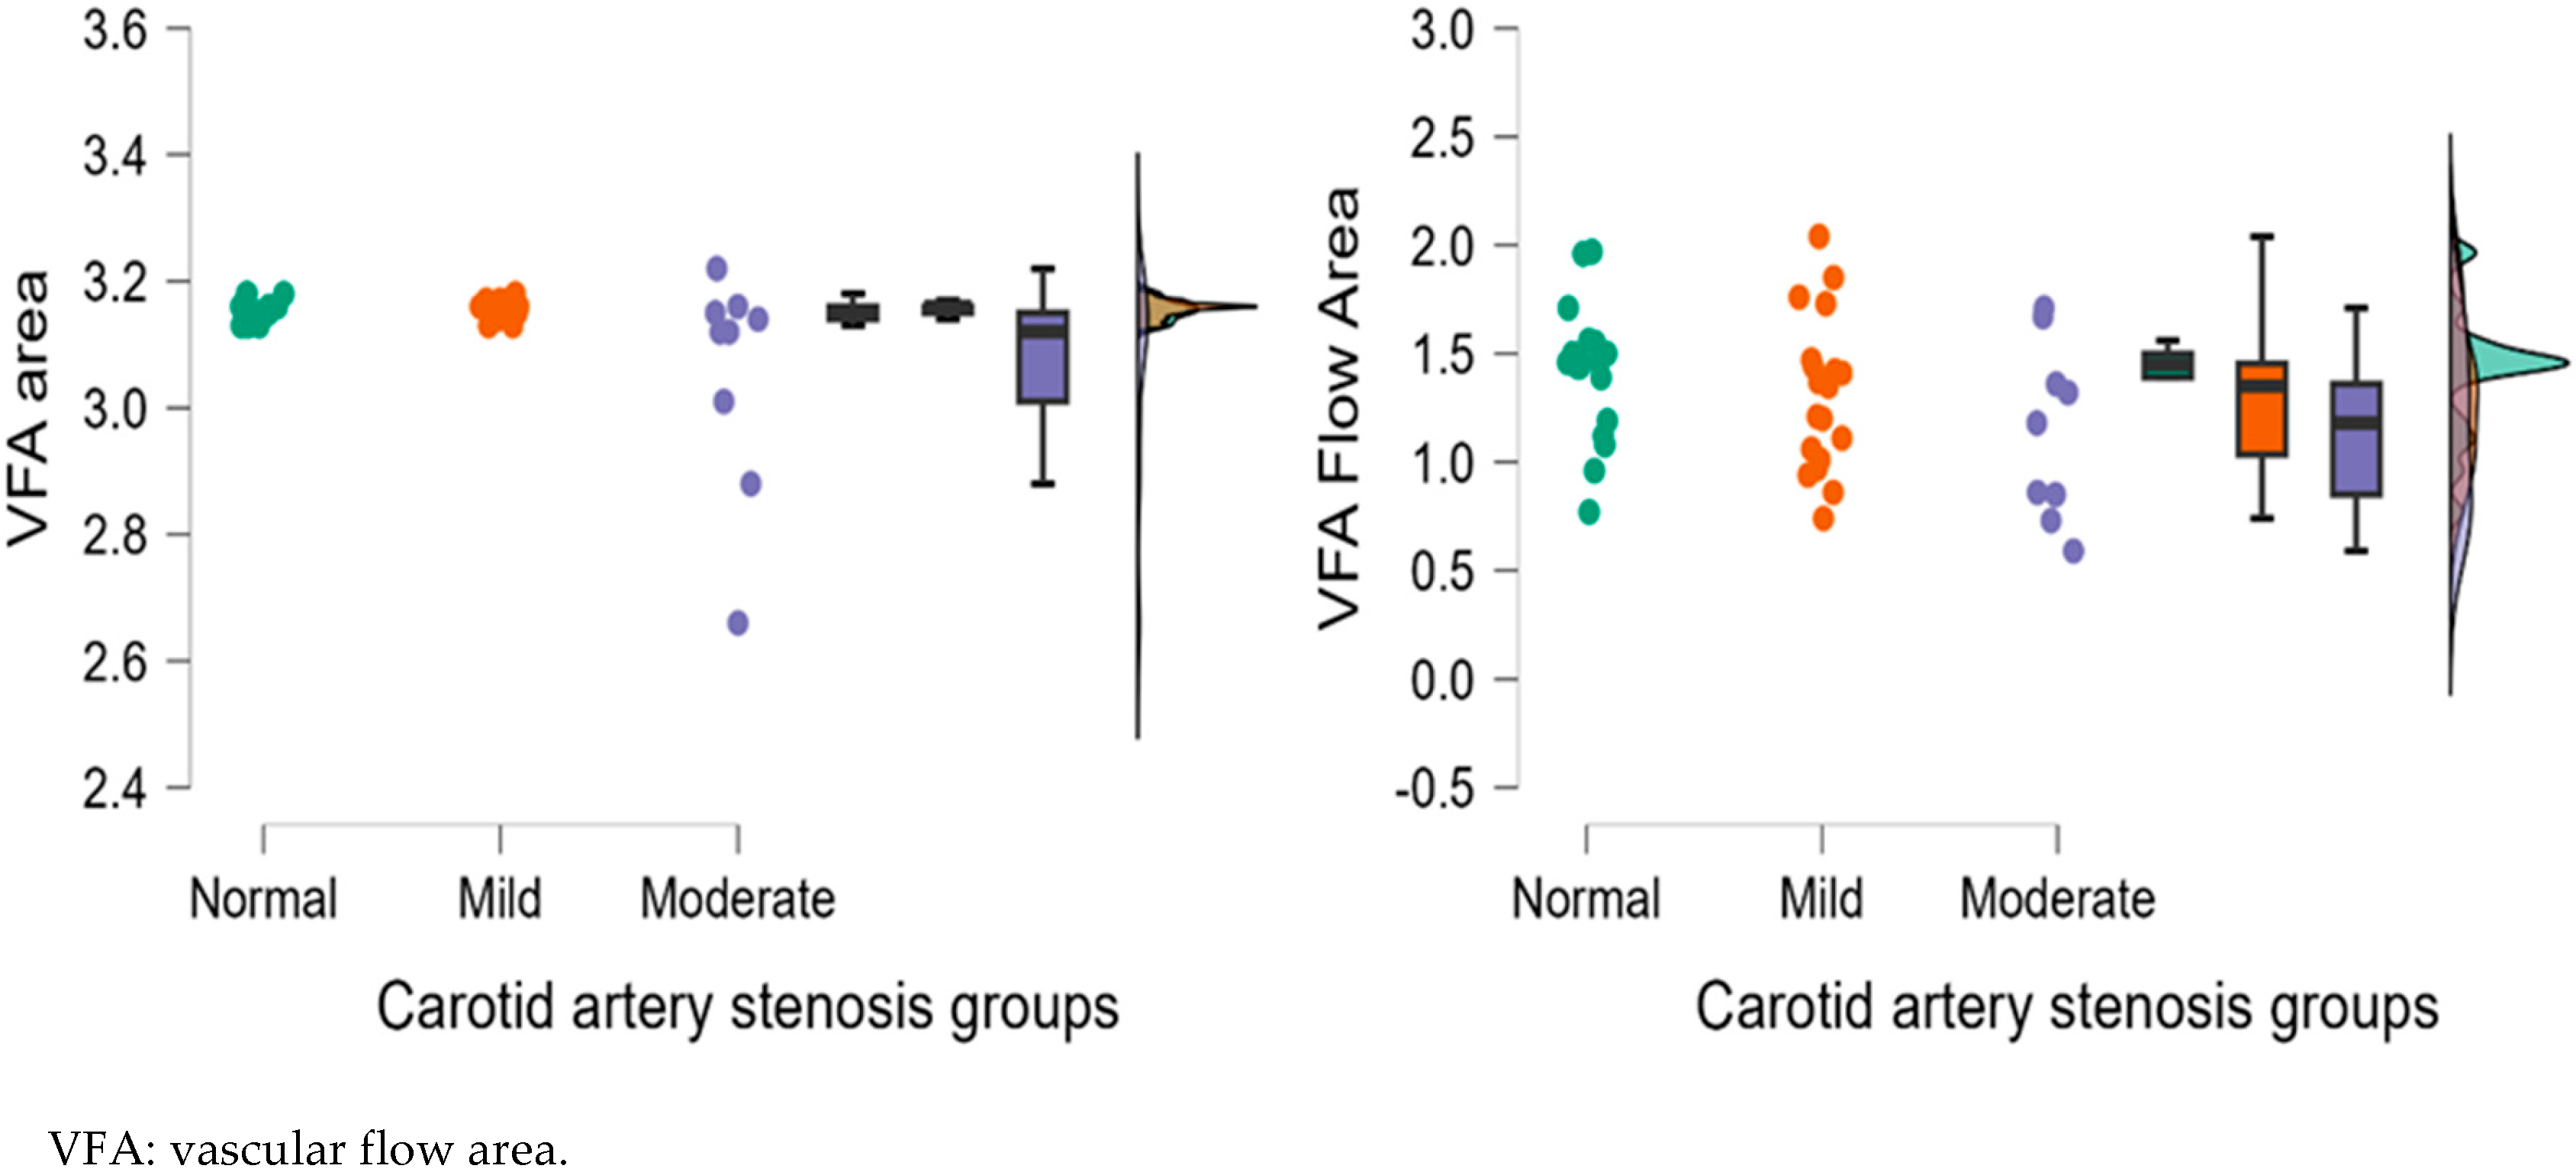
| VFA | 3.15 ± 0.01 | 3.15 ± 0.02 | 3.09 ± 0.09 | 0.772 | 0.037 * | 0.068 |
| VFA | 1.46 ± 0.34 | 1.41 ± 0.40 | 1.43 ± 0.51 | 0.729 | 0.641 | 0.852 |
| Left Eye OCTA Parameters | Carotid Artery Stenosis Groups | Kruskal–Wallis Test | ||||
|---|---|---|---|---|---|---|
| Dunn’s Post Hoc Comparisons | ||||||
| Normal (n = 21) | Mild (n = 19) | Moderate (n = 9) | Normal-Mild p-Value | Normal-Moderate p-Value | Mild-Moderate p-Value | |
| M ± SD | M ± SD | M ± SD | ||||
| NFA | 0.42 ± 0.19 | 0.33 ± 0.15 | 0.55 ± 0.08 | 0.101 | 0.045 * | 0.001 * |
| FAZ Area | 0.47 ± 0.35 | 0.32 ± 0.18 | 0.56 ± 0.12 | 0.298 | 0.054 | 0.007 * |
| FAZ Perimeter | 3.08 ± 1.13 | 3.50 ± 1.89 | 3.68 ± 2.96 | 0.565 | 0.626 | 0.352 |
| FAZ Circularity | 0.51 ± 0.13 | 0.46 ± 0.15 | 0.54 ± 0.15 | 0.379 | 0.572 | 0.213 |
| VFA | 3.15 ± 0.02 | 3.16 ± 0.01 | 3.05 ± 0.18 | 0.554 | 0.041 * | 0.013 * |
| VFA | 1.42 ± 0.29 | 1.31 ± 0.36 | 1.14 ± 0.41 | 0.161 | 0.029 * | 0.294 |
| Right Carotid Doppler Parameters–Right Eye OCTA Parameters | Pearson | Spearman | ||||
|---|---|---|---|---|---|---|
| r | p | rho | p | |||
| ICA PSV | - | NFA | 0.180 | 0.216 | 0.068 | 0.641 |
| ICA PSV | - | VFA | −0.260 | 0.072 | −0.286 * | 0.046 |
| ICA EDV | - | NFA | 0.365 * | 0.010 | −0.089 | 0.543 |
| ICA EDV | - | VFA | −0.086 | 0.555 | 0.052 | 0.723 |
| ECA PSV | - | NFA | 0.219 | 0.131 | 0.130 | 0.373 |
| ECA PSV | - | VFA | −0.288 * | 0.045 | −0.317 * | 0.026 |
| ECA EDV | - | NFA | −0.198 | 0.173 | −0.15 | 0.305 |
| ECA EDV | - | VFA | −0.057 | 0.697 | −0.058 | 0.692 |
| CCA PSV | - | NFA | −0.256 | 0.076 | −0.354 * | 0.012 |
| CCA PSV | - | VFA | 0.112 | 0.443 | 0.067 | 0.647 |
| CCA EDV | - | NFA | −0.262 | 0.069 | −0.292 * | 0.042 |
| CCA EDV | - | VFA | 0.108 | 0.461 | −0.053 | 0.718 |
| VA PSV | - | NFA | 0.195 | 0.179 | 0.074 | 0.612 |
| VA PSV | - | VFA | −0.327 * | 0.022 | −0.379 ** | 0.007 |
| VA EDV | - | NFA | −0.087 | 0.550 | −0.190 | 0.192 |
| VA EDV | - | VFA | −0.031 | 0.831 | −0.063 | 0.669 |
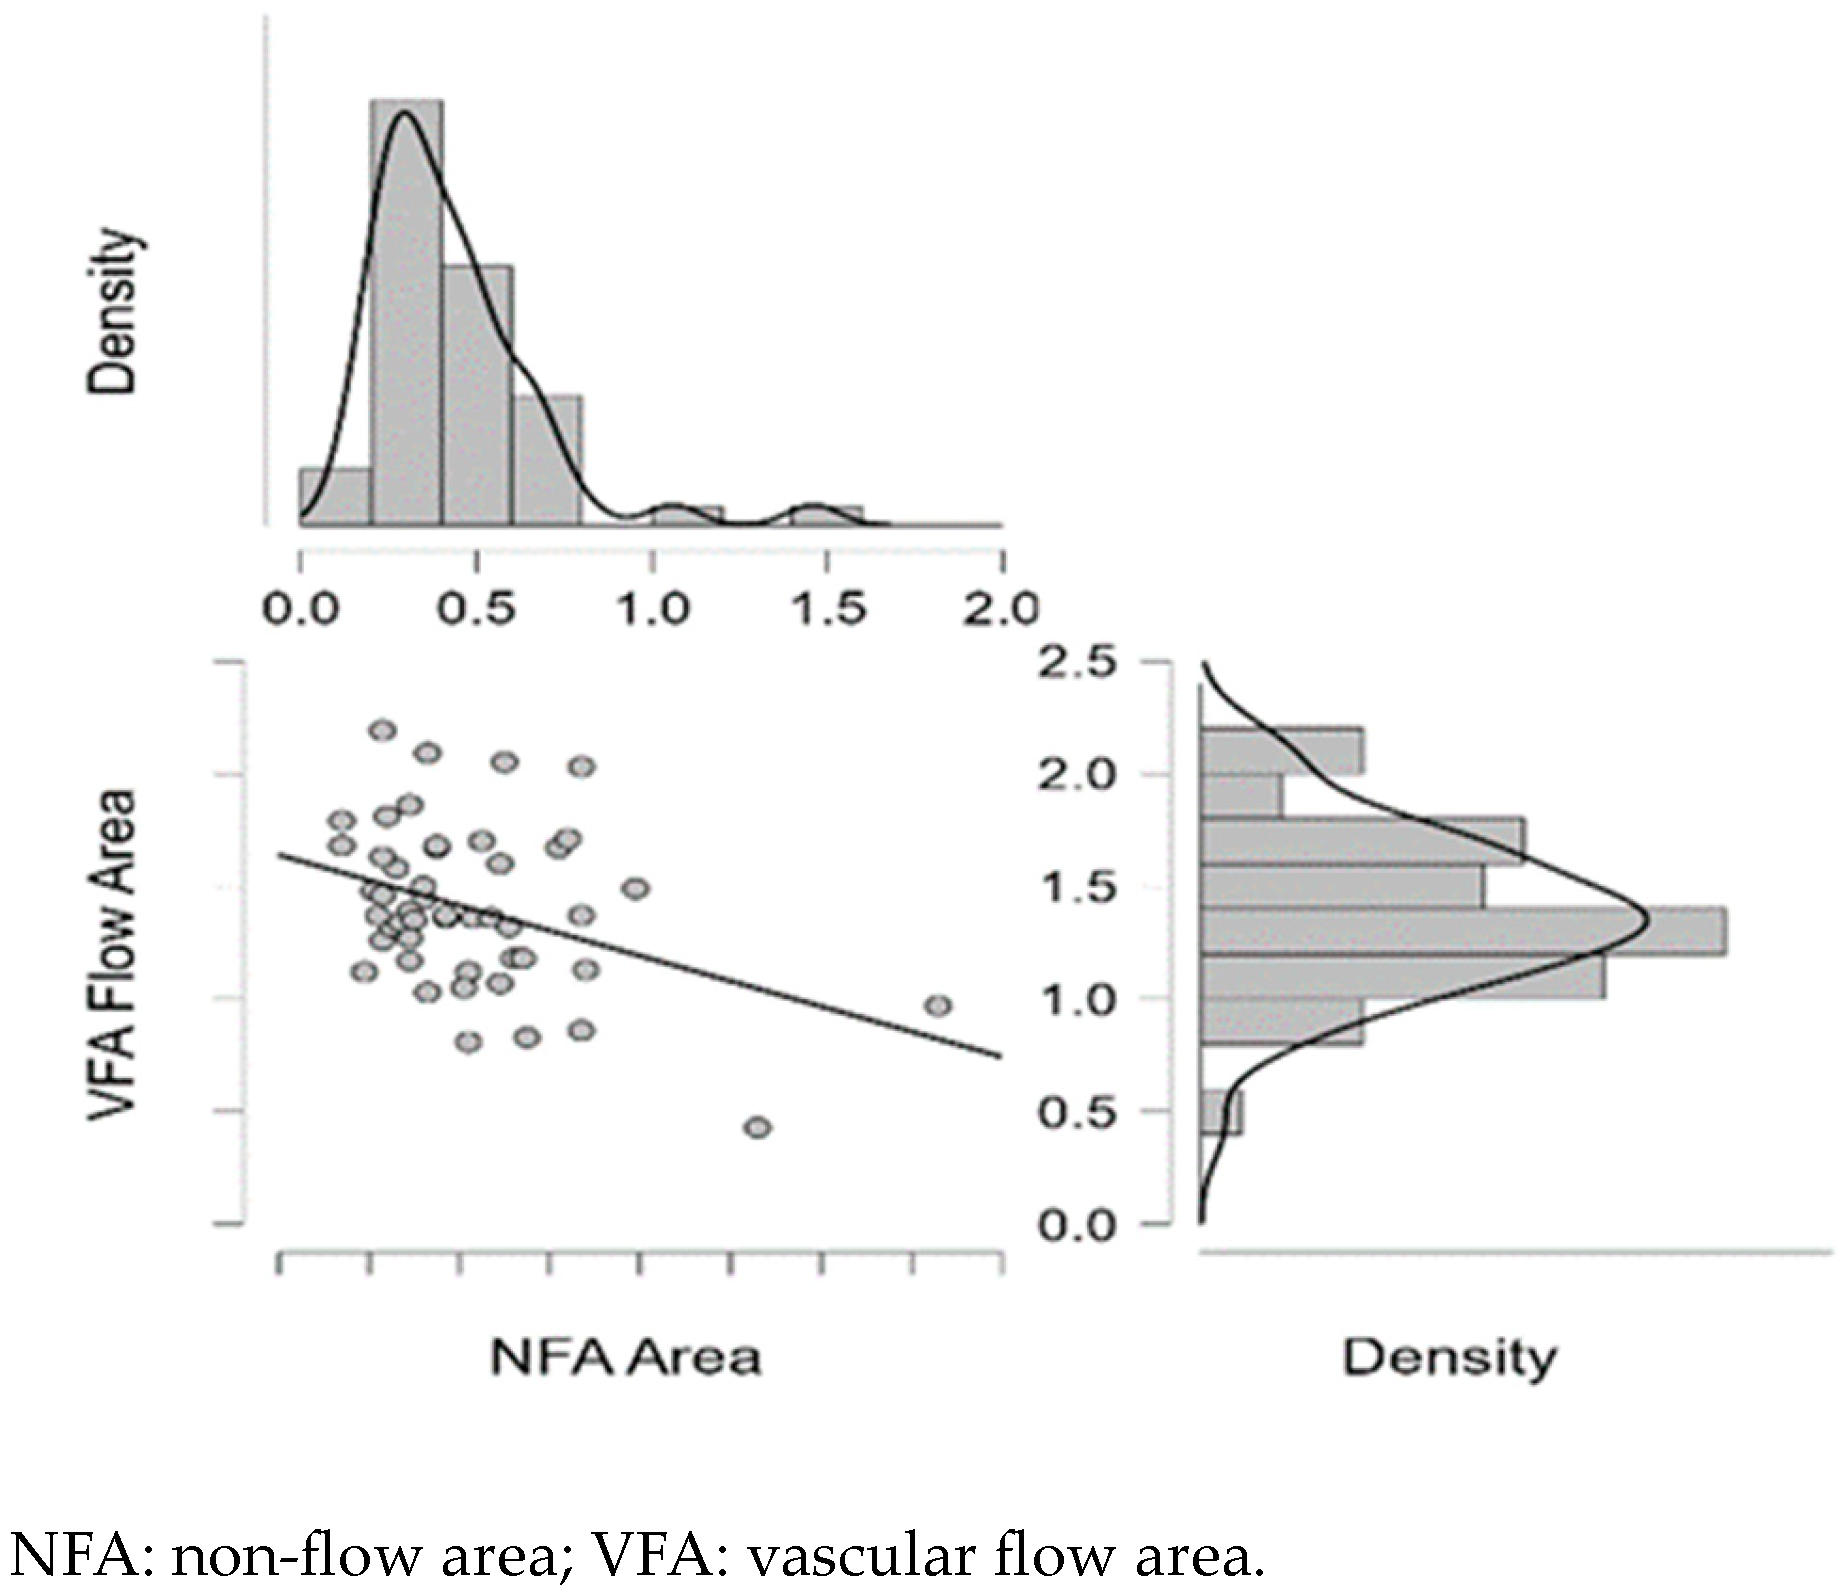
| NFA | - | VFA | −0.374 ** | 0.008 | −0.288 * | 0.045 |
| Left Carotid Doppler Parameters–Left Eye OCTA Parameters | Pearson | Spearman | ||||
|---|---|---|---|---|---|---|
| r | p | rho | p | |||
| ICA PSV | - | NFA | −0.351 * | 0.013 | −0.313 * | 0.028 |
| ICA PSV | - | VFA | −0.227 | 0.117 | −0.140 | 0.336 |
| ICA EDV | - | NFA | 0.019 | 0.899 | −0.003 | 0.983 |
| ICA EDV | - | VFA | −0.421 ** | 0.003 | −0.314 * | 0.028 |
| ECA PSV | - | NFA | −0.412 ** | 0.003 | −0.457 *** | 0.001 |
| ECA PSV | - | VFA | 0.007 | 0.962 | 0.041 | 0.778 |
| ECA EDV | - | NFA | −0.064 | 0.664 | −0.080 | 0.585 |
| ECA EDV | - | VFA | −0.008 | 0.954 | 0.030 | 0.836 |
| CCA PSV | - | NFA | −0.288 * | 0.045 | −0.339 * | 0.017 |
| CCA PSV | - | VFA | 0.094 | 0.521 | 0.109 | 0.455 |
| CCA EDV | - | NFA | −0.404 ** | 0.004 | −0.417 * | 0.003 |
| CCA EDV | - | VFA | 0.164 | 0.261 | 0.092 | 0.530 |
| VA PSV | - | NFA | −0.043 | 0.770 | −0.039 | 0.789 |
| VA PSV | - | VFA | −0.169 | 0.246 | −0.179 | 0.218 |
| VA EDV | - | NFA | −0.004 | 0.978 | −0.037 | 0.801 |
| VA EDV | - | VFA | −0.033 | 0.822 | −0.033 | 0.821 |
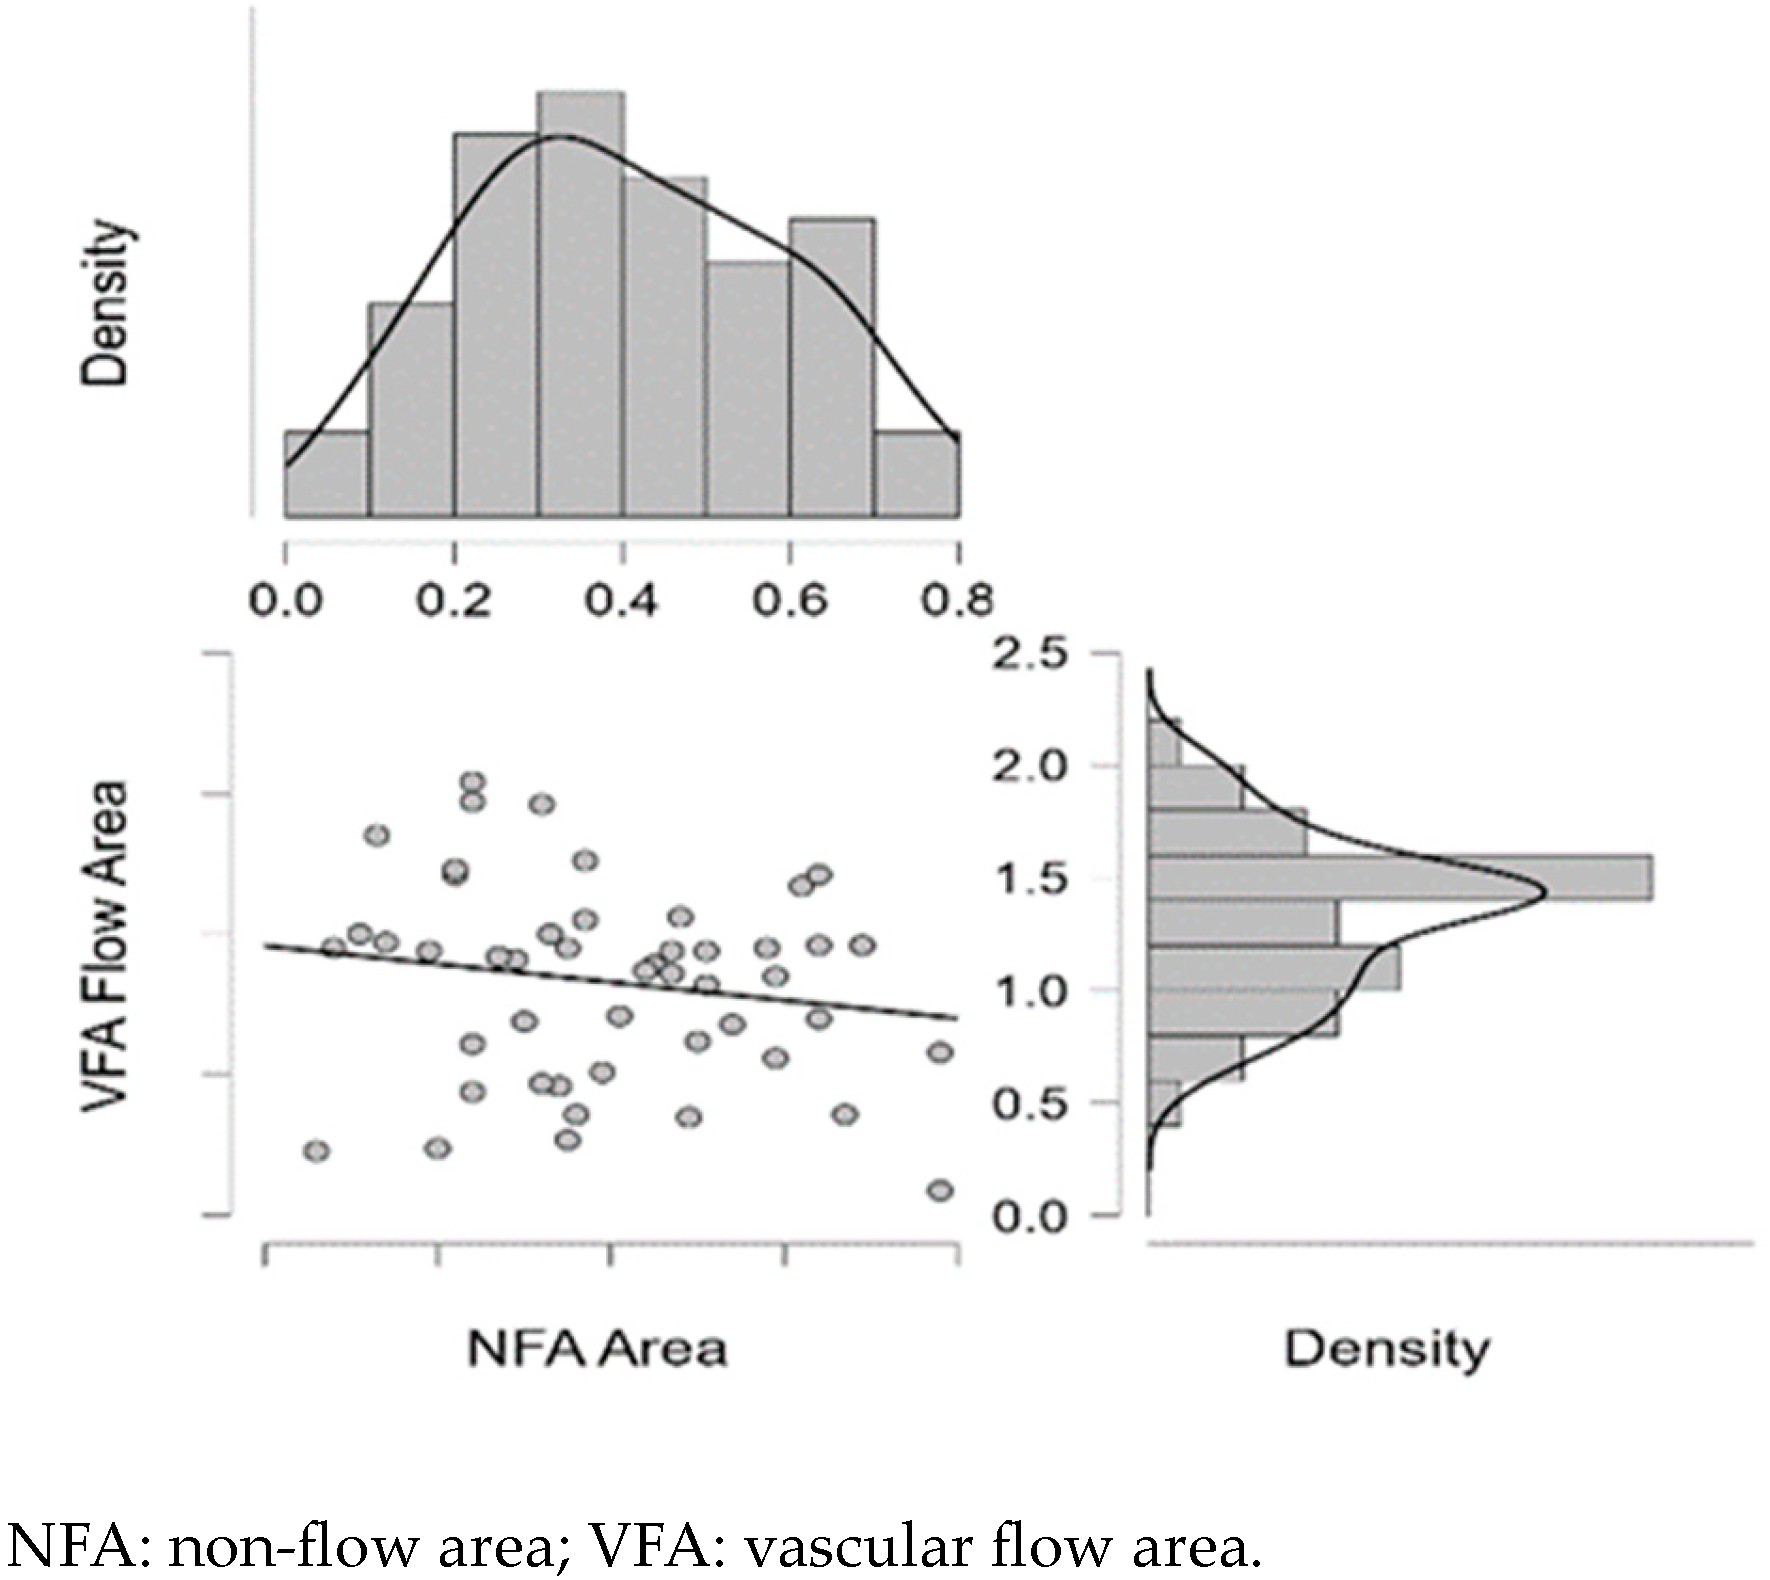
| NFA | - | VFA | −0.176 | 0.228 | −0.169 | 0.245 |
| Shapiro–Wilk | p |
|---|---|
| 0.928 | <0.001 |
| Shapiro–Wilk | p |
|---|---|
| 0.958 | <0.001 |
Disclaimer/Publisher’s Note: The statements, opinions and data contained in all publications are solely those of the individual author(s) and contributor(s) and not of MDPI and/or the editor(s). MDPI and/or the editor(s) disclaim responsibility for any injury to people or property resulting from any ideas, methods, instructions or products referred to in the content. |
© 2025 by the authors. Licensee MDPI, Basel, Switzerland. This article is an open access article distributed under the terms and conditions of the Creative Commons Attribution (CC BY) license (https://creativecommons.org/licenses/by/4.0/).
Share and Cite
Barca, I.C.; Potop, V.; Arama, S.S. The Relevance of Optical Coherence Tomography Angiography in Screening and Monitoring Hypertensive Patients with Carotid Artery Stenosis. Diagnostics 2025, 15, 1393. https://doi.org/10.3390/diagnostics15111393
Barca IC, Potop V, Arama SS. The Relevance of Optical Coherence Tomography Angiography in Screening and Monitoring Hypertensive Patients with Carotid Artery Stenosis. Diagnostics. 2025; 15(11):1393. https://doi.org/10.3390/diagnostics15111393
Chicago/Turabian StyleBarca, Irina Cristina, Vasile Potop, and Stefan Sorin Arama. 2025. "The Relevance of Optical Coherence Tomography Angiography in Screening and Monitoring Hypertensive Patients with Carotid Artery Stenosis" Diagnostics 15, no. 11: 1393. https://doi.org/10.3390/diagnostics15111393
APA StyleBarca, I. C., Potop, V., & Arama, S. S. (2025). The Relevance of Optical Coherence Tomography Angiography in Screening and Monitoring Hypertensive Patients with Carotid Artery Stenosis. Diagnostics, 15(11), 1393. https://doi.org/10.3390/diagnostics15111393