
Serum-Based Assessment of Alopecia Areata Response to Treatment Using ATR-FTIR Spectroscopy

 , ,
, ,  and
and
Abstract
1. Introduction
2. Materials and Methods
2.1. Study Population and Sample Collection
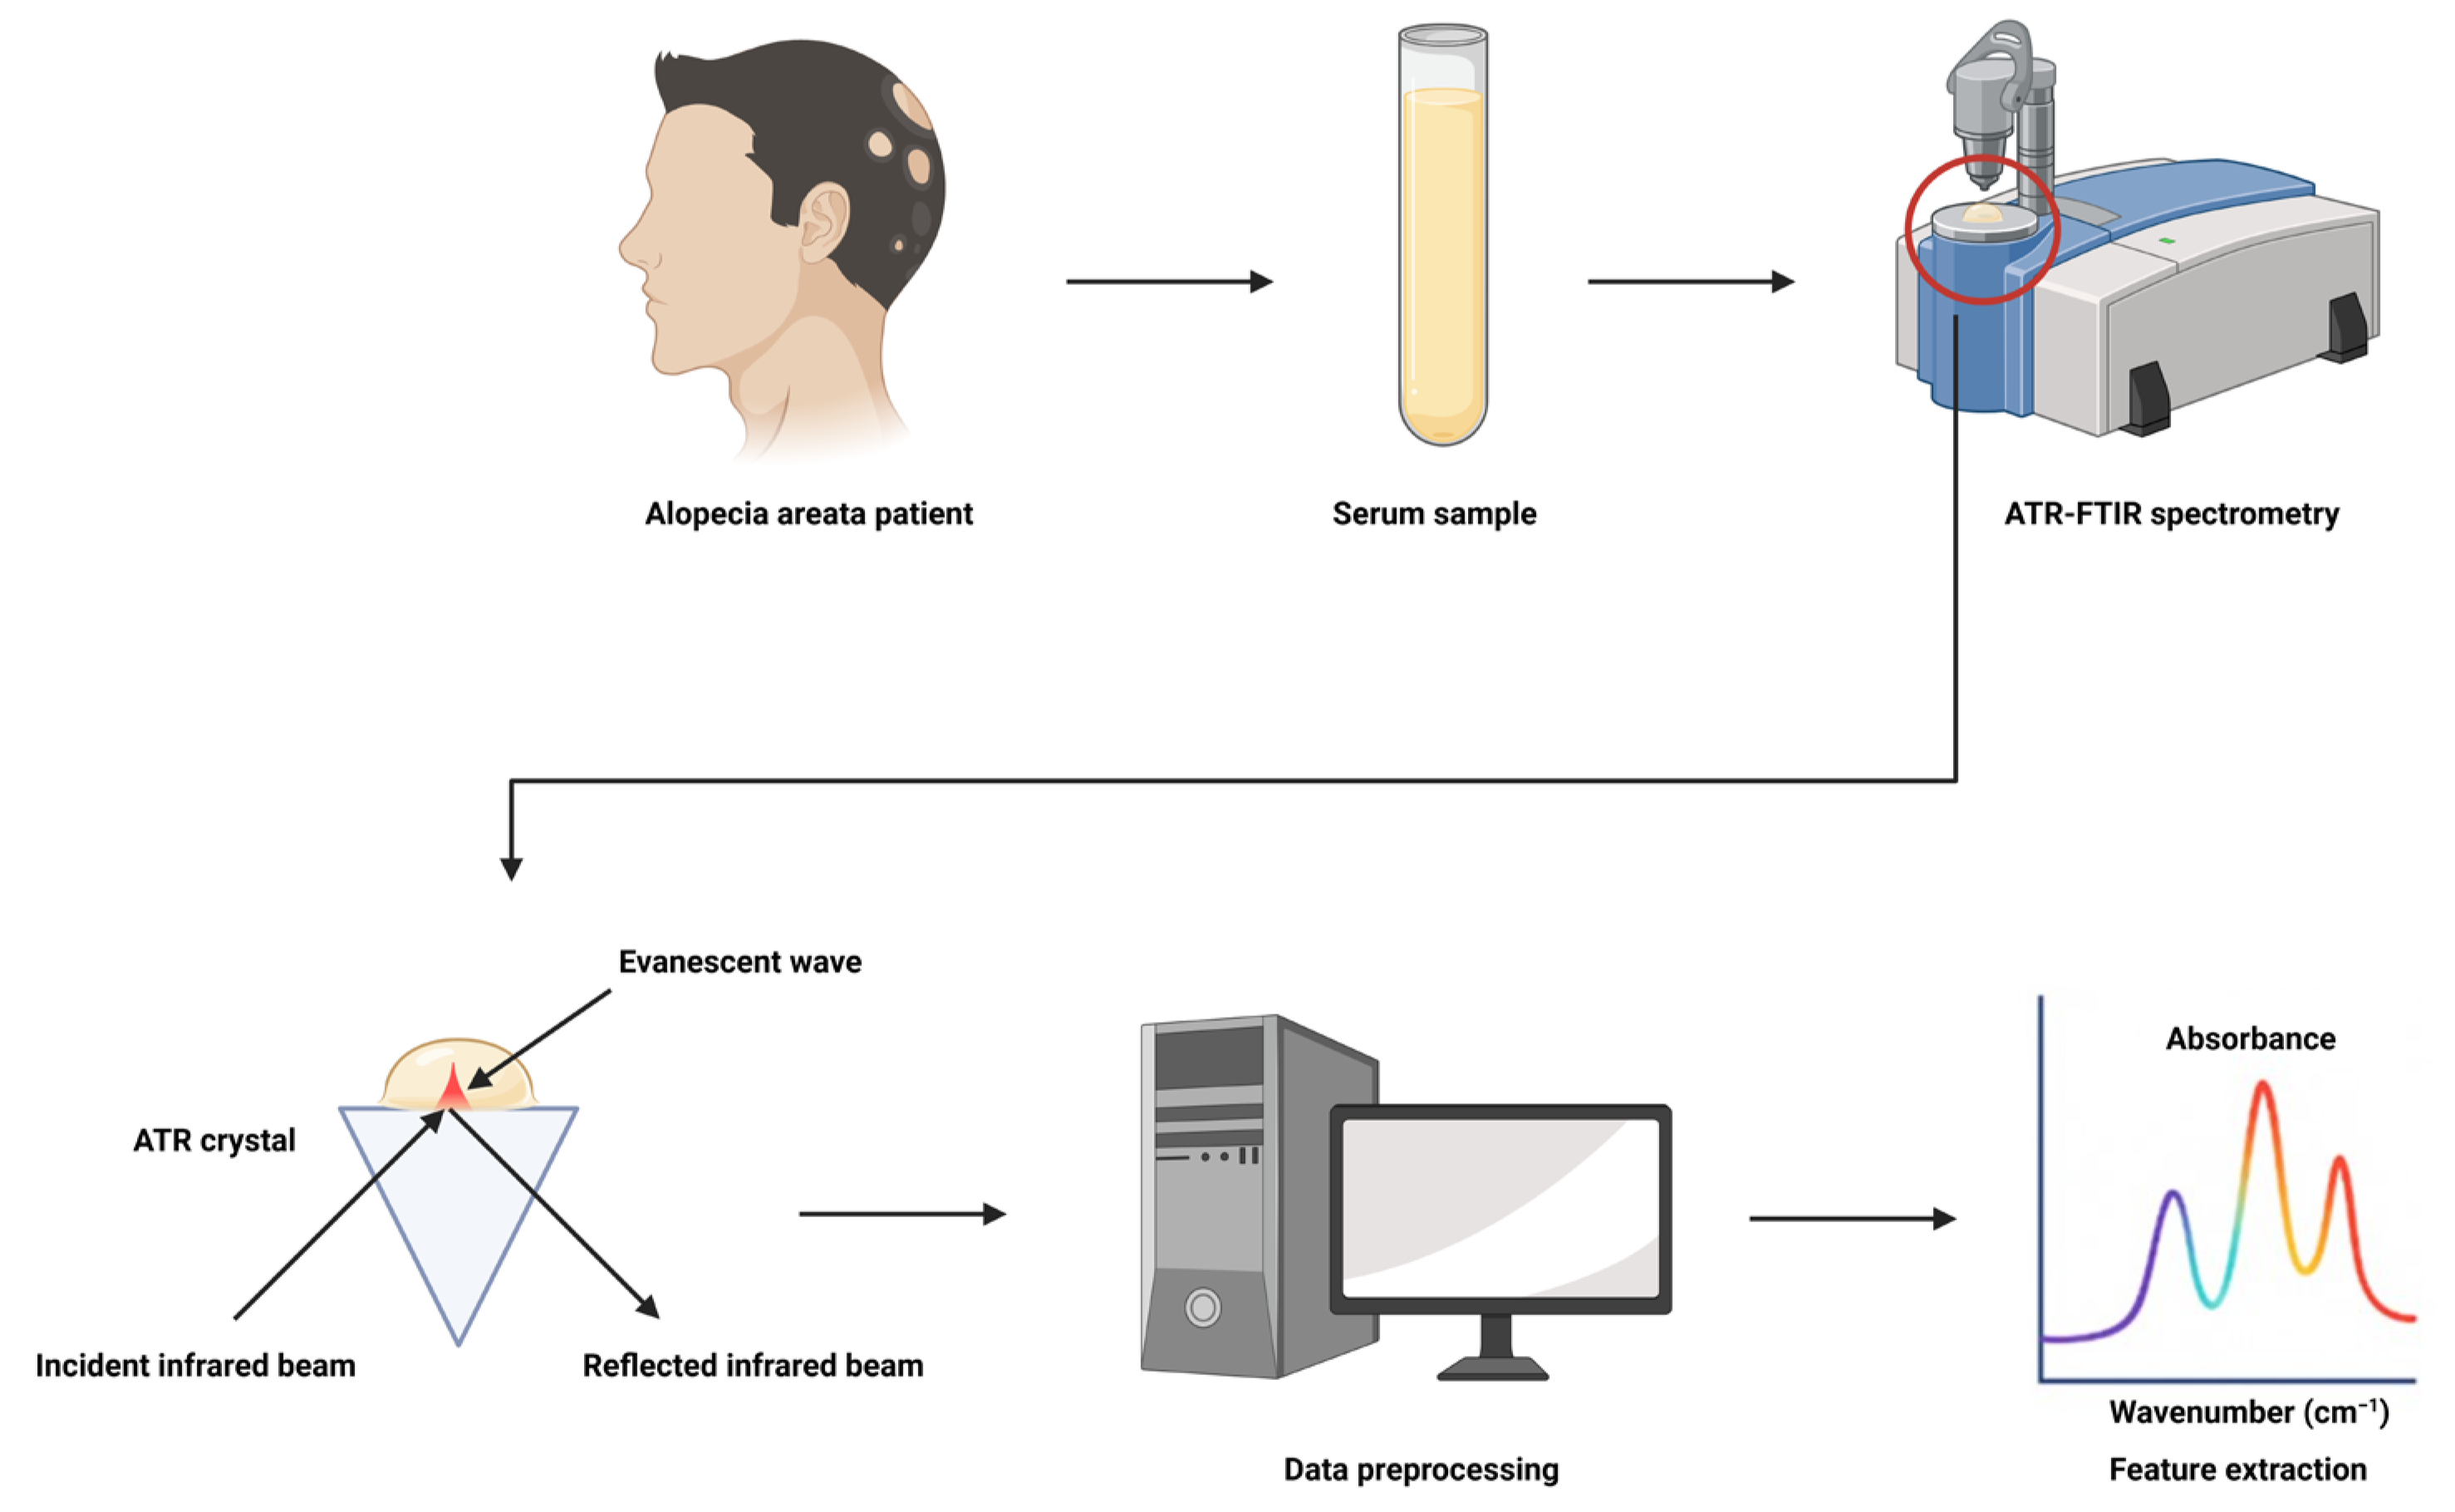
2.2. ATR-FTIR Spectral Acquisition and Preprocessing
2.3. Statistical Analysis and Multivariate Data Analysis
3. Results
3.1. Clinical Characteristics of the Study Population
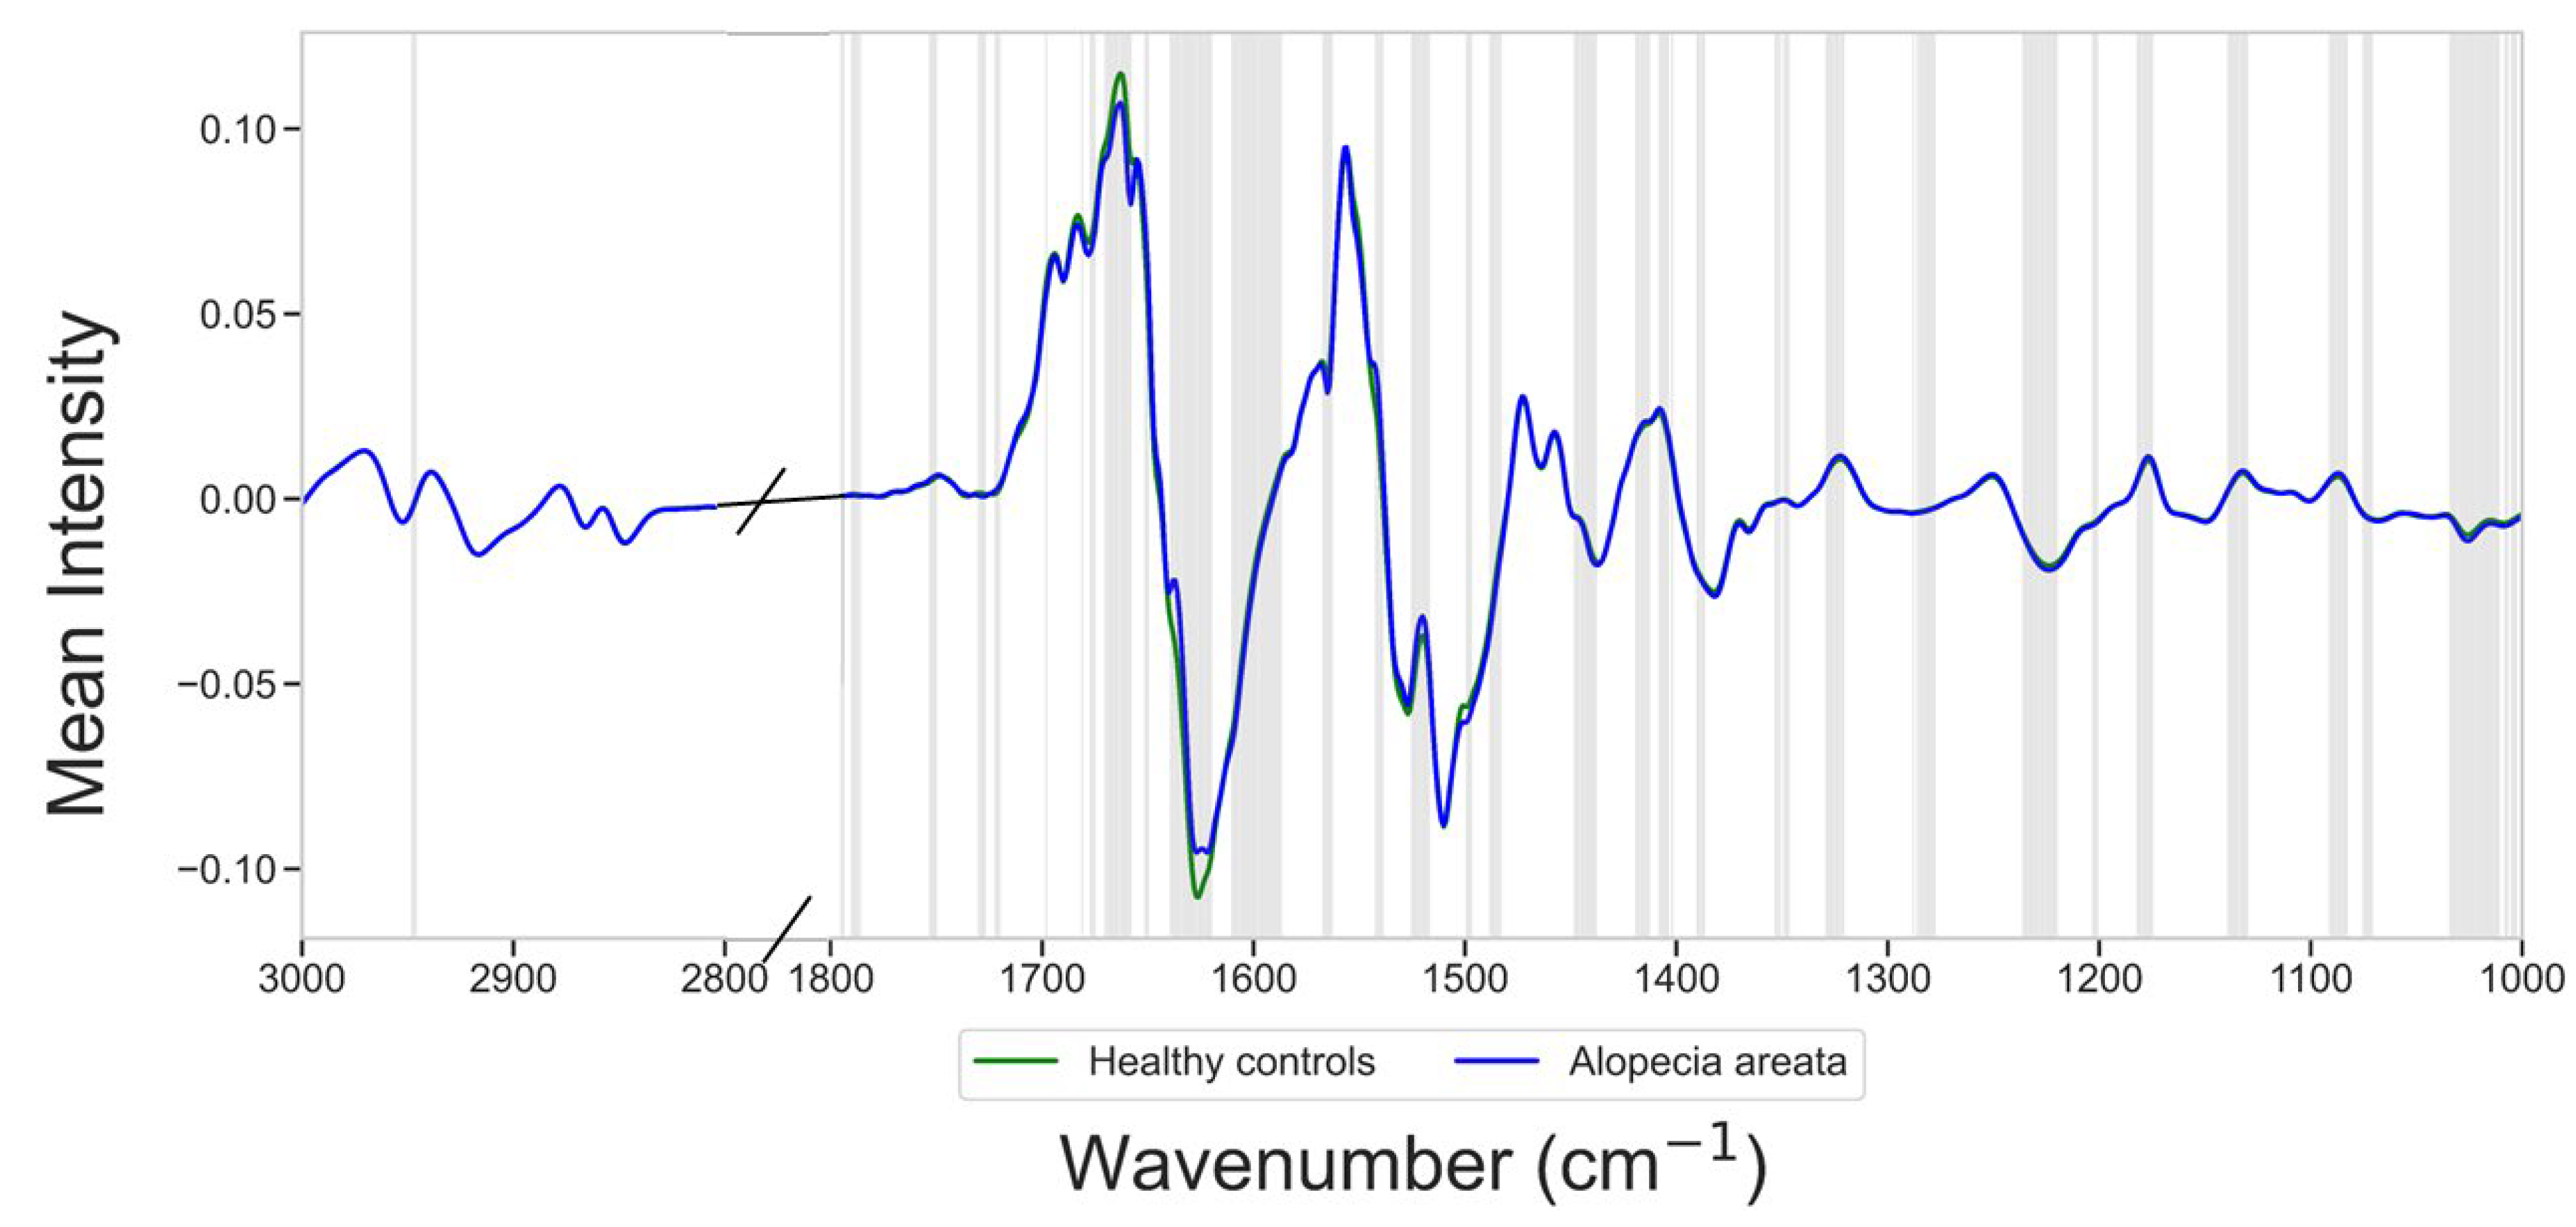
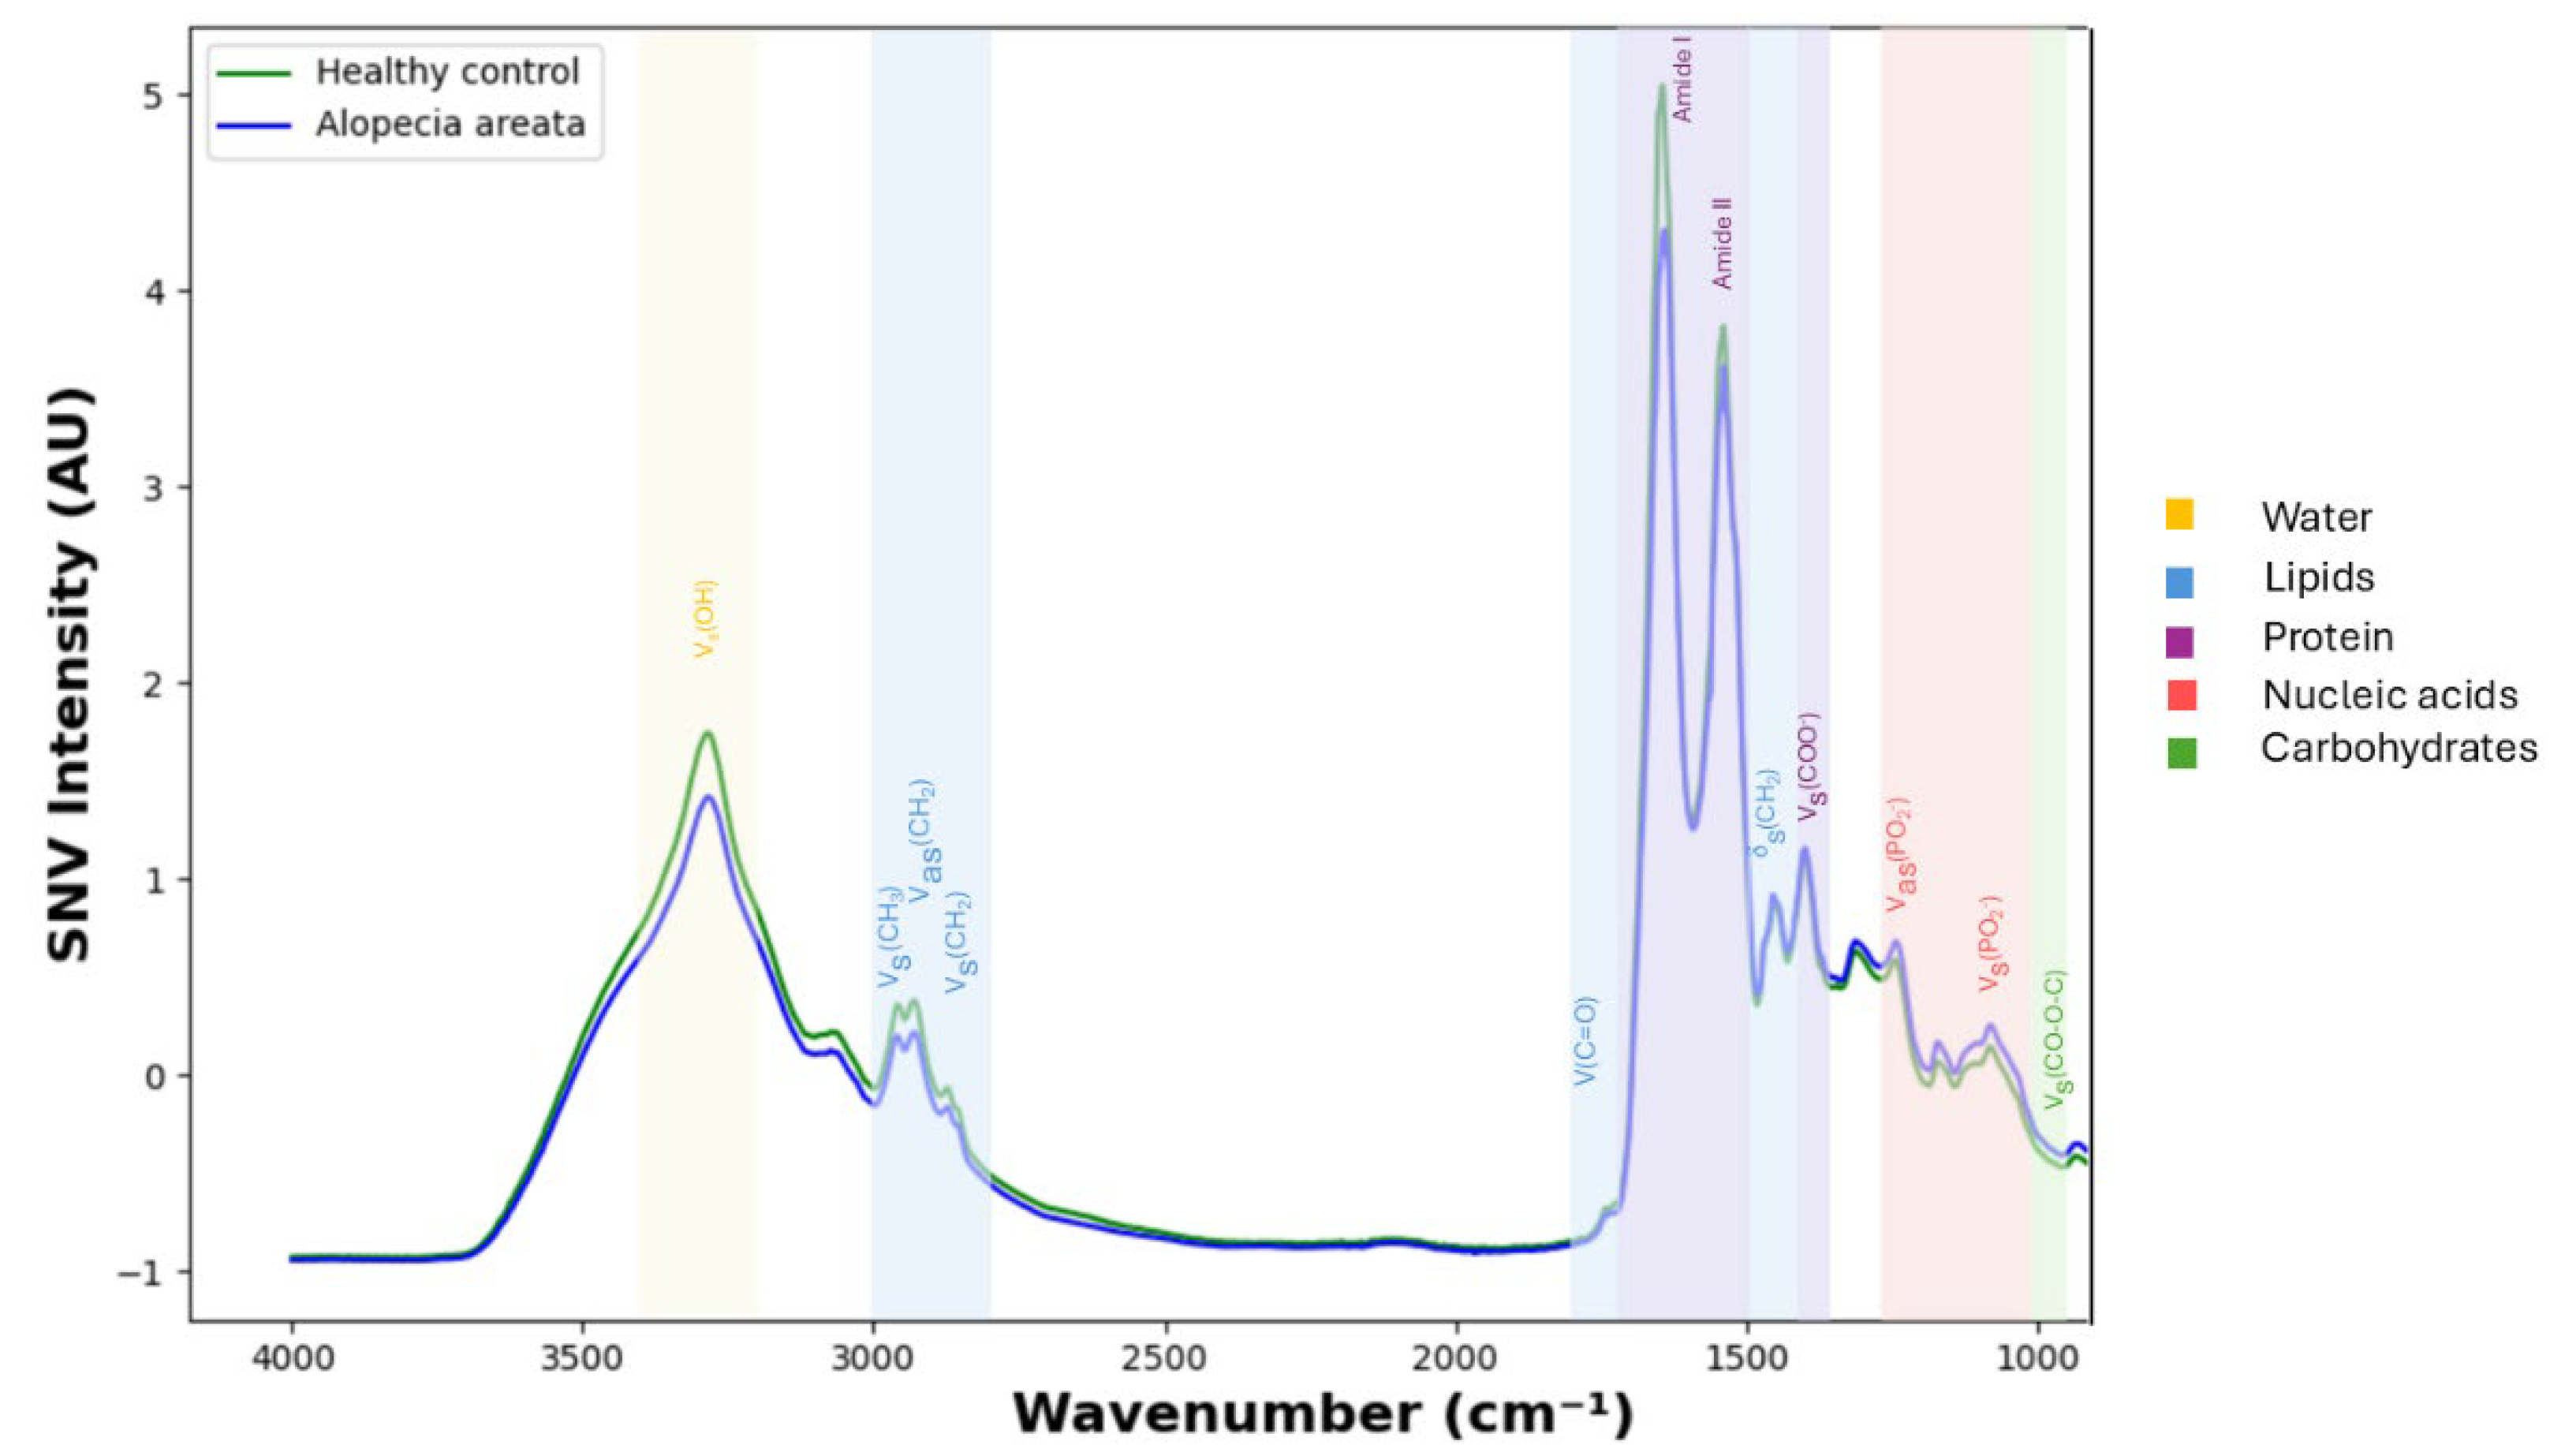
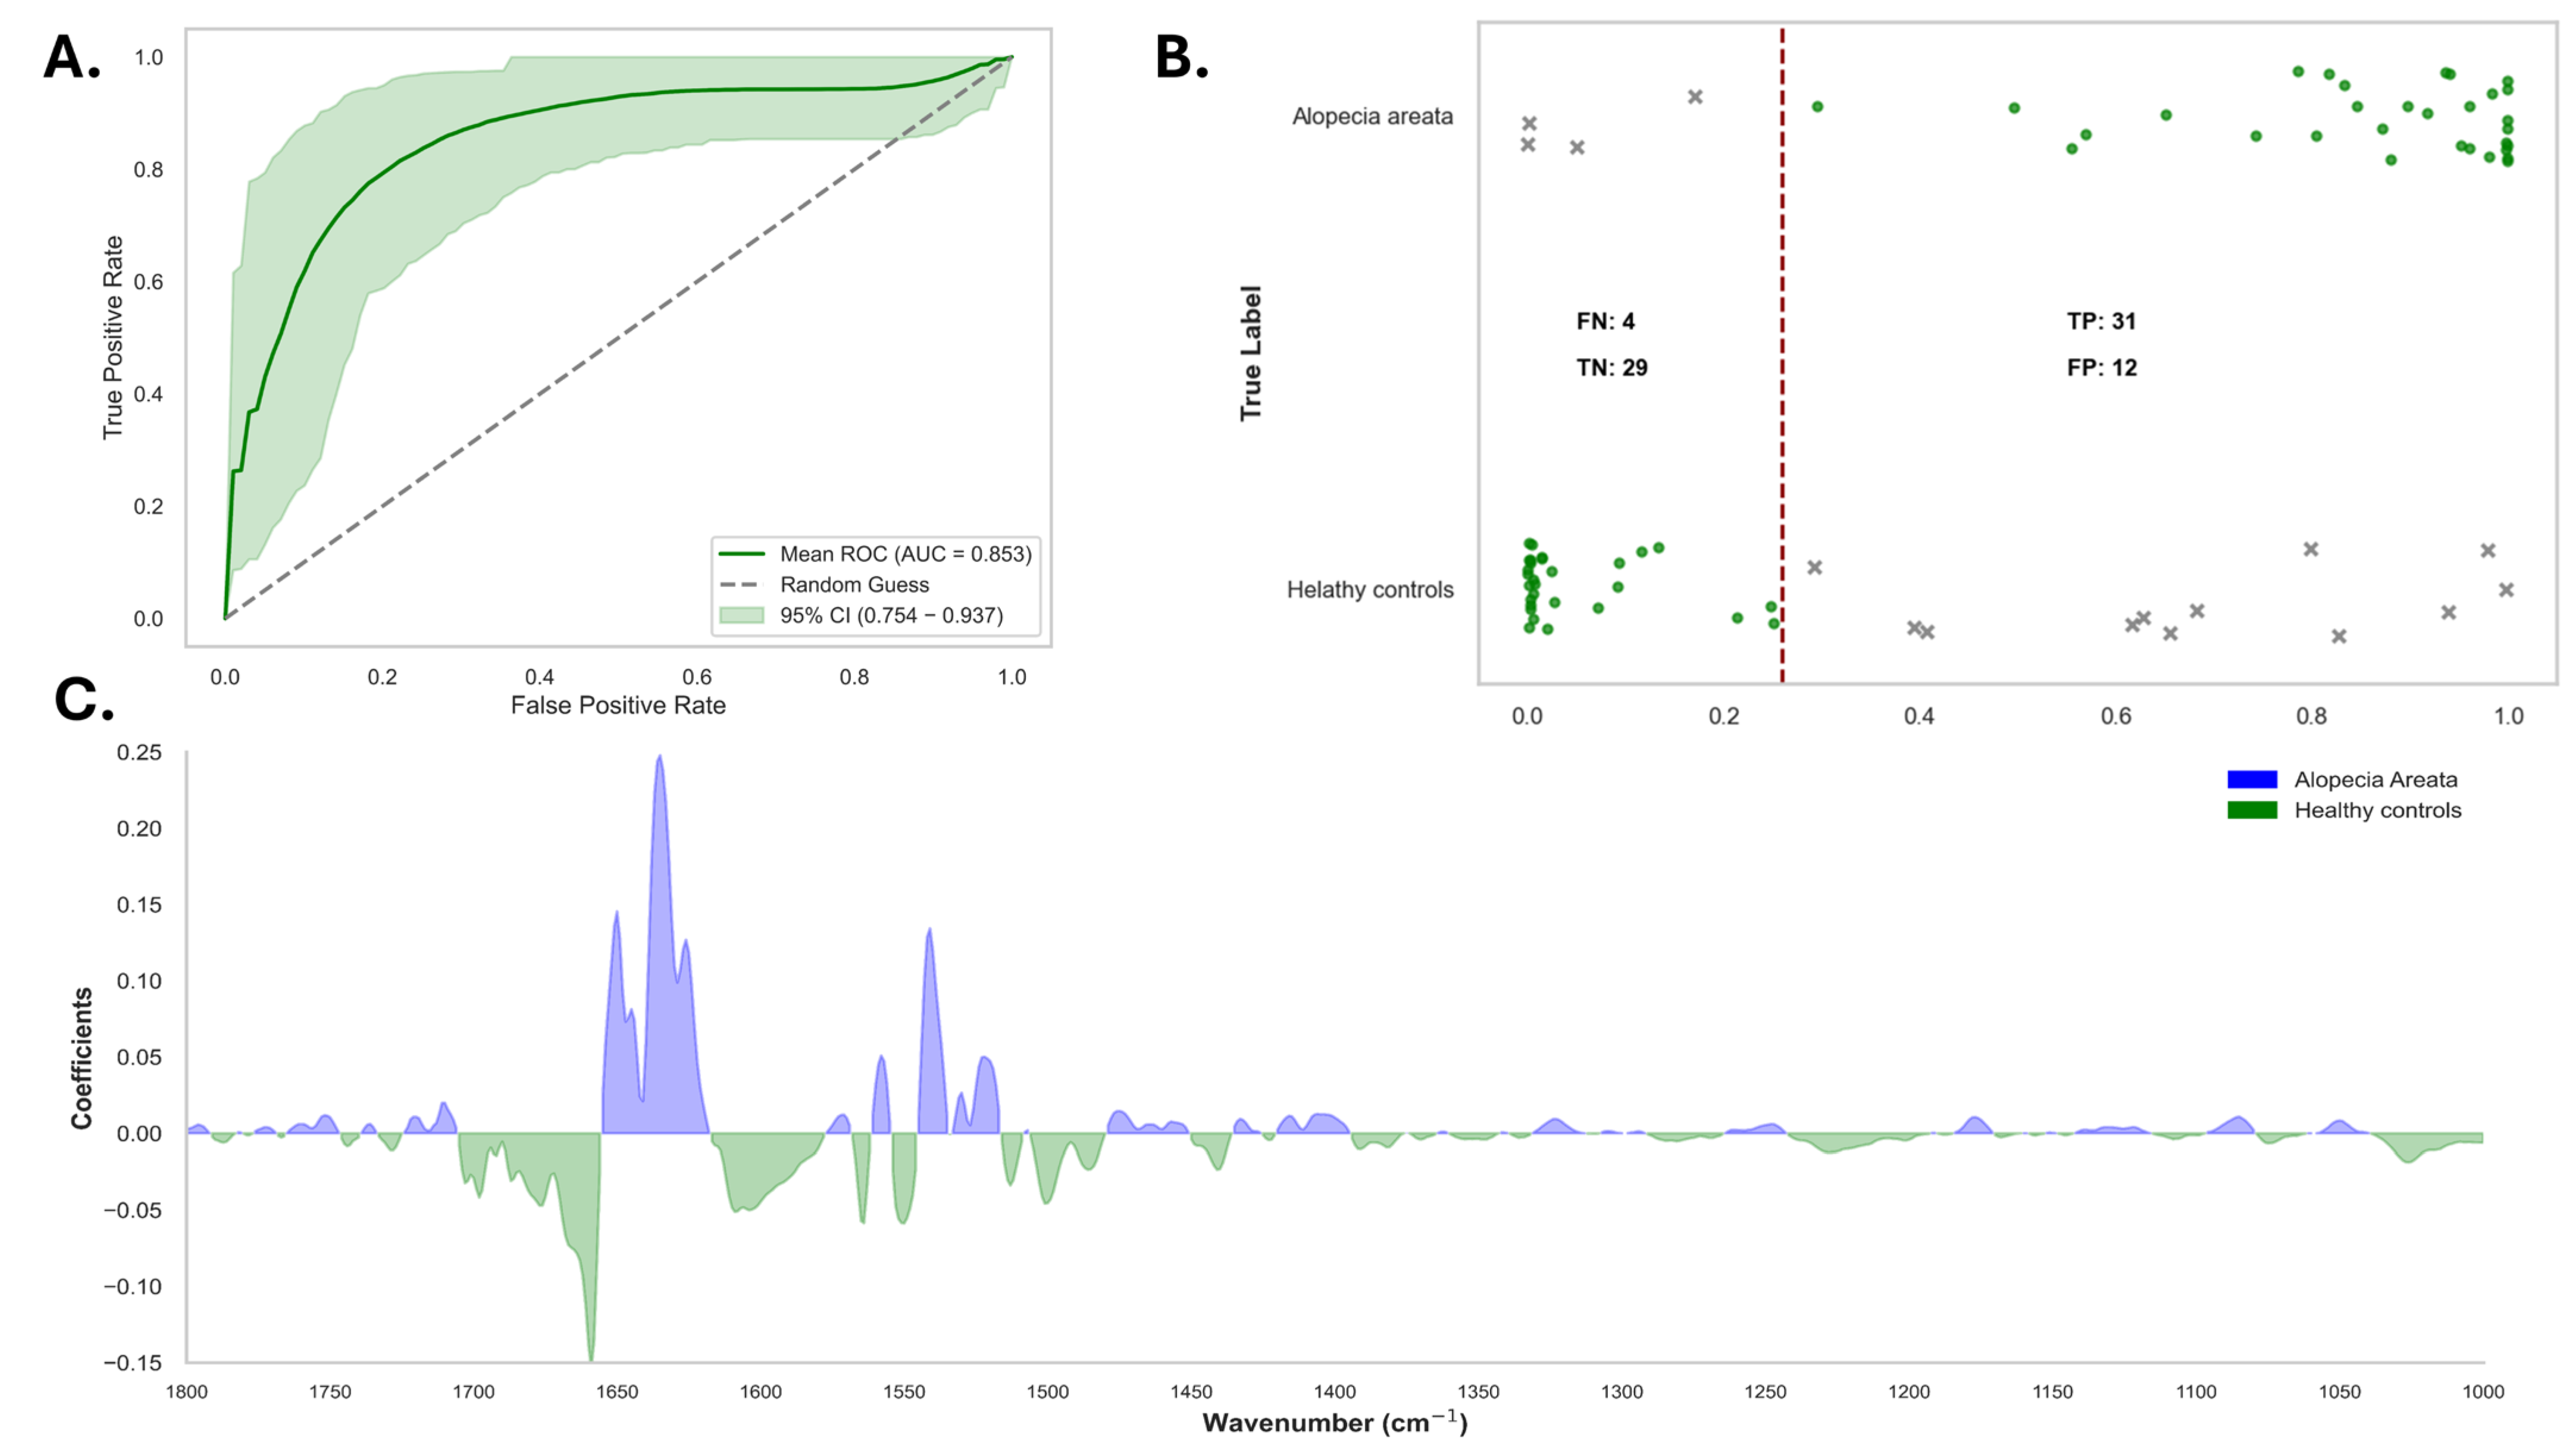
3.2. Spectral Differences Between Alopecia Areata and Controls
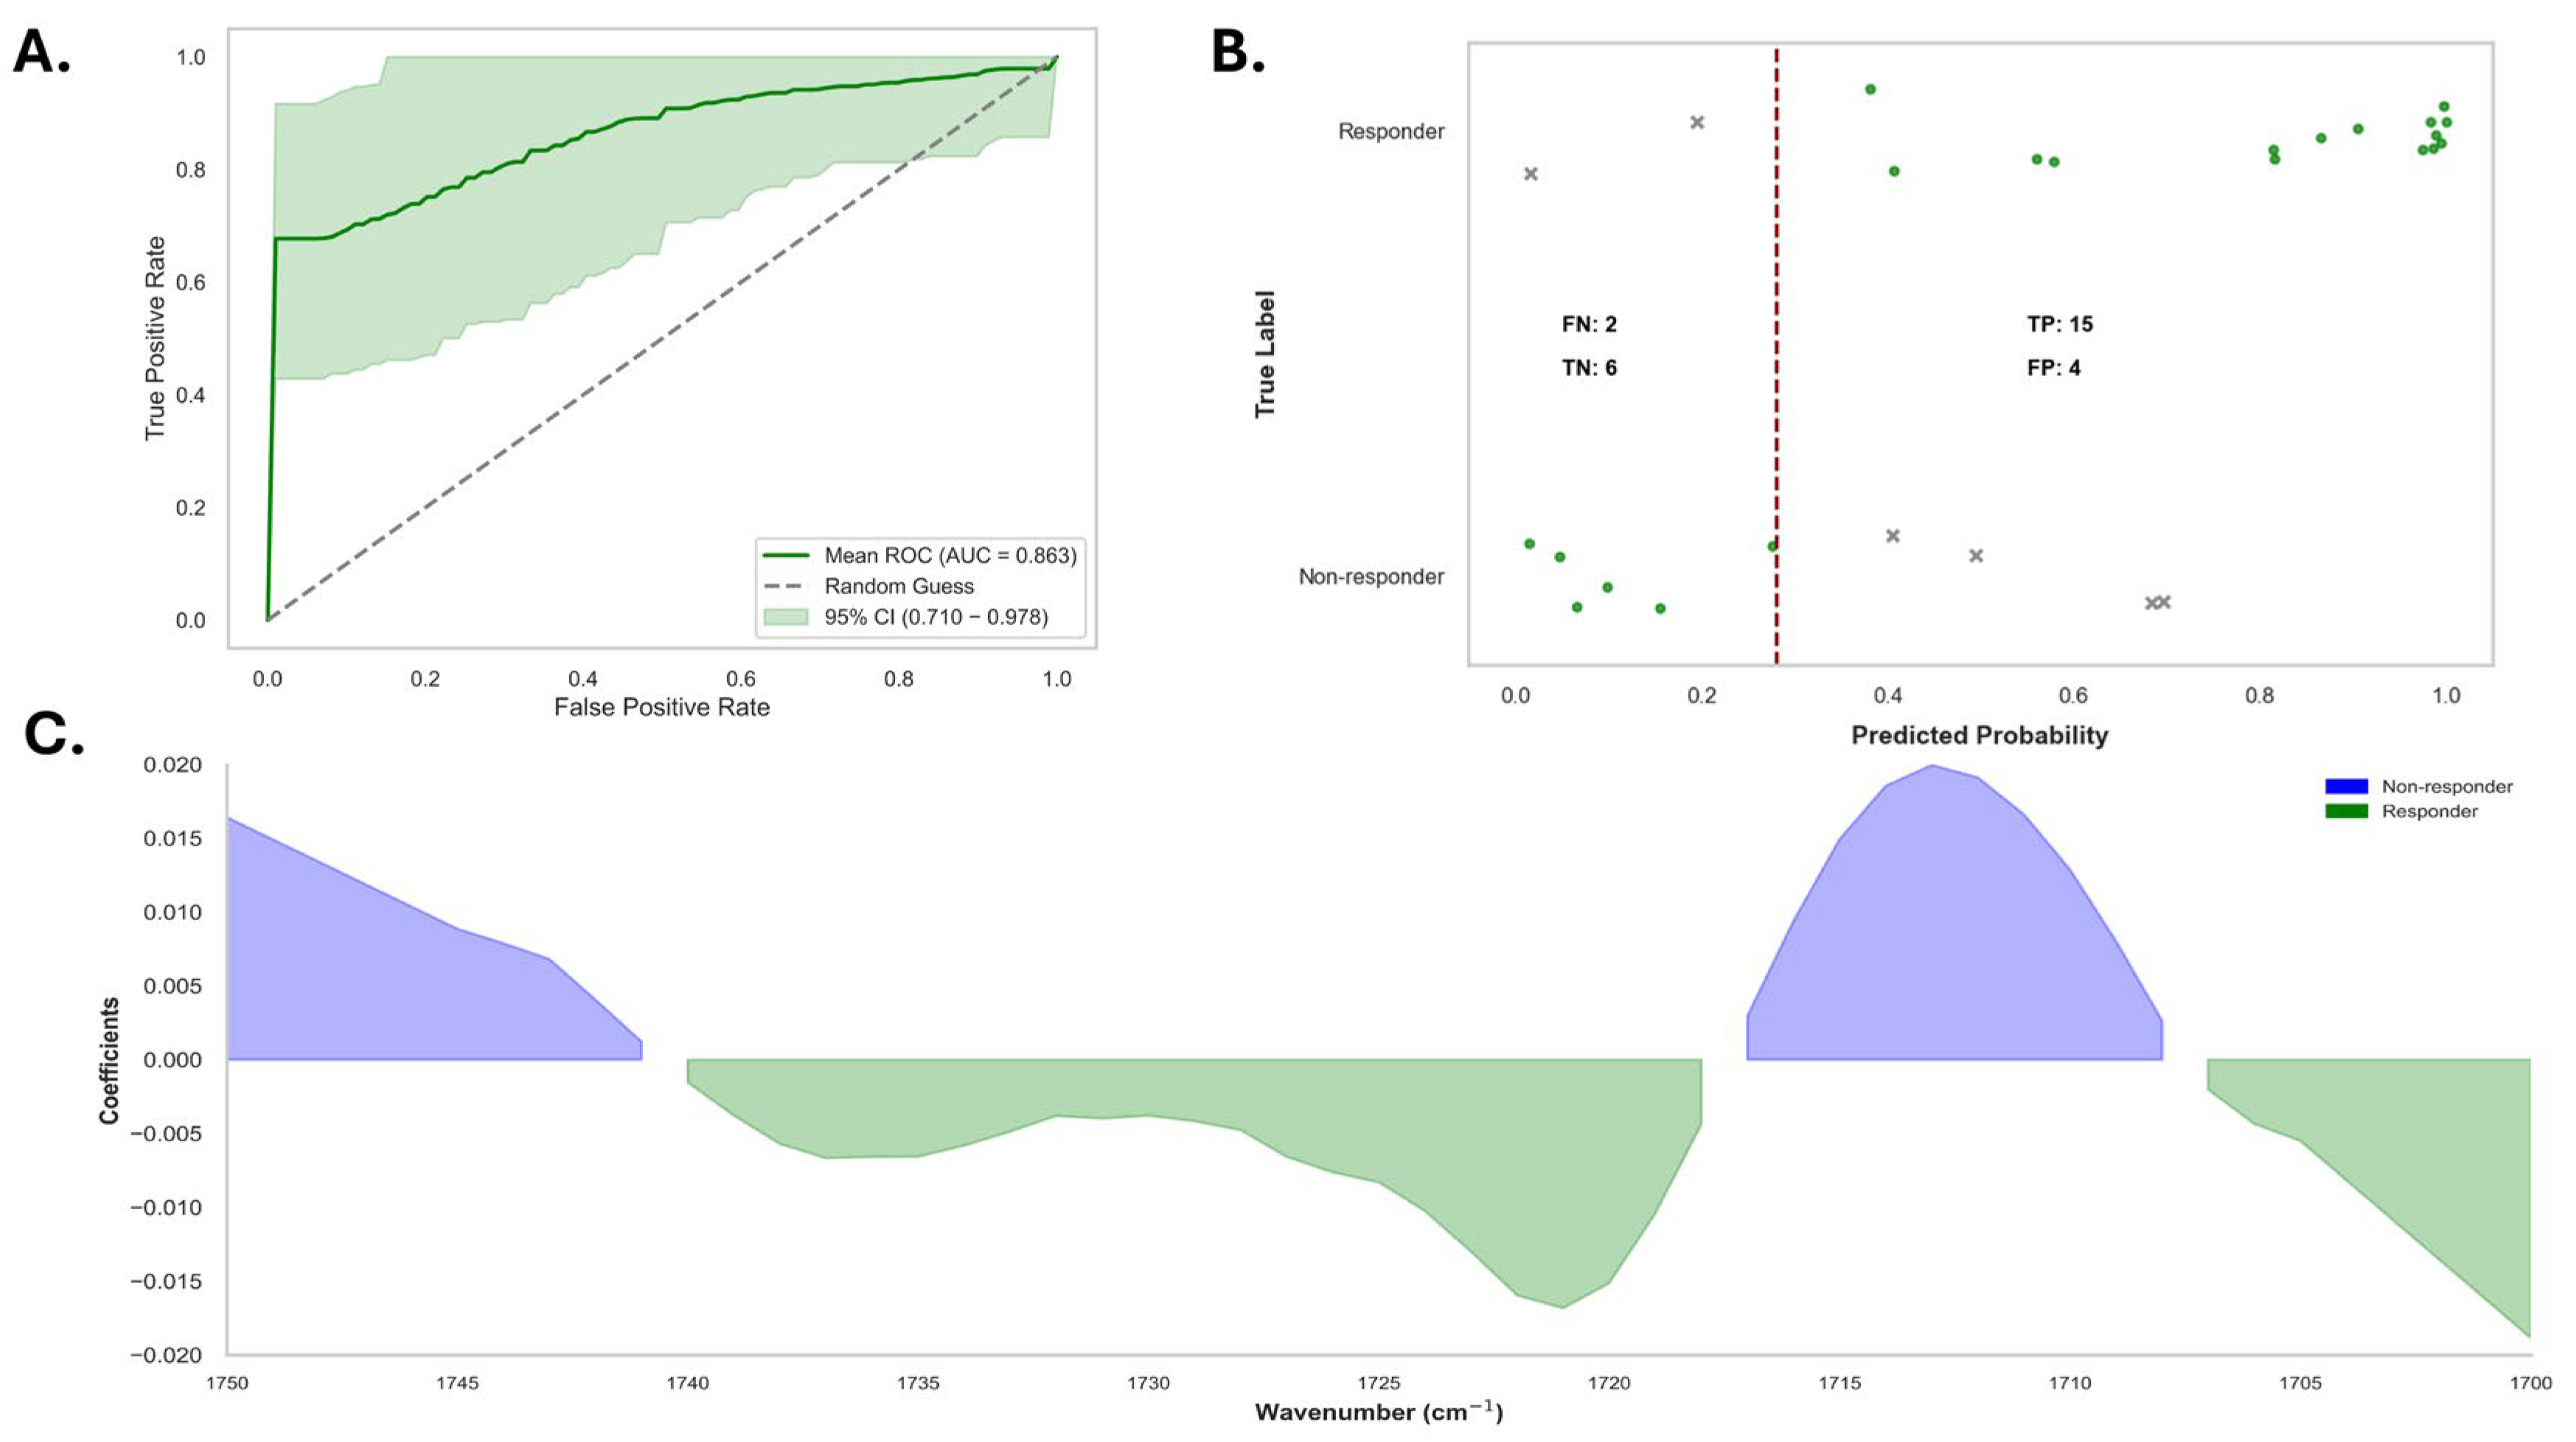
3.3. Responders Versus Non-Responders in Alopecia Areata Patients
4. Discussion
5. Conclusions
Supplementary Materials
Author Contributions
Funding
Institutional Review Board Statement
Informed Consent Statement
Data Availability Statement
Conflicts of Interest
Abbreviations
| AA | Alopecia Areata |
| ATR-FTIR | Attenuated Total Reflection-Fourier Transform Infrared |
| AUC | Area Under the Curve |
| BMI | Body Mass Index |
| CI | Confidence Interval |
| DCP | Diphenylcyclopropenone |
| FTIR | Fourier Transform Infrared |
| IMID | Immune-Mediated Inflammatory Disease |
| IRE | Internal Reflection Element |
| IQR | Interquartile Range |
| JAK | Janus Kinase (inhibitor) |
| LOOCV | Leave-One-Out Cross-Validation |
| NPV | Negative Predictive Value |
| PPV | Positive Predictive Value |
| ROC | Receiver Operating Characteristic |
| SALT II | Severity of Alopecia Tool II |
| SNV | Standard Normal Variate |
References
- Sterkens, A.; Lambert, J.; Bervoets, A. Alopecia Areata: A Review on Diagnosis, Immunological Etiopathogenesis and Treatment Options. Clin. Exp. Med. 2021, 21, 215–230. [Google Scholar] [CrossRef]
- Fricke, A.C.V.; Miteva, M. Epidemiology and Burden of Alopecia Areata: A Systematic Review. CCID 2015, 8, 397–403. [Google Scholar] [CrossRef]
- Zaaroura, H.; Gilding, A.J.; Sibbald, C. Biomarkers in Alopecia Areata: A Systematic Review and Meta-Analysis. Autoimmun. Rev. 2023, 22, 103339. [Google Scholar] [CrossRef]
- Bergqvist, C.; Ezzedine, K. Vitiligo: A Review. Dermatology 2020, 236, 571–592. [Google Scholar] [CrossRef]
- Hordinsky, M.K. Overview of Alopecia Areata. J. Investig. Dermatol. Symp. Proc. 2013, 16, S13–S15. [Google Scholar] [CrossRef]
- Pang, W.; Xing, Y.; Morais, C.L.M.; Lao, Q.; Li, S.; Qiao, Z.; Li, Y.; Singh, M.N.; Barauna, V.G.; Martin, F.L.; et al. Serum-Based ATR-FTIR Spectroscopy Combined with Multivariate Analysis for the Diagnosis of Pre-Diabetes and Diabetes. Analyst 2024, 149, 497–506. [Google Scholar] [CrossRef]
- Theakstone, A.G.; Brennan, P.M.; Jenkinson, M.D.; Goodacre, R.; Baker, M.J. Investigating Centrifugal Filtration of Serum-Based FTIR Spectroscopy for the Stratification of Brain Tumours. PLoS ONE 2023, 18, e0279669. [Google Scholar] [CrossRef]
- Balázs, B.; Farkas, G.; Berkesi, O.; Gyulai, R.; Berkó, S.; Budai-Szűcs, M.; Szabó-Révész, P.; Kemény, L.; Csányi, E. Protein Structure Is Changed in Psoriatic Skin on the Unaffected Region—Imaging Possibility with ATR-FTIR Spectroscopy. Microchem. J. 2014, 117, 183–186. [Google Scholar] [CrossRef]
- Bernard, G.; Auger, M.; Soucy, J.; Pouliot, R. Physical Characterization of the Stratum Corneum of an In Vitro Psoriatic Skin Model by ATR-FTIR and Raman Spectroscopies. Biochim. Biophys. Acta (BBA)-Gen. Subj. 2007, 1770, 1317–1323. [Google Scholar] [CrossRef]
- Williams, S.F.; Wan, H.; Chittock, J.; Brown, K.; Wigley, A.; Cork, M.J.; Danby, S.G. Characterization of Skin Barrier Defects Using Infrared Spectroscopy in Patients with Atopic Dermatitis. Clin. Exp. Dermatol. 2024, 49, 466–477. [Google Scholar] [CrossRef]
- Williams, S.; Danby, S. P26 Characterization of Skin Barrier Defects in Atopic Dermatitis Patients Using Attenuated Total Reflection Fourier Transform Infrared Spectroscopy. Br. J. Dermatol. 2023, 189, e24. [Google Scholar] [CrossRef]
- Covi-Schwarz, J.; Klang, V.; Valenta, C. ATR-FTIR Spectroscopy and the Skin Barrier: Evaluation of Penetration-Enhancement Effects. In Percutaneous Penetration Enhancers Drug Penetration Into/Through the Skin; Dragicevic, N., I. Maibach, H., Eds.; Springer: Berlin/Heidelberg, Germany, 2017; pp. 247–254. ISBN 978-3-662-53268-3. [Google Scholar]
- Lima, C.; Goulart, V.; Côrrea, L.; Pereira, T.; Zezell, D. ATR-FTIR Spectroscopy for the Assessment of Biochemical Changes in Skin Due to Cutaneous Squamous Cell Carcinoma. IJMS 2015, 16, 6621–6630. [Google Scholar] [CrossRef]
- Wang, Q.Q.; Yu, S.C.; Qi, X.; Hu, Y.H.; Zheng, W.J.; Shi, J.X.; Yao, H.Y. Overview of logistic regression model analysis and application. Zhonghua Yu Fang Yi Xue Za Zhi 2019, 53, 955–960. [Google Scholar] [CrossRef]
- Atanaskova Mesinkovska, N.; King, B.A.; Vañó-Galván, S.; Shimomura, Y.; Jedynak, J.; McCollam, J.; Pierce, E.; Ellinwood, A.K.; Sinclair, R. Visualizing Severity of Alopecia Tool (SALT) Scores in the Clinical Setting Using Patient Images from a Clinical Trial. JEADV Clin. Pract. 2024, 3, 528–535. [Google Scholar] [CrossRef]
- Shuai, W.; Wu, X.; Chen, C.; Zuo, E.; Chen, X.; Li, Z.; Lv, X.; Wu, L.; Chen, C. Rapid Diagnosis of Rheumatoid Arthritis and Ankylosing Spondylitis Based on Fourier Transform Infrared Spectroscopy and Deep Learning. Photodiagnosis Photodyn. Ther. 2024, 45, 103885. [Google Scholar] [CrossRef]
- Guleken, Z.; Ceylan, Z.; Aday, A.; Bayrak, A.G.; Hindilerden, İ.Y.; Nalçacı, M.; Jakubczyk, P.; Jakubczyk, D.; Depciuch, J. FTIR- Based Serum Structure Analysis in Molecular Diagnostics of Essential Thrombocythemia Disease. J. Photochem. Photobiol. B Biol. 2023, 245, 112734. [Google Scholar] [CrossRef]
- Soares Martins, T.; Ferreira, M.; Magalhães, S.; Leandro, K.; Almeida, L.P.D.; Vogelgsang, J.; Breitling, B.; Hansen, N.; Esselmann, H.; Wiltfang, J.; et al. FTIR Spectroscopy and Blood-Derived Extracellular Vesicles Duo in Alzheimer’s Disease. J. Alzheimer’s Dis. 2024, 98, 1157–1167. [Google Scholar] [CrossRef]
- Tintor, Đ.; Ninković, K.; Milošević, J.; Polović, N.Đ. Gaining Insight into Protein Structure via ATR-FTIR Spectroscopy. Vib. Spectrosc. 2024, 134, 103726. [Google Scholar] [CrossRef]
- Montes-Narváez, O.; García-Juárez, M.; Beltrán-Pérez, G.; Espinosa-García, C.; González-Flores, O.; Delgado-Macuil, R.J. ATR-FTIR Spectroscopy to Evaluate Serum Protein Expression in a Murine Cerebral Ischemia Model. Spectrochim. Acta Part A Mol. Biomol. Spectrosc. 2025, 326, 125261. [Google Scholar] [CrossRef]
- Mannerkorpi, M.; Das Gupta, S.; Rieppo, L.; Saarakkala, S. Diagnostic Performance of Attenuated Total Reflectance Fourier Transform Infrared (ATR-FTIR) Spectroscopy for Detecting Osteoarthritis and Rheumatoid Arthritis from Blood Serum. Spectrochim. Acta Part A Mol. Biomol. Spectrosc. 2024, 338, 126206. [Google Scholar] [CrossRef]
- Kokot, I.; Mazurek, S.; Piwowar, A.; Sokolik, R.; Rodak, K.; Kacperczyk, M.; Szostak, R.; Cuprych, P.; Korman, L.; Maria Kratz, E. Comparative Profiling of Serum Biomarkers and ATR-FTIR Spectroscopy for Differential Diagnosis of Patients with Rheumatoid and Psoriatic Arthritis—A Pilot Study. Spectrochim. Acta Part A Mol. Biomol. Spectrosc. 2024, 321, 124654. [Google Scholar] [CrossRef] [PubMed]
- Banerjee, A.; Gokhale, A.; Bankar, R.; Palanivel, V.; Salkar, A.; Robinson, H.; Shastri, J.S.; Agrawal, S.; Hartel, G.; Hill, M.M.; et al. Rapid Classification of COVID-19 Severity by ATR-FTIR Spectroscopy of Plasma Samples. Anal. Chem. 2021, 93, 10391–10396. [Google Scholar] [CrossRef] [PubMed]
- Praja, R.K.; Wongwattanakul, M.; Tippayawat, P.; Phoksawat, W.; Jumnainsong, A.; Sornkayasit, K.; Leelayuwat, C. Attenuated Total Reflectance-Fourier Transform Infrared (ATR-FTIR) Spectroscopy Discriminates the Elderly with a Low and High Percentage of Pathogenic CD4+ T Cells. Cells 2022, 11, 458. [Google Scholar] [CrossRef]


| Clinical Characteristics | Value |
|---|---|
| Men, n/total (%) | 13/42 (31.0%) |
| Women, n/total (%) | 29/42 (69.0%) |
| Age (years), mean (median, IQR) | 43.5 (46.5, 17.8) |
| Age of onset AA (years), mean (median, IQR) | 31.3 (30.5, 25.3) |
| Familial AA | |
| Yes, n/total (%) | 7/42 (16.7%) |
| No, n/total (%) | 35/42 (83.3%) |
| SALT II score at TP0 (%), mean (median, IQR) | 42.1 (29.0, 82.0) |
| BMI (kg/m2), mean (median, IQR) | 25.8 (24.7, 6.0) |
| Type of AA | |
| Patchy, n/total (%) | 31/42 (73.8%) |
| Totalis or universalis, n/total (%) | 9/42 (21.4%) |
| Barbae, n/total (%) | 1 (2.4%) |
| Diffuse, n/total (%) | 1 (2.4%) |
| IMID | |
| No, n/total (%) | 29/42 (69.0%) |
| Yes, n/total (%) | 13/42 (31.0%) |
| Inflammatory bowel disease | 1/42 |
| Psoriasis | 2/42 |
| Rheumatoid arthritis | 2/42 |
| Systemic lupus erythematosus | 1/42 |
| Thyroid disease | 5/42 |
| Microscopic polyangiitis | 1/42 |
| Sapho syndrome | 1/42 |
| Immune thrombotic thrombocytopenic purpura | 1/42 |
| Vitiligo | 1/42 |
| Addison’s disease | 1/42 |
| Sarcoidosis | 1/42 |
| APECED syndrome | 1/42 |
| Therapy at TP0 | |
| None | 12/42 (28.5%) |
| Topical corticosteroids | 23/42 (54.8%) |
| Topical DCP | 1 (2.4%) |
| Systemic treatment | 6/42 (14.3%) |
| Methotrexate | 3/6 (50.0%) |
| JAK inhibitors | 2/6 (33.3%) |
| Cyclosporine | 1/6 (16.7%) |
| Vibrational Mode | Typical Wavenumber Range (cm−1) | Significant Wavenumber Between Alopecia Areata Patients and Healthy Controls (cm−1) |
|---|---|---|
| CH3 stretching (symmetric) | ~2870–2960 | 2946–2948 |
| Carbonyl (C=O) stretching | ~1700–1760 | 1720–1730, 1750–1753 |
| Amide I | ~1600–1700 | 1661–1677, 1681, 1698 |
| Amide II | ~1500–1580 | 1520–1525, 1540–1542, 1563–1567, 1587–1599 |
| CH2 bending | ~1430–1470 | 1440–1448 |
| Symmetric COO− stretching | ~1300–1420 | 1347–1353, 1387–1390, 1402, 1404–1408, 1413–1419 |
| Symmetric and asymmetric PO2− stretching | ~1080–1250 | 1130–1139, 1175–1182, 1201–1203, 1220–1236 |
Disclaimer/Publisher’s Note: The statements, opinions and data contained in all publications are solely those of the individual author(s) and contributor(s) and not of MDPI and/or the editor(s). MDPI and/or the editor(s) disclaim responsibility for any injury to people or property resulting from any ideas, methods, instructions or products referred to in the content. |
© 2025 by the authors. Licensee MDPI, Basel, Switzerland. This article is an open access article distributed under the terms and conditions of the Creative Commons Attribution (CC BY) license (https://creativecommons.org/licenses/by/4.0/).
Share and Cite
Delrue, C.; Belpaire, A.; Delanghe, S.; Oyaert, M.; De Bruyne, S.; Speeckaert, M.M.; Speeckaert, R. Serum-Based Assessment of Alopecia Areata Response to Treatment Using ATR-FTIR Spectroscopy. Diagnostics 2025, 15, 1369. https://doi.org/10.3390/diagnostics15111369
Delrue C, Belpaire A, Delanghe S, Oyaert M, De Bruyne S, Speeckaert MM, Speeckaert R. Serum-Based Assessment of Alopecia Areata Response to Treatment Using ATR-FTIR Spectroscopy. Diagnostics. 2025; 15(11):1369. https://doi.org/10.3390/diagnostics15111369
Chicago/Turabian StyleDelrue, Charlotte, Arno Belpaire, Sigurd Delanghe, Matthijs Oyaert, Sander De Bruyne, Marijn M. Speeckaert, and Reinhart Speeckaert. 2025. "Serum-Based Assessment of Alopecia Areata Response to Treatment Using ATR-FTIR Spectroscopy" Diagnostics 15, no. 11: 1369. https://doi.org/10.3390/diagnostics15111369
APA StyleDelrue, C., Belpaire, A., Delanghe, S., Oyaert, M., De Bruyne, S., Speeckaert, M. M., & Speeckaert, R. (2025). Serum-Based Assessment of Alopecia Areata Response to Treatment Using ATR-FTIR Spectroscopy. Diagnostics, 15(11), 1369. https://doi.org/10.3390/diagnostics15111369