Optimizing CNN-Based Diagnosis of Knee Osteoarthritis: Enhancing Model Accuracy with CleanLab Relabeling
Abstract
1. Introduction
Contributions of This Paper
- We develop a deep learning pipeline using EfficientNetB5 and transfer learning for five-class KOA classification.
- We improve the benchmark accuracy on the widely used Kaggle KOA dataset from 69% to 82.07%, and increase macro-averaged recall from 57.87% to 80.34%, establishing a new state of the art for this task.
- We assess the effectiveness of CleanLab in relabeling noisy medical datasets, demonstrating its substantial impact on classification performance.
- We conduct an ablation study comparing raw-labeled training and CleanLab-relabeled training.
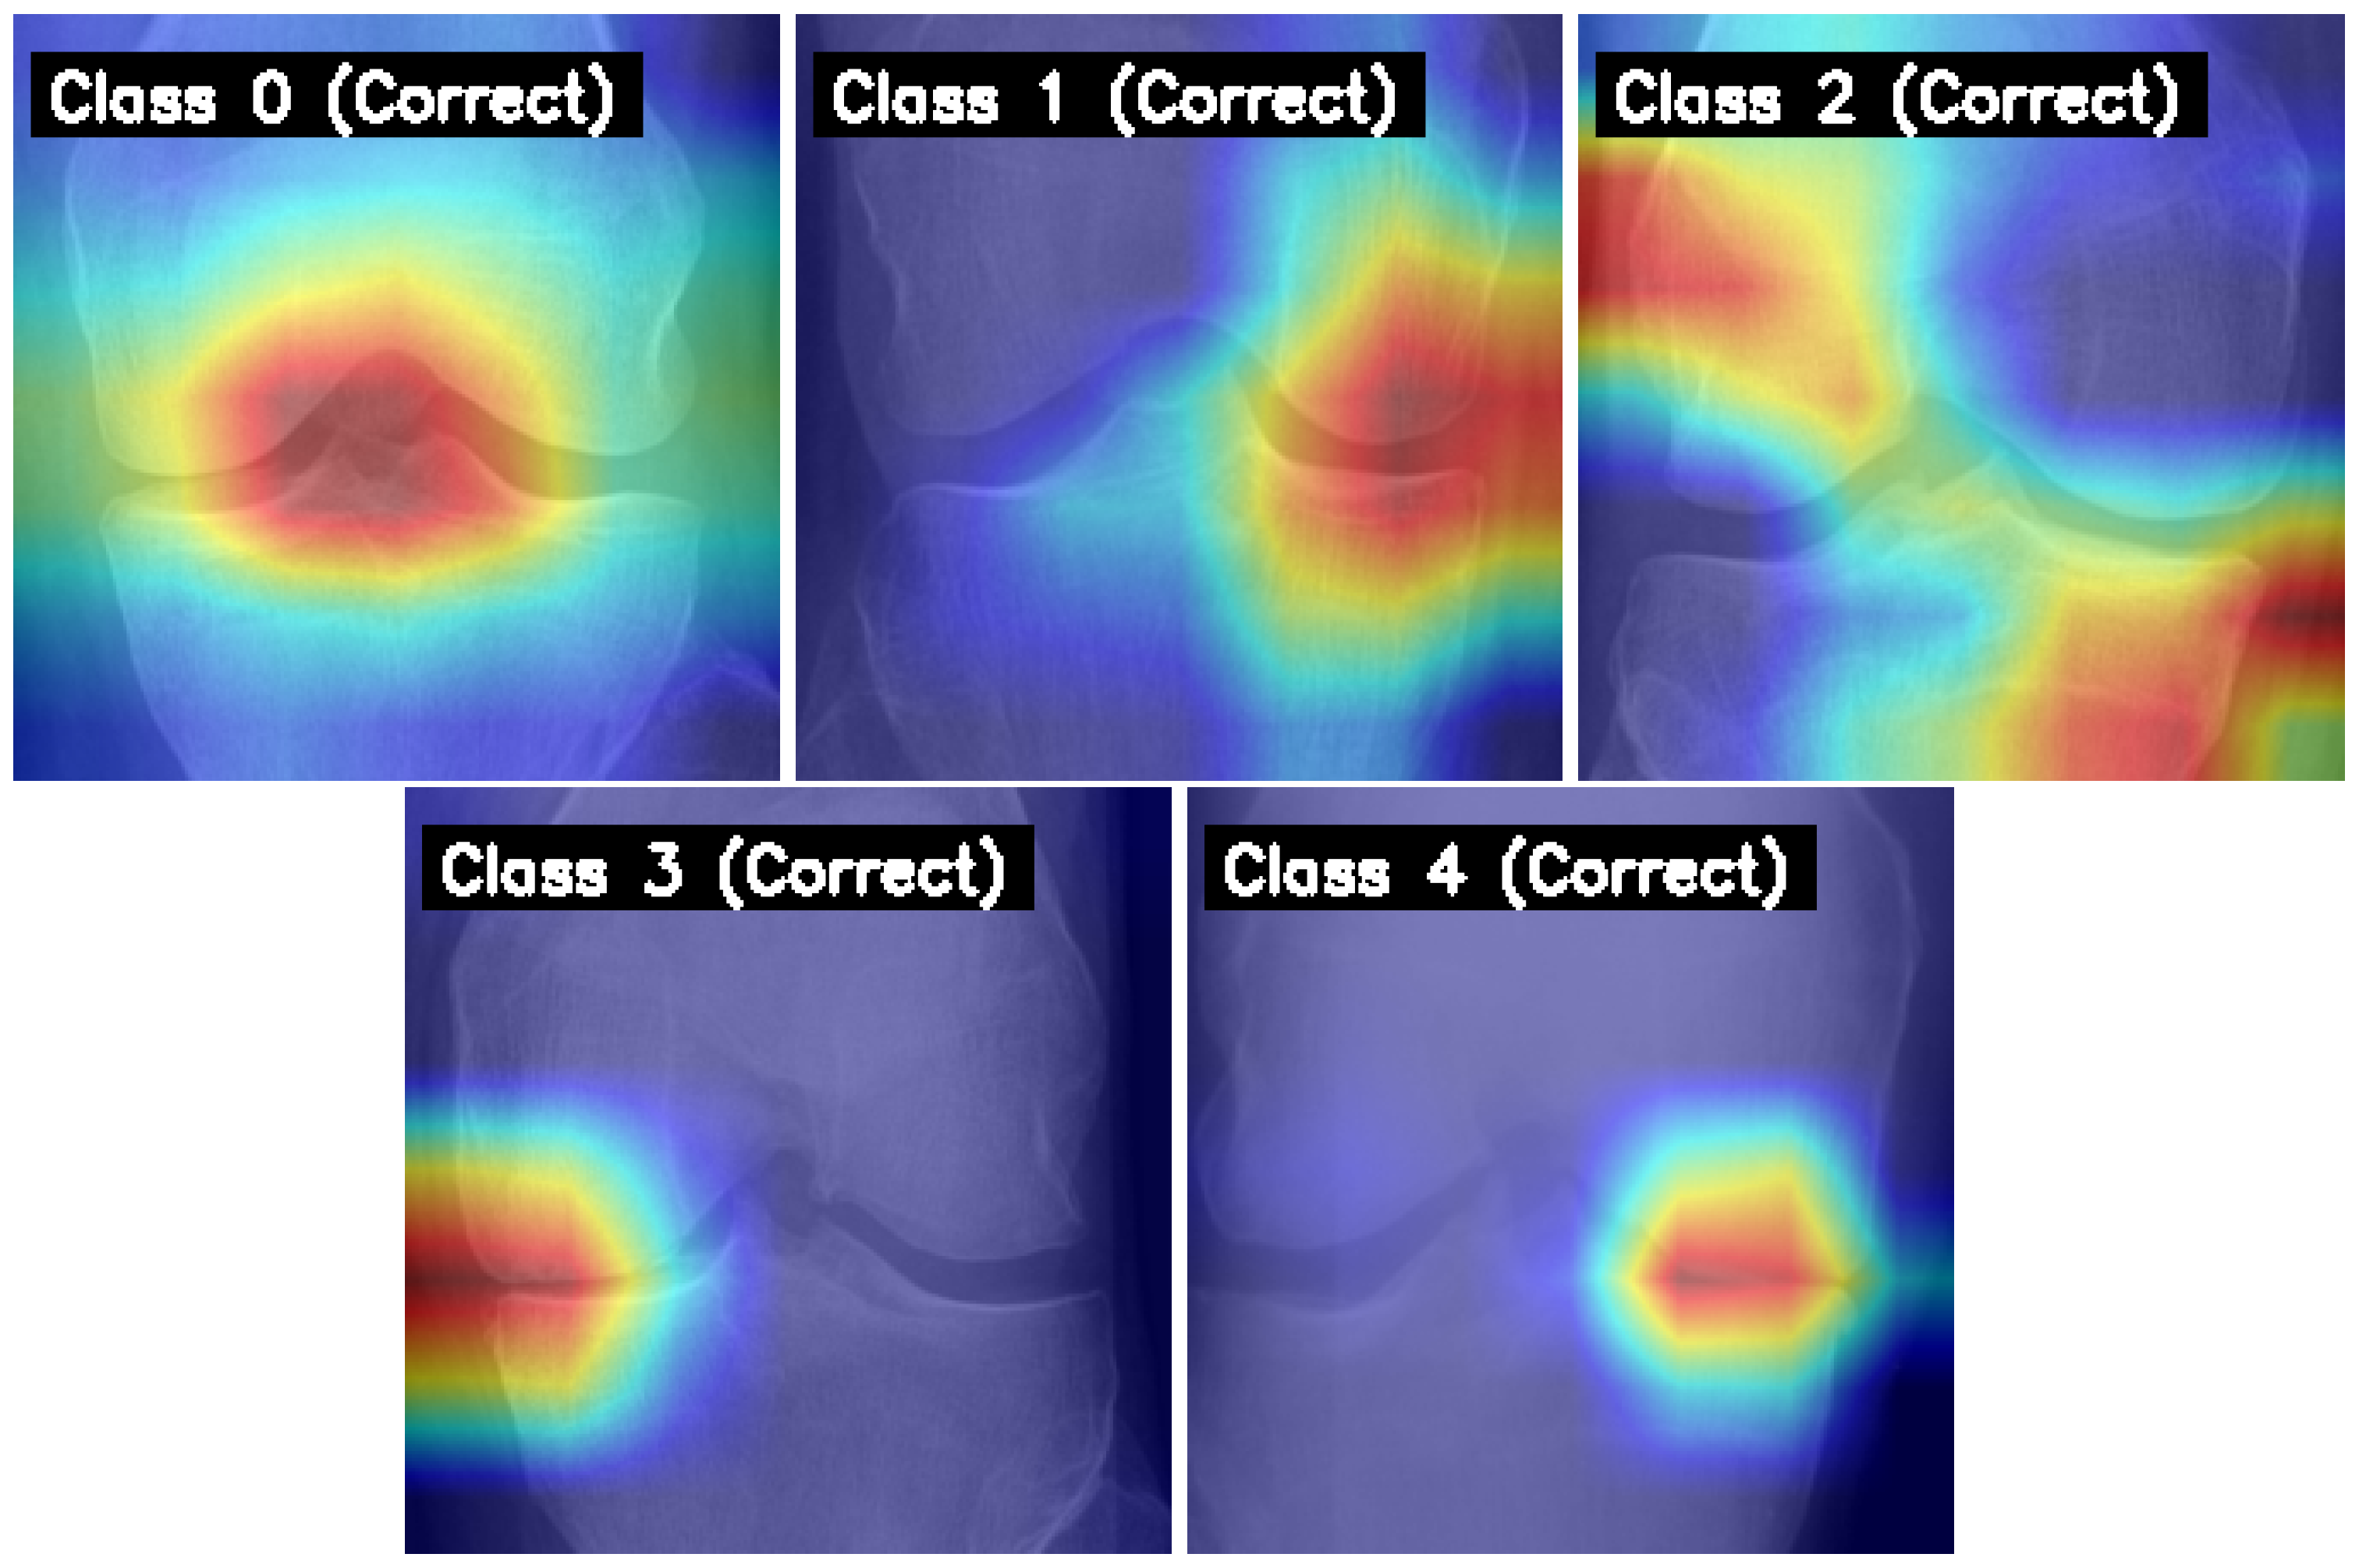
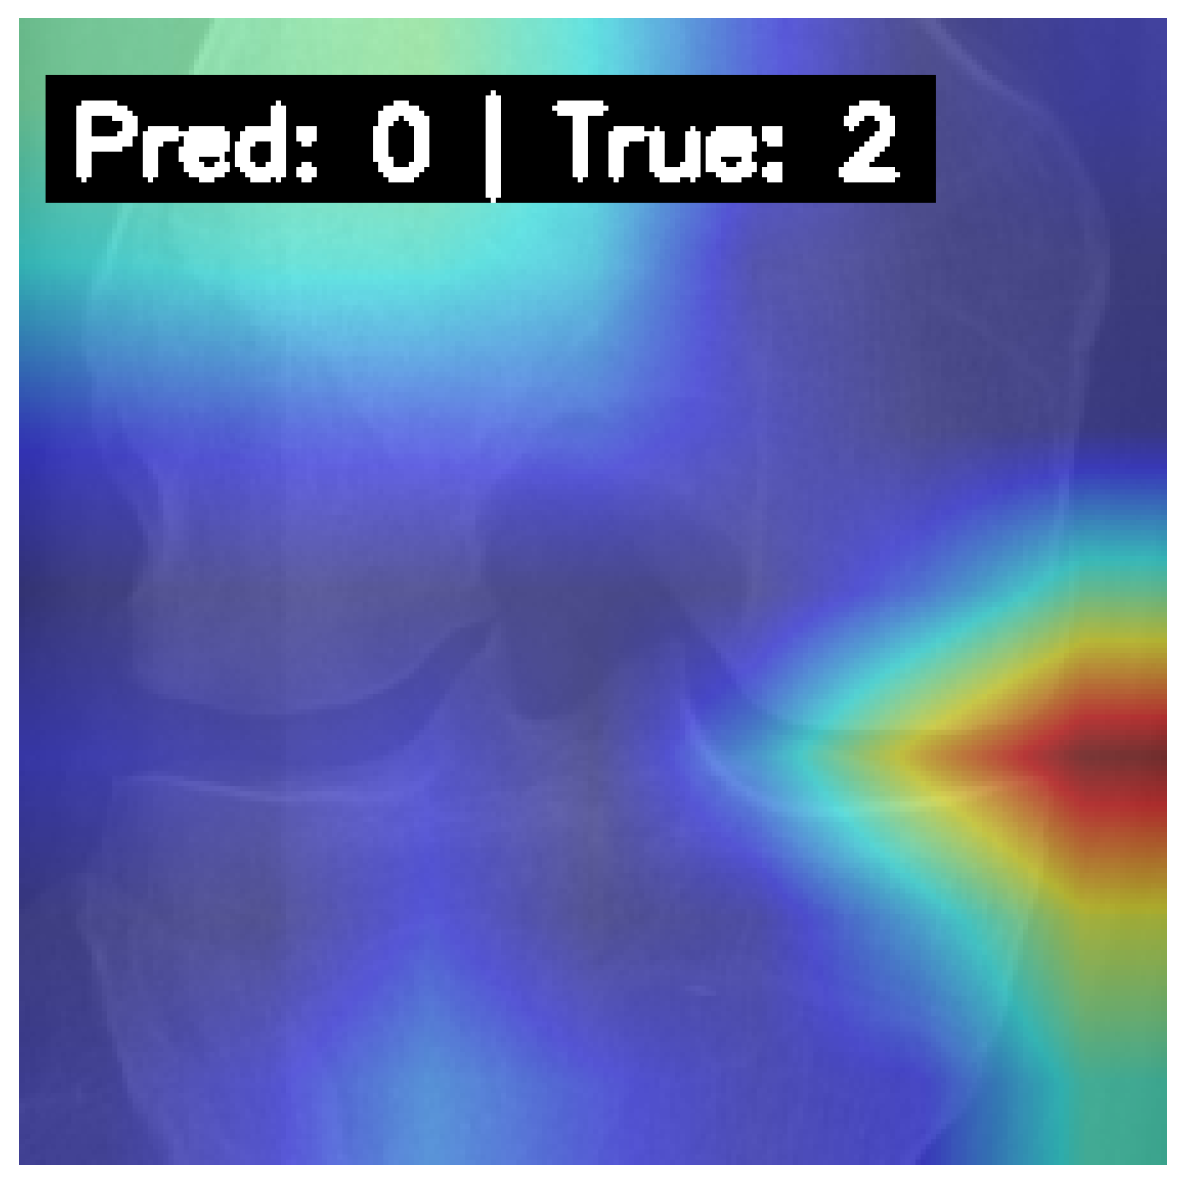
- We apply Grad-CAM to visualize and interpret the model’s decision-making process, showing that it consistently focuses on medically relevant regions in correctly classified images.
2. Literature Review
2.1. Evolution of Deep Learning Models for KOA Classification
2.2. Impact of Data Preprocessing, Augmentation, and Dataset Characteristics
2.3. Addressing Challenges and Future Directions in Automated KOA Assessment
2.4. Synthesis and Identified Research Gap
3. Methodology
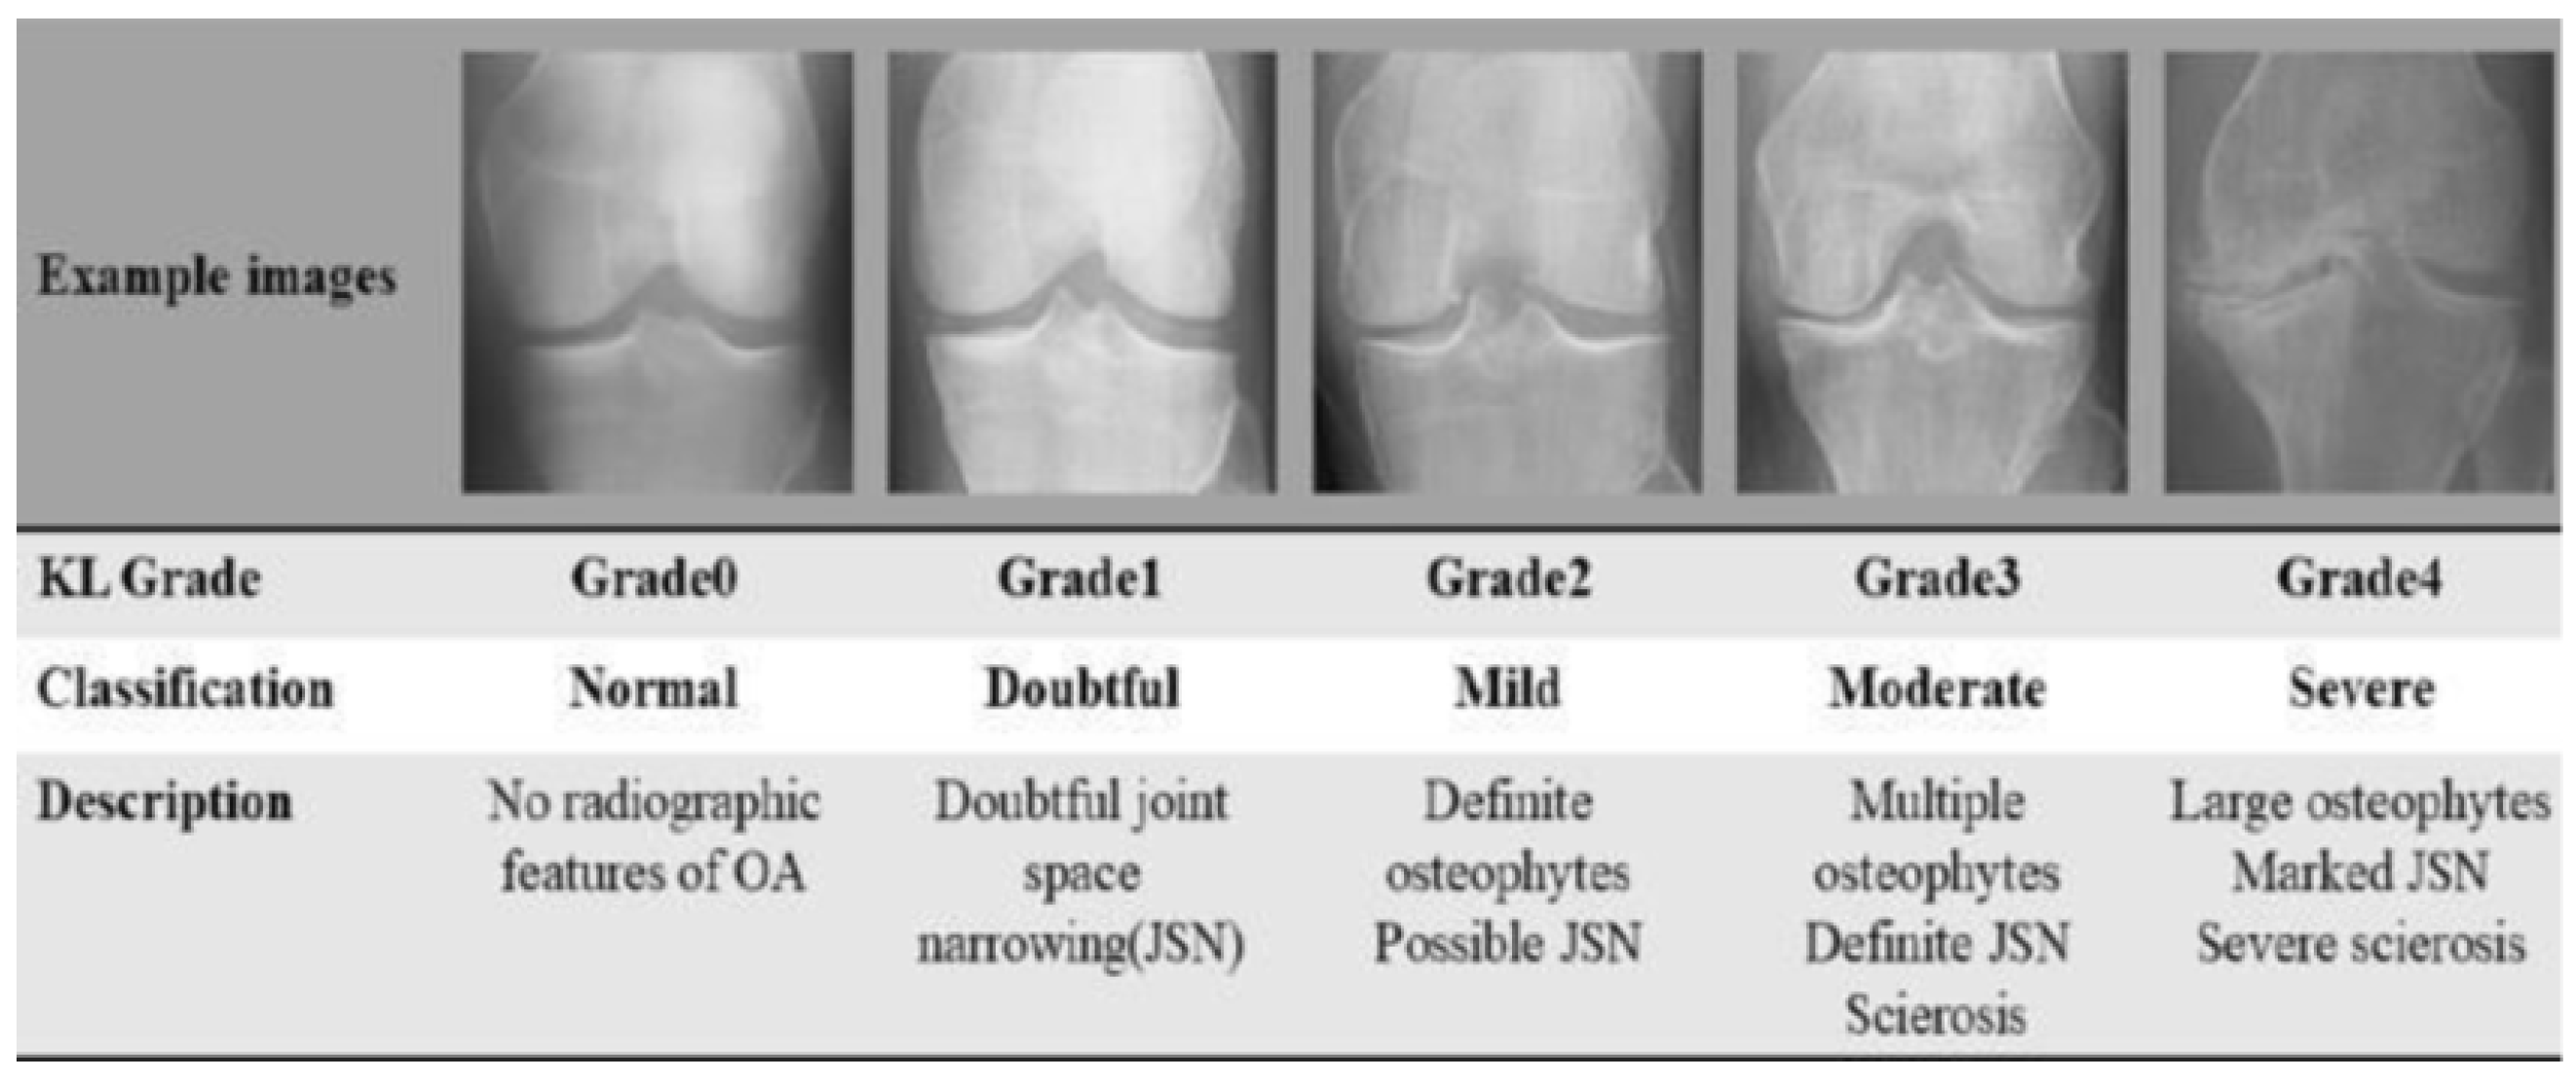
3.1. Dataset Acquisition and Characterization
- Training set (total original examples: 5780 images, with 4624 (80%) used after initial outlier check for Cleanlab input.
- –
- Grade 0 (Healthy): 2286 images
- –
- Grade 1 (Doubtful): 1046 images
- –
- Grade 2 (Minimal): 1516 images
- –
- Grade 3 (Moderate): 757 images
- –
- Grade 4 (Severe): 173 images
- Validation Set (Total examples: 826 images)
- –
- Grade 0 (Healthy): 328 images
- –
- Grade 1 (Doubtful): 153 images
- –
- Grade 2 (Minimal): 212 images
- –
- Grade 3 (Moderate): 106 images
- –
- Grade 4 (Severe): 27 images
- Test Set (Total examples: 1656 images)
- –
- Grade 0 (Healthy): 639 images
- –
- Grade 1 (Doubtful): 296 images
- –
- Grade 2 (Minimal): 447 images
- –
- Grade 3 (Moderate): 223 images
- –
- Grade 4 (Severe): 51 images
3.2. Data Preprocessing
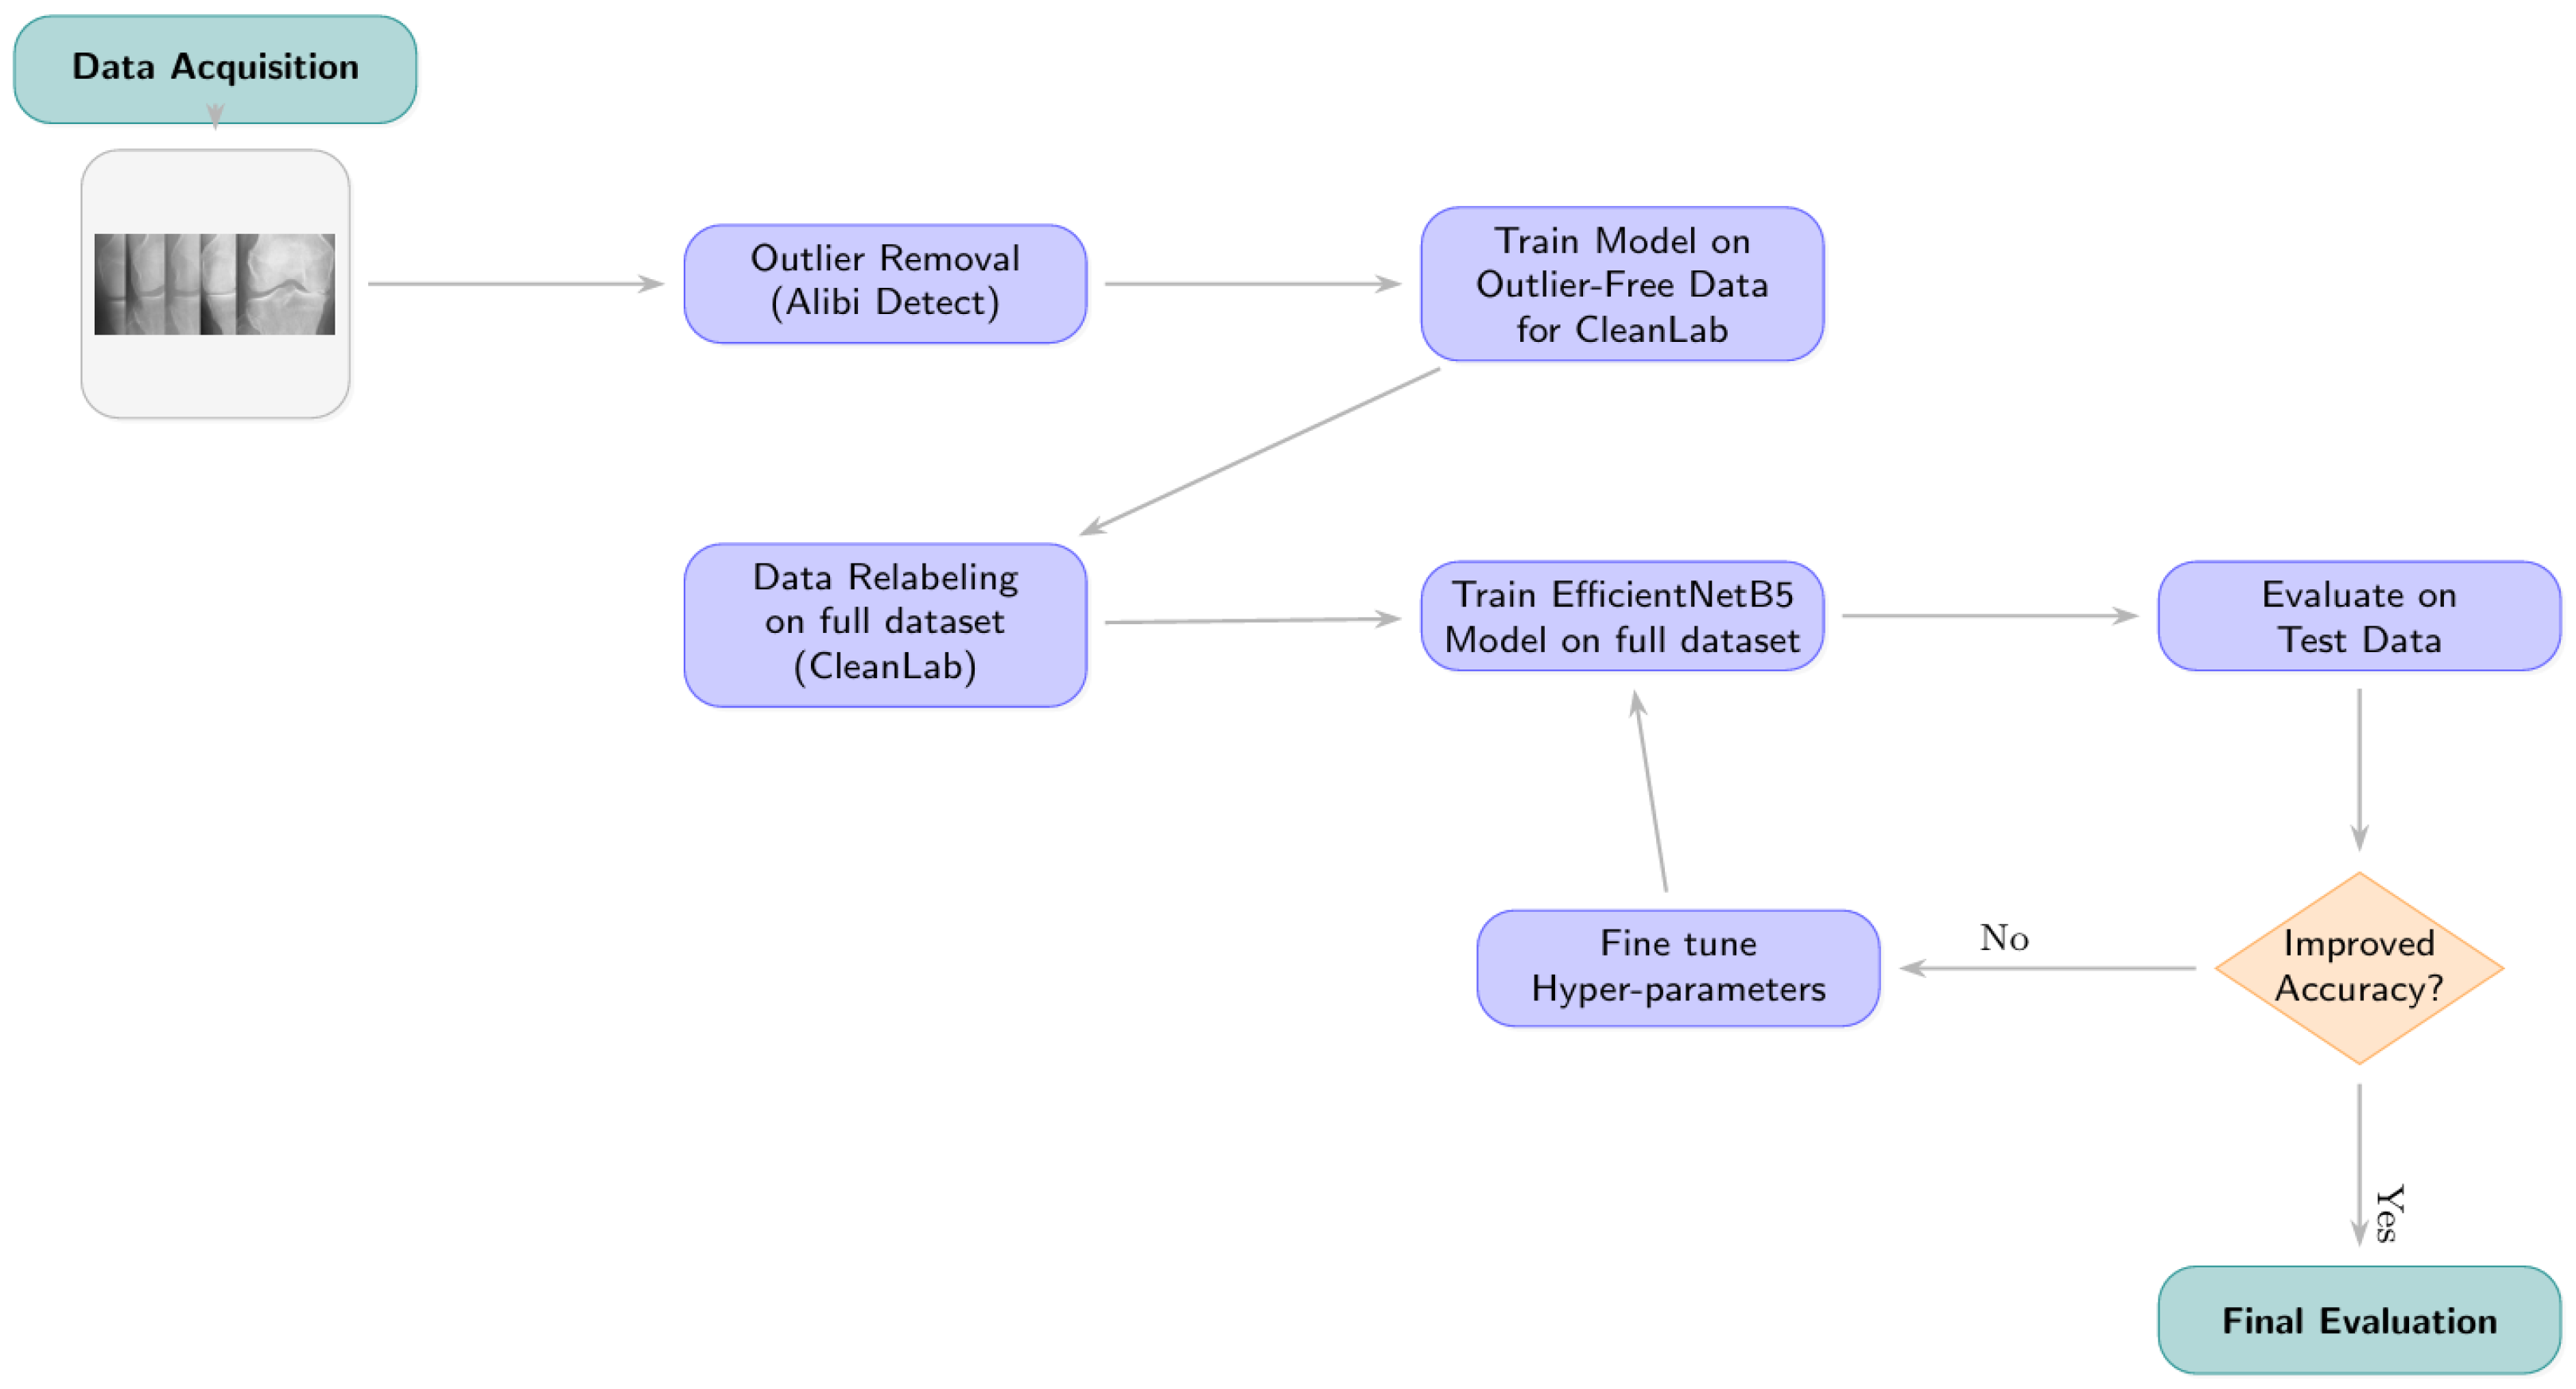
3.2.1. Phase 1: Outlier Detection and Removal
3.2.2. Phase 2: Label Correction with Cleanlab
- Model for Generating Inputs to Cleanlab: An initial EfficientNetB5 model (hereafter referred to as the “Cleanlab-input model”) was trained on the outlier-removed training data. This model architecture is detailed further in Section 3.3 but was trained using standard categorical cross-entropy without class weights for this specific preliminary stage. It was fine-tuned with dropout, batch normalization, and kernel regularizers.
- Generating Predictions and Embeddings: The trained Cleanlab-input model was used to generate out-of-sample predicted class probabilities and feature embeddings for all images in the (outlier-removed) training, validation, and test sets. Feature embeddings were extracted from the penultimate layer of this model. For generating these inputs, data generators were configured with ‘shuffle=False’ to maintain a one-to-one correspondence between predictions/embeddings and the original image files.
- Identifying Label Issues: The Datalab object from Cleanlab was initialized with the respective dataset partitions and their original labels. The find_issues method was then invoked, utilizing both the generated predicted probabilities and the feature embeddings as input.
- Relabeling Criterion and Implementation: Cleanlab’s get_issues(“label”) method provided a list of samples identified as potential label issues, along with a ‘predicted_label’ (Cleanlab’s suggested corrected label) for each. An image’s label was updated if its original ‘given_label’ differed from Cleanlab’s ‘predicted_label’. The relabeling was physically implemented by moving the image file to the directory corresponding to the Cleanlab-suggested class label.
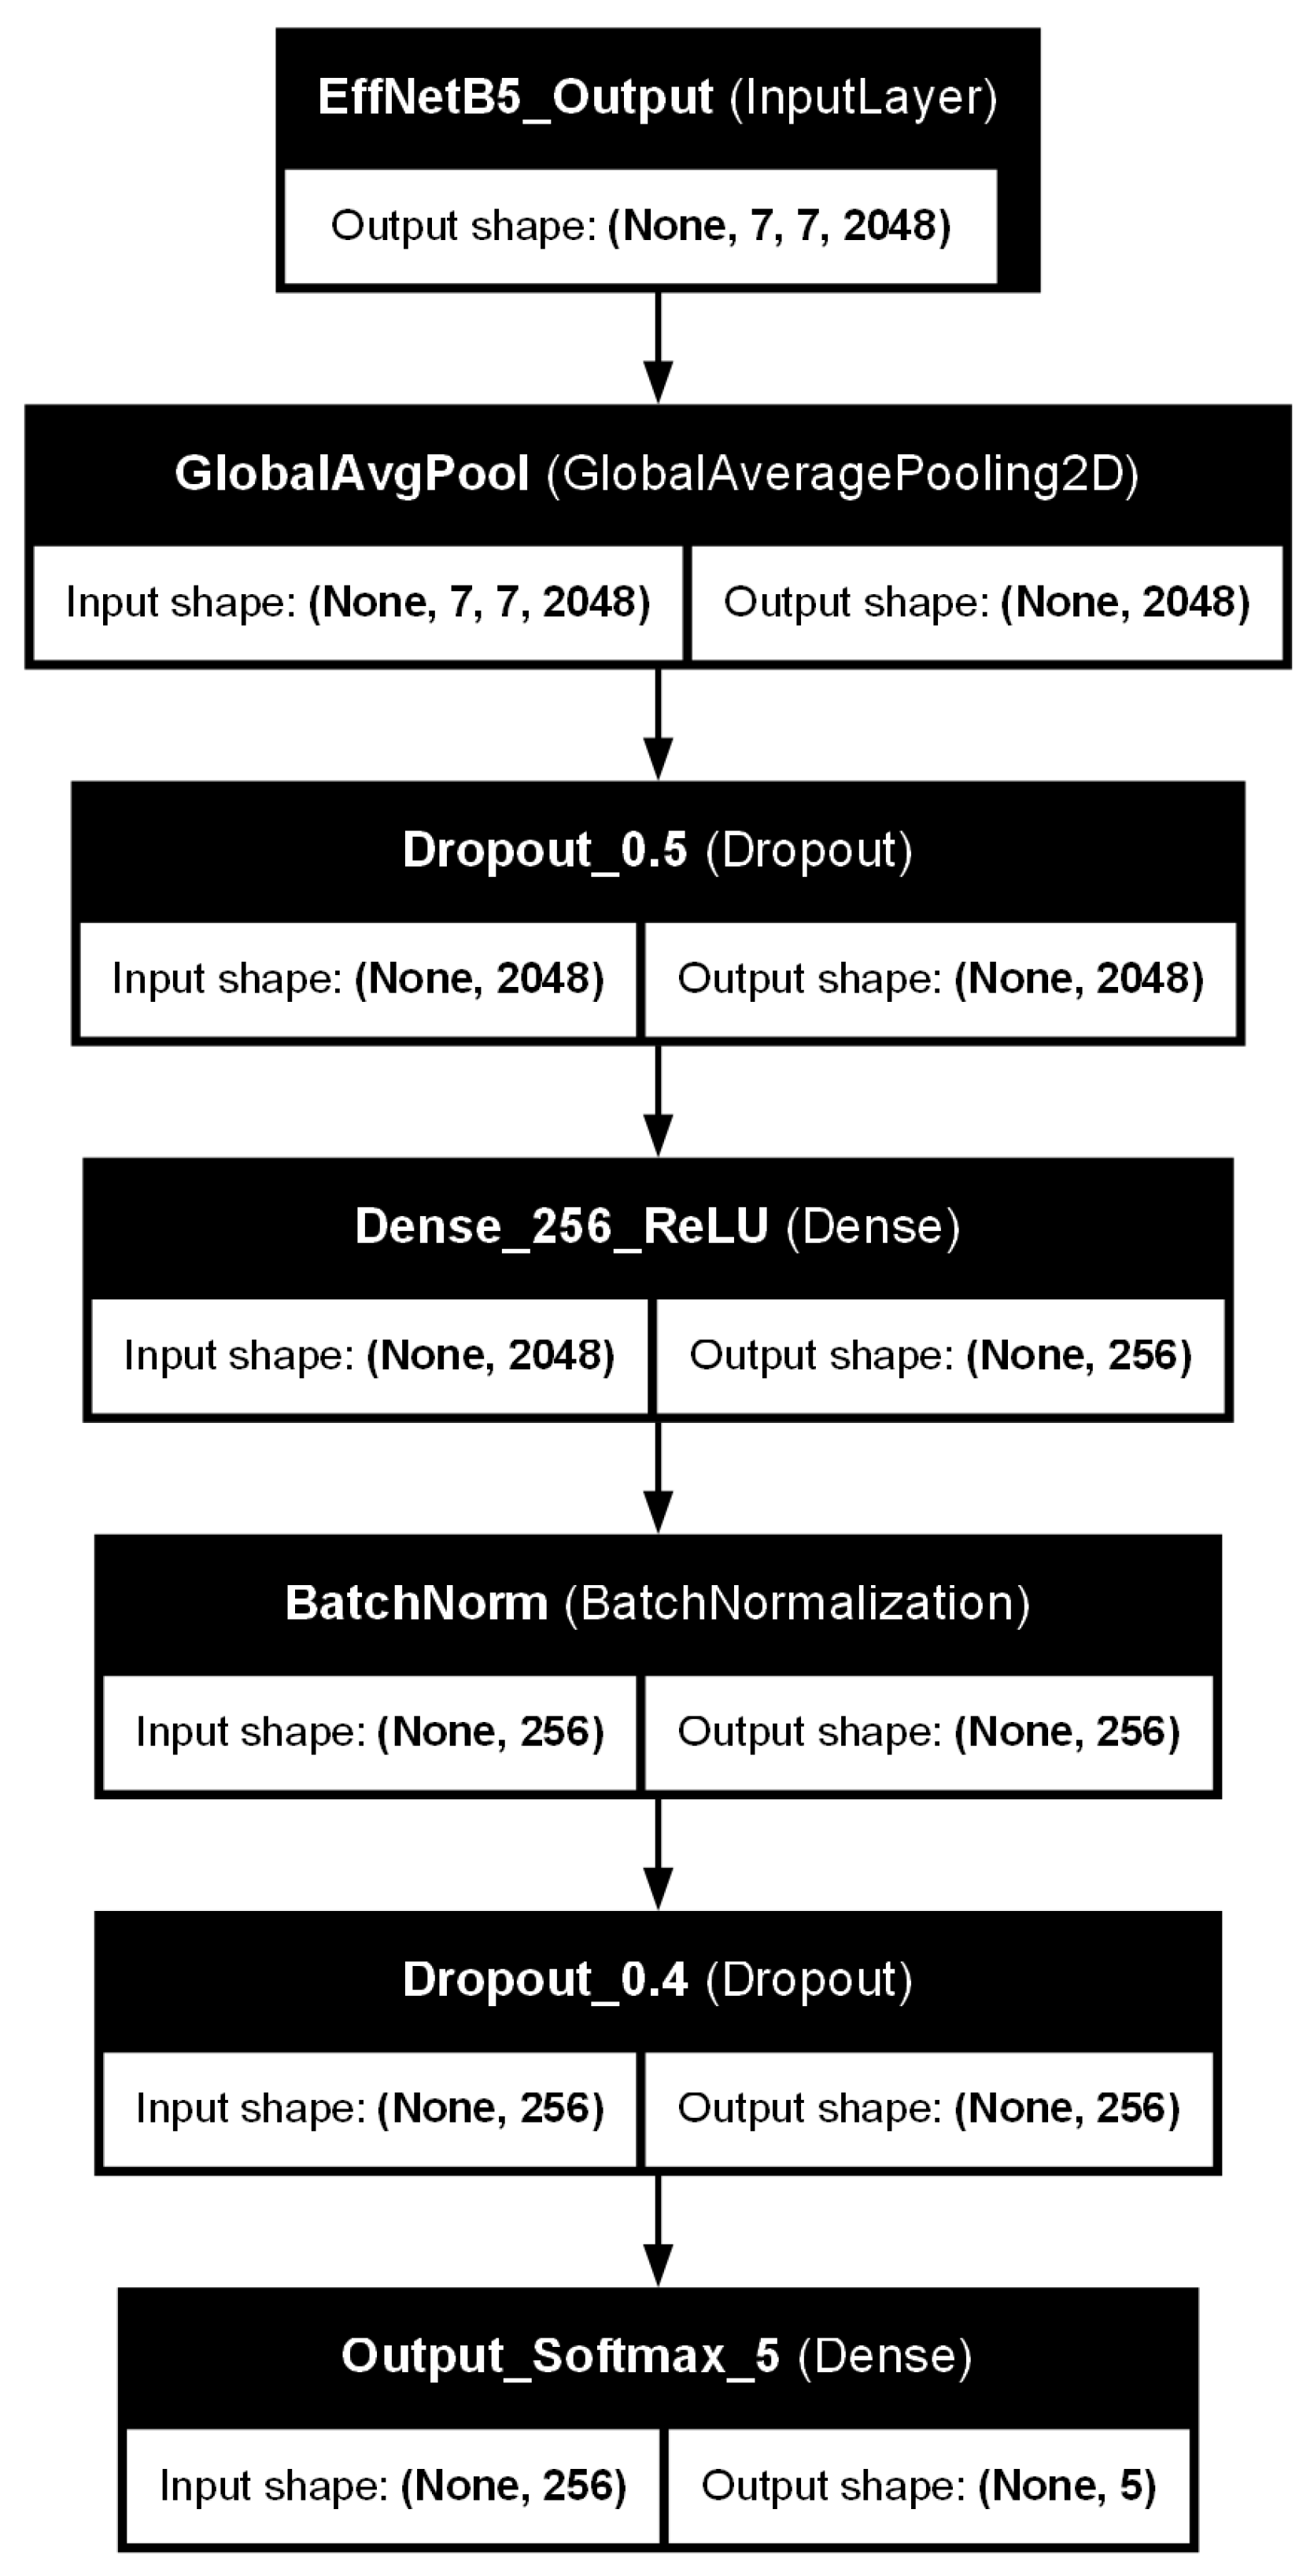
3.3. Model Architecture: EfficientNetB5 with Custom Classifier Head
- A Global Average Pooling 2D (GlobalAveragePooling2D) layer, which reduces the spatial dimensions of the feature maps from the EfficientNetB5 base.
- A dropout layer with a rate of 0.5, introduced to mitigate overfitting by randomly deactivating neurons during training.
- A Dense (fully connected) layer with 256 units, employing a Rectified Linear Unit (ReLU) activation function. kernel regularization was applied to this layer to further penalize large weights and prevent overfitting.
- A batch normalization layer, applied after the dense layer and before the subsequent dropout, to stabilize the training process and improve generalization by normalizing the activations.
- A second dropout layer with a rate of 0.4, providing an additional stage of regularization.
- A final Dense output layer with 5 units, corresponding to the five KL grades. This layer uses a Softmax activation function to produce a probability distribution over the classes.
3.4. Final Model Training and Optimization
- Data Augmentation: To enhance model robustness and reduce the risk of overfitting to the training data, on-the-fly data augmentation was applied during training. This included random horizontal flipping of images and random rotations (e.g., within a range of degrees).
- Learning Rate: A base learning rate () of was set for the Adam optimizer. This relatively small learning rate encourages more stable convergence, which is particularly important when fine-tuning pre-trained models [22,23]. The conceptual importance of learning rate selection is illustrated in Figure 7.
- Loss Function and Class Weighting: Categorical cross-entropy was employed as the loss function. To address the inherent class imbalance in the KOA dataset, class weights were incorporated into the loss function during training. These weights were calculated as inversely proportional to the class frequencies observed in the Cleanlab-remediated training set. This strategy assigns a higher penalty to misclassifications of underrepresented classes (e.g., KL Grade 4), thereby encouraging the model to learn more effectively from these minority classes.
- Batch Size: The batch size for training was dynamically determined based on the length of the training dataset, with an upper limit of 80 samples per batch.
- Epochs and Early Stopping: The model was set to train for a maximum of 50 epochs. An early stopping mechanism was implemented, monitoring the validation loss at the end of each epoch. If the validation loss did not show improvement for three consecutive epochs (patience = 3), the learning rate was decayed (e.g., by a factor of 0.2). Training was terminated if the learning rate fell to a minimum threshold of without any further improvement in validation loss, or if the 50-epoch limit was reached [24,25].

3.5. Performance Evaluation Metrics
- Accuracy: The proportion of all predictions that were correct.
- Precision: For each class, the proportion of true positive predictions among all instances predicted as that class.
- Recall (Sensitivity): For each class, the proportion of true positive predictions among all actual instances of that class.
- F1-score: The harmonic mean of Precision and Recall, calculated for each class.
3.6. Computational Complexity and Inference Efficiency
4. Results
4.1. Overall Model Performance
4.2. Training Dynamics
4.3. Impact of Data-Centric Preprocessing: Ablation Study
4.4. Cleanlab Relabeling Analysis
4.5. Class-Wise Performance Analysis
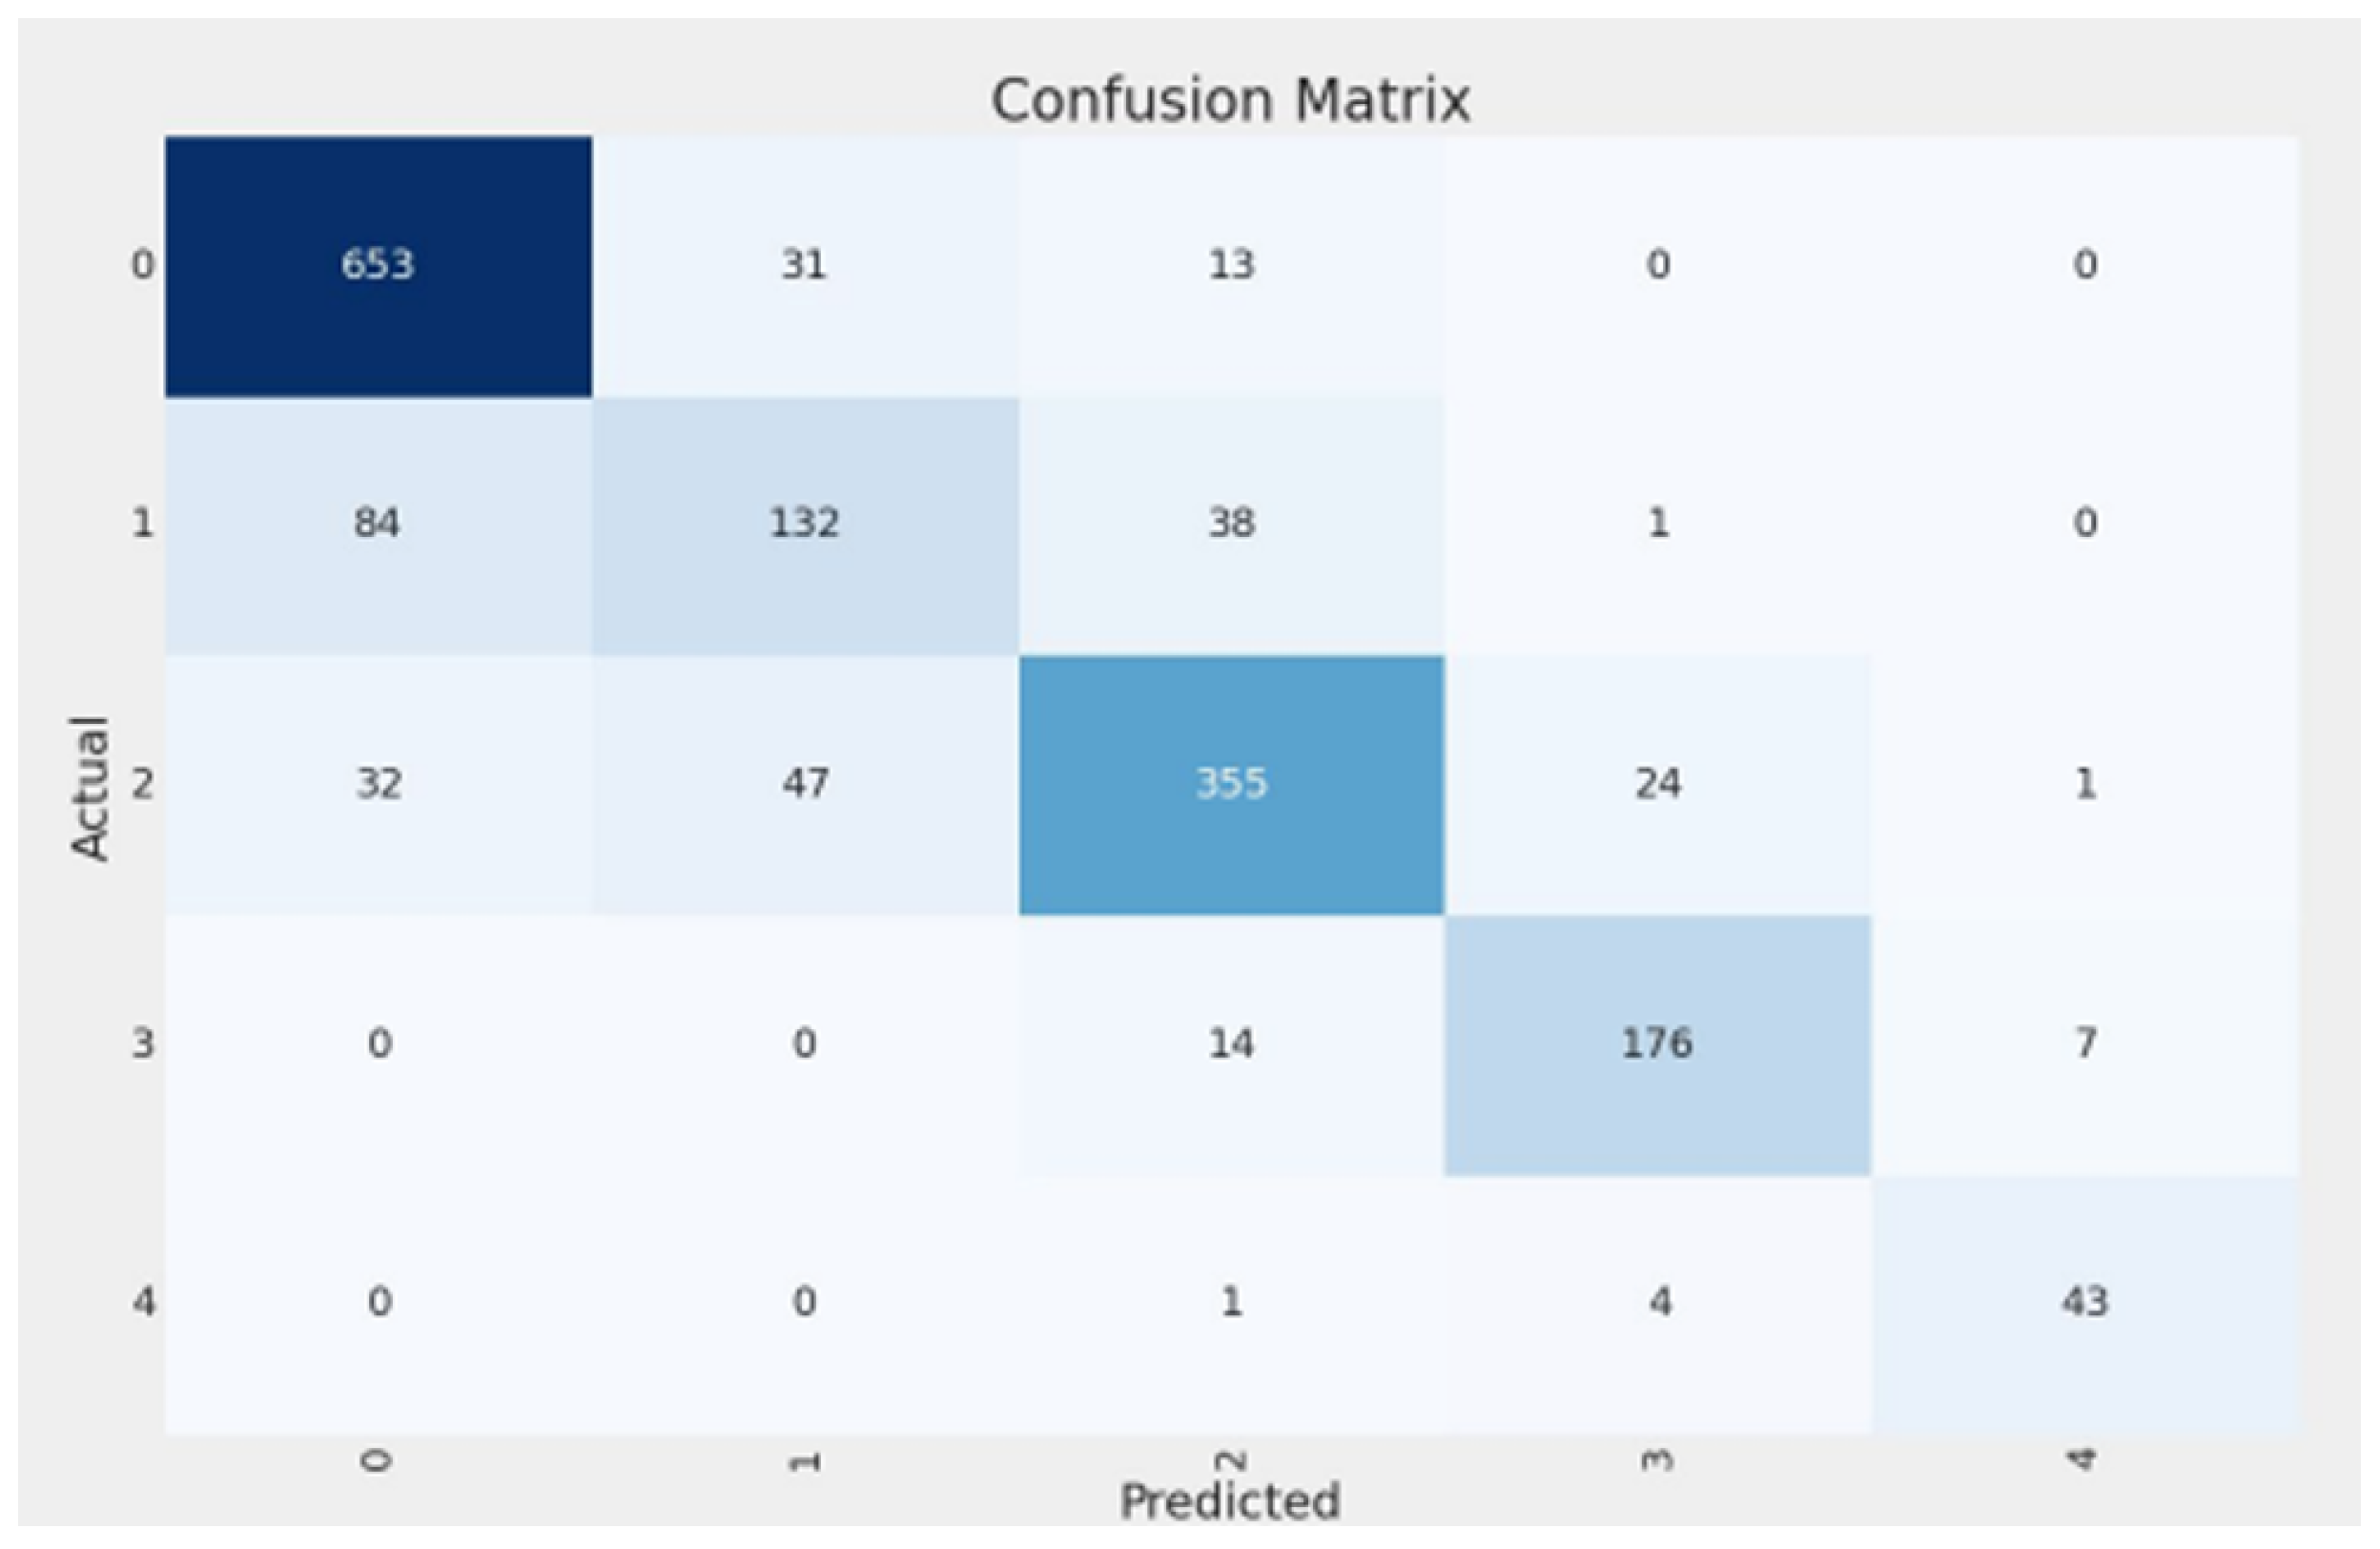
- Class 0 (Healthy): The model demonstrated excellent performance, achieving high precision (0.8492) and recall (0.9369). This indicates strong efficacy in correctly identifying healthy knees.
- Class 1 (Doubtful): This class proved most challenging, with the lowest precision (0.6286) and recall (0.5176). This aligns with the subjective nature of this grade and the significant relabeling activity observed by Cleanlab. Notably, Cleanlab’s intervention substantially improved recall for this class from an initial 0.28 (baseline model on original labels) to 0.5176 (final model on remediated labels).
- Classes 2-3 (Minimal, Moderate): The model performed robustly for these intermediate grades, with F1-scores of 0.8068 (Class 2) and 0.8756 (Class 3), indicating good capability in distinguishing these varying severities.
- Class 4 (Severe): Despite having the smallest support (48 samples in the remediated test set), the model achieved very high recall (0.8958) and precision (0.8431) for severe KOA cases. This is clinically important for identifying patients requiring urgent attention.
4.6. Model Interpretability with Grad-CAM
4.7. Comparison with Previous Studies
5. Discussion and Conclusions
5.1. Model Performance, Data-Centric Impact, and Clinical Implications
5.2. Challenges and Limitations
5.3. Future Research Directions
- Enhanced Dataset Curation and Validation: Further refinement of datasets, particularly for ambiguous Class 1 cases, is essential. This should involve multi-reader expert reviews to establish a consensus gold standard for borderline KOA. Additionally, validating the current model and future iterations on large-scale, multi-center external datasets (such as the Osteoarthritis Initiative (OAI) [29] or other clinical repositories) is a critical next step to confirm generalizability.
- Advanced Model Architectures and Strategies: Explore sophisticated ensemble methods or multi-stage classification systems specifically designed to improve accuracy for challenging, ambiguous cases. For instance, a hierarchical approach could first distinguish healthy from osteoarthritic knees, followed by a dedicated model for fine-grained severity grading. Investigating 3D convolutional neural networks, if multiple X-ray views or volumetric data (e.g., CT and MRI) are considered, could also leverage richer spatial information [30].
- Broader Clinical Validation and Utility Studies: Conduct comprehensive clinical validation studies to assess the model’s performance and utility in real-world radiological practice. This includes evaluating its impact on diagnostic agreement among radiologists and its potential to predict osteoarthritis progression over time using longitudinal data [31].
- Integration of Multimodal Data: Future iterations could benefit from incorporating additional data sources, such as patient demographics, clinical symptoms, serological markers, or other imaging modalities (e.g., MRI), to develop a more holistic and potentially more accurate diagnostic and prognostic tool for KOA.
- Federated Learning for Collaborative Research: Explore federated learning approaches to train more robust and generalizable models on diverse datasets from multiple institutions without compromising patient data privacy, which is particularly relevant for medical imaging tasks.
5.4. Overall Impact and Outlook
Author Contributions
Funding
Institutional Review Board Statement
Informed Consent Statement
Data Availability Statement
Acknowledgments
Conflicts of Interest
References
- Hsu, H.; Siwiec, R.M. Knee Osteoarthritis; StatPearls Publishing: Treasure Island, FL, USA, 2024. Available online: https://www.ncbi.nlm.nih.gov/books/NBK507884/ (accessed on 26 June 2024).
- Klara, K.; Collins, J.E.; Gurary, E.; Elman, S.A.; Stenquist, D.S.; Losina, E.; Katz, J.N. Reliability and Accuracy of Cross-sectional Radiographic Assessment of Severe Knee Osteoarthritis: Role of Training and Experience. J. Rheumatol. 2016, 43, 1421–1426. [Google Scholar] [CrossRef] [PubMed]
- Swati; Singh, A.; Wadhwa, K.; Singh, S. Effectiveness of Physiotherapy Interventions Following Primary Unilateral Total Knee Arthroplasty: A Systematic Review of Randomised Controlled Trials. Eur. J. Mol. Clin. Med. 2022, 9, 7796–7834. [Google Scholar]
- O’Shea, K.; Nash, R. An Introduction to Convolutional Neural Networks. arXiv 2015, arXiv:1511.08458. [Google Scholar]
- Tan, M.; Le, Q.V. EfficientNet: Rethinking Model Scaling for Convolutional Neural Networks. arXiv 2019, arXiv:1905.11946. [Google Scholar]
- IBM. What Is Transfer Learning? Available online: https://www.ibm.com/think/topics/transfer-learning (accessed on 1 August 2024).
- CleanLab. CleanLab Blog: Learn Data Curation. Available online: https://cleanlab.ai/blog/learn/data-curation/ (accessed on 19 July 2024).
- Thomas, K.A.; Kidziński, Ł.; Halilaj, E.; Fleming, S.L.; Venkataraman, G.R.; Oei, E.H.G.; Gold, G.E.; Delp, S.L. Automated Classification of Radiographic Knee Osteoarthritis Severity Using Deep Neural Networks. Available online: https://www.ncbi.nlm.nih.gov/pmc/articles/PMC7104788/ (accessed on 15 November 2024).
- Salehi, A.W.; Khan, S.; Gupta, G.; Alabduallah, B.I.; Almjally, A.; Alsolai, H.; Siddiqui, T.; Mellit, A. A Study of CNN and Transfer Learning in Medical Imaging: Advantages, Challenges, Future Scope. Sustainability 2023, 15, 5930. [Google Scholar] [CrossRef]
- Parikh, R.; More, S.; Kadam, N.; Mehta, Y.; Panchal, H.; Nimonkar, H. A Transfer Learning Approach for Classification of Knee Osteoarthritis. In Proceedings of the 2023 Second International Conference on Electrical, Electronics, Information and Communication Technologies (ICEEICT), Trichirappalli, India, 5–7 April 2023; pp. 1–5. [Google Scholar] [CrossRef]
- Mohammed, A.S.; Hasanaath, A.A.; Latif, G.; Bashar, A. Knee Osteoarthritis Detection and Severity Classification Using Residual Neural Networks on Preprocessed X-ray Images. Diagnostics 2023, 13, 1380. [Google Scholar] [CrossRef] [PubMed]
- Solak, F.Z. Classification of Knee Osteoarthritis Severity by Transfer Learning from X-Ray Images. Karaelmas Fen MüHendislik Derg. 2024, 14, 119–133. [Google Scholar] [CrossRef]
- Alshamrani, H.A.; Rashid, M.; Alshamrani, S.S.; Alshehri, A.H.D. Osteo-NeT: An Automated System for Predicting Knee Osteoarthritis from X-ray Images Using Transfer-Learning-Based Neural Networks Approach. Healthcare 2023, 11, 1206. [Google Scholar] [CrossRef] [PubMed]
- Shourie, P.; Anand, V.; Gupta, S. A Sophisticated Method for X-Ray Image-Based Knee Osteoarthritis Diagnosis Utilising Moblienetv3 Large. In Proceedings of the 2023 Global Conference on Information Technologies and Communications (GCITC), Bangalore, India, 1–3 December 2023; pp. 1–5. [Google Scholar] [CrossRef]
- Singh, R.; Sharma, N.; Upadhyay, D.; Devliyal, S.; Gupta, R. A Fine-Tuned EfficientNet B5 Transfer Learning Model for the Classification of Knee Osteoarthritis. In Proceedings of the 2023 3rd International Conference on Smart Generation Computing, Communication and Networking (SMART GENCON), Bangalore, India, 29–31 December 2023; pp. 1–5. [Google Scholar] [CrossRef]
- Work, S. Knee Osteoarthritis Dataset with Severity Grading, 2023. Available online: https://www.kaggle.com/datasets/shashwatwork/knee-osteoarthritis-dataset-with-severity (accessed on 26 December 2024).
- Rieke, N.; Hancox, J.; Li, W.; Antaki, F.; Furst, M.; Gloukhova, L.; Graf, H.; Koch, V.V.; Ling, Y.; Mehra, S.; et al. The future of digital health with federated learning. NPJ Digit. Med. 2020, 3, 119. [Google Scholar] [CrossRef] [PubMed]
- Van Looveren, A.; Vacanti, G.; Klaise, J.; Coca, A. Seldon Technologies. Alibi Detect: Algorithms for Outlier, Adversarial and Drift Detection. Available online: https://docs.seldon.io/projects/alibi-detect/en/latest/ (accessed on 19 July 2024).
- Deng, J.; Dong, W.; Socher, R.; Li, L.J.; Li, K.; Fei-Fei, L. ImageNet: A large-scale hierarchical image database. In Proceedings of the 2009 IEEE Conference on Computer Vision and Pattern Recognition, Miami, FL, USA, 20–25 June 2009. [Google Scholar] [CrossRef]
- Kingma, D.P.; Ba, J. Adam: A Method for Stochastic Optimization. arXiv 2017, arXiv:1412.6980. [Google Scholar]
- Shao, Y.; Wang, J.; Sun, H.; Yu, H.; Xing, L.; Zhao, Q.; Zhang, L. An Improved BGE-Adam Optimization Algorithm Based on Entropy Weighting and Adaptive Gradient Strategy. Symmetry 2024, 16, 623. [Google Scholar] [CrossRef]
- Girshick, R.; Donahue, J.; Darrell, T.; Malik, J. Rich feature hierarchies for accurate object detection and semantic segmentation. In Proceedings of the 2014 IEEE Conference on Computer Vision and Pattern Recognition, Columbus, OH, USA, 23–28 June 2014. [Google Scholar]
- Singh, A.; Ganguli, N. Unsupervised Deep Neural Network Approach To Solve Bosonic Systems. arXiv 2024, arXiv:2405.15488. [Google Scholar]
- Prechelt, L. Early Stopping—But When? In Neural Networks: Tricks of the Trade: Second Edition; Montavon, G., Orr, G.B., Müller, K.R., Eds.; Springer: Berlin/Heidelberg, Germany, 2012; pp. 53–67. [Google Scholar] [CrossRef]
- Cranmer, K.; Seljak, U.; Terao, K. Machine Learning. 2022. Available online: https://pdg.lbl.gov/2022/reviews/rpp2022-rev-machine-learning.pdf (accessed on 18 May 2025).
- Krittanawong, C.; Johnson, K.; Rosenson, R.; Wang, Z.; Aydar, M.; Baber, U.; Min, J.; Tang, W.; Halperin, J.; Narayan, S. Deep learning for cardiovascularmedicine: A practical primer. Eur. Heart J. 2019, 40, 2058–2073. [Google Scholar] [CrossRef] [PubMed]
- He, K.; Zhang, X.; Ren, S.; Sun, J. Deep Residual Learning for Image Recognition. arXiv 2015, arXiv:1512.03385. [Google Scholar]
- Howard, A.; Sandler, M.; Chen, B.; Wang, W.; Chen, L.C.; Tan, M.; Chu, G.; Vasudevan, V.; Zhu, Y.; Pang, R.; et al. Searching for MobileNetV3. In Proceedings of the 2019 IEEE/CVF International Conference on Computer Vision (ICCV), Seoul, Republic of Korea, 27 October–2 November 2019. [Google Scholar] [CrossRef]
- National Institute of Arthritis and Musculoskeletal and Skin Diseases (NIAMS). Osteoarthritis Initiative (OAI), 2024. Available online: https://www.niams.nih.gov/grants-funding/funded-research/osteoarthritis-initiative (accessed on 6 April 2025).
- Guida, C.; Zhang, M.; Shan, J. Knee Osteoarthritis Classification Using 3D CNN and MRI. Appl. Sci. 2021, 11, 5196. [Google Scholar] [CrossRef]
- Halilaj, E.; Le, Y.; Hicks, J.L.; Hastie, T.J.; Delp, S.L. Modeling and Predicting Osteoarthritis Progression: Data from the Osteoarthritis Initiative. Osteoarthr. Cartil. 2018, 26, 1643–1650. [Google Scholar] [CrossRef] [PubMed]




| Study | Model Type | Accuracy | Classes | Dataset Notes |
|---|---|---|---|---|
| [8] | CNN | 71% | 5 | 40,000 images (OAI dataset); compared against radiologists. |
| [10] | DenseNet-201 | 82.48% | 2 | 5478 images (Kaggle dataset) [16]; normal vs. osteoarthritis classification. |
| [14] | MobileNetV3 Large | 83% | 2 | 3836 images (Kaggle dataset) [16]; optimized for constrained devices. |
| [11] | ResNet101 | 69% | 5 | 9786 images (Kaggle dataset) [16]. |
| [13] | VGG-16 | 92% | 2 | 3836 images (Kaggle dataset) [16]; high accuracy with denoising and enhancement. |
| [12] | Xception | 67.8% | 5 | 8260 preprocessed images (Kaggle dataset) [16]. |
| [15] | EfficientNet B5 | 97% | 3 | Custom layers added; 1500 images. |
| Class/Average | Precision | Recall | F1-Score | Support (# of Samples) |
|---|---|---|---|---|
| 0 (Healthy) | 0.8492 | 0.9369 | 0.8909 | 697 |
| 1 (Doubtful) | 0.6286 | 0.5176 | 0.5677 | 255 |
| 2 (Minimal) | 0.8432 | 0.7734 | 0.8068 | 459 |
| 3 (Moderate) | 0.8585 | 0.8934 | 0.8756 | 197 |
| 4 (Severe) | 0.8431 | 0.8958 | 0.8687 | 48 |
| Macro Avg | 0.8045 | 0.8034 | 0.8019 | 1656 |
| Weighted Avg | 0.8145 | 0.8207 | 0.8154 | 1656 |
| Configuration | Accuracy (%) ↑ | Macro Prec. (%) ↑ | Macro Recall (%) ↑ | Macro F1 (%) ↑ |
|---|---|---|---|---|
| Baseline (trained and evaluated on original labels) | 66.36 | 68.36 | 57.87 | 60.23 |
| Final pipeline (trained and evaluated on CleanLab labels) | 82.07 | 80.45 | 80.34 | 80.19 |
| Study | Model Type | Accuracy (%) | Classes | Dataset Notes |
|---|---|---|---|---|
| [8] | CNN | 71 | 5 | 40,000 images (OAI dataset) |
| [11] | MobileNetV2 | 67 | 5 | 9786 images (Kaggle [16]) |
| [11] | ResNet101 | 69 | 5 | 9786 images (Kaggle [16]) |
| [11] | VGG16 | 66 | 5 | 9786 images (Kaggle [16]) |
| [11] | VGG19 | 64 | 5 | 9786 images (Kaggle [16]) |
| [11] | InceptionResNetV2 | 63 | 5 | 9786 images (Kaggle [16]) |
| [11] | DenseNet121 | 64 | 5 | 9786 images (Kaggle [16]) |
| [12] | Xception | 67.8 | 5 | 8260 preprocessed images (Kaggle [16]) |
| Our Approach (Final Pipeline) | EfficientNetB5 + Relabeled Dataset) | 82.07 | 5 | Cleanlab-remediated Kaggle [16] |
Disclaimer/Publisher’s Note: The statements, opinions and data contained in all publications are solely those of the individual author(s) and contributor(s) and not of MDPI and/or the editor(s). MDPI and/or the editor(s) disclaim responsibility for any injury to people or property resulting from any ideas, methods, instructions or products referred to in the content. |
© 2025 by the authors. Licensee MDPI, Basel, Switzerland. This article is an open access article distributed under the terms and conditions of the Creative Commons Attribution (CC BY) license (https://creativecommons.org/licenses/by/4.0/).
Share and Cite
Momenpour, T.; Abu Mallouh, A. Optimizing CNN-Based Diagnosis of Knee Osteoarthritis: Enhancing Model Accuracy with CleanLab Relabeling. Diagnostics 2025, 15, 1332. https://doi.org/10.3390/diagnostics15111332
Momenpour T, Abu Mallouh A. Optimizing CNN-Based Diagnosis of Knee Osteoarthritis: Enhancing Model Accuracy with CleanLab Relabeling. Diagnostics. 2025; 15(11):1332. https://doi.org/10.3390/diagnostics15111332
Chicago/Turabian StyleMomenpour, Thomures, and Arafat Abu Mallouh. 2025. "Optimizing CNN-Based Diagnosis of Knee Osteoarthritis: Enhancing Model Accuracy with CleanLab Relabeling" Diagnostics 15, no. 11: 1332. https://doi.org/10.3390/diagnostics15111332
APA StyleMomenpour, T., & Abu Mallouh, A. (2025). Optimizing CNN-Based Diagnosis of Knee Osteoarthritis: Enhancing Model Accuracy with CleanLab Relabeling. Diagnostics, 15(11), 1332. https://doi.org/10.3390/diagnostics15111332


