
Comparison of Cottle-Area-2 and Cottle-Area-3 in Computed Tomography Scans of Patients with Nasal Obstruction and Controls

 , , , and
Abstract
1. Introduction
2. Materials and Methods
2.1. Study Design
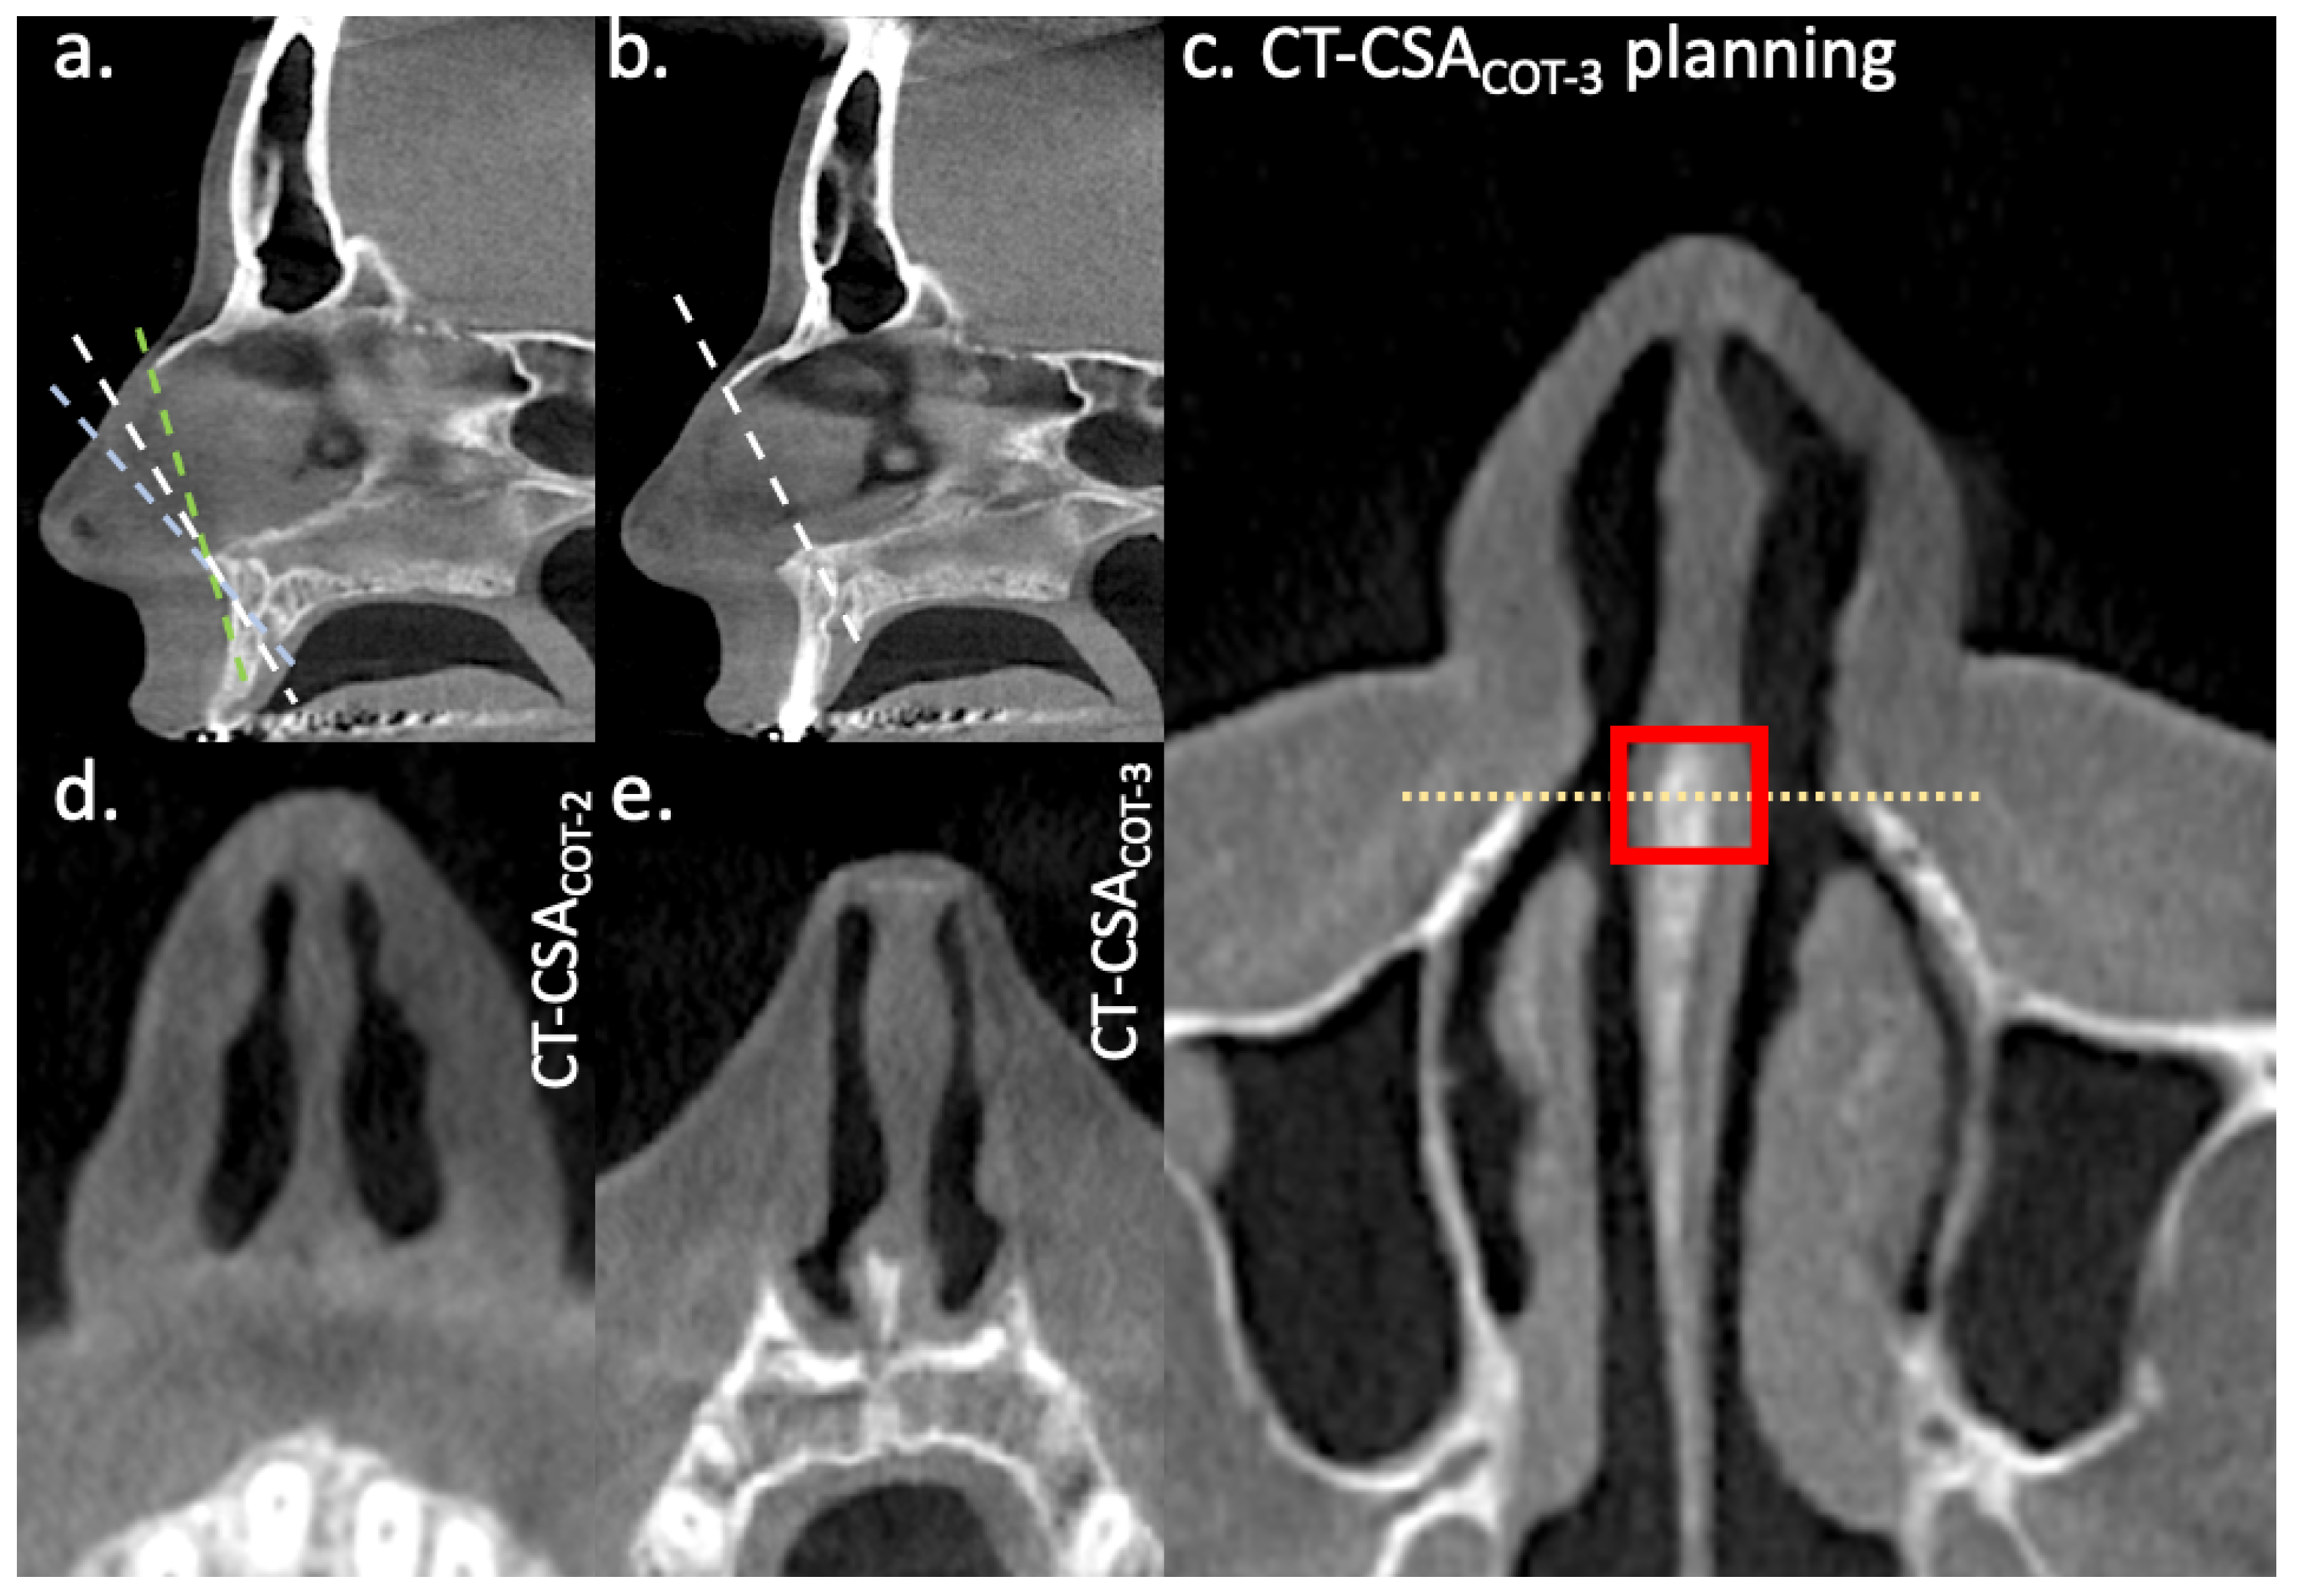
2.2. CT-Planes
2.3. Data Analysis
3. Results
3.1. Study Population
3.2. CT-CSA of Cottle-Area-2 and Cottle-Area-3
3.3. Narrow Cross-Sectional Areas
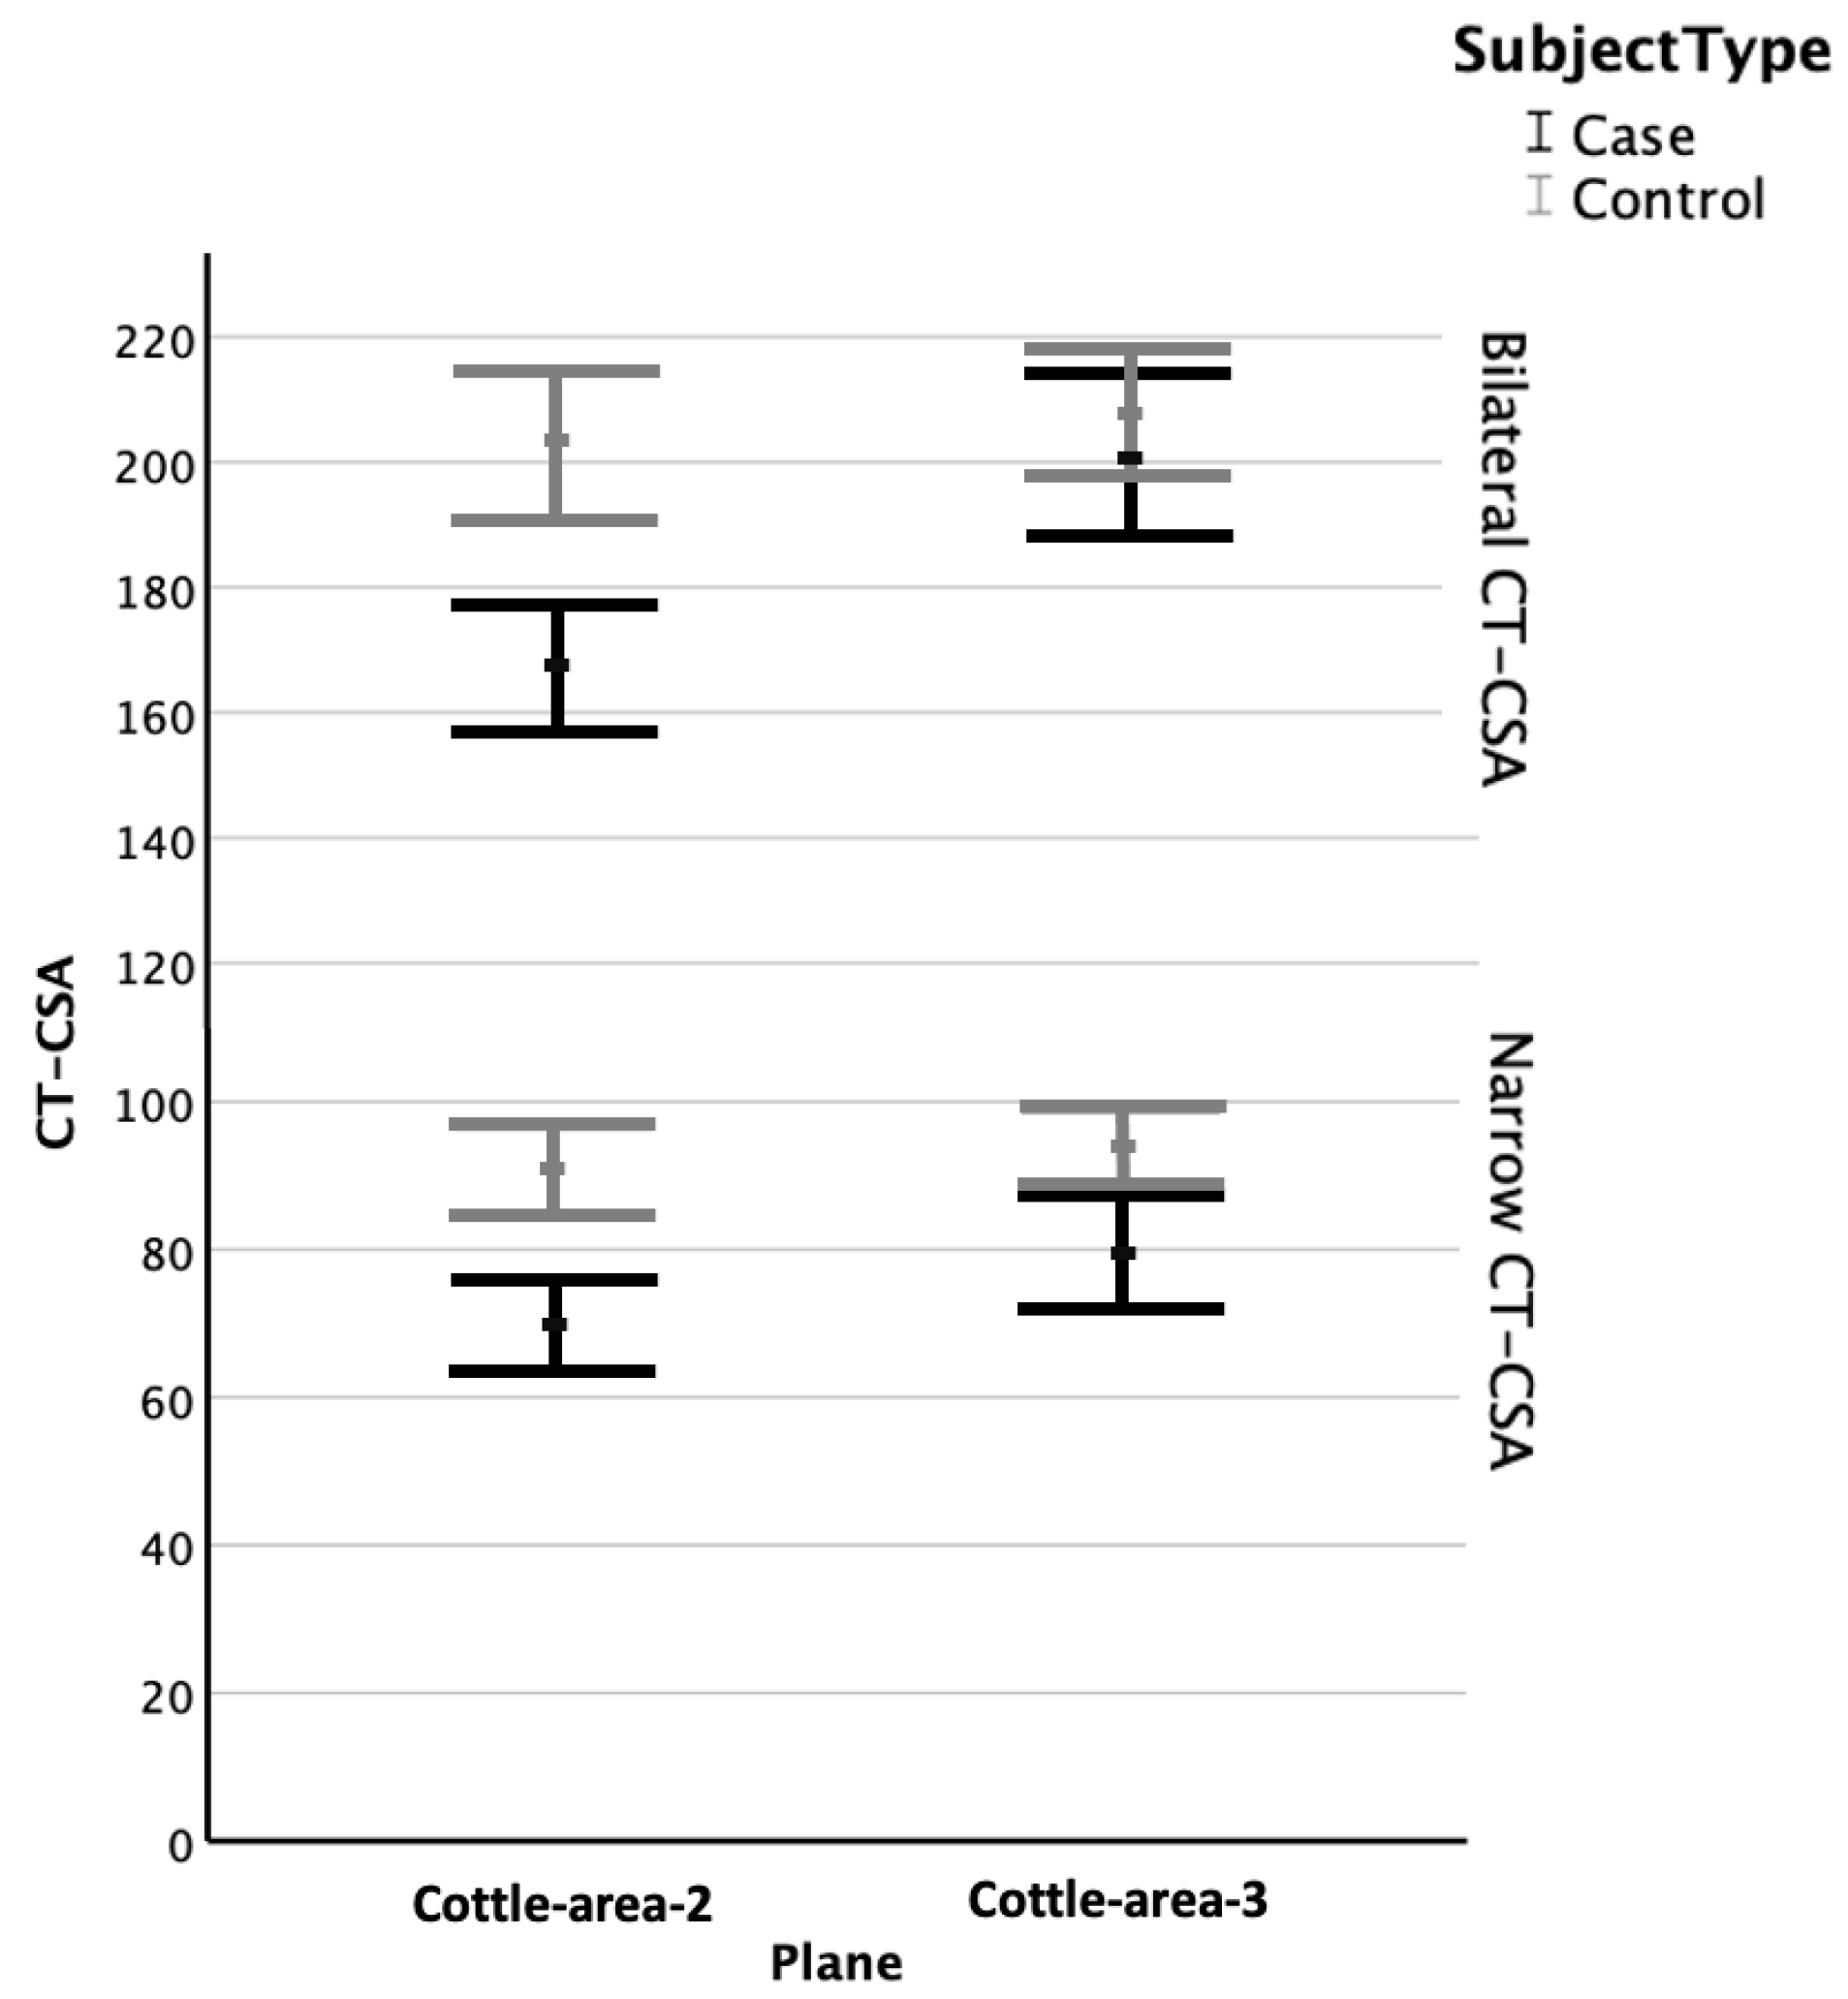
3.4. Bilateral Cross-Sectional Areas
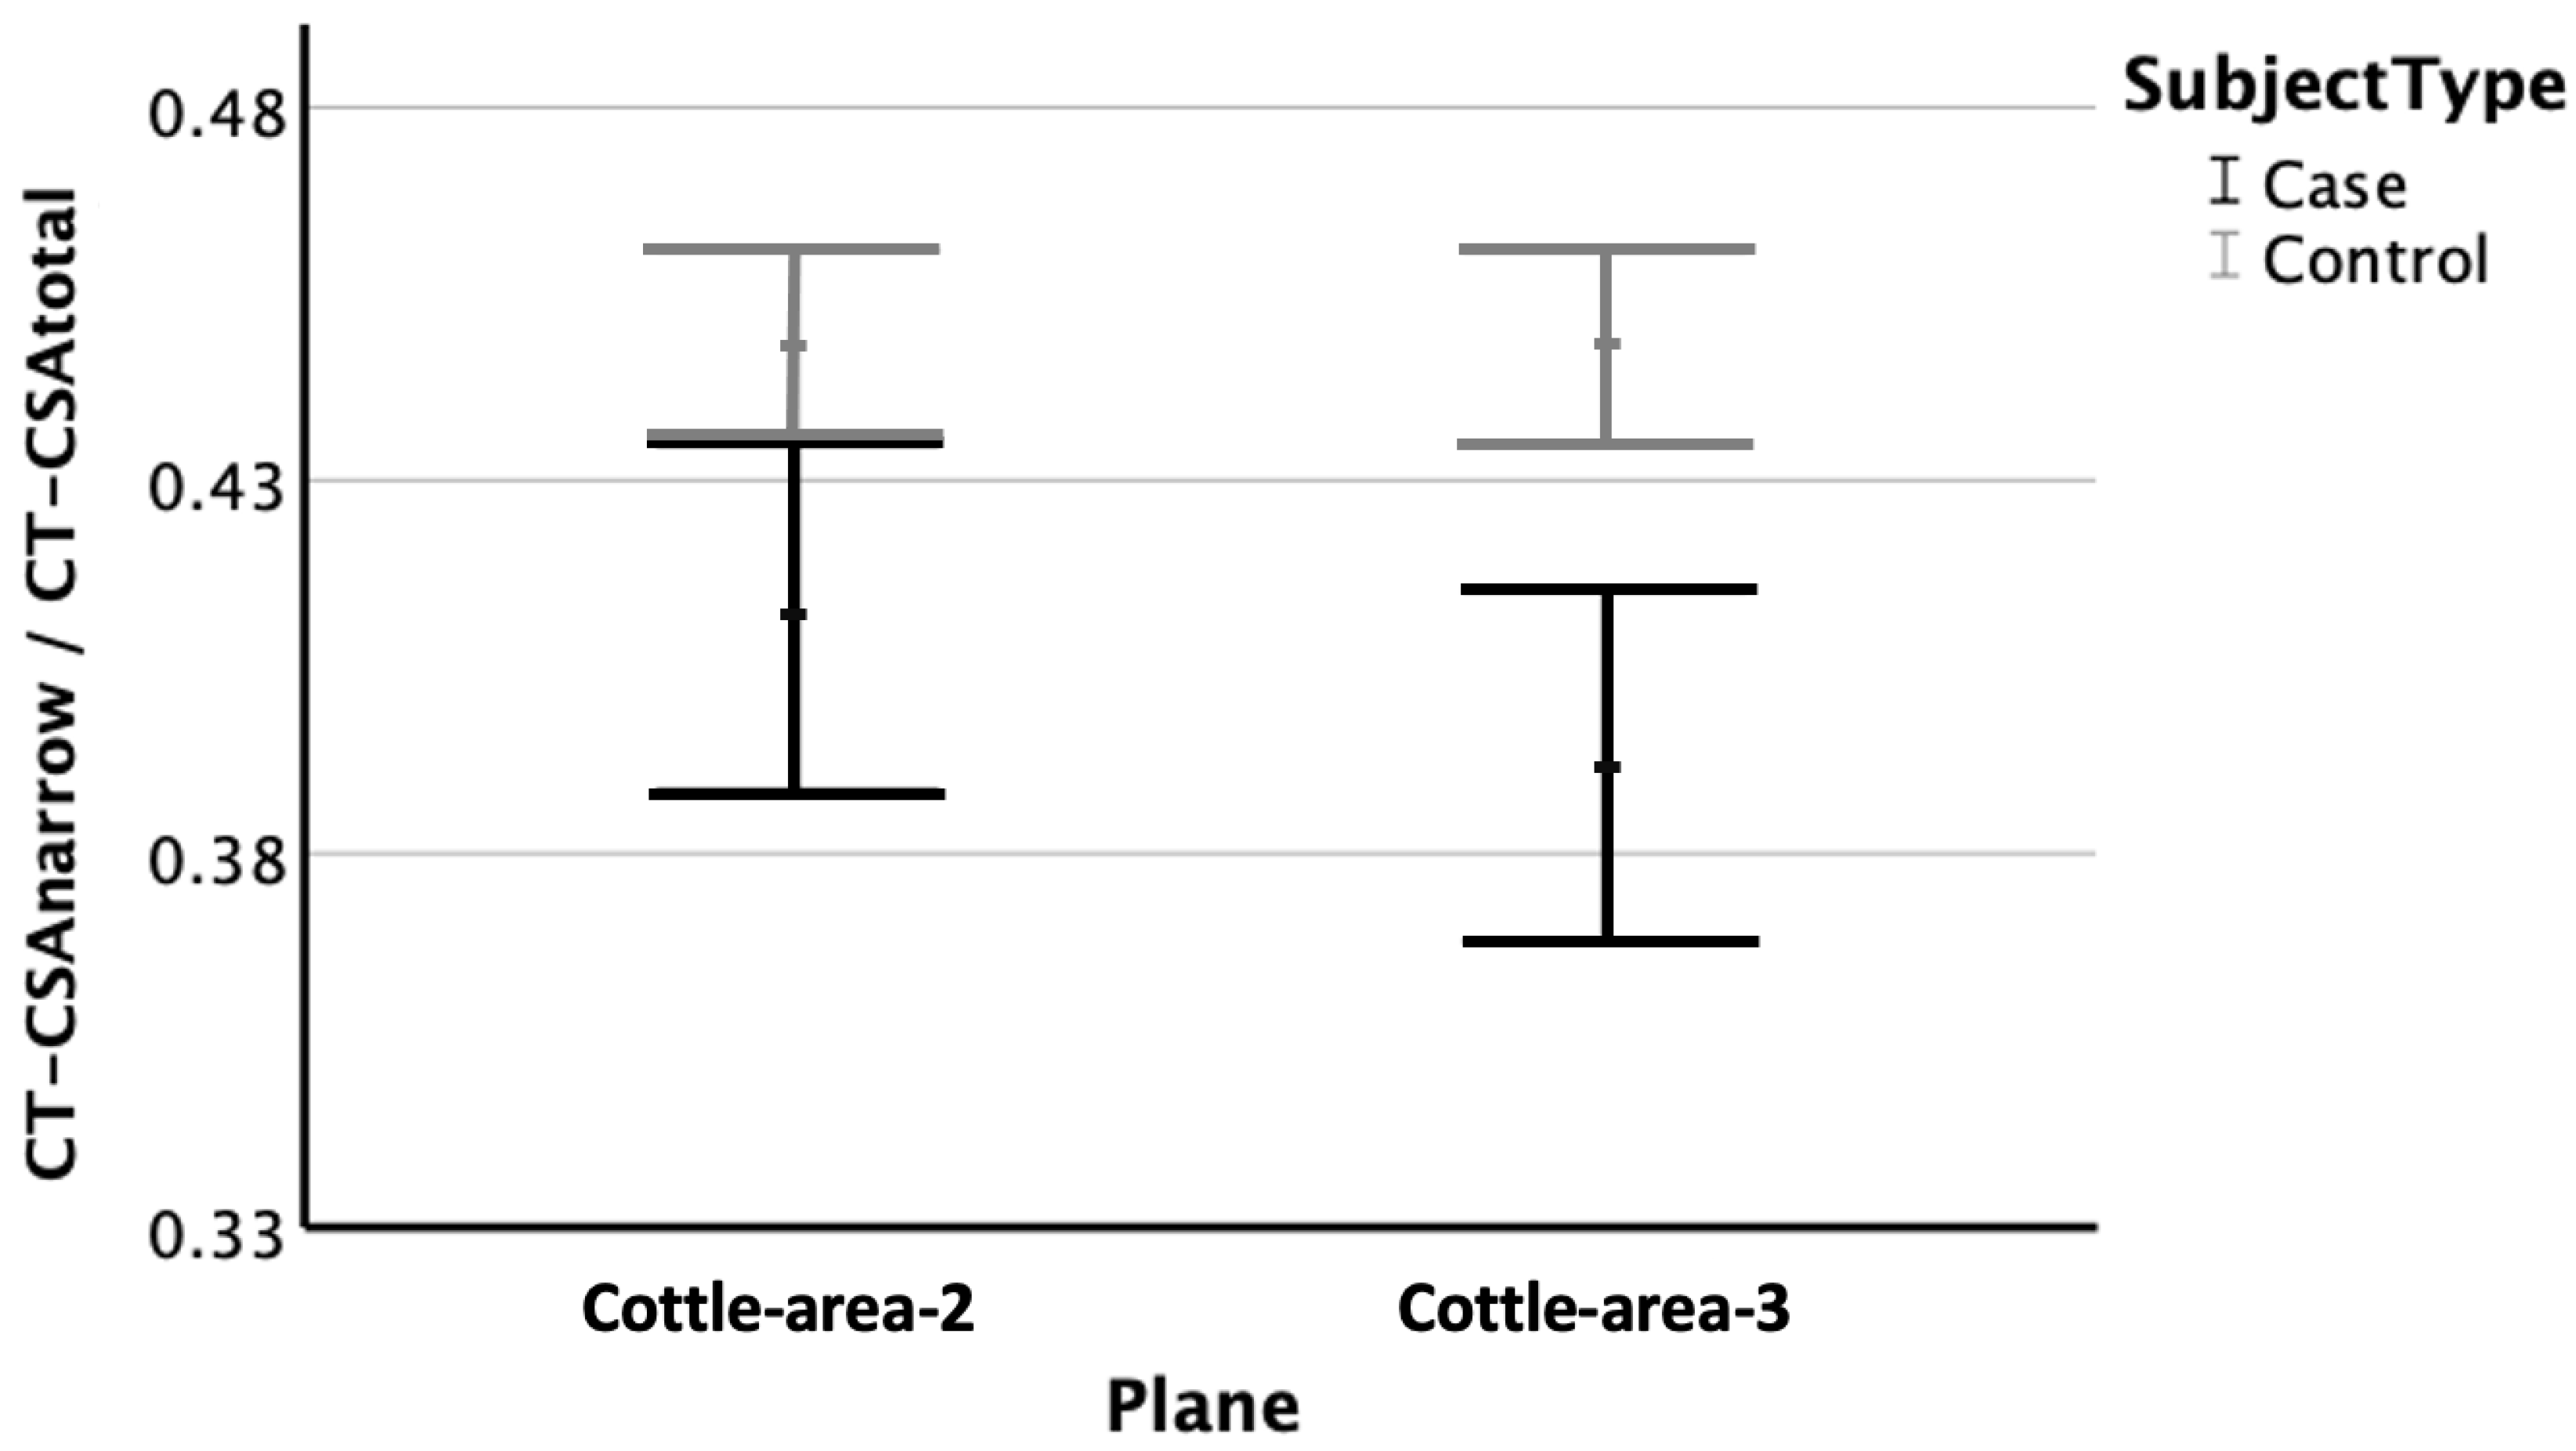
3.5. Ratio of Narrow Cross-Sectional Areas to Bilateral Cross-Sectional Areas
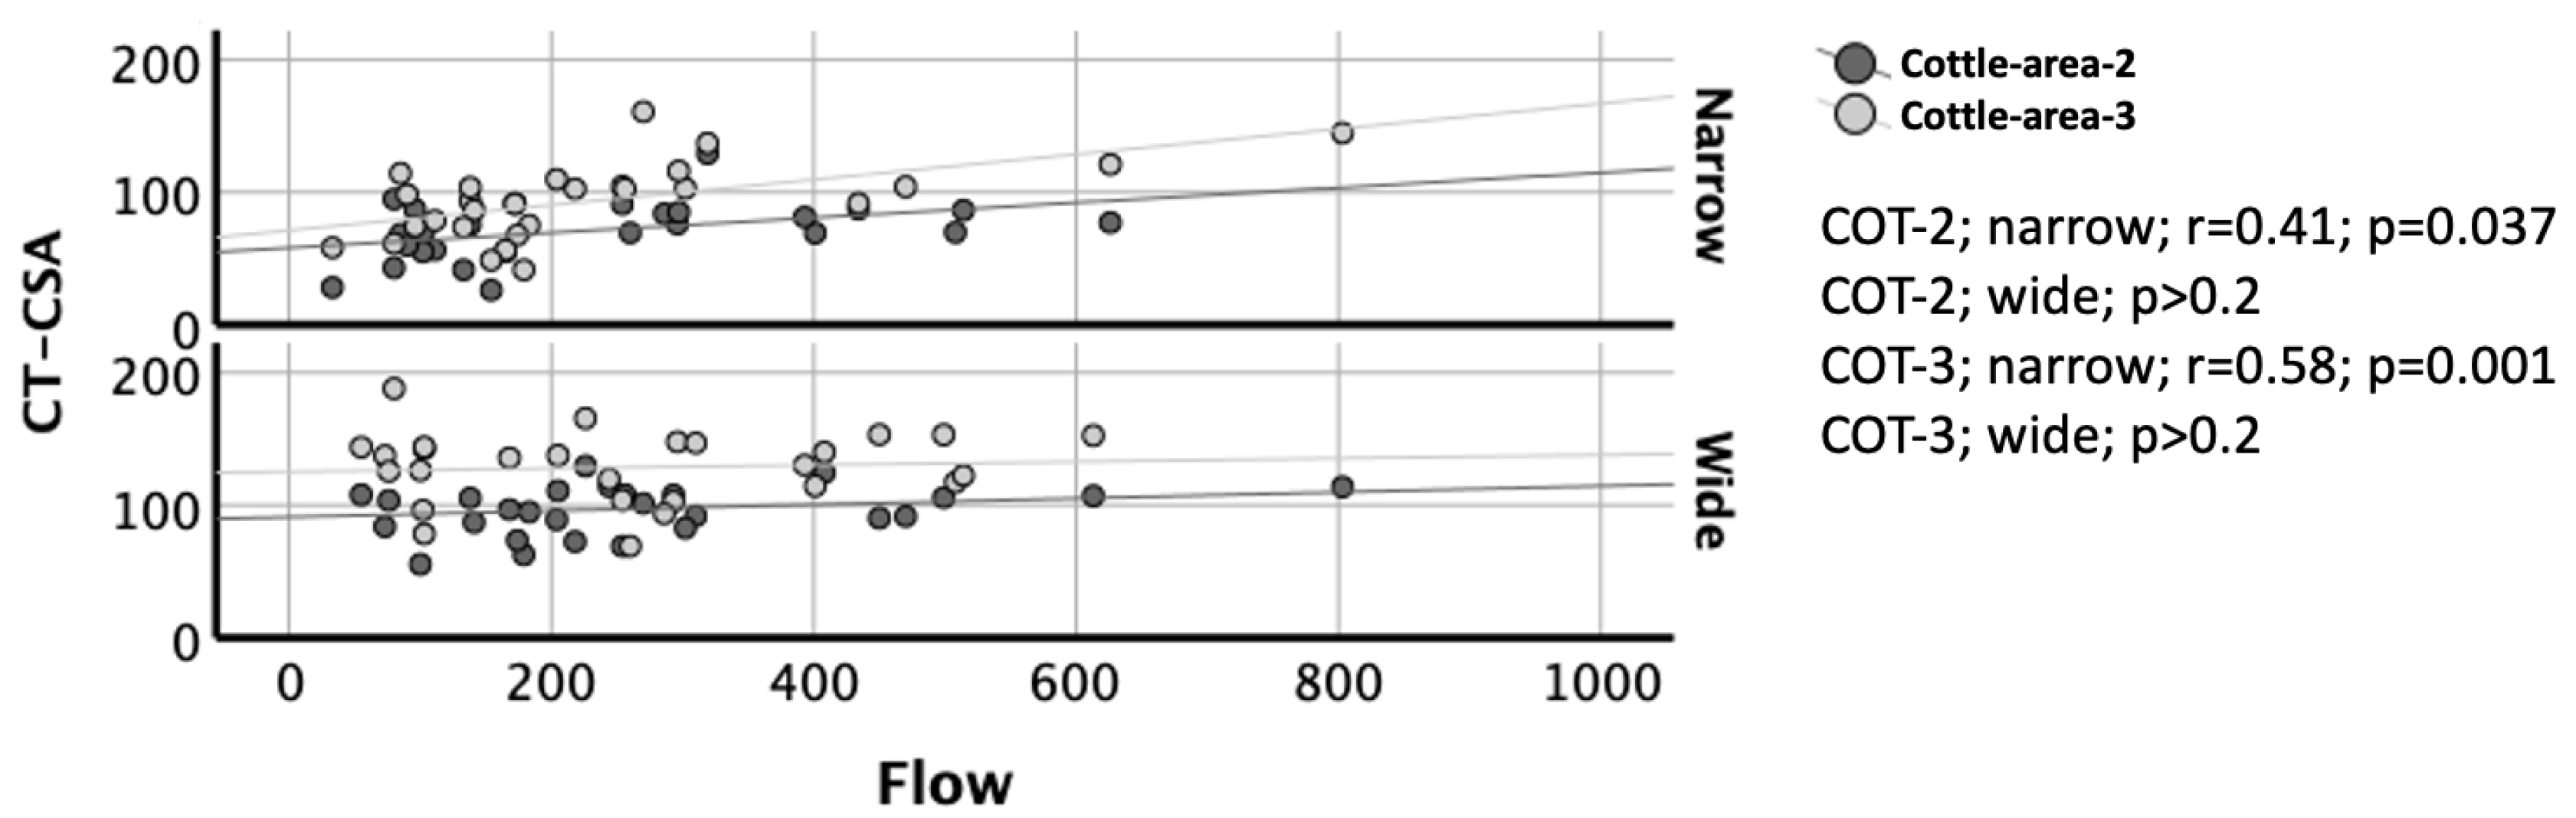
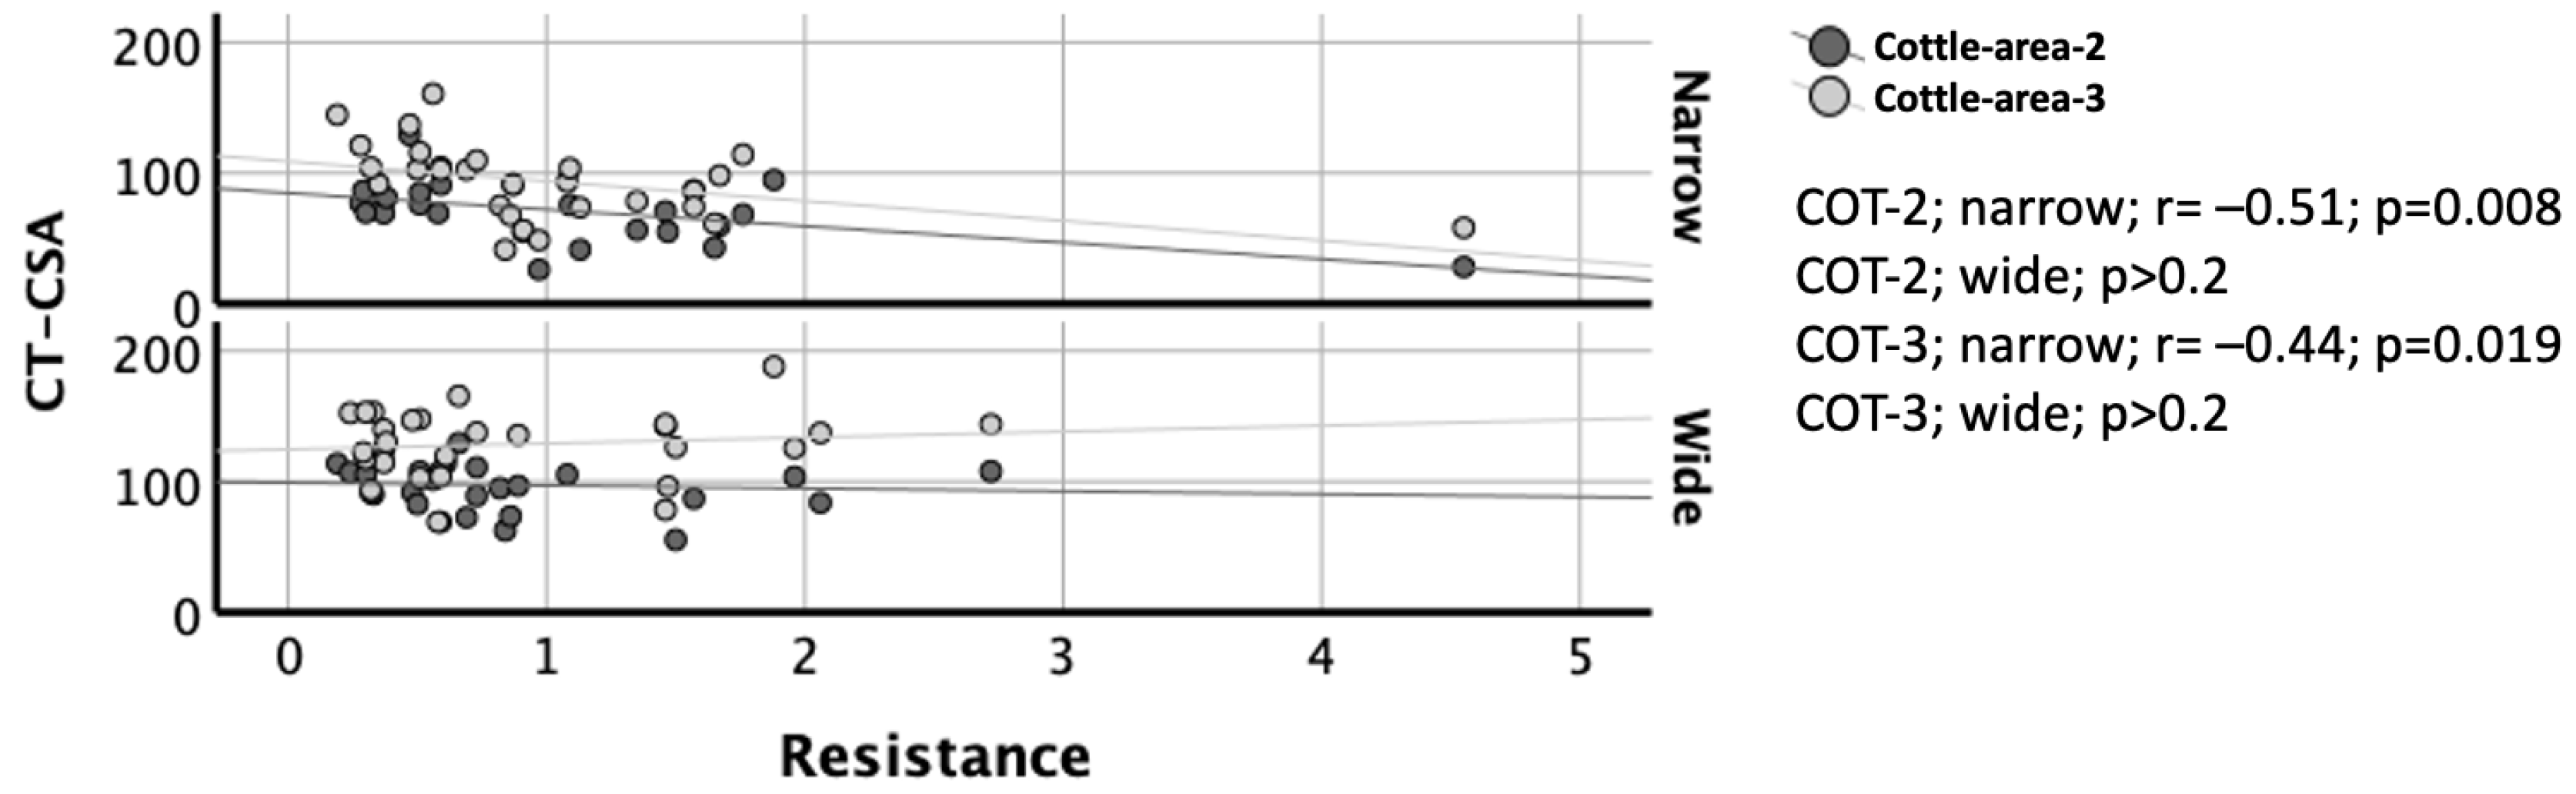
3.6. Correlation of CT-CSA with AAR
4. Discussion
5. Conclusions
Author Contributions
Funding
Institutional Review Board Statement
Informed Consent Statement
Data Availability Statement
Conflicts of Interest
Abbreviations
| CT | Computed tomography |
| AAR | Active anterior rhinomanometry |
| CT-CSA | Computed tomography cross-sectional areas |
| COT-2 | Cottle-area-2 |
| COT-3 | Cottle-area-3 |
| COT-2-ratio | Cottle-area-2 ratio |
| COT-3-ratio | Cottle-area-3 ratio |
| CI | Confidence intervals |
| SD | Standard deviation |
References
- Huizing, H.E.; de Groot, A. Functional Reconstructive Nasal Surgery; Thieme Medical Publishers: New York, NY, USA, 2004; p. 15. [Google Scholar]
- Aziz, T.; Biron, V.L.; Ansari, K.; Flores-Mir, C. Measurement tools for the diagnosis of nasal septal deviation: A systematic review. J. Otolaryngol. Head. Neck Surg. 2014, 43, 11. [Google Scholar] [CrossRef] [PubMed]
- Cottle, M.H.; Loring, R.M. Corrective surgery of the external nasal pyramid and the nasal septum for restoration of normal physiology. Eye Ear Nose Throat Mon. 1947, 26, 207–212. [Google Scholar] [PubMed]
- Cottle, M.H.; Loring, R.M. Surgery of the nasal septum; new operative procedures and indications. Ann. Otol. Rhinol. Laryngol. 1948, 57, 705–713. [Google Scholar] [CrossRef] [PubMed]
- Cottle, M.H.; Loring, R.M. Newer concepts of septum surgery; present status. Eye Ear Nose Throat Mon. 1948, 27, 403–406. [Google Scholar]
- Szucs, E.; Clement, P.A. Acoustic rhinometry and rhinomanometry in the evaluation of nasal patency of patients with nasal septal deviation. Am. J. Rhinol. 1998, 12, 345–352. [Google Scholar] [CrossRef]
- Zambetti, G.; Filiaci, F.; Romeo, R.; Soldo, P.; Filiaci, F. Assessment of Cottle’s areas through the application of a mathematical model deriving from acoustic rhinometry and rhinomanometric data. Clin. Otolaryngol. 2005, 30, 128–134. [Google Scholar] [CrossRef]
- Giotakis, A.I.; Tomazic, P.V.; Riechelmann, H.; Vent, J. Objective Assessment of Nasal Patency. Facial Plast. Surg. 2017, 33, 378–387. [Google Scholar] [CrossRef]
- Giotakis, A.I.; Widmann, G.; Mallien, E.; Riechelmann, F.; Heppt, H.; Riechelmann, H. CT analysis of the anterior nasal airway based on the direction of nasal airflow in patients with nasal obstruction and trauma controls. Eur. Arch. Otorhinolaryngol. 2023, 280, 1765–1774. [Google Scholar] [CrossRef]
- Riechelmann, H.; Widmann, G.; Kofler, B.; Arminger, R.; Url, C.; Giotakis, A.I. Nasal Floor Asymmetry Is Associated With Nasal Obstruction. J. Oral. Maxillofac. Surg. 2020, 78, 1833.e1–1833.e9. [Google Scholar] [CrossRef]
- Heppt, H.; Widmann, G.; Riechelmann, F.; Runge, A.; Riechelmann, H.; Giotakis, A.I. CT comparison of the nasal airway anterior and posterior to the piriform aperture in patients with and without nasal obstruction. Head Face Med. 2024, 20, 20. [Google Scholar] [CrossRef]
- Widmann, G.; Zangerl, A.; Schullian, P.; Fasser, M.; Puelacher, W.; Bale, R. Do image modality and registration method influence the accuracy of craniofacial navigation? J. Oral. Maxillofac. Surg. 2012, 70, 2165–2173. [Google Scholar] [CrossRef] [PubMed]
- Garaycochea, O.; Alobid, I. On the Cottle areas and the proposal for a new classification of septal areas. Rhinology 2023, 61, 190–192. [Google Scholar] [CrossRef] [PubMed]
- Moche, J.A.; Cohen, J.C.; Pearlman, S.J. Axial computed tomography evaluation of the internal nasal valve correlates with clinical valve narrowing and patient complaint. Int. Forum Allergy Rhinol. 2013, 3, 592–597. [Google Scholar] [CrossRef] [PubMed]
- Poetker, D.M.; Rhee, J.S.; Mocan, B.O.; Michel, M.A. Computed tomography technique for evaluation of the nasal valve. Arch. Facial Plast. Surg. 2004, 6, 240–243. [Google Scholar] [CrossRef]
- Englhard, A.S.; Wiedmann, M.; Ledderose, G.J.; Lemieux, B.; Badran, A.; Chen, Z.; Betz, C.S.; Wong, B.J. Imaging of the internal nasal valve using long-range Fourier domain optical coherence tomography. Laryngoscope 2016, 126, E97–E102. [Google Scholar] [CrossRef]
- Englhard, A.S.; Wiedmann, M.; Ledderose, G.J.; Lemieux, B.; Badran, A.; Jing, J.C.; Chen, Z.; Volgger, V.; Wong, B.J.F. In vivo imaging of the internal nasal valve during different conditions using optical coherence tomography. Laryngoscope 2018, 128, E105–E110. [Google Scholar] [CrossRef]
- Riechelmann, H.; Karow, E.; DiDio, D.; Kral, F. External nasal valve collapse—A case-control and interventional study employing a novel internal nasal dilator (Nasanita). Rhinology 2010, 48, 183–188. [Google Scholar] [CrossRef]
- Shafik, A.G.; Alkady, H.A.; Tawfik, G.M.; Mohamed, A.M.; Rabie, T.M.; Huy, N.T. Computed tomography evaluation of internal nasal valve angle and area and its correlation with NOSE scale for symptomatic improvement in rhinoplasty. Braz. J. Otorhinolaryngol. 2020, 86, 343–350. [Google Scholar] [CrossRef]
- Scadding, G.; Hellings, P.; Alobid, I.; Bachert, C.; Fokkens, W.; van Wijk, R.G.; Gevaert, P.; Guilemany, J.; Kalogjera, L.; Lund, V.; et al. Diagnostic tools in Rhinology EAACI position paper. Clin. Transl. Allergy 2011, 1, 2. [Google Scholar] [CrossRef]
- Garcia, G.J.; Hariri, B.M.; Patel, R.G.; Rhee, J.S. The relationship between nasal resistance to airflow and the airspace minimal cross-sectional area. J. Biomech. 2016, 49, 1670–1678. [Google Scholar] [CrossRef]
- Giotakis, A.I.; Widmann, G.; Riechelmann, F.; Riechelmann, H.; Heppt, H. Comparison of different nasal septal areas between patients with and without nasal obstruction. J. Laryngol. Otol. 2024, 1–8. [Google Scholar] [CrossRef]

| Plane 1 | Side | Cases | Controls |
|---|---|---|---|
| Cottle-area-2 | Right | 83 ± 27 (25–130) | 103 ± 25 (64–191) |
| Left | 83 ± 26 (17–143) | 102 ± 27 (59–170) | |
| Narrow | 69 ± 23 (17–130) | 91 ± 21 (49–143) | |
| Wide | 97 ± 22 (55–143) | 112 ± 27 (65–191) | |
| Total | 167 ± 37 (98–272) | 203 ± 44 (129–296) | |
| Cottle-area-3 | Right | 99 ± 35 (41–166) | 104 ± 24 (56–159) |
| Left | 102 ± 37 (34–188) | 106 ± 25 (50–159) | |
| Narrow | 79 ± 28 (34–161) | 93 ± 21 (50–140) | |
| Wide | 122 ± 31 (60–188) | 115 ± 24 (69–159) | |
| Total | 201 ± 48 (105–322) | 208 ± 39 (128–300) |
| Plane | AAR 1 Variable | Narrow Side 2 | Wide Side 2 |
|---|---|---|---|
| Cottle-area-2 | Flow (mL/s) | 235 ± 169 (33–626) | 264 ± 173 (55–803) |
| Resistance (sPa/mL) | 1.05 ± 0.89 (0.28–4.55) | 0.86 ± 0.61 (0.19–2.72) | |
| Cottle-area-3 | Flow (ml/s) | 233 ± 172 (33–803) | 270 ± 163 (55–613) |
| Resistance (sPa/mL) | 1.01 ± 0.83 (0.19–4.55) | 0.88 ± 0.69 (0.24–2.72) |
Disclaimer/Publisher’s Note: The statements, opinions and data contained in all publications are solely those of the individual author(s) and contributor(s) and not of MDPI and/or the editor(s). MDPI and/or the editor(s) disclaim responsibility for any injury to people or property resulting from any ideas, methods, instructions or products referred to in the content. |
© 2025 by the authors. Licensee MDPI, Basel, Switzerland. This article is an open access article distributed under the terms and conditions of the Creative Commons Attribution (CC BY) license (https://creativecommons.org/licenses/by/4.0/).
Share and Cite
Heppt, H.; Widmann, G.; Santer, M.; Riechelmann, F.; Riechelmann, H.; Giotakis, A.I. Comparison of Cottle-Area-2 and Cottle-Area-3 in Computed Tomography Scans of Patients with Nasal Obstruction and Controls. Diagnostics 2025, 15, 1321. https://doi.org/10.3390/diagnostics15111321
Heppt H, Widmann G, Santer M, Riechelmann F, Riechelmann H, Giotakis AI. Comparison of Cottle-Area-2 and Cottle-Area-3 in Computed Tomography Scans of Patients with Nasal Obstruction and Controls. Diagnostics. 2025; 15(11):1321. https://doi.org/10.3390/diagnostics15111321
Chicago/Turabian StyleHeppt, Helen, Gerlig Widmann, Matthias Santer, Felix Riechelmann, Herbert Riechelmann, and Aris I. Giotakis. 2025. "Comparison of Cottle-Area-2 and Cottle-Area-3 in Computed Tomography Scans of Patients with Nasal Obstruction and Controls" Diagnostics 15, no. 11: 1321. https://doi.org/10.3390/diagnostics15111321
APA StyleHeppt, H., Widmann, G., Santer, M., Riechelmann, F., Riechelmann, H., & Giotakis, A. I. (2025). Comparison of Cottle-Area-2 and Cottle-Area-3 in Computed Tomography Scans of Patients with Nasal Obstruction and Controls. Diagnostics, 15(11), 1321. https://doi.org/10.3390/diagnostics15111321