
Diagnostic Predictors of Recovery Outcomes Following Open Reduction and Internal Fixation for Tibial Plateau Fractures: A Retrospective Study Based on the Schatzker Classification

 ,
,  ,
,  , ,
, ,  ,
,  and
and 
Abstract
1. Introduction
2. Materials and Methods
2.1. Study Design
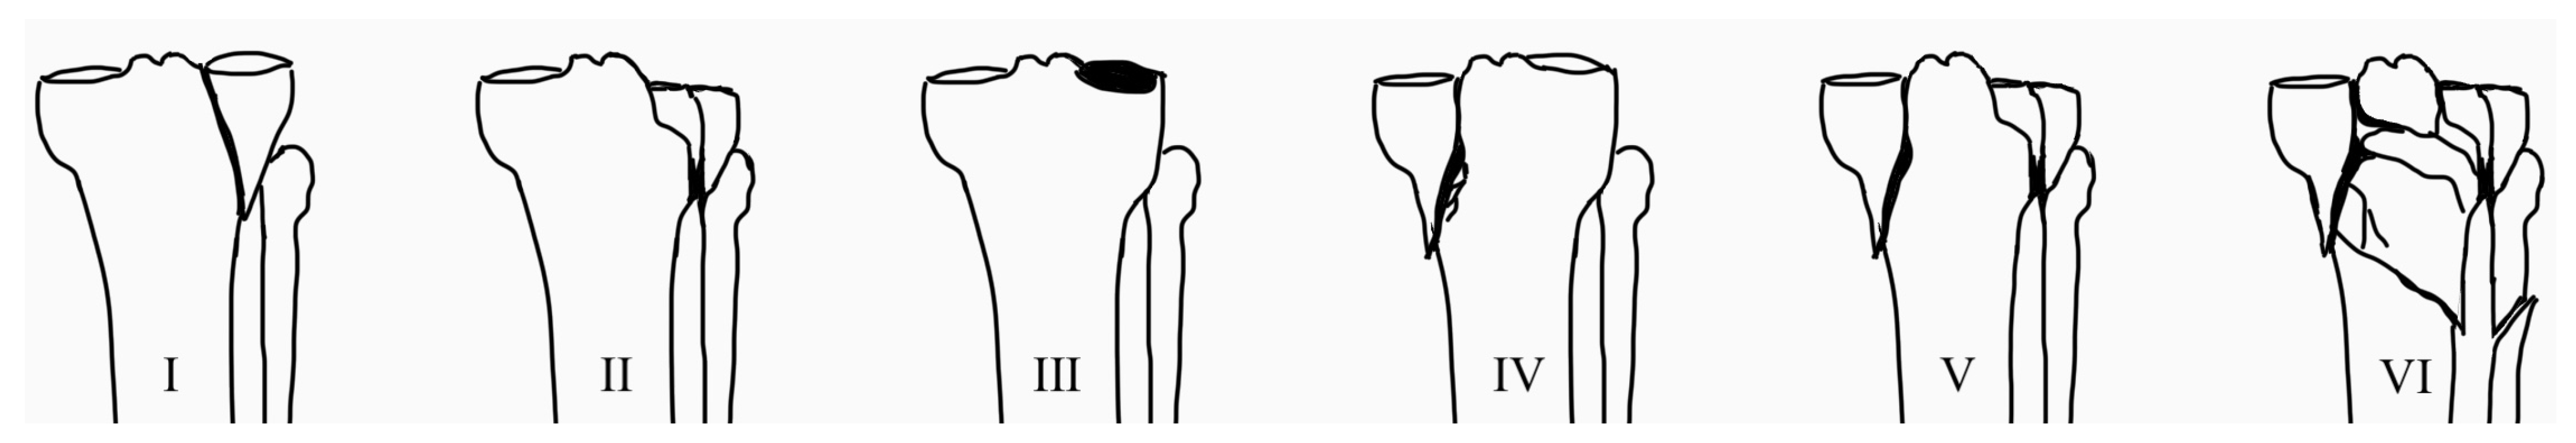
- MCF patient group: patients with Schatzker II–IV fractures.
- BCF patient group: patients with Schatzker V and VI fractures.
2.2. Inclusion and Exclusion Criteria
2.3. Surgical Technique: Open Reduction and Internal Fixation (ORIF)
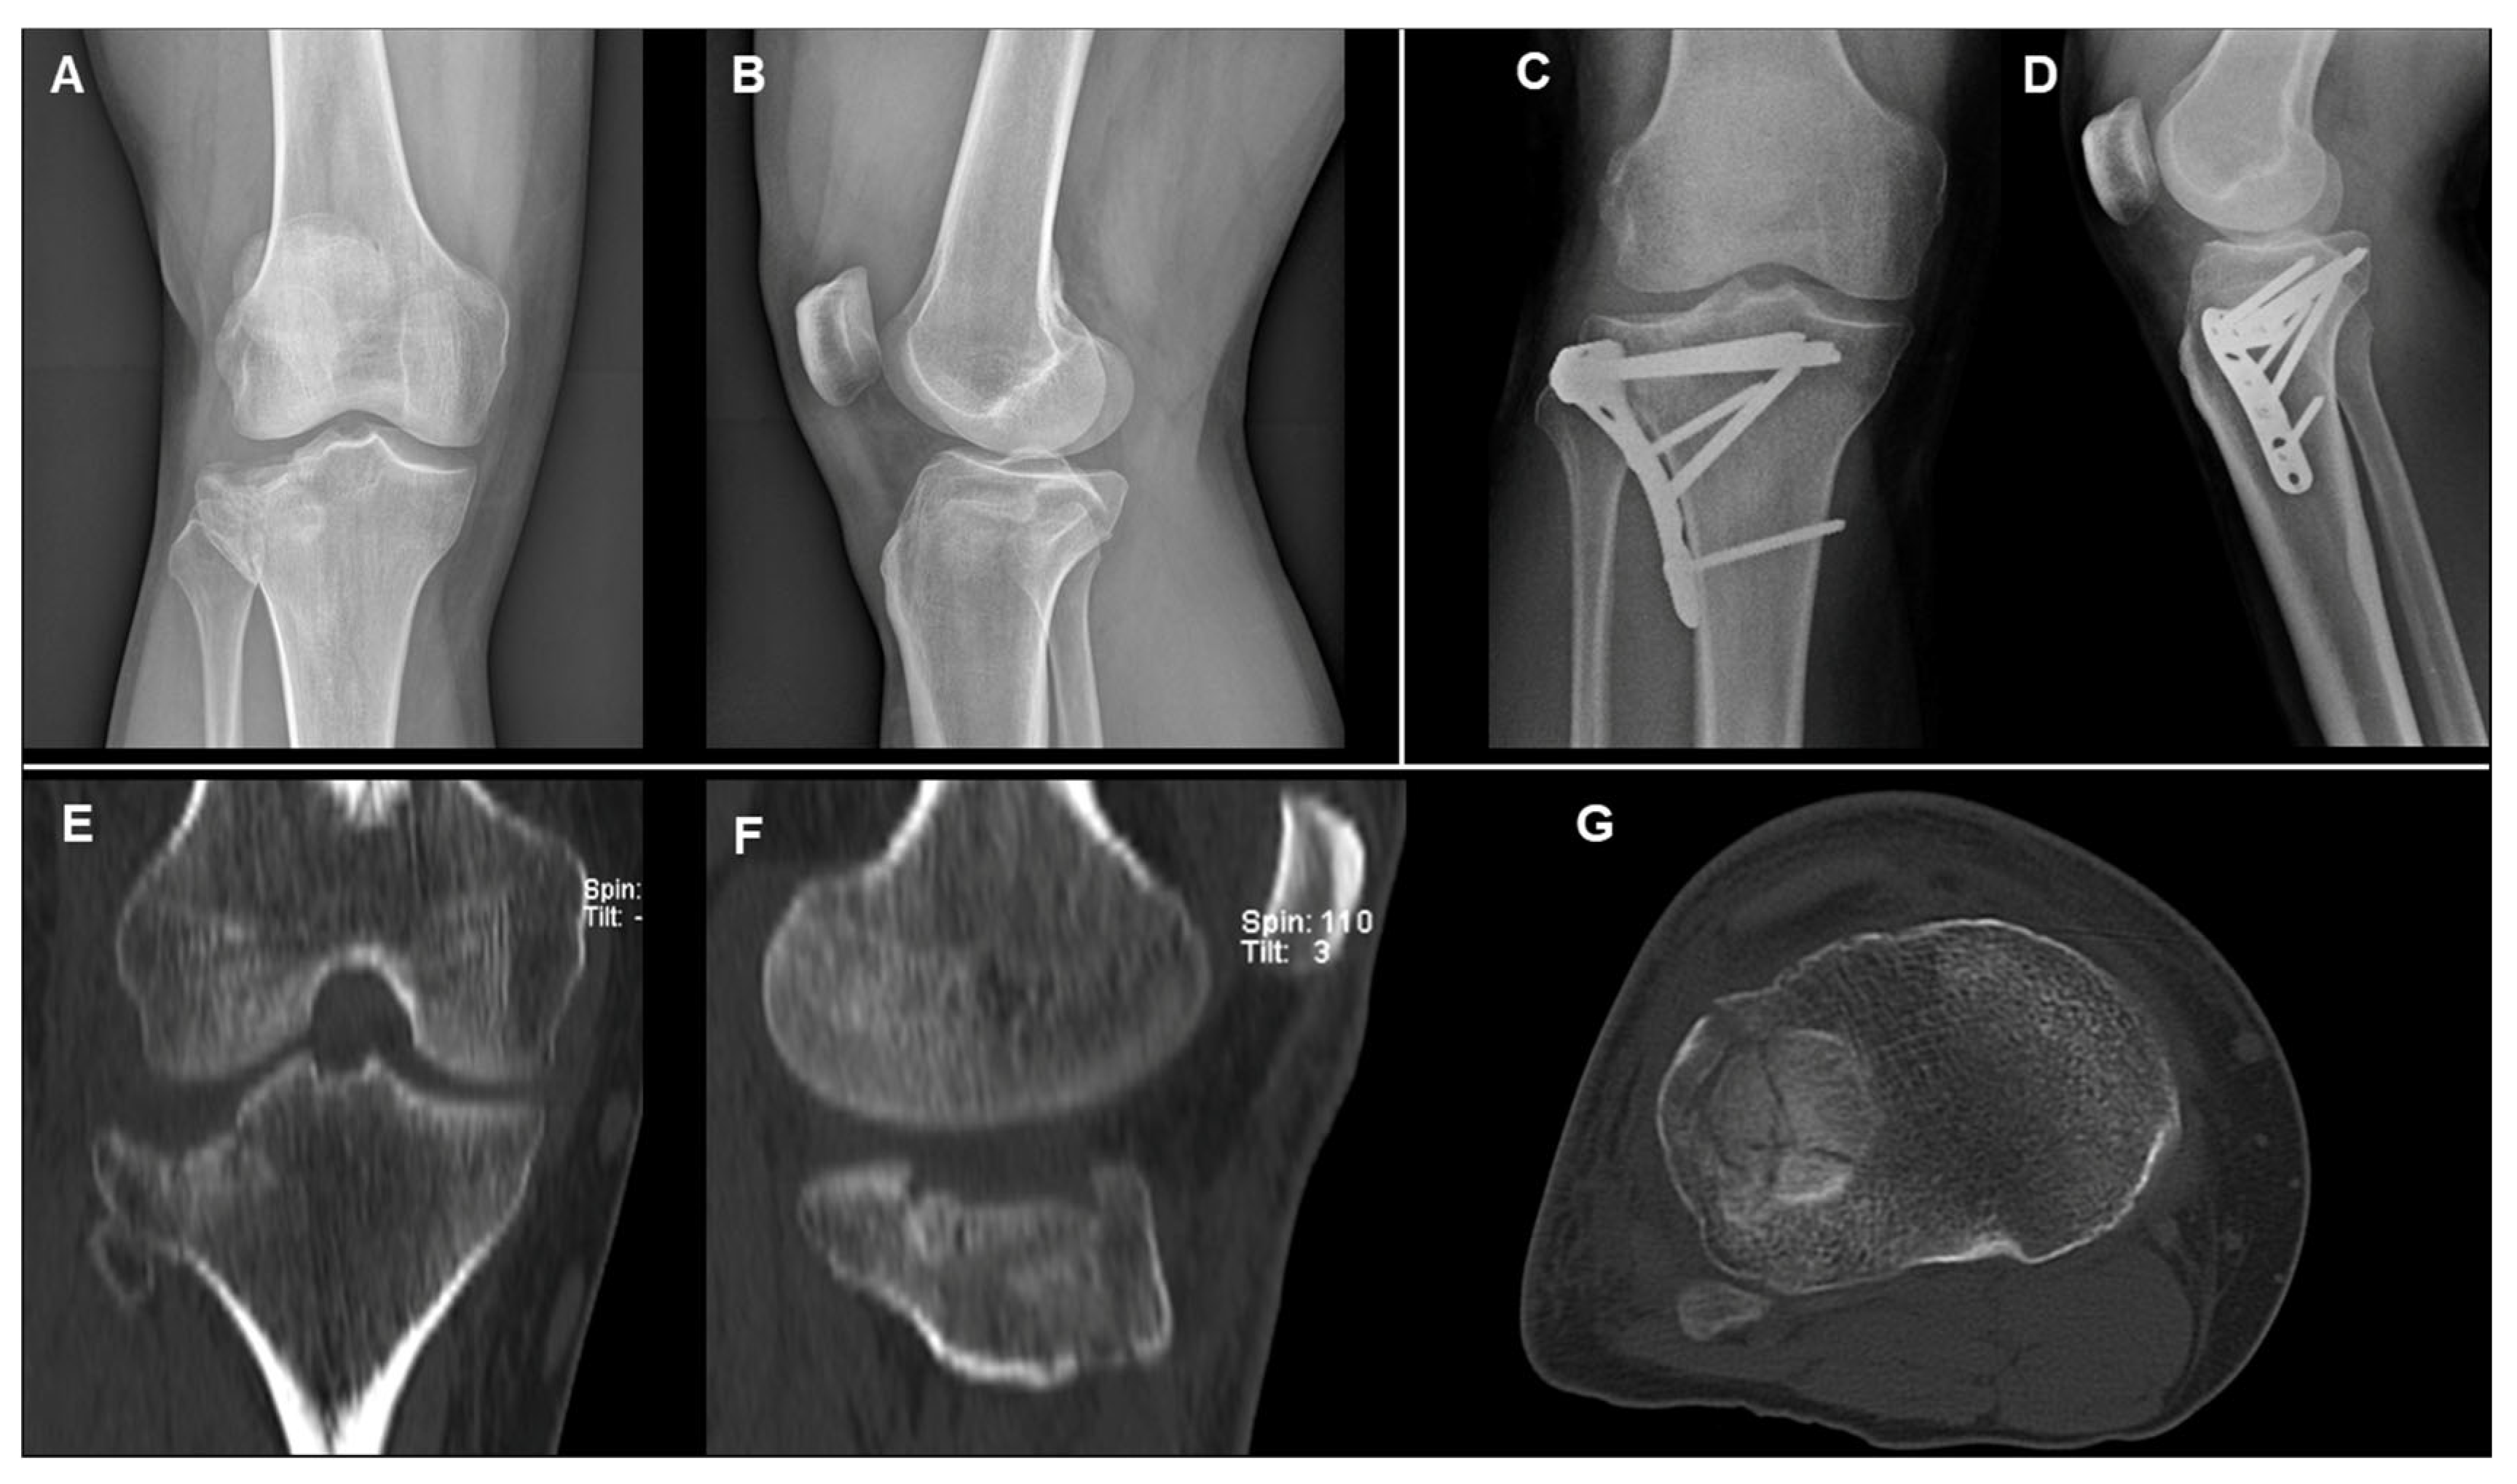
- MCFs (Schatzker II–IV): ORIF with a single lateral plate and screws for type II and III; medial plate and screws for type IV.
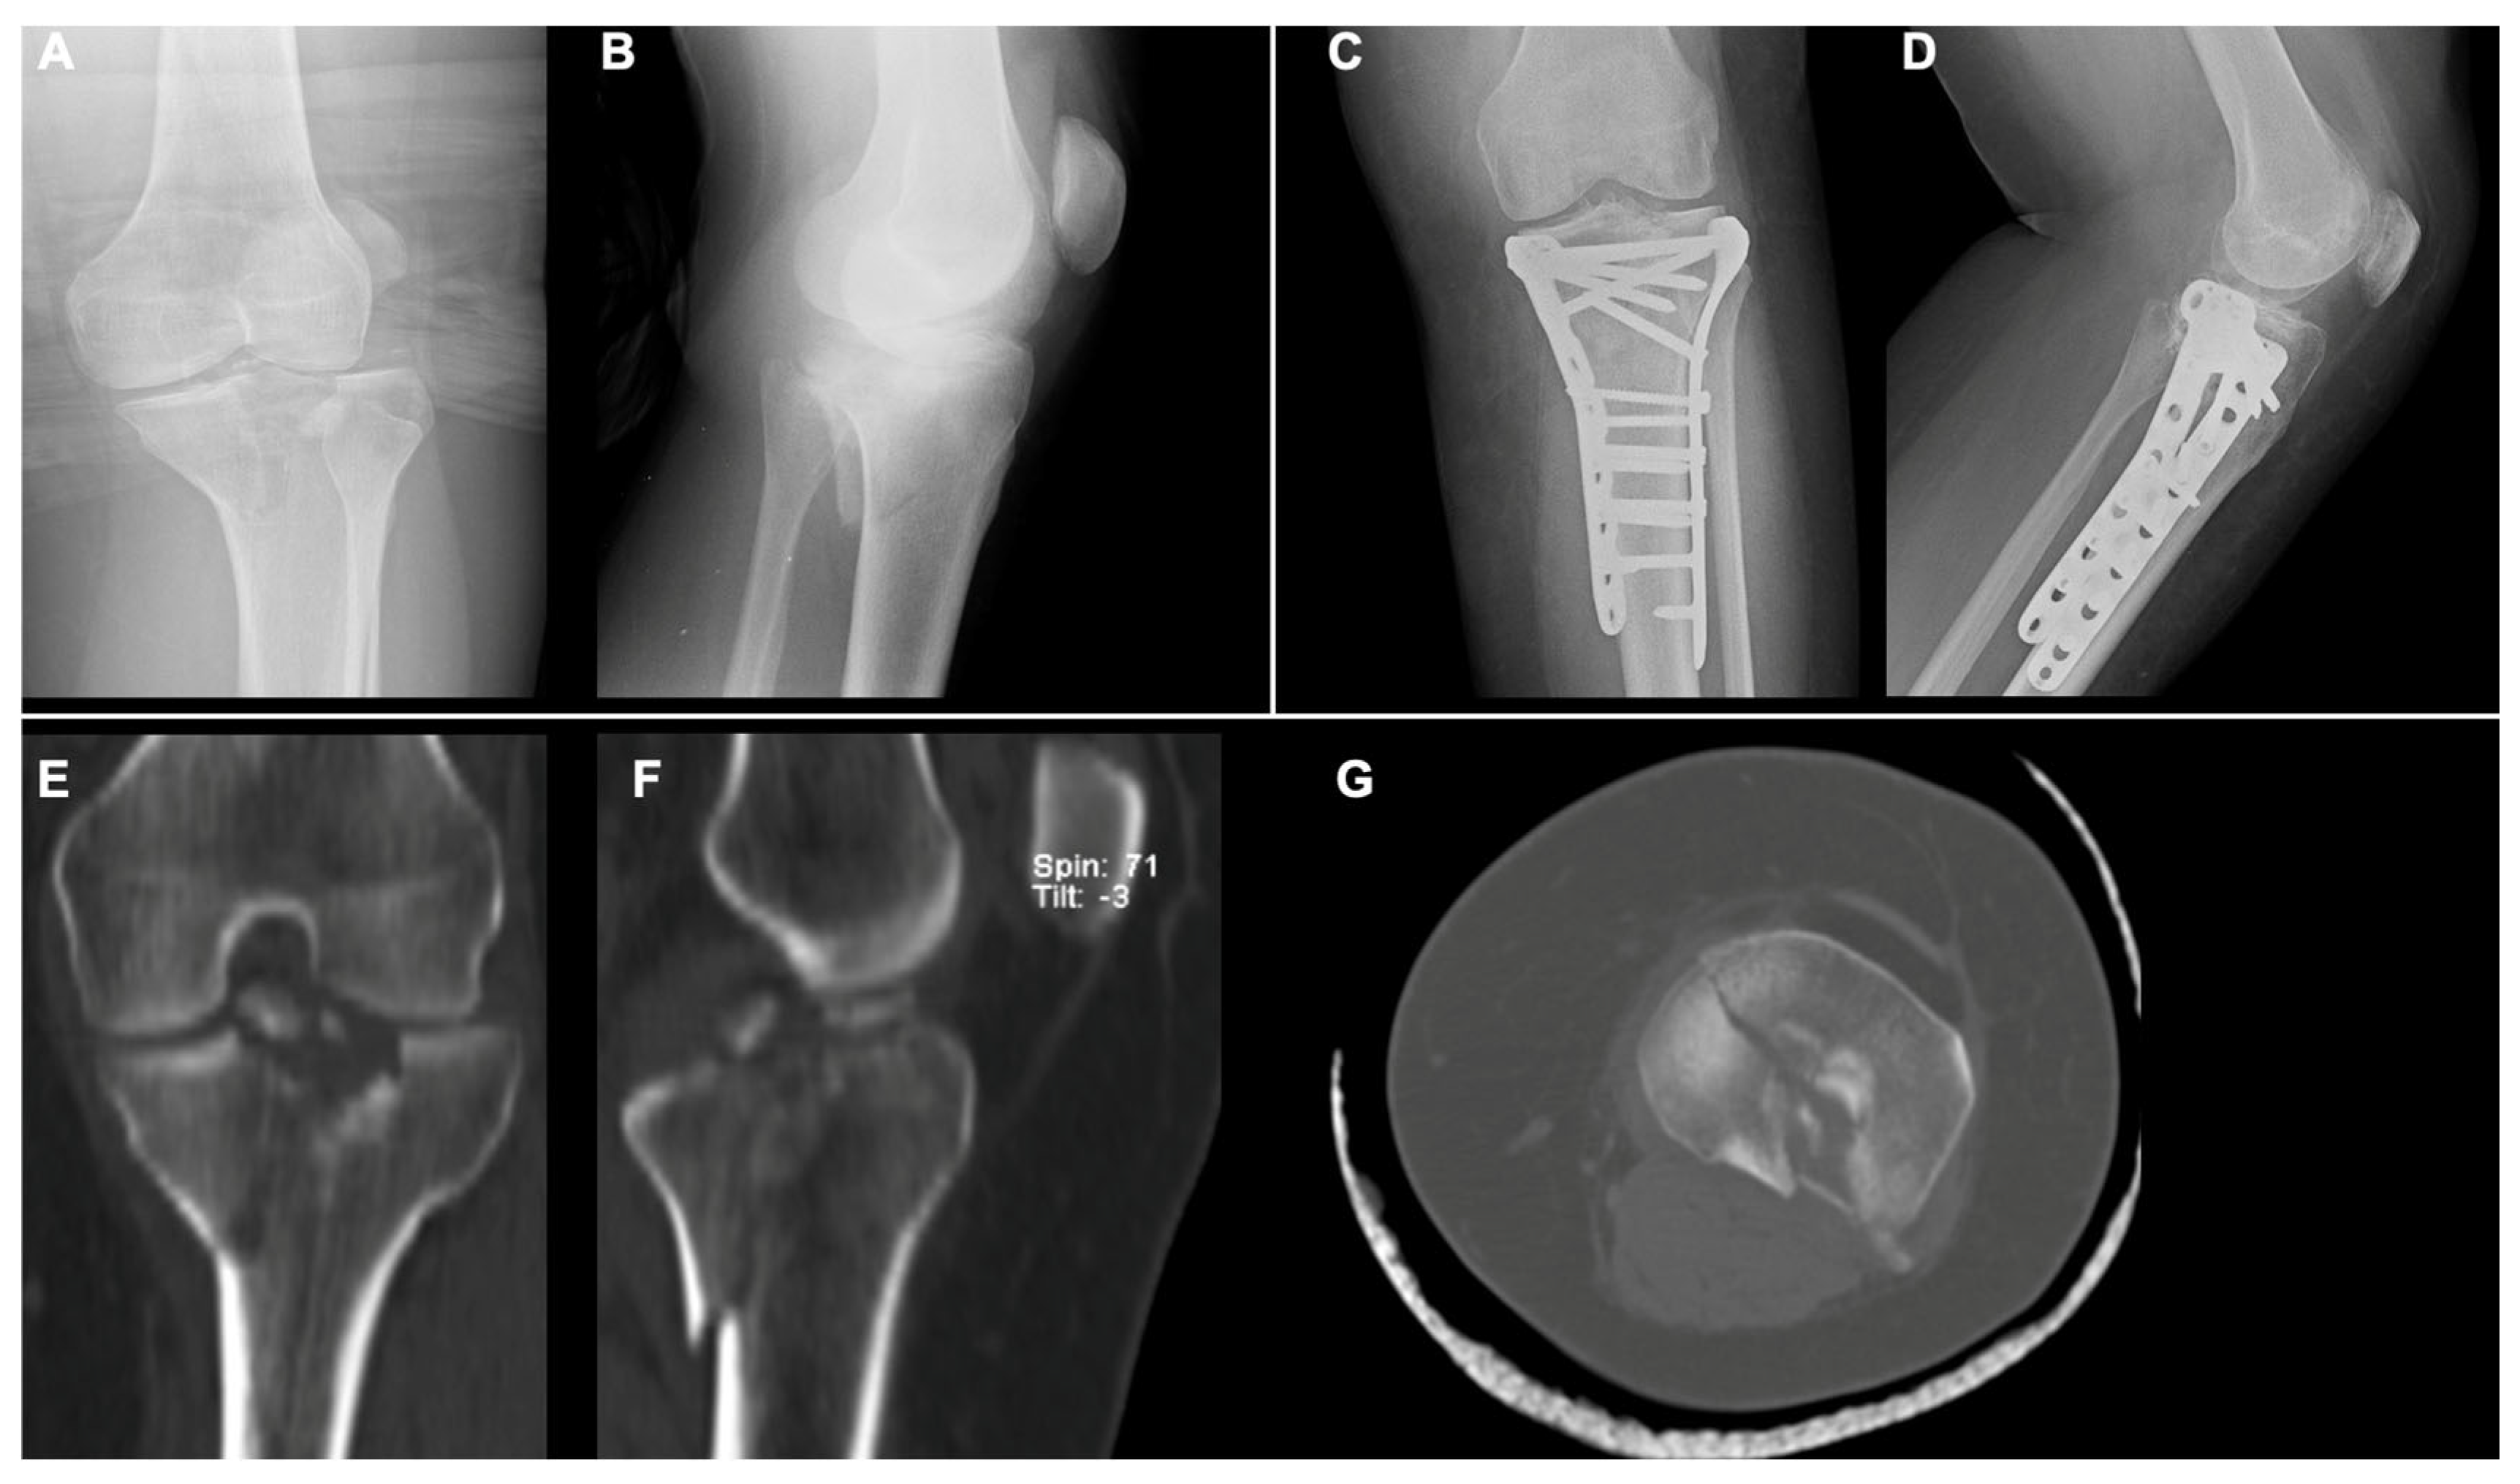
- BCFs (Schatzker V–VI): ORIF with two plates (medial and lateral) and screws.
2.4. Postoperative Protocol
2.5. Clinical Evaluation Test
2.6. Patient-Reported Outcome Measures (PROMs)
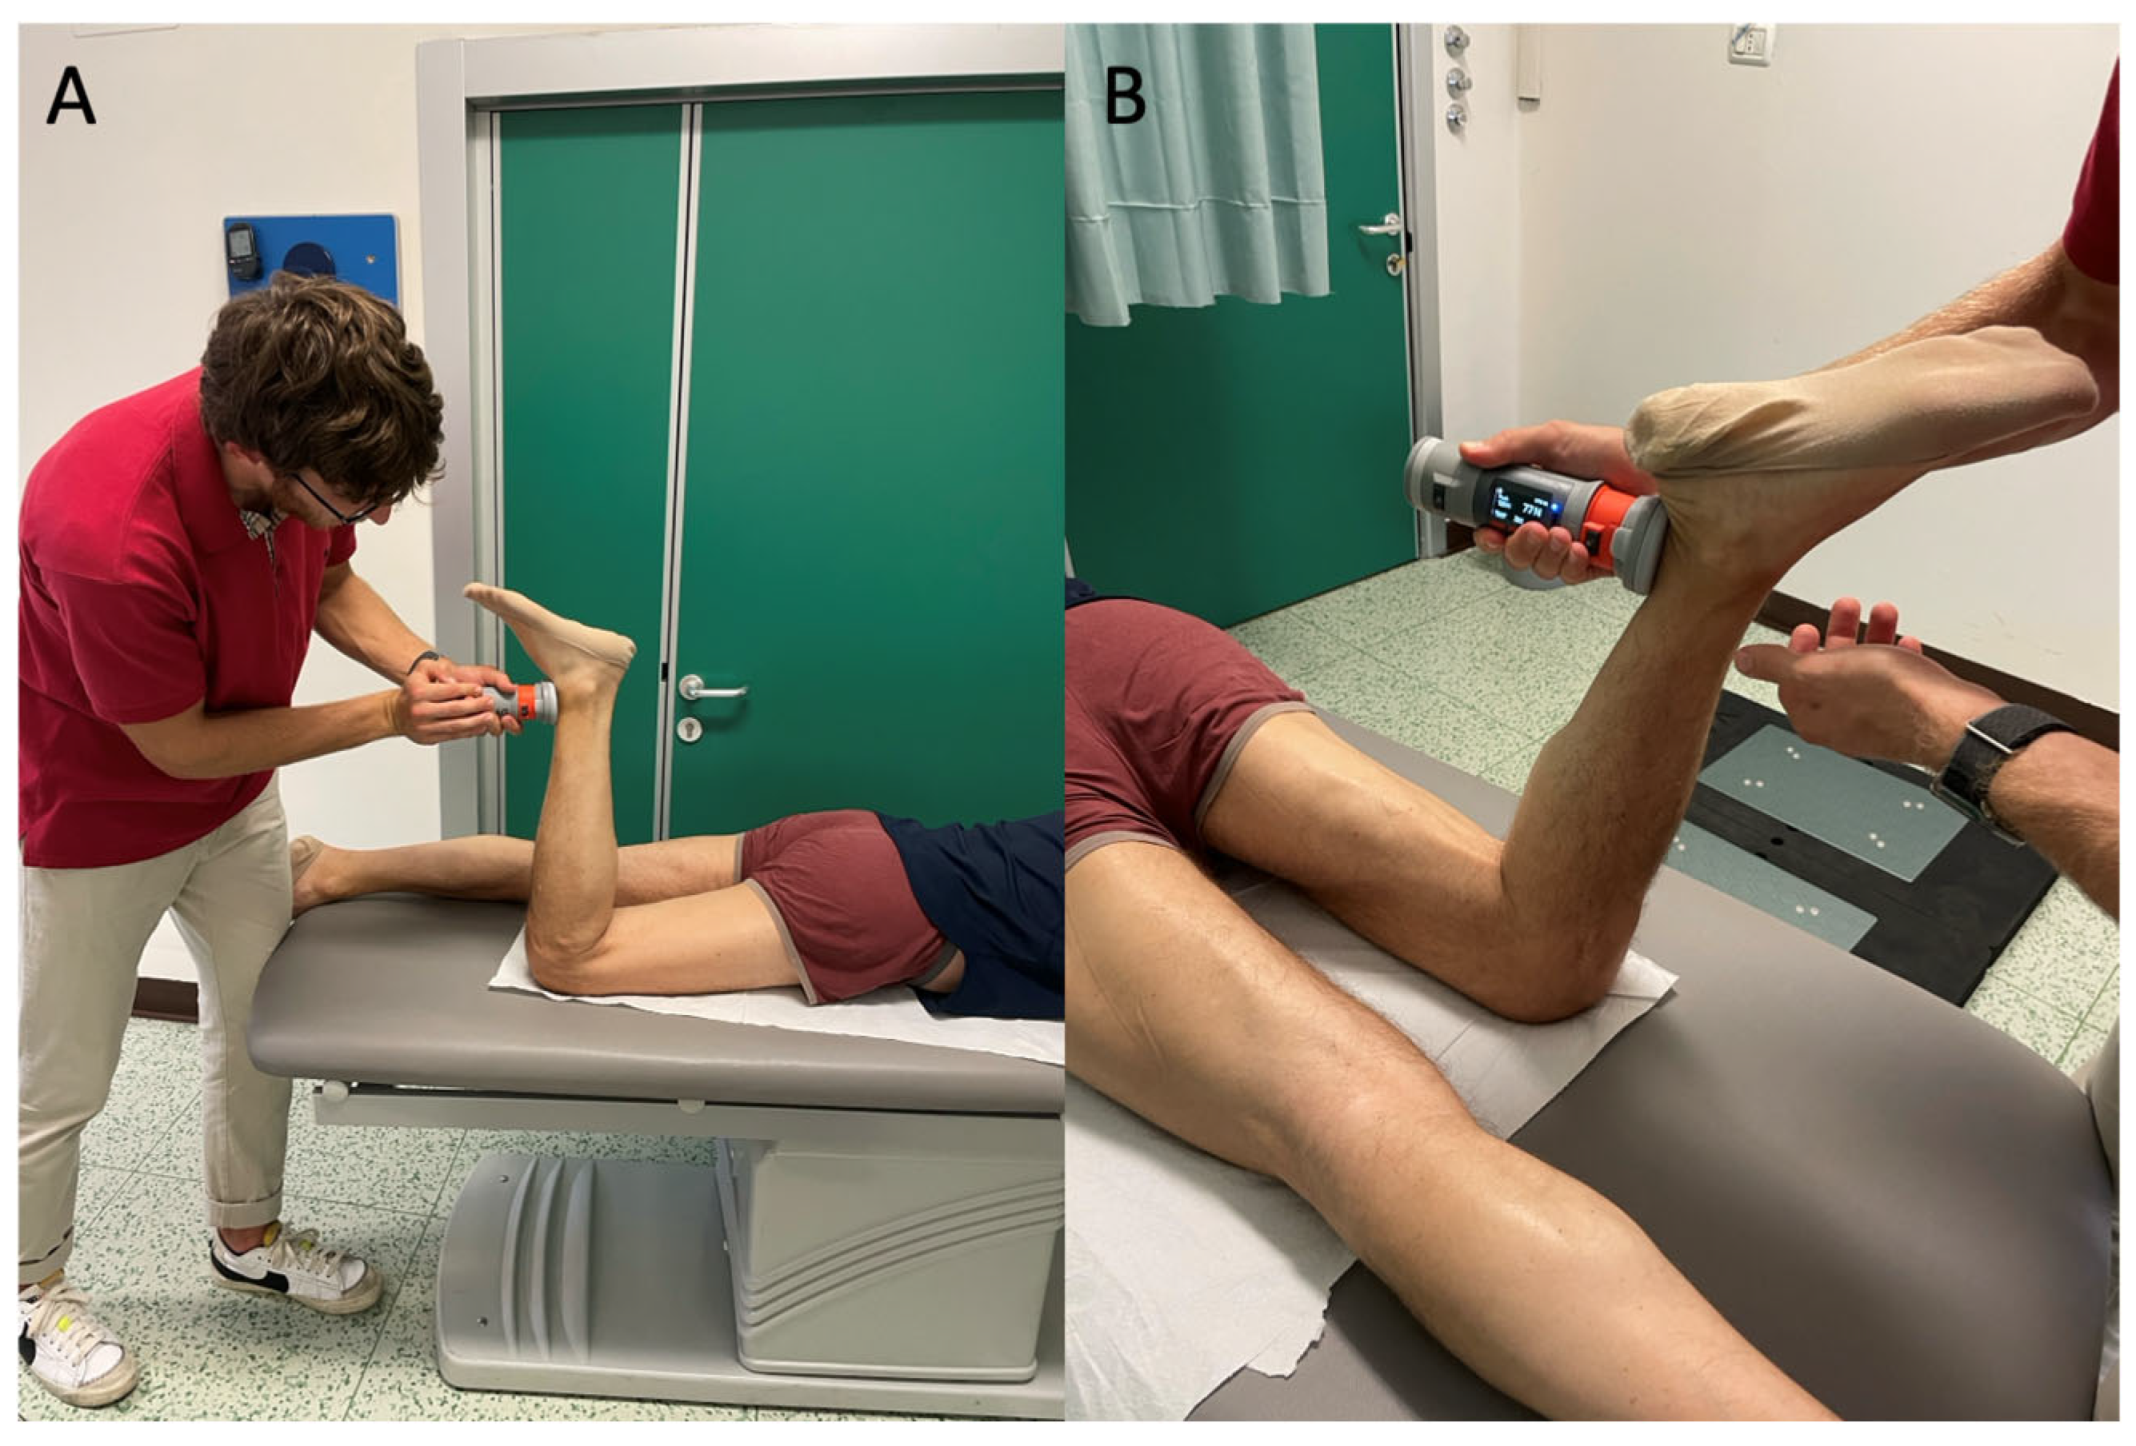
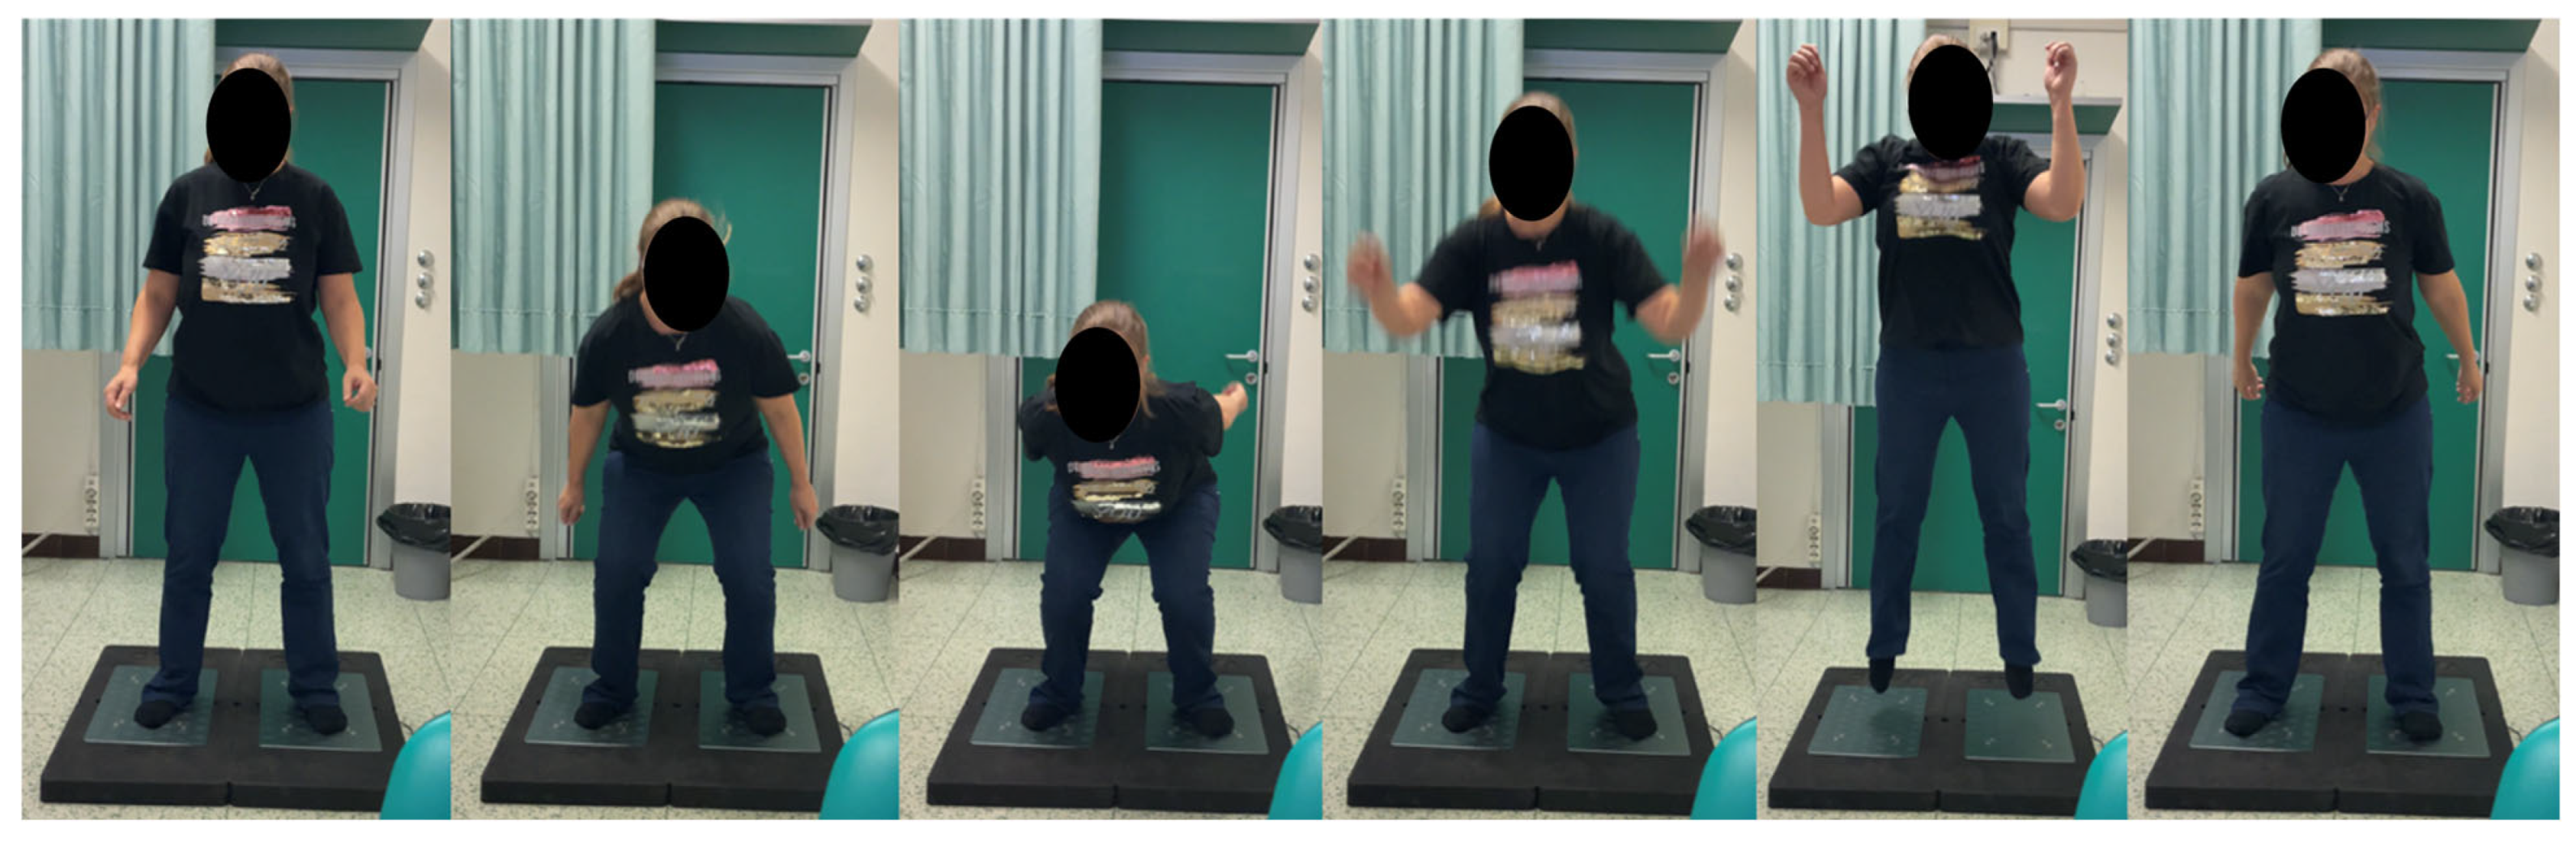
2.7. Assessment of Physical Performance Tests
2.8. Statistical Analysis
3. Results
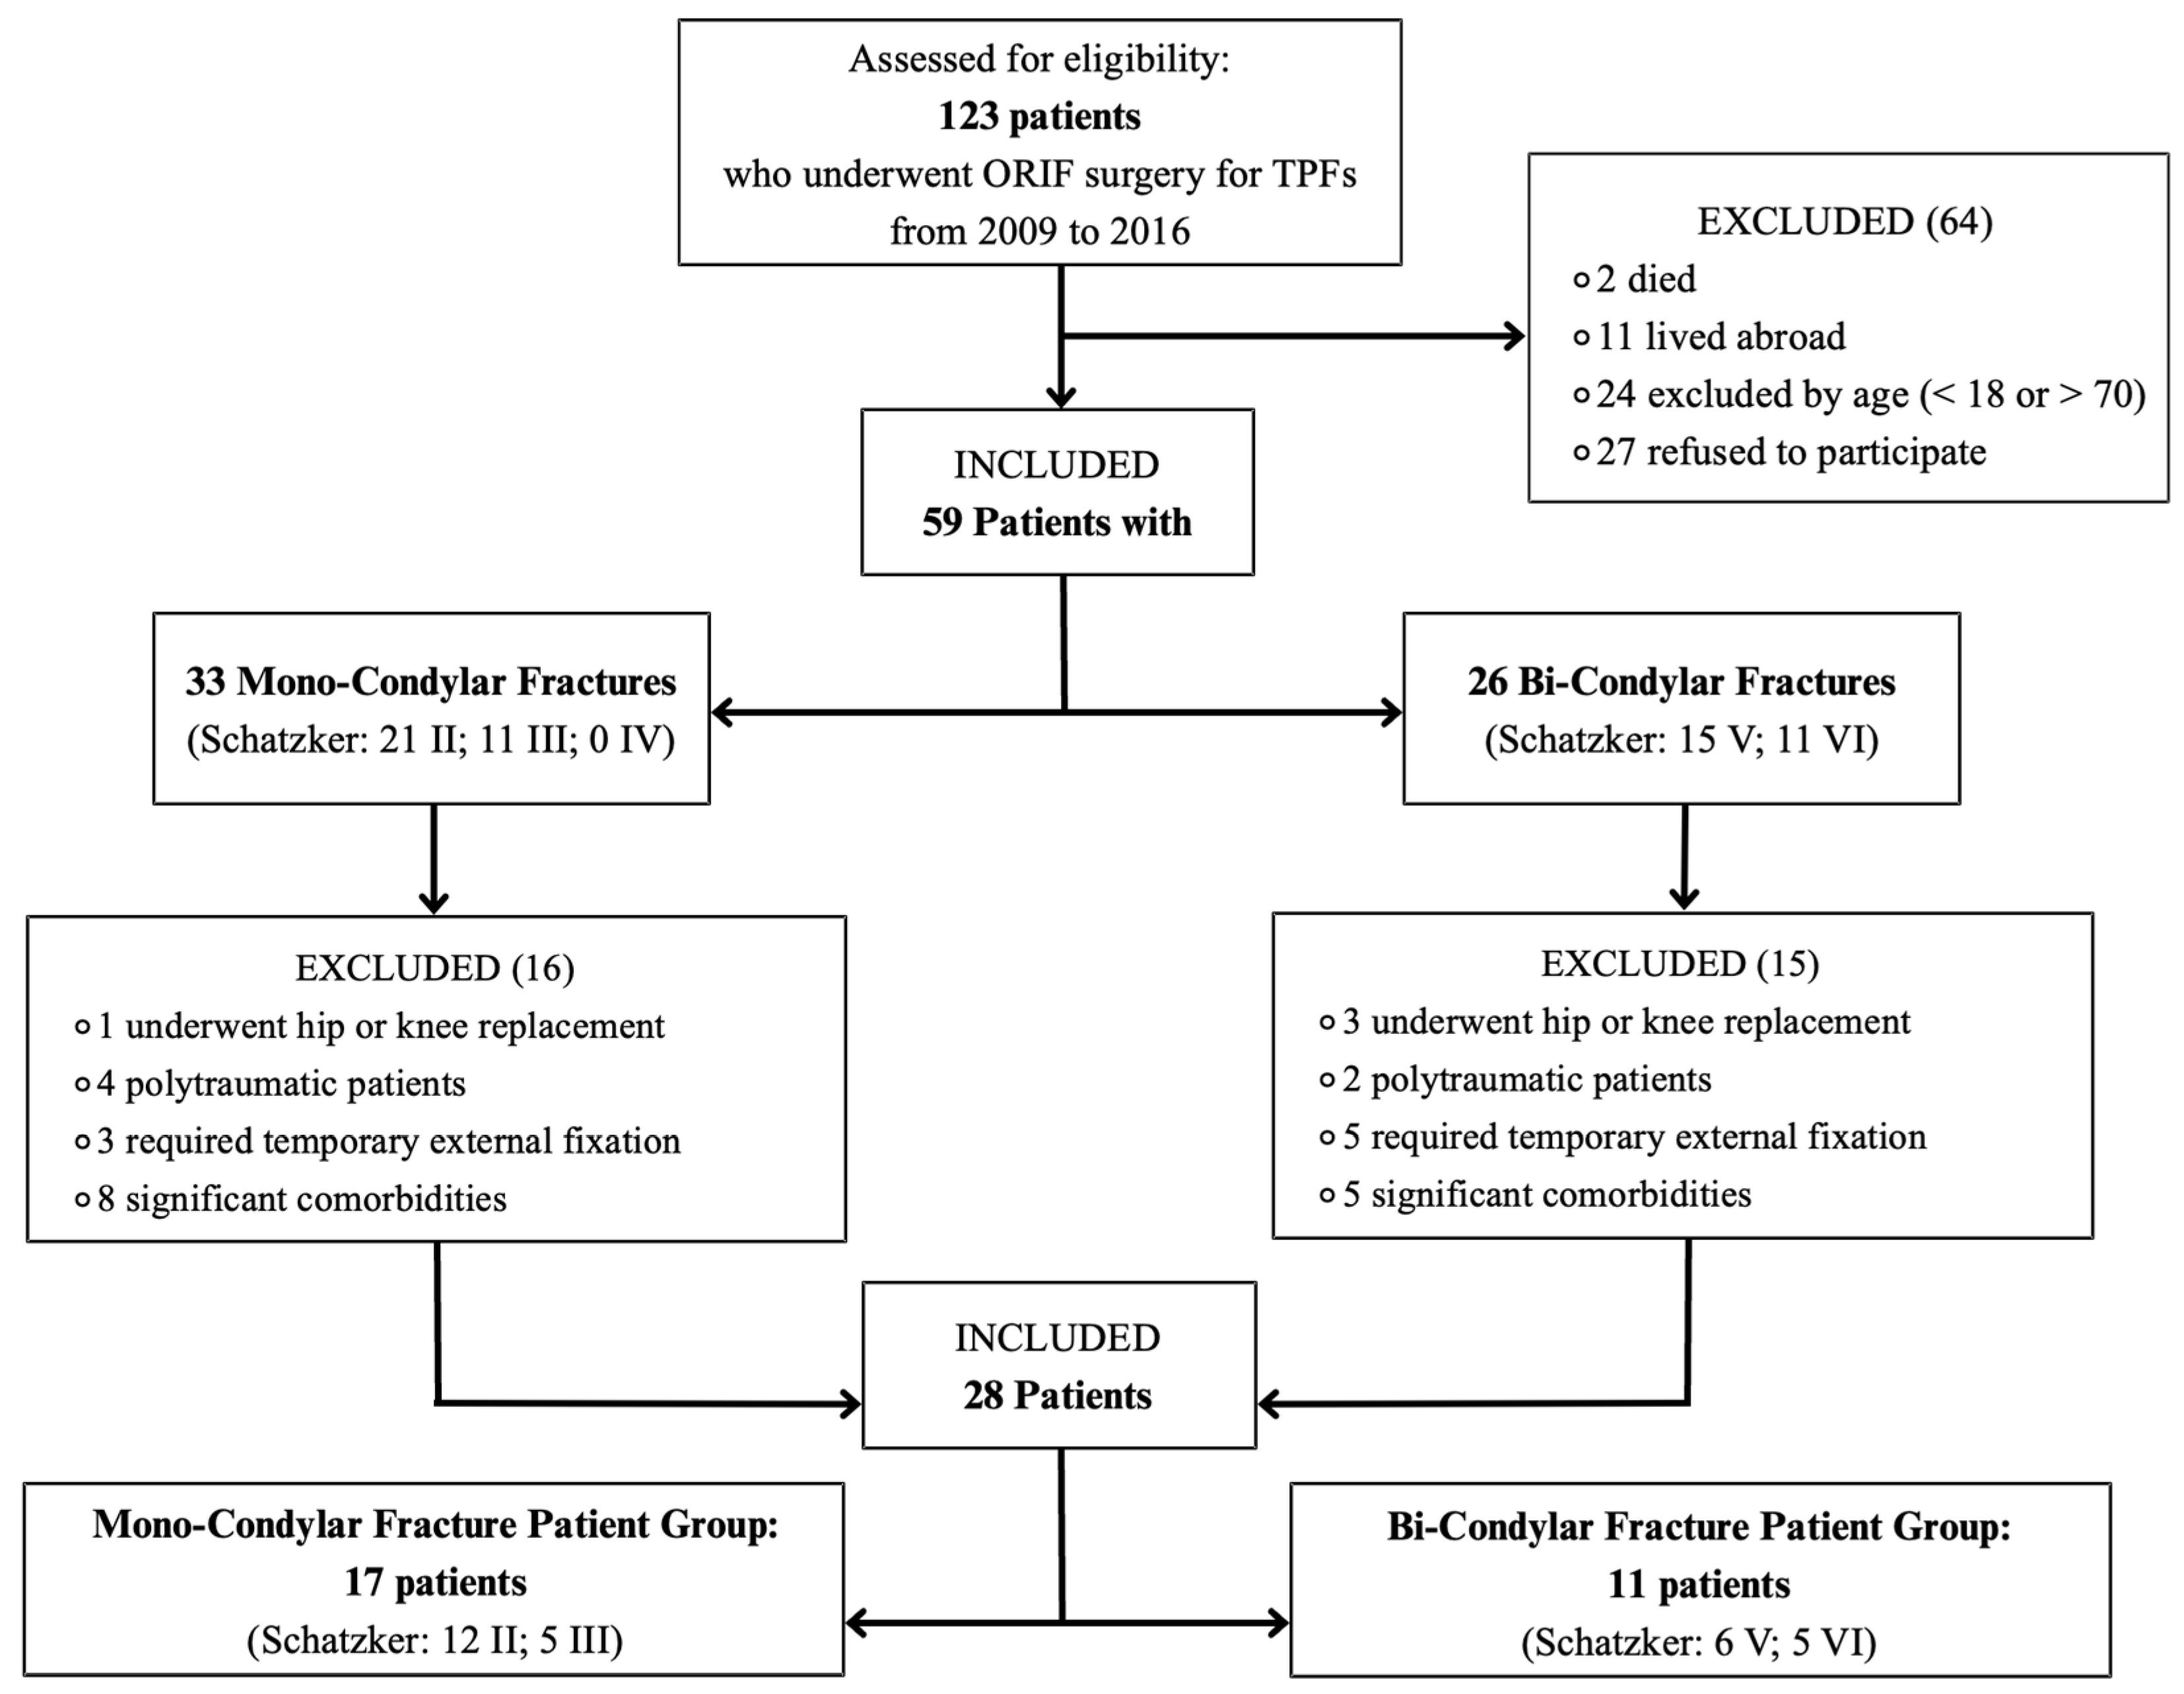
3.1. Patients
- Seventeen in the MCF patient group (Schatzker: 12 type II, 5 type III, and 0 type IV).
- Eleven in the BCF patient group (Schatzker: 6 type V and 5 type VI).
3.2. Diagnostic Findings
3.2.1. Summary of Patient-Reported Outcome Measures (PROMs)
3.2.2. Table-Based Assessments
3.2.3. Force Platform Evaluation Tests
3.2.4. Clinical Examination
3.2.5. Predictors of Clinical Outcomes
3.2.6. Predictors of Biomechanical and Functional Outcomes
4. Discussion
4.1. Patient-Reported Outcome Measures (PROMs)
4.2. Active Range of Motion and Strength Assessments
4.3. Force Platform Evaluation Tests
5. Conclusions
Author Contributions
Funding
Institutional Review Board Statement
Informed Consent Statement
Data Availability Statement
Acknowledgments
Conflicts of Interest
References
- Biz, C.; Maso, G.; Gambato, M.; Belluzzi, E.; Pozzuoli, A.; Favero, M.; Vigo, M.; Ruggieri, P. Challenging Surgical Treatment of Displaced Articular Tibial Plateau Fractures: Do Early Knee Radiographic Features Have a Predictive Value of the Mid-Term Clinical Functional Outcomes? Orthop. Surg. 2019, 11, 1149–1162. [Google Scholar] [CrossRef] [PubMed]
- Alves, D.P.L.; Wun, P.Y.L.; Alves, A.L.; Christian, R.W.; Mercadante, M.T.; Hungria, J.O. Weight Discharge in Postoperative of Plateau Fracture Tibialis: Systematic Review of Literature. Rev. Bras. Ortop. 2020, 55, 404–409. [Google Scholar] [CrossRef]
- Tripathy, S.K.; Varghese, P.; Panigrahi, S.; Panda, B.B.; Srinivasan, A.; Sen, R.K. External Fixation versus Open Reduction and Internal Fixation in the Treatment of Complex Tibial Plateau Fractures: A Systematic Review and Meta-Analysis. Acta Orthop. Traumatol. Turc. 2021, 55, 444–456. [Google Scholar] [CrossRef]
- Iliopoulos, E.; Galanis, N. Physiotherapy after Tibial Plateau Fracture Fixation: A Systematic Review of the Literature. SAGE Open Med. 2020, 8, 2050312120965316. [Google Scholar] [CrossRef] [PubMed]
- Mansur, H.; Corrêa, V.L.B.; Abdo, B.; Ramos, L.S.; Castiglia, M.T. Evaluation of the Reproducibility of the Schatzker Classification Reviewed by Kfuri for Tibial Plateau Fractures. Rev. Bras. Ortop. 2021, 57, 502–510. [Google Scholar] [CrossRef]
- Vendeuvre, T.; Gayet, L.É. Percutaneous treatment of tibial plateau fractures. Orthop. Traumatol. Surg. Res. 2021, 107, 102753. [Google Scholar] [CrossRef] [PubMed]
- Bormann, M.; Neidlein, C.; Neidlein, N.; Ehrl, D.; Jörgens, M.; Berthold, D.P.; Böcker, W.; Holzapfel, B.M.; Fürmetz, J. High Prevalence of Persistent Measurable Postoperative Knee Joint Laxity in Patients with Tibial Plateau Fractures Treated by Open Reduction and Internal Fixation (ORIF). J. Clin. Med. 2023, 12, 5580. [Google Scholar] [CrossRef]
- Kfuri, M.; Schatzker, J. Revisiting the Schatzker Classification of Tibial Plateau Fractures. Injury 2018, 49, 2252–2263. [Google Scholar] [CrossRef]
- Alencar, J.B.; Souza, C.J.D.; Coelho, P.R.R.; Freitas, P.G.; Lopes, M.B.G.; Pinto, F.J.M. Inter- and Intra-Observer Reliability of Schatzker, AO, and Luo Classifications for Tibial Plateau Fractures. Acta Ortop. Bras. 2020, 28, 216–220. [Google Scholar] [CrossRef]
- Thürig, G.; Korthaus, A.; Frosch, K.H.; Krause, M. The Value of Magnetic Resonance Imaging in the Preoperative Diagnosis of Tibial Plateau Fractures: A Systematic Literature Review. Eur. J. Trauma Emerg. Surg. 2023, 49, 661–679. [Google Scholar] [CrossRef]
- Collins, N.J.; Misra, D.; Felson, D.T.; Crossley, K.M.; Roos, E.M. Measures of Knee Function: International Knee Documentation Committee (IKDC) Subjective Knee Evaluation Form, Knee Injury and Osteoarthritis Outcome Score (KOOS), Knee Injury and Osteoarthritis Outcome Score Physical Function Short Form (KOOS-PS), Knee Outcome Survey Activities of Daily Living Scale (KOS-ADL), Lysholm Knee Scoring Scale, Oxford Knee Score (OKS), Western Ontario and McMaster Universities Osteoarthritis Index (WOMAC), Activity Rating Scale (ARS), and Tegner Activity Score (TAS). Arthritis Care Res. 2011, 63 (Suppl. S11), S208–S228. [Google Scholar] [CrossRef]
- Roos, E.M.; Roos, H.P.; Lohmander, L.S.; Ekdahl, C.; Beynnon, B.D. Knee Injury and Osteoarthritis Outcome Score (KOOS)—Development of a Self-Administered Outcome Measure. J. Orthop. Sports Phys. Ther. 1998, 28, 88–96. [Google Scholar] [CrossRef] [PubMed]
- Ricupito, R.; Miraglia, N. La Riabilitazione Post-Intervento di Ricostruzione del LCA. In Legamento Crociato Anteriore. Dalle Basi Teoriche all’Approccio Evidence Based: Un Percorso Guidato dall’Infortunio al Ritorno allo Sport; Miraglia, N., Ed.; FisioScience: Verona, Italy, 2022. [Google Scholar]
- Wrona, H.L.; Zerega, R.; King, V.G.; Reiter, C.R.; Odum, S.; Manifold, D.; Latorre, K.; Sell, T.C. Ability of Countermovement Jumps to Detect Bilateral Asymmetry in Hip and Knee Strength in Elite Youth Soccer Players. Sports 2023, 11, 77. [Google Scholar] [CrossRef]
- Segato, L. Guida al Ragionamento e alla Valutazione di un Paziente con Sospetta Lesione del Legamento Crociato Anteriore. In Legamento Crociato Anteriore. Dalle Basi Teoriche all’Approccio Evidence Based: Un Percorso Guidato dall’Infortunio al Ritorno allo Sport; Miraglia, N., Ed.; FisioScience: Verona, Italy, 2022. [Google Scholar]
- Coffey, R.; Bordoni, B. Lachman Test. In StatPearls [Internet]; StatPearls Publishing: Treasure Island, FL, USA, 2022. [Google Scholar] [PubMed]
- Benjaminse, A.; Gokeler, A.; van der Schans, C.P. Clinical Diagnosis of an Anterior Cruciate Ligament Rupture: A Meta-Analysis. J. Orthop. Sports Phys. Ther. 2006, 36, 267–288. [Google Scholar] [CrossRef] [PubMed]
- Shekarchi, B.; Panahi, A.; Raeissadat, S.A.; Maleki, N.; Nayebabbas, S.; Farhadi, P. Comparison of Thessaly Test with Joint Line Tenderness and McMurray Test in the Diagnosis of Meniscal Tears. Malays. Orthop. J. 2020, 14, 94–100. [Google Scholar] [CrossRef] [PubMed]
- Shrier, I.; Boudier-Revéret, M.; Fahmy, K. Understanding the Different Physical Examination Tests for Suspected Meniscal Tears. Curr. Sports Med. Rep. 2010, 9, 284–289. [Google Scholar] [CrossRef]
- Nishiumi, D.; Nishioka, T.; Saito, H.; Kurokawa, T.; Hirose, N. Associations of Eccentric Force Variables during Jumping and Eccentric Lower-Limb Strength with Vertical Jump Performance: A Systematic Review. PLoS ONE 2023, 18, e0289631. [Google Scholar] [CrossRef]
- Vosoughi, F.; Rezaei Dogahe, R.; Nuri, A.; Ayati Firoozabadi, M.; Mortazavi, J. Medial Collateral Ligament Injury of the Knee: A Review on Current Concept and Management. Arch. Bone Jt. Surg. 2021, 9, 255–262. [Google Scholar] [CrossRef]
- Hawker, G.A.; Mian, S.; Kendzerska, T.; French, M. Measures of Adult Pain: Visual Analog Scale for Pain (VAS Pain), Numeric Rating Scale for Pain (NRS Pain), McGill Pain Questionnaire (MPQ), Short-Form McGill Pain Questionnaire (SF-MPQ), Chronic Pain Grade Scale (CPGS), Short Form-36 Bodily Pain Scale (SF-36 BPS), and Measure of Intermittent and Constant Osteoarthritis Pain (ICOAP). Arthritis Care Res. 2011, 63 (Suppl. S11), S240–S252. [Google Scholar] [CrossRef]
- Liow, R.Y.; Walker, K.; Wajid, M.A.; Bedi, G.; Lennox, C.M. The Reliability of the American Knee Society Score. Acta Orthop. Scand. 2000, 71, 603–608. [Google Scholar] [CrossRef]
- Monticone, M.; Ferrante, S.; Salvaderi, S.; Rocca, B.; Totti, V.; Foti, C.; Roi, G.S. Development of the Italian Version of the Knee Injury and Osteoarthritis Outcome Score for Patients with Knee Injuries: Cross-Cultural Adaptation, Dimensionality, Reliability, and Validity. Osteoarthr. Cartil. 2012, 20, 330–335. [Google Scholar] [CrossRef] [PubMed]
- Apolone, G.; Mosconi, P. The Italian SF-36 Health Survey: Translation, Validation and Norming. J. Clin. Epidemiol. 1998, 51, 1025–1036. [Google Scholar] [CrossRef] [PubMed]
- Quintens, L.; Van den Berg, J.; Reul, M.; Van Lieshout, E.; Nijs, S.; Verhofstad, M.; Hoekstra, H. Poor Sporting Abilities after Tibial Plateau Fractures Involving the Posterior Column: How Can We Do Better? Eur. J. Trauma Emerg. Surg. 2021, 47, 201–209. [Google Scholar] [CrossRef] [PubMed]
- Canton, G.; Sborgia, A.; Dussi, M.; Rasio, N.; Murena, L. Early Weight Bearing in Tibial Plateau Fractures Treated with ORIF: A Systematic Review of Literature. J. Orthop. Surg. Res. 2022, 17, 261. [Google Scholar] [CrossRef]
- Iliopoulos, E.; Agarwal, S.; Khaleel, A. Walking Impairments after Severe Tibia Plateau Fractures: A Gait Pattern Analysis. J. Orthop. Sci. 2020, 25, 276–278. [Google Scholar] [CrossRef]
- Kalmet, P.H.S.; Van Horn, Y.Y.; Sanduleanu, S.; Seelen, H.A.M.; Brink, P.R.G.; Poeze, M. Patient-Reported Quality of Life and Pain after Permissive Weight Bearing in Surgically Treated Trauma Patients with Tibial Plateau Fractures: A Retrospective Cohort Study. Arch. Orthop. Trauma Surg. 2019, 139, 483–488. [Google Scholar] [CrossRef]
- Polat, B.; Gurpinar, T.; Polat, A.E.; Ozturkmen, Y. Factors Influencing the Functional Outcomes of Tibia Plateau Fractures after Surgical Fixation. Niger. J. Clin. Pract. 2019, 22, 1715–1721. [Google Scholar] [CrossRef]
- Labban, W.; Stadnyk, M.; Sommerfeldt, M.; Nathanail, S.; Dennett, L.; Westover, L.; Manaseer, T.; Beaupre, L. Kinetic Measurement System Use in Individuals Following Anterior Cruciate Ligament Reconstruction: A Scoping Review of Methodological Approaches. J. Exp. Orthop. 2021, 8, 81. [Google Scholar] [CrossRef]
- Heishman, A.D.; Daub, B.D.; Miller, R.M.; Freitas, E.D.S.; Frantz, B.A.; Bemben, M.G. Countermovement Jump Reliability Performed with and Without an Arm Swing in NCAA Division 1 Intercollegiate Basketball Players. J. Strength Cond. Res. 2020, 34, 546–558. [Google Scholar] [CrossRef]
- Maffiuletti, N.A.; Aagaard, P.; Blazevich, A.J.; Folland, J.; Tillin, N.; Duchateau, J. Rate of Force Development: Physiological and Methodological Considerations. Eur. J. Appl. Physiol. 2016, 116, 1091–1116. [Google Scholar] [CrossRef]
- D’Emanuele, S.; Maffiuletti, N.A.; Tarperi, C.; Rainoldi, A.; Schena, F.; Boccia, G. Rate of Force Development as an Indicator of Neuromuscular Fatigue: A Scoping Review. Front. Hum. Neurosci. 2021, 15, 701916. [Google Scholar] [CrossRef] [PubMed]
- Lomborg, S.D.; Dalgas, U.; Hvid, L.G. The Importance of Neuromuscular Rate of Force Development for Physical Function in Aging and Common Neurodegenerative Disorders—A Systematic Review. J. Musculoskelet. Neuronal Interact. 2022, 22, 562–586. [Google Scholar] [PubMed]
- Struzik, A.; Karamanidis, K.; Lorimer, A.; Keogh, J.W.L.; Gajewski, J. Application of Leg, Vertical, and Joint Stiffness in Running Performance: A Literature Overview. Appl. Bionics Biomech. 2021, 2021, 9914278. [Google Scholar] [CrossRef] [PubMed]
- Fukutani, A.; Isaka, T.; Herzog, W. Evidence for Muscle Cell-Based Mechanisms of Enhanced Performance in Stretch-Shortening Cycle in Skeletal Muscle. Front. Physiol. 2021, 11, 609553. [Google Scholar] [CrossRef]
- Shi, L.; Cai, Z.; Chen, S.; Han, D. Acute Effects of Variable Resistance Training on Force, Velocity, and Power Measures: A Systematic Review and Meta-Analysis. PeerJ 2022, 10, e13870. [Google Scholar] [CrossRef]


| Variable | Overall | Mono-Condylar Fracture Patient Group | Bi-Condylar Fracture Patient Group |
|---|---|---|---|
| Number of patients | 28 | 17 (61%) | 11 (39%) |
| Gender, number (%) | |||
| Male | 15 (54%) | 10 (59%) | 5 (45%) |
| Female | 13 (46%) | 7 (41%) | 6 (55%) |
| Age (SD) | 54.89 ± 8.89 | 54.71 ± 9.81 | 55.18 ± 7.70 |
| BMI kg/m2 (SD) | 25.6 ± 5.4 | 27.27 ± 5.50 | 22.96 ± 4.13 |
| Knee (%) | |||
| Right | 15 (54%) | 9 (53%) | 5 (45%) |
| Left | 13 (46%) | 8 (47%) | 6 (55%) |
| Follow-up time (SD) | 9.10 ± 2.33 | 8.47 ± 2.03 | 10.01 ± 2.51 |
| Endpoint | Mono-Condylar Fracture Patient Group (N = 17) | Bi-Condylar Fracture Patient Group (N = 11) | MD | p |
|---|---|---|---|---|
| KOOS-I | 86.0 ± 15.6 | 64.6 ± 28.9 | 21.4 | 0.04 |
| TAS | 3.6 ± 0.9 | 3.1 ± 1.4 | 0.6 | 0.3 |
| IKDC | 80.3 ± 12.1 | 64.6 ± 21.8 | 15.7 | 0.04 |
| LKSS | 90.1 ± 15.6 | 72.6 ± 30.2 | 17.5 | 0.1 |
| NPRS | 41.2 ± 106.4 | 409.1 ± 202.3 | −67.9 | 0.3 |
| AKSS | 95.3 ± 12.8 | 70.5 ± 29.2 | 24.8 | 0.02 |
| SF-36 | 87.8 ± 7.7 | 70.3 ± 22.8 | 17.5 | 0.03 |
| Endpoint | Mono-Condylar Fracture Patient Group (N = 17) | Bi-Condylar Fracture Patient Group (N = 11) | MD | p |
|---|---|---|---|---|
| Flexion (°) | 122.8 ± 11.6 | 105.5 ± 22.7 | 17.3 | 0.04 |
| Extension (°) | 6.1 ± 5.8 | −2.5 ± 15.0 | 8.5 | 0.1 |
| Endpoint | Mono-Condylar Fracture Patient Group (N = 17) | Bi-Condylar Fracture Patient Group (N = 11) | MD | p |
|---|---|---|---|---|
| Flexion (N) | 109.0 ± 36.7 | 103.5 ± 30.1 | 5.5 | 0.7 |
| Extension (N) | 196.8 ± 84.6 | 181.2 ± 73.6 | 15.6 | 0.6 |
| Endpoint | Mono-Condylar Fracture Patient Group (N = 17) | Bi-Condylar Fracture Patient Group (N = 11) | MD | p |
|---|---|---|---|---|
| Total Excursion (cm) | 997.8 ± 564.7 | 800.6 ± 322.1 | 197.2 | 0.3 |
| CoP Range—Mean Velocity (m/s) | 66.5 ± 37.6 | 53.4 ± 21.5 | 13.2 | 0.3 |
| CoP Range—Medial–Lateral (cm) | 38.2 ± 15.7 | 35.1 ± 13.0 | 3.1 | 0.6 |
| CoP Range—Anterior–Posterior (cm) | 54.5 ± 34.4 | 57.8 ± 31.8 | −3.4 | 0.8 |
| Endpoint | Mono-Condylar Fracture Patient Group (N = 17) | Bi-Condylar Fracture Patient Group (N = 11) | MD | p |
|---|---|---|---|---|
| Performance—Concentric RFD (N/s) | 2315.5 ± 846.2 | 1533.2 ± 933.1 | 782.2 | 0.03 |
| Performance—Jump Height (cm) | 11.2 ± 4.1 | 8.4 ± 5.3 | 2.8 | 0.2 |
| Asymmetry—Concentric Mean Force (N) | 467.6 ± 126.3 | 472.5 ± 105.6 | −4.8 | 0.9 |
| Asymmetry—Concentric RFD (N/s) | 745.3 ± 481.3 | 932.8 ± 373.6 | −187.5 | 0.3 |
| Endpoint | Mono-Condylar Fracture Patient Group (N = 17) | Bi-Condylar Fracture Patient Group (N = 11) | MD | p |
|---|---|---|---|---|
| Performance—Jump Height (cm) | 12.3 ± 4.5 | 10.3 ± 6.1 | 2.0 | 0.4 |
| Performance—Concentric RFD (N/s) | 3410.8 ± 2260.0 | 2165.8 ± 1595.9 | 1245.0 | 0.1 |
| Asymmetry—Concentric Mean Force (N) | 546.6 ± 162.8 | 577.9 ± 128.1 | −31.3 | 0.6 |
| Asymmetry—Eccentric Mean Force (N) | 360.2 ± 99.4 | 384.3 ± 108.1 | −24.1 | 0.6 |
| Asymmetry—Concentric RFD (N/s) | 1147.1 ± 790.7 | 1631.3 ± 166.7 | −484.2 | 0.2 |
| Endpoint | Mono-Condylar Fracture Patient Group (N = 17) | Bi-Condylar Fracture Patient Group (N = 11) | MD | p |
|---|---|---|---|---|
| Performance—Jump Height (cm) | 15.1 ± 5.6 | 13.4 ± 7.2 | 1.8 | 0.5 |
| Performance—Concentric RFD (N/s) | 2903.1 ± 1990.3 | 1357.8 ± 940.3 | −1545.3 | 0.04 |
| Asymmetry—Concentric Mean Force (N) | 558.1 ± 170.6 | 564.9 ± 185.5 | −6.8 | 0.9 |
| Asymmetry—Eccentric Mean Force (N) | 354.2 ± 95.3 | 382.1 ± 95.6 | −27.9 | 0.5 |
| Asymmetry—Concentric RFD (N/s) | 667.4 ± 375.7 | 1289.7 ± 860.1 | −622.3 | 0.04 |
Disclaimer/Publisher’s Note: The statements, opinions and data contained in all publications are solely those of the individual author(s) and contributor(s) and not of MDPI and/or the editor(s). MDPI and/or the editor(s) disclaim responsibility for any injury to people or property resulting from any ideas, methods, instructions or products referred to in the content. |
© 2025 by the authors. Licensee MDPI, Basel, Switzerland. This article is an open access article distributed under the terms and conditions of the Creative Commons Attribution (CC BY) license (https://creativecommons.org/licenses/by/4.0/).
Share and Cite
Biz, C.; Stecco, C.; Perissinotto, S.; Zhao, X.; Ierardi, R.; Puce, L.; Migliorini, F.; Bragazzi, N.L.; Ruggieri, P. Diagnostic Predictors of Recovery Outcomes Following Open Reduction and Internal Fixation for Tibial Plateau Fractures: A Retrospective Study Based on the Schatzker Classification. Diagnostics 2025, 15, 1304. https://doi.org/10.3390/diagnostics15111304
Biz C, Stecco C, Perissinotto S, Zhao X, Ierardi R, Puce L, Migliorini F, Bragazzi NL, Ruggieri P. Diagnostic Predictors of Recovery Outcomes Following Open Reduction and Internal Fixation for Tibial Plateau Fractures: A Retrospective Study Based on the Schatzker Classification. Diagnostics. 2025; 15(11):1304. https://doi.org/10.3390/diagnostics15111304
Chicago/Turabian StyleBiz, Carlo, Carla Stecco, Samuele Perissinotto, Xiaoxiao Zhao, Raffaele Ierardi, Luca Puce, Filippo Migliorini, Nicola Luigi Bragazzi, and Pietro Ruggieri. 2025. "Diagnostic Predictors of Recovery Outcomes Following Open Reduction and Internal Fixation for Tibial Plateau Fractures: A Retrospective Study Based on the Schatzker Classification" Diagnostics 15, no. 11: 1304. https://doi.org/10.3390/diagnostics15111304
APA StyleBiz, C., Stecco, C., Perissinotto, S., Zhao, X., Ierardi, R., Puce, L., Migliorini, F., Bragazzi, N. L., & Ruggieri, P. (2025). Diagnostic Predictors of Recovery Outcomes Following Open Reduction and Internal Fixation for Tibial Plateau Fractures: A Retrospective Study Based on the Schatzker Classification. Diagnostics, 15(11), 1304. https://doi.org/10.3390/diagnostics15111304