
Imaging of the Liver and Pancreas: The Added Value of MRI


Abstract
1. Introduction
2. Liver
3. Pancreas
4. Conclusions
Funding
Conflicts of Interest
References
- Runge, V.M.; Heverhagen, J.T. A New Era in Magnetic Resonance Contrast Media. Investig. Radiol. 2024, 59, 105–107. [Google Scholar] [CrossRef]
- Rofsky, N.M.; Weinreb, J.C.; Ambrosino, M.M.; Safir, J.; Krinsky, G. Comparison between in-phase and opposed-phase T1-weighted breath-hold FLASH sequences for hepatic imaging. J. Comput. Assist. Tomogr. 1996, 20, 230–235. [Google Scholar] [CrossRef] [PubMed]
- Jayachandran, A.; Shrestha, R.; Bridle, K.R.; Crawford, D.H.G. Association between hereditary hemochromatosis and hepatocellular carcinoma: A comprehensive review. Hepatoma Res. 2020, 6, 8. [Google Scholar] [CrossRef]
- Michaely, H.J.; Morelli, J.N.; Budjan, J.; Riffel, P.; Nickel, D.; Kroeker, R.; Schoenberg, S.O.; Attenberger, U.I. CAIPIRINHA-Dixon-TWIST (CDT)-volume-interpolated breath-hold examination (VIBE): A new technique for fast time-resolved dynamic 3-dimensional imaging of the abdomen with high spatial resolution. Investig. Radiol. 2013, 48, 590–597. [Google Scholar] [CrossRef] [PubMed]
- Griffin, N.; Charles-Edwards, G.; Grant, L.A. Magnetic resonance cholangiopancreatography: The ABC of MRCP. Insights Imaging 2012, 3, 11–21. [Google Scholar] [CrossRef] [PubMed]
- Lim, J.S.; Kim, M.-J.; Myoung, S.; Park, M.-S.; Choi, J.-Y.; Kim, S.I. MR cholangiography for evaluation of hilar branching anatomy in transplantation of the right hepatic lobe from a living donor. AJR Am. J. Roentgenol. 2008, 191, 537–545. [Google Scholar] [CrossRef] [PubMed]
- Fontarensky, M.; Montoriol, P.-F.; Buc, E.; Poincloux, L.; Petitcolin, V.; Da Ines, D. Advantages of gadobenate dimeglumine-enhanced MR cholangiography in the diagnosis of post-liver transplant bile leakage. Diagn. Interv. Imaging 2013, 94, 443–452. [Google Scholar] [CrossRef] [PubMed][Green Version]
- Suzuki, T.; Aonuma, T.; Oyama, K.; Yamada, A.; Kitoh, Y.; Adachi, Y.; Hayashihara, H.; Nickel, M.D.; Maruyama, K.; Fujinaga, Y. High-resolution three-dimensional T1-weighted hepatobiliary MR cholangiography using Gd-EOB-DTPA for assessment of biliary tree anatomy: Parallel imaging versus compressed sensing. Eur. J. Radiol. 2021, 136, 109515. [Google Scholar] [CrossRef] [PubMed]
- Charles-Edwards, E.M.; de Souza, N.M. Diffusion-weighted magnetic resonance imaging and its application to cancer. Cancer Imaging 2006, 6, 135–143. [Google Scholar] [CrossRef] [PubMed]
- Lewis, S.; Dyvorne, H.; Cui, Y.; Taouli, B. Diffusion-weighted imaging of the liver: Techniques and applications. Magn. Reson. Imaging Clin. N. Am. 2014, 22, 373–395. [Google Scholar] [CrossRef]
- Floriani, I.; Torri, V.; Rulli, E.; Garavaglia, D.; Compagnoni, A.; Salvolini, L.; Giovagnoni, A. Performance of imaging modalities in diagnosis of liver metastases from colorectal cancer: A systematic review and meta-analysis. J. Magn. Reson. Imaging 2010, 31, 19–31. [Google Scholar] [CrossRef] [PubMed]
- Shin, S.K.; Kim, Y.S.; Choi, S.J.; Shim, Y.S.; Jung, D.H.; Kwon, O.S.; Choi, D.J.; Kim, J.H. Characterization of small (≤3 cm) hepatic lesions with atypical enhancement feature and hypointensity in hepatobiliary phase of gadoxetic acid-enhanced MRI in cirrhosis: A STARD-compliant article. Medicine 2017, 96, e7278. [Google Scholar] [CrossRef] [PubMed]
- Chan, J.H.M.; Tsui, E.Y.K.; Luk, S.H.; Fung, A.S.L.; Yuen, M.K.; Szeto, M.L.; Cheung, Y.K.; Wong, K.P.C. Diffusion-weighted MR imaging of the liver: Distinguishing hepatic abscess from cystic or necrotic tumor. Abdom. Imaging 2001, 26, 161–165. [Google Scholar] [CrossRef] [PubMed]
- Sobeh, T.; Inbar, Y.; Apter, S.; Soffer, S.; Anteby, R.; Kraus, M.; Konen, E.; Klang, E. Diffusion-weighted MRI for predicting and assessing treatment response of liver metastases from CRC—A systematic review and meta-analysis. Eur. J. Radiol. 2023, 163, 110810. [Google Scholar] [CrossRef] [PubMed]
- Ou, H.-Y.; Cheng, Y.-F.; Chuang, Y.-H.; Hsu, H.-W.; Chen, C.-L.; Lazo, M.Z.; Weng, C.-C.; Yu, C.-Y.; Tsang, L.L.-C.; Huang, T.-L.; et al. Quantification of Functional MR Predicts Early Response in Post-doxorubicin Drug-Eluting Beads Chemoembolization for Hepatocellular Carcinoma. Dig. Dis. Sci. 2020, 65, 2433–2441. [Google Scholar] [CrossRef] [PubMed]
- Alis, D.; Durmaz, E.S.M.; Gulsen, F.; Bas, A.; Kabasakal, L.; Sager, S.; Numan, F. Prognostic value of ADC measurements in predicting overall survival in patients undergoing 90Y radioembolization for colorectal cancer liver metastases. Clin. Imaging 2019, 57, 124–130. [Google Scholar] [CrossRef] [PubMed]
- Shenoy-Bhangle, A.; Baliyan, V.; Kordbacheh, H.; Guimaraes, A.R.; Kambadakone, A. Diffusion weighted magnetic resonance imaging of liver: Principles, clinical applications and recent updates. World J. Hepatol. 2017, 9, 1081–1091. [Google Scholar] [CrossRef] [PubMed]
- Hill, D.V.; Tirkes, T. Advanced MR Imaging of the Pancreas. Magn. Reson. Imaging Clin. N. Am. 2020, 28, 353–367. [Google Scholar] [CrossRef] [PubMed]
- Diao, K.-Y.; Yang, Z.-G.; Xu, H.-Y.; Liu, X.; Zhang, Q.; Shi, K.; Jiang, L.; Xie, L.-J.; Wen, L.-Y.; Guo, Y.-K. Histologic validation of myocardial fibrosis measured by T1 mapping: A systematic review and meta-analysis. J. Cardiovasc. Magn. Reson. 2016, 18, 92. [Google Scholar] [CrossRef] [PubMed]
- Dekkers, I.A.; Lamb, H.J. Clinical application and technical considerations of T1 & T2(*) mapping in cardiac, liver, and renal imaging. Br. J. Radiol. 2018, 91, 20170825. [Google Scholar] [CrossRef]
- Frydrychowicz, A.; Nagle, S.K.; D’Souza, S.L.; Vigen, K.K.; Reeder, S.B. Optimized high-resolution contrast-enhanced hepatobiliary imaging at 3 tesla: A cross-over comparison of gadobenate dimeglumine and gadoxetic acid. J. Magn. Reson. Imaging 2011, 34, 585–594. [Google Scholar] [CrossRef] [PubMed]
- Morana, G.; Salviato, E.; Guarise, A. Contrast agents for hepatic MRI. Cancer Imaging 2007, 7, S24–S27. [Google Scholar] [CrossRef] [PubMed]
- Grazioli, L.; Morana, G.; Federle, M.P.; Brancatelli, G.; Testoni, M.; Kirchin, M.A.; Menni, K.; Olivetti, L.; Nicoli, N.; Procacci, C. Focal nodular hyperplasia: Morphologic and functional information from MR imaging with gadobenate dimeglumine. Radiology 2001, 221, 731–739. [Google Scholar] [CrossRef] [PubMed]
- Grazioli, L.; Morana, G.; Kirchin, M.A.; Schneider, G. Accurate differentiation of focal nodular hyperplasia from hepatic adenoma at gadobenate dimeglumine-enhanced MR imaging: Prospective study. Radiology 2005, 236, 166–177. [Google Scholar] [CrossRef] [PubMed]
- Inchingolo, R.; De Gaetano, A.M.; Curione, D.; Ciresa, M.; Miele, L.; Pompili, M.; Vecchio, F.M.; Giuliante, F.; Bonomo, L. Role of diffusion-weighted imaging, apparent diffusion coefficient and correlation with hepatobiliary phase findings in the differentiation of hepatocellular carcinoma from dysplastic nodules in cirrhotic liver. Eur. Radiol. 2015, 25, 1087–1096. [Google Scholar] [CrossRef]
- Schaible, J.; Schreyer, A.G.; Mehrabi, A.; Longerich, T.; Kieser, M.; Kreimeyer, S.; Klauss, M.; Grenacher, L. Subtyping of hepatocellular adenomas using Gd-EOB-DTPA: A qualitative and quantitative analysis. Acta Radiol. 2023, 64, 2253–2260. [Google Scholar] [CrossRef] [PubMed]
- Morana, G.; Grazioli, L.; Kirchin, M.A.; Bondioni, M.P.; Faccioli, N.; Guarise, A.; Schneider, G. Solid hypervascular liver lesions: Accurate identification of true benign lesions on enhanced dynamic and hepatobiliary phase magnetic resonance imaging after gadobenate dimeglumine administration. Investig. Radiol. 2011, 46, 225–239. [Google Scholar] [CrossRef] [PubMed]
- Kartalis, N.; Lindholm, T.L.; Aspelin, P.; Permert, J.; Albiin, N. Diffusion-weighted magnetic resonance imaging of pancreas tumours. Eur. Radiol. 2009, 19, 1981–1990. [Google Scholar] [CrossRef] [PubMed]
- Zhu, M.; Zhang, C.; Yan, J.; Sun, J.; Zhao, X.; Zhang, L.; Yin, L. Accuracy of quantitative diffusion-weighted imaging for differentiating benign and malignant pancreatic lesions: A systematic review and meta-analysis. Eur. Radiol. 2021, 31, 7746–7759. [Google Scholar] [CrossRef]
- Ha, J.; Choi, S.H.; Kim, K.W.; Kim, J.H.; Kim, H.J. MRI features for differentiation of autoimmune pancreatitis from pancreatic ductal adenocarcinoma: A systematic review and meta-analysis. Dig. Liver Dis. 2022, 54, 849–856. [Google Scholar] [CrossRef] [PubMed]
- Harder, F.N.; Jung, E.; Weiss, K.; Graf, M.M.; Kamal, O.; McTavish, S.; Van, A.T.; Demir, I.E.; Friess, H.; Phillip, V.; et al. Computed high-b-value high-resolution DWI improves solid lesion detection in IPMN of the pancreas. Eur. Radiol. 2023, 33, 6892–6901. [Google Scholar] [CrossRef] [PubMed]
- D’Onofrio, M.; Tedesco, G.; Cardobi, N.; De Robertis, R.; Sarno, A.; Capelli, P.; Martini, P.T.; Giannotti, G.; Beleù, A.; Marchegiani, G.; et al. Magnetic resonance (MR) for mural nodule detection studying Intraductal papillary mucinous neoplasms (IPMN) of pancreas: Imaging-pathologic correlation. Pancreatology 2021, 21, 180–187. [Google Scholar] [CrossRef] [PubMed]
- Xu, F.; Liang, Y.; Guo, W.; Liang, Z.; Li, L.; Xiong, Y.; Ye, G.; Zeng, X. Diagnostic Performance of Diffusion-Weighted Imaging for Differentiating Malignant from Benign Intraductal Papillary Mucinous Neoplasms of the Pancreas: A Systematic Review and Meta-Analysis. Front. Oncol. 2021, 11, 637681. [Google Scholar] [CrossRef] [PubMed]
- Kim, M.; Jang, K.M.; Kim, S.H.; Song, K.D.; Jeong, W.K.; Kang, T.W.; Kim, Y.K.; Cha, D.I.; Kim, K.; Yoo, H. Diagnostic accuracy of diffusion restriction in intraductal papillary mucinous neoplasm of the pancreas in comparison with “high-risk stigmata” of the 2012 international consensus guidelines for prediction of the malignancy and invasiveness. Acta Radiol. 2017, 58, 1157–1166. [Google Scholar] [CrossRef] [PubMed]
- Kang, K.M.; Lee, J.M.; Shin, C.; Baek, J.H.; Kim, S.H.; Yoon, J.H.; Han, J.K.; Choi, B.I. Added value of diffusion-weighted imaging to MR cholangiopancreatography with unenhanced mr imaging for predicting malignancy or invasiveness of intraductal papillary mucinous neoplasm of the pancreas. J. Magn. Reson. Imaging 2013, 38, 555–563. [Google Scholar] [CrossRef] [PubMed]
- Pandey, P.; Pandey, A.; Shao, N.; Varzaneh, F.N.; Ghasabeh, M.A.; Zharghampour, M.; Khoshpouri, P.; Fouladi, D.; Eng, J.; O’broin-Lennon, A.M.; et al. Added value of apparent diffusion coefficient in distinguishing between serous and mucin-producing pancreatic cystic neoplasms. Eur. Radiol. 2019, 29, 4660–4669. [Google Scholar] [CrossRef] [PubMed]
- Pozzessere, C.; Gutiérrez, S.L.C.; Corona-Villalobos, C.P.; Righi, L.; Xu, C.; Lennon, A.M.M.; Wolfgang, C.L.; Hruban, R.H.; Goggins, M.; Canto, M.I.M.; et al. Diffusion-Weighted MR imaging in distinguishing between mucin-producing and serous pancreatic cysts. J. Comput. Assist. Tomogr. 2016, 40, 505–512. [Google Scholar] [CrossRef] [PubMed]
- Islim, F.; Salik, A.E.; Bayramoglu, S.; Guven, K.; Alis, H.; Turhan, A.N. Non-invasive detection of infection in acute pancreatic and acute necrotic collections with diffusion-weighted magnetic resonance imaging: Preliminary findings. Abdom. Imaging 2014, 39, 472–481. [Google Scholar] [CrossRef] [PubMed]
- Maio, F.; Pasqualino, V.; Bertana, L.; Venturini, S.; Cantoni, V.; Fusaro, M.; Morana, G. Pancreatic cancer detection with a non-contrast MR protocol: Is it reliable? Radiol. Med. 2023, 128, 1035–1046. [Google Scholar] [CrossRef] [PubMed]
- Kim, K.A.; Park, M.; Kim, I.; Kiefer, B.; Chung, W.; Kim, M.; Kim, K.W. Quantitative evaluation of liver cirrhosis using T1 relaxation time with 3 tesla MRI before and after oxygen inhalation. J. Magn. Reson. Imaging 2012, 36, 405–410. [Google Scholar] [CrossRef]
- Tirkes, T.; Lin, C.; Fogel, E.L.; Sherman, S.S.; Wang, Q.; Sandrasegaran, K. T1 mapping for diagnosis of mild chronic pancreatitis. J. Magn. Reson. Imaging 2017, 45, 1171–1176. [Google Scholar] [CrossRef] [PubMed]
- Frisch, A.; Walter, T.C.; Hamm, B.; Denecke, T. Efficacy of oral contrast agents for upper gastrointestinal signal suppression in MRCP: A systematic review of the literature. Acta Radiol. Open 2017, 6, 2058460117727315. [Google Scholar] [CrossRef] [PubMed]
- Takahashi, S.; Kim, T.; Murakami, T.; Okada, A.; Hori, M.; Narumi, Y.; Nakamura, H. Influence of paramagnetic contrast on single-shot MRCP image quality. Abdom. Imaging 2000, 25, 511–513. [Google Scholar] [CrossRef] [PubMed]
- Morana, G.; Ciet, P.; Venturini, S. Cystic pancreatic lesions: MR imaging findings and management. Insights Imaging 2021, 12, 115. [Google Scholar] [CrossRef] [PubMed]
- Matos, C.; Winant, C.; Delhaye, M.; Devière, J. Functional MRCP in pancreatic and periampullary disease. Int. J. Gastrointest. Cancer 2001, 30, 5–18. [Google Scholar] [CrossRef] [PubMed]
- Hellerhoff, K.J.; Helmberger, H.; Rösch, T.; Settles, M.R.; Link, T.M.; Rummeny, E.J. Dynamic MR pancreatography after secretin administration: Image quality and diagnostic accuracy. AJR Am. J. Roentgenol. 2002, 179, 121–129. [Google Scholar] [CrossRef]
- Madzak, A.; Olesen, S.S.; Wathle, G.K.; Haldorsen, I.S.; Drewes, A.M.; Frøkjær, J.B. Secretin-Stimulated Magnetic Resonance Imaging Assessment of the Benign Pancreatic Disorders: Systematic Review and Proposal for a Standardized Protocol. Pancreas 2016, 45, 1092–1103. [Google Scholar] [CrossRef] [PubMed]
- Sherman, S.; Freeman, M.L.; Tarnasky, P.R.; Wilcox, C.M.; Kulkarni, A.; Aisen, A.M.; Jacoby, D.; Kozarek, R.A. Administration of secretin (RG1068) increases the sensitivity of detection of duct abnormalities by magnetic resonance cholangiopancreatography in patients with pancreatitis. Gastroenterology 2014, 147, 646–654.e2. [Google Scholar] [CrossRef] [PubMed]
- Ichikawa, T.; Sou, H.; Araki, T.; Arbab, A.S.; Yoshikawa, T.; Ishigame, K.; Haradome, H.; Hachiya, J. Duct-penetrating sign at MRCP: Usefulness for differentiating inflammatory pancreatic mass from pancreatic carcinomas. Radiology 2001, 221, 107–116. [Google Scholar] [CrossRef]


| Clinical Indication | Sequence | Plane | CM Delay | HB Phase (Only after LS-MRCA) | Note |
|---|---|---|---|---|---|
| Healthy liver: characterization of FLL | HASTE T2 | AXIAL | -- | -- | Anatomy and liquids analysis |
| INDICATIONS: MRI is the technique of choice in young patients and pregnant women after a unclear US finding. Moreover, it is useful even after a CT with undefined diagnosis for all patients. | HASTE T2 | CORONAL | -- | -- | Anatomy and liquids analysis |
| DWI b 0–50–400–800 | AXIAL | -- | -- | Restricted diffusion most likely malignant | |
| GRE T1 IN/OUT | AXIAL | -- | -- | Steatosis | |
| GRE T1 3D DYNAMIC | AXIAL | PRE-ART 25″-PORTAL 70″-LATE 180″ | YES (if the lesion is hypervascular) | Benign hypervascular hepatocitic lesions appear hyperintense in HBP | |
| Cirrhotic liver: characterization of FLL/Follow-up after treatment | HASTE T2 | AXIAL | -- | -- | Anatomy and liquids analysis |
| INDICATIONS: MRI is the technique of choice in young patients and pregnant women after a unclear US finding. Moreover, it is useful even after a CT with undefined diagnosis for all patients. | HASTE T2 | CORONAL | -- | -- | Anatomy and liquids analysis |
| DWI b 0–50–400–800 | AXIAL | -- | -- | High signal in b 800 suspicious for HCC | |
| GRE T1 IN/OUT | AXIAL | -- | -- | Steatosis | |
| GRE T1 3D DYNAMIC | AXIAL | PRE-ART 25″-PORTAL 70″-LATE 180″ | YES (if the lesion shows atypical enhancement) | Hypointensity in HBP suspicious for HCC | |
| Follow-up oncological Patient | HASTE T2 | AXIAL | -- | -- | Anatomy and liquids analysis |
| INDICATIONS: MRI is the technique of choice in young patients and pregnant women after a unclear US finding. Moreover, it is useful even after a CT with undefined diagnosis for all patients. It can be alternated to CT in young patients with a long follow-up. | HASTE T2 | CORONAL | -- | -- | Anatomy and liquids analysis |
| DWI b 0–50–400–800 | AXIAL | -- | -- | DWI b50 increases the sensitivity of mets detection | |
| GRE T1 IN/OUT | AXIAL | -- | -- | Steatosis | |
| GRE T1 3D DYNAMIC | AXIAL | PRE-ART 25″-PORTAL 70″-LATE 180″ | YES | HBP increases the sensitivity of metastases detection | |
| Liver abscess/Biliary inflammation/Follow-up in biliary diseases (e.g., PSC)/cholangiocarcinoma | HASTE T2 | AXIAL | -- | -- | Anatomy and liquids analysis |
| INDICATIONS: MRI is the technique of choice in follow-up of PSC or secondary sclerosing cholangitis. Useful for dd between abscess and necrotic malignant lesions. In case of hilar cholangiocarcinoma, it is useful to assess the involvement of biliary ducts as well as the evaluation of biliary anatomy and variants. | HASTE T2 | CORONAL | -- | -- | Anatomy and liquids analysis |
| DWI b 0–50–400–800 | AXIAL | -- | -- | Abscess in ADC map is hypointense | |
| GRE T1 IN/OUT | AXIAL | -- | -- | Steatosis | |
| GRE T1 3D DYNAMIC | AXIAL | PRE-ART 25″-PORTAL 70″-LATE 180″ | NO | For better characterization of abscess and cholangitis | |
| MRCP 3D | OBLIQUE CORONAL | Biliary anatomy and calculi or stenosis | |||
| Biliary calculi | HASTE T2 | AXIAL | -- | -- | Anatomy and liquids analysis |
| Indications: MRI is the technique of choice to detect biliary calculi either in the hepatic parenchyma or in the choledocus. Useful to confirm/exclude biliary calculi in patients with acute pancreatitis. | HASTE T2 | CORONAL | -- | -- | Anatomy and liquids analysis |
| GRE T1 IN/OUT | AXIAL | -- | -- | Steatosis | |
| MRCP 3D | OBLIQUE CORONAL | -- | -- | use MIP and sub MIP for better detection of calculi | |
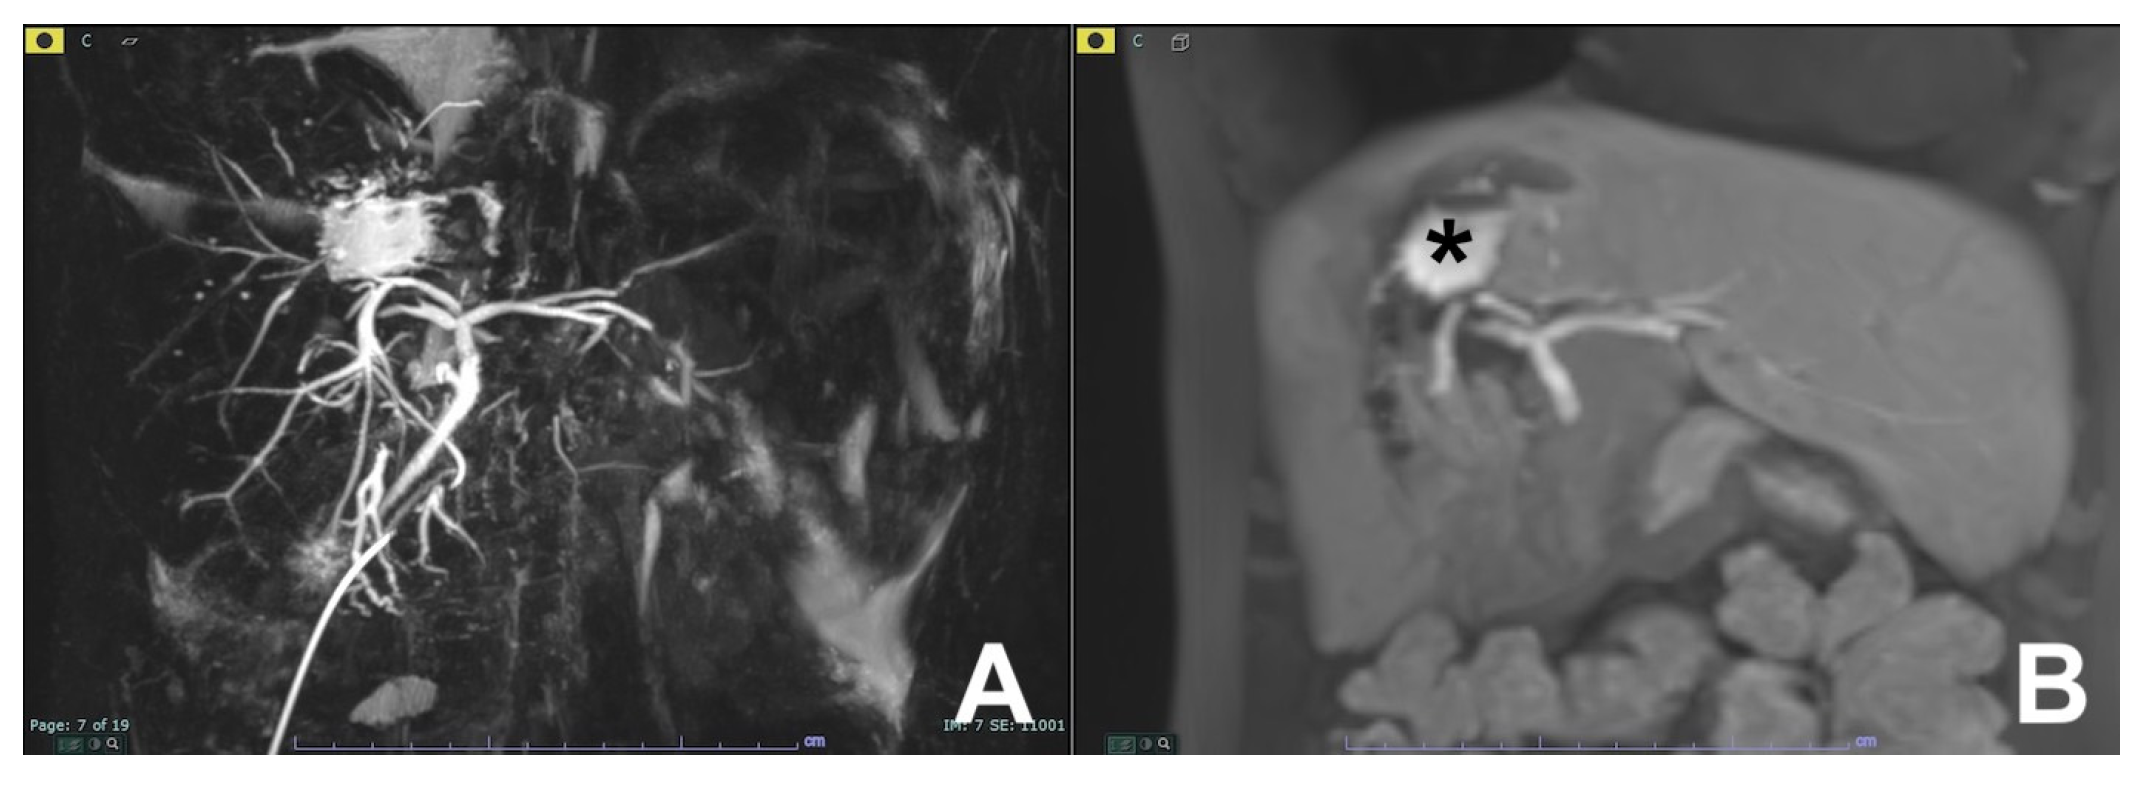
| Biliary leak after surgery or trauma | HASTE T2 | AXIAL | -- | -- | Anatomy and liquids analysis |
| INDICATIONS: MRI, thanks to the use of liver-specific MR contrast agents, can easily detect the site of bile leak. | HASTE T2 | CORONAL | -- | -- | Anatomy and liquids analysis |
| MRCP 3D | OBLIQUE CORONAL | -- | -- | Biliary anatomy and calculi | |
| GRE T1 IN/OUT | AXIAL | -- | -- | Steatosis | |
| GRE T1 3D DYNAMIC | AXIAL | Not necessary | YES high resolution | Useful for leak | |
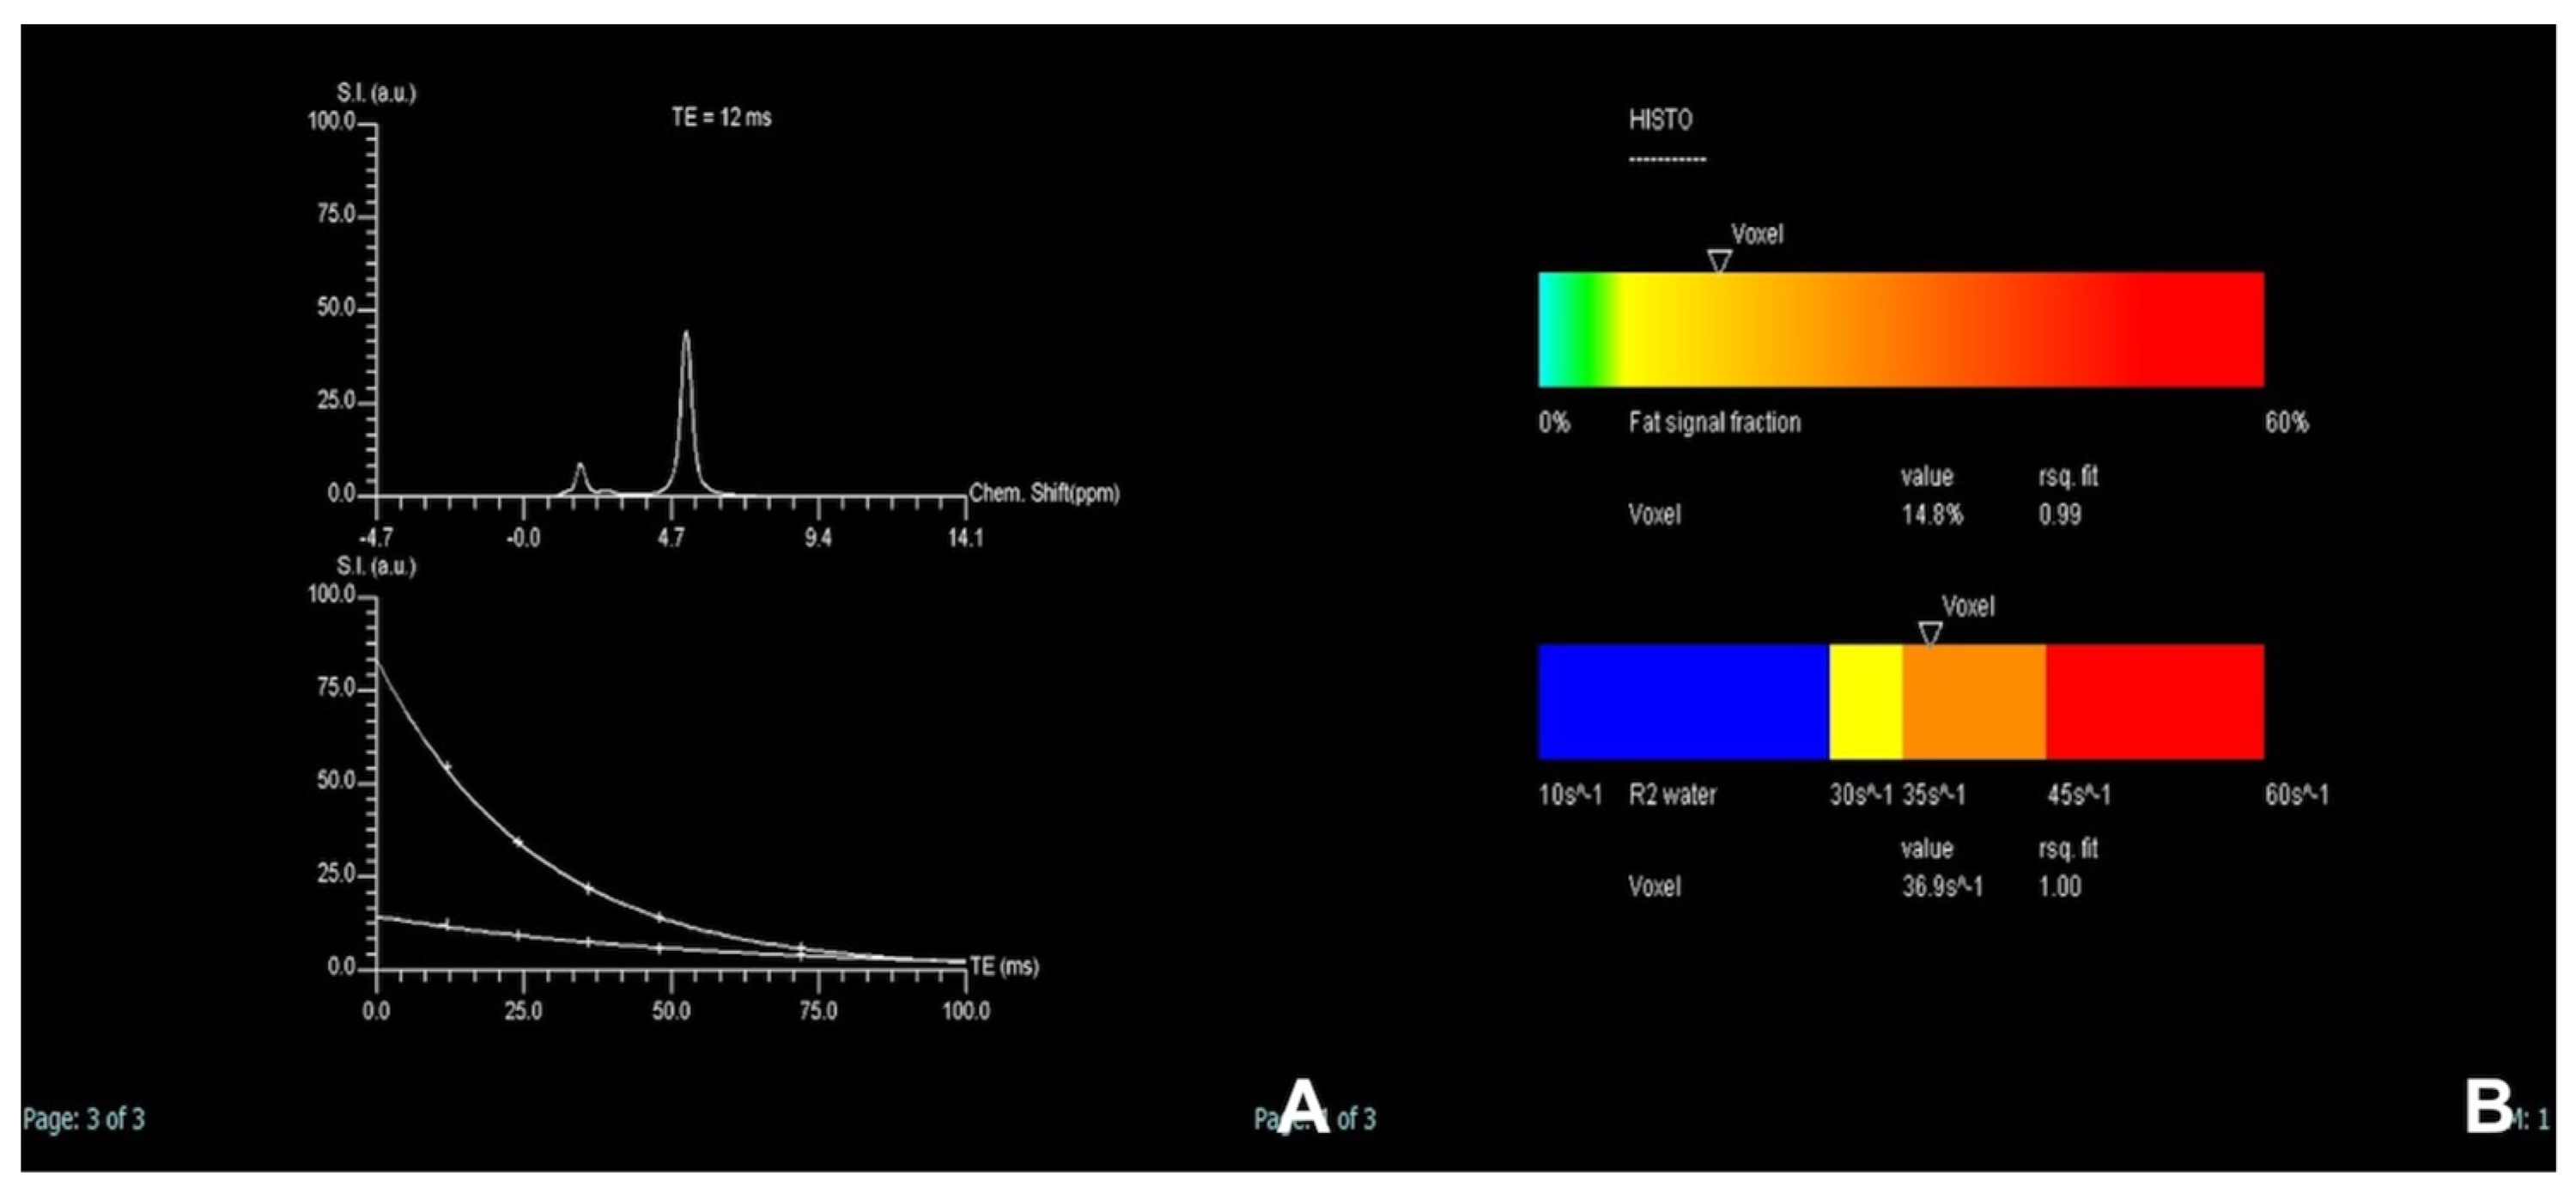
| Iron/fat quantification | HASTE T2 | AXIAL | -- | -- | Anatomy and liquids analysis |
| Indications: MRI is the technique of choice to quantify the amount of fat or iron overload. | HASTE T2 | CORONAL | -- | -- | Anatomy and liquids analysis |
| GRE T1 IN/OUT | AXIAL | -- | -- | Steatosis | |
| GRE Multi echo | AXIAL | -- | -- | For the quantification of fat and iron content | |
| Clinical Indication | Sequence | Plane | CM Delay | Note |
|---|---|---|---|---|
| Acute pancreatitis (AP) | HASTE T2 | AXIAL | -- | Anatomy and analysis of the content of collections |
| Indications: MRI is the technique of choice to detect biliary calculi either in the hepatic parenchyma or in the choledocus. It is useful to confirm/exclude biliary calculi in patients with AP. Moreover, MRI is able to better characterize the content of collections, thus allowing an appropriate management, either percutaneous/endoscopic or surgical. MRI can be used to follow-up AP in young and child-bearing patients. Finally, with DWI it is possible to better identify an infected collection. | HASTE T2 | CORONAL | -- | Anatomy and analysis of the content of collections |
| T1 GRE FS | AXIAL | -- | Pancreatic parenchima assessment | |
| DWI b 0–50–400–800 | AXIAL | -- | Infected collections appear hypointense in the ADC map | |
| GRE T1 3D DYNAMIC | AXIAL | Pre- 25″–70″–180″ | Not always necessary | |
| MRCP 3D/2D | OBLIQUE CORONAL | Anatomy of wirsung duct | ||
| Recurrent Acute pancreatitis (RAR) | HASTE T2 | AXIAL | -- | Anatomy and liquids analysis |
| Indications: MRI is the technique of choice to detect pancreatic abnormalities which can cause episodes of recurrent pancreatitis. Moreover, the use of secretin is able to provide functional information useful for the identification of the causes of RAR not otherwise available. | HASTE T2 | CORONAL | -- | Anatomy and liquids analysis |
| GRE T1 FS | AXIAL | -- | Pancreatic parenchima assessment | |
| DWI b 0–50–400–800 | AXIAL | -- | Not necessary if pancreatic parenchima is normal at GRE T1 FS | |
| MRCP 3D/2D | OBLIQUE CORONAL | Anatomy of wirsung duct | ||
| MRCP 2D with secretin | OBLIQUE CORONAL | Functional information | ||
| Chronic pancreatitis (CP) | HASTE T2 | AXIAL | -- | Anatomy and liquids analysis |
| Indications: MRI is complementary to CT in the diagnosis and management of CP. Although it is not able to visualize calcifications, with MRCP it is able to detect early changes of CP, especially after secretin. Lack of ionizing radiation makes MRI the technique of choice in cases with long follow-up. | HASTE T2 | CORONAL | -- | Anatomy and liquids analysis |
| GRE T1 FS | AXIAL | -- | Pancreatic parenchima assessment | |
| DWI b 0–50–400–800 | AXIAL | -- | Restriction within pancreas can suggest an abnormal condition | |
| GRE T1 3D DYNAMIC | AXIAL | Pre- 25″–70″–180″ | In case of suspicious mass | |
| MRCP 3D/2D | OBLIQUE CORONAL | Anatomy of wirsung duct | ||
| MRCP 2D with secretin | OBLIQUE CORONAL | For the early diagnosis of CP | ||
| Differential diagnosis pancreatic cancer (PC) from mass forming pancreatitis (e.g., paraduodenal pancreatitis-PDP, autoimmune pancreatitis-AIP) | HASTE T2 | AXIAL | -- | Anatomy and liquids analysis |
| Indications: The use of multiparametric imaging (DWI, contrast enhanced) allows one to differentiate with substantial accuracy a mass forming pancreatis from a pancreatic carcinoma. | HASTE T2 | CORONAL | -- | Anatomy and liquids analysis |
| GRE T1 FS | AXIAL | -- | Pancreatic parenchima assessment | |
| DWI b 0–50–400–800 | AXIAL | -- | Restricted diffusion most likely to be PC or AIP | |
| GRE T1 3D DYNAMIC | AXIAL | Pre- 25″–70″–180″ | PC is most likely hypovascular; mass forming pancreatitis usually shows delayed homogeneous enhancement | |
| MRCP 3D/2D | OBLIQUE CORONAL | Anatomy of wirsung duct | ||
| MRCP 2D with secretin | OBLIQUE CORONAL | For the differential diagnosis of pancreatic duct stenosis (“duct penetrating sign”) | ||
| Neuroendocrine tumor of the pancreas (PNEN) | HASTE T2 | AXIAL | -- | Anatomy and liquids analysis |
| Indications: MRI is useful for the detection of PNENs thanks to DWI and contrast enhancement. DWI can suggest the degree of differentiation of PNENs as high grade PNENS (G2-G3) usually show a marked restriction of DWI. Useful for the follow-up of small low-grade PNENs which cannot be resected. | HASTE T2 | CORONAL | -- | Anatomy and liquids analysis |
| GRE T1 FS | AXIAL | -- | pancreatic parenchima assessment | |
| DWI b 0–50–400–800 | AXIAL | -- | Restricted diffusion tipical of PNEN. Useful for multifocal PNENs | |
| GRE T1 3D DYNAMIC | AXIAL | Pre- 25″–70″–180″ | PNEN is most likely hypervascular | |
| MRCP 3D/2D | OBLIQUE CORONAL | Anatomy of wirsung duct | ||
| Cystic lesion of the pancreas (CPL) | HASTE T2 | AXIAL | -- | Anatomy and cysts morphology |
| Indications: MRI is the technique of choice in the diagnosis and management of CPL. T2, MRCP, DWI and contrast enhancement allow one to differentiate the different lesions and suggest an optimal management. As a rule of thumb, benign cystic lesions (serous cystosadenoma) do not require surgical resection or follow-up; border line or malignant lesions (mucinous cystoadenoma; main duct IPMN, BD-IPM with high-risk stigmata) require surgical resection if the patient is fit for surgery, while low-risk cystic lesions (BD-IPMN with no worrisome or high-risk stigmata) require follow-up (see below). | HASTE T2 | CORONAL | -- | Anatomy and cysts morphology |
| GRE T1 FS | AXIAL | -- | Pancreatic parenchima assessment | |
| DWI b 0–50–400–800 | AXIAL | -- | Restricted diffusion inside the CPL can be considered a worrisome feature and injection of contrast is indicated | |
| GRE T1 3D DYNAMIC | AXIAL | Pre- 25″–70″–180″ | Useful for the characterization of worrisome features (thick walls, septa, nodules, restricted diffusion) | |
| MRCP 3D/2D | OBLIQUE CORONAL | Relationship between the wirsung duct and the cystic lesion | ||
| Follow-up of IPMN | HASTE T2 | AXIAL | -- | Anatomy and cysts morphology |
| Indications: in case of BD-IPMN with no worrisome or high risk stigmata. | HASTE T2 | CORONAL | -- | Anatomy and cysts morphology |
| GRE T1 FS | AXIAL | -- | Pancreatic parenchima assessment | |
| DWI b 0–50–400–800 | AXIAL | -- | Restriction inside the IPMN can be considered a worrisome feature, and injection of contrast is indicated | |
| GRE T1 3D DYNAMIC | AXIAL | Pre- 25″–70″–180″ | In case of worrisome features (thick walls, septa, nodules, restricted diffusion inside the cyst), otherwise not necessary | |
| MRCP 3D/2D | OBLIQUE CORONAL | Comprehensive evaluation of the wirsung duct and cystic lesions | ||
Disclaimer/Publisher’s Note: The statements, opinions and data contained in all publications are solely those of the individual author(s) and contributor(s) and not of MDPI and/or the editor(s). MDPI and/or the editor(s) disclaim responsibility for any injury to people or property resulting from any ideas, methods, instructions or products referred to in the content. |
© 2024 by the authors. Licensee MDPI, Basel, Switzerland. This article is an open access article distributed under the terms and conditions of the Creative Commons Attribution (CC BY) license (https://creativecommons.org/licenses/by/4.0/).
Share and Cite
Morana, G.; Beleù, A.; Geraci, L.; Tomaiuolo, L.; Venturini, S. Imaging of the Liver and Pancreas: The Added Value of MRI. Diagnostics 2024, 14, 693. https://doi.org/10.3390/diagnostics14070693
Morana G, Beleù A, Geraci L, Tomaiuolo L, Venturini S. Imaging of the Liver and Pancreas: The Added Value of MRI. Diagnostics. 2024; 14(7):693. https://doi.org/10.3390/diagnostics14070693
Chicago/Turabian StyleMorana, Giovanni, Alessandro Beleù, Luca Geraci, Luisa Tomaiuolo, and Silvia Venturini. 2024. "Imaging of the Liver and Pancreas: The Added Value of MRI" Diagnostics 14, no. 7: 693. https://doi.org/10.3390/diagnostics14070693
APA StyleMorana, G., Beleù, A., Geraci, L., Tomaiuolo, L., & Venturini, S. (2024). Imaging of the Liver and Pancreas: The Added Value of MRI. Diagnostics, 14(7), 693. https://doi.org/10.3390/diagnostics14070693