
Cardiac Fibrosis Automated Diagnosis Based on FibrosisNet Network Using CMR Ischemic Cardiomyopathy

 ,
,  , ,
, , 
Abstract
1. Introduction
- The training process at FibrosisNet has been given sufficient time.
- Three convolutional layers with tiny kernels are utilized to reduce the training parameters.
- Several performance metrics are used to assess the proposed system. Additionally, we validated our proposed system by contrasting it with a few already-in-use solutions.
- Compared to transfer learning methods, FibrosisNet attained the highest level of accuracy.
2. Related Work
2.1. Machine Learning Techniques
2.2. Deep Learning Techniques
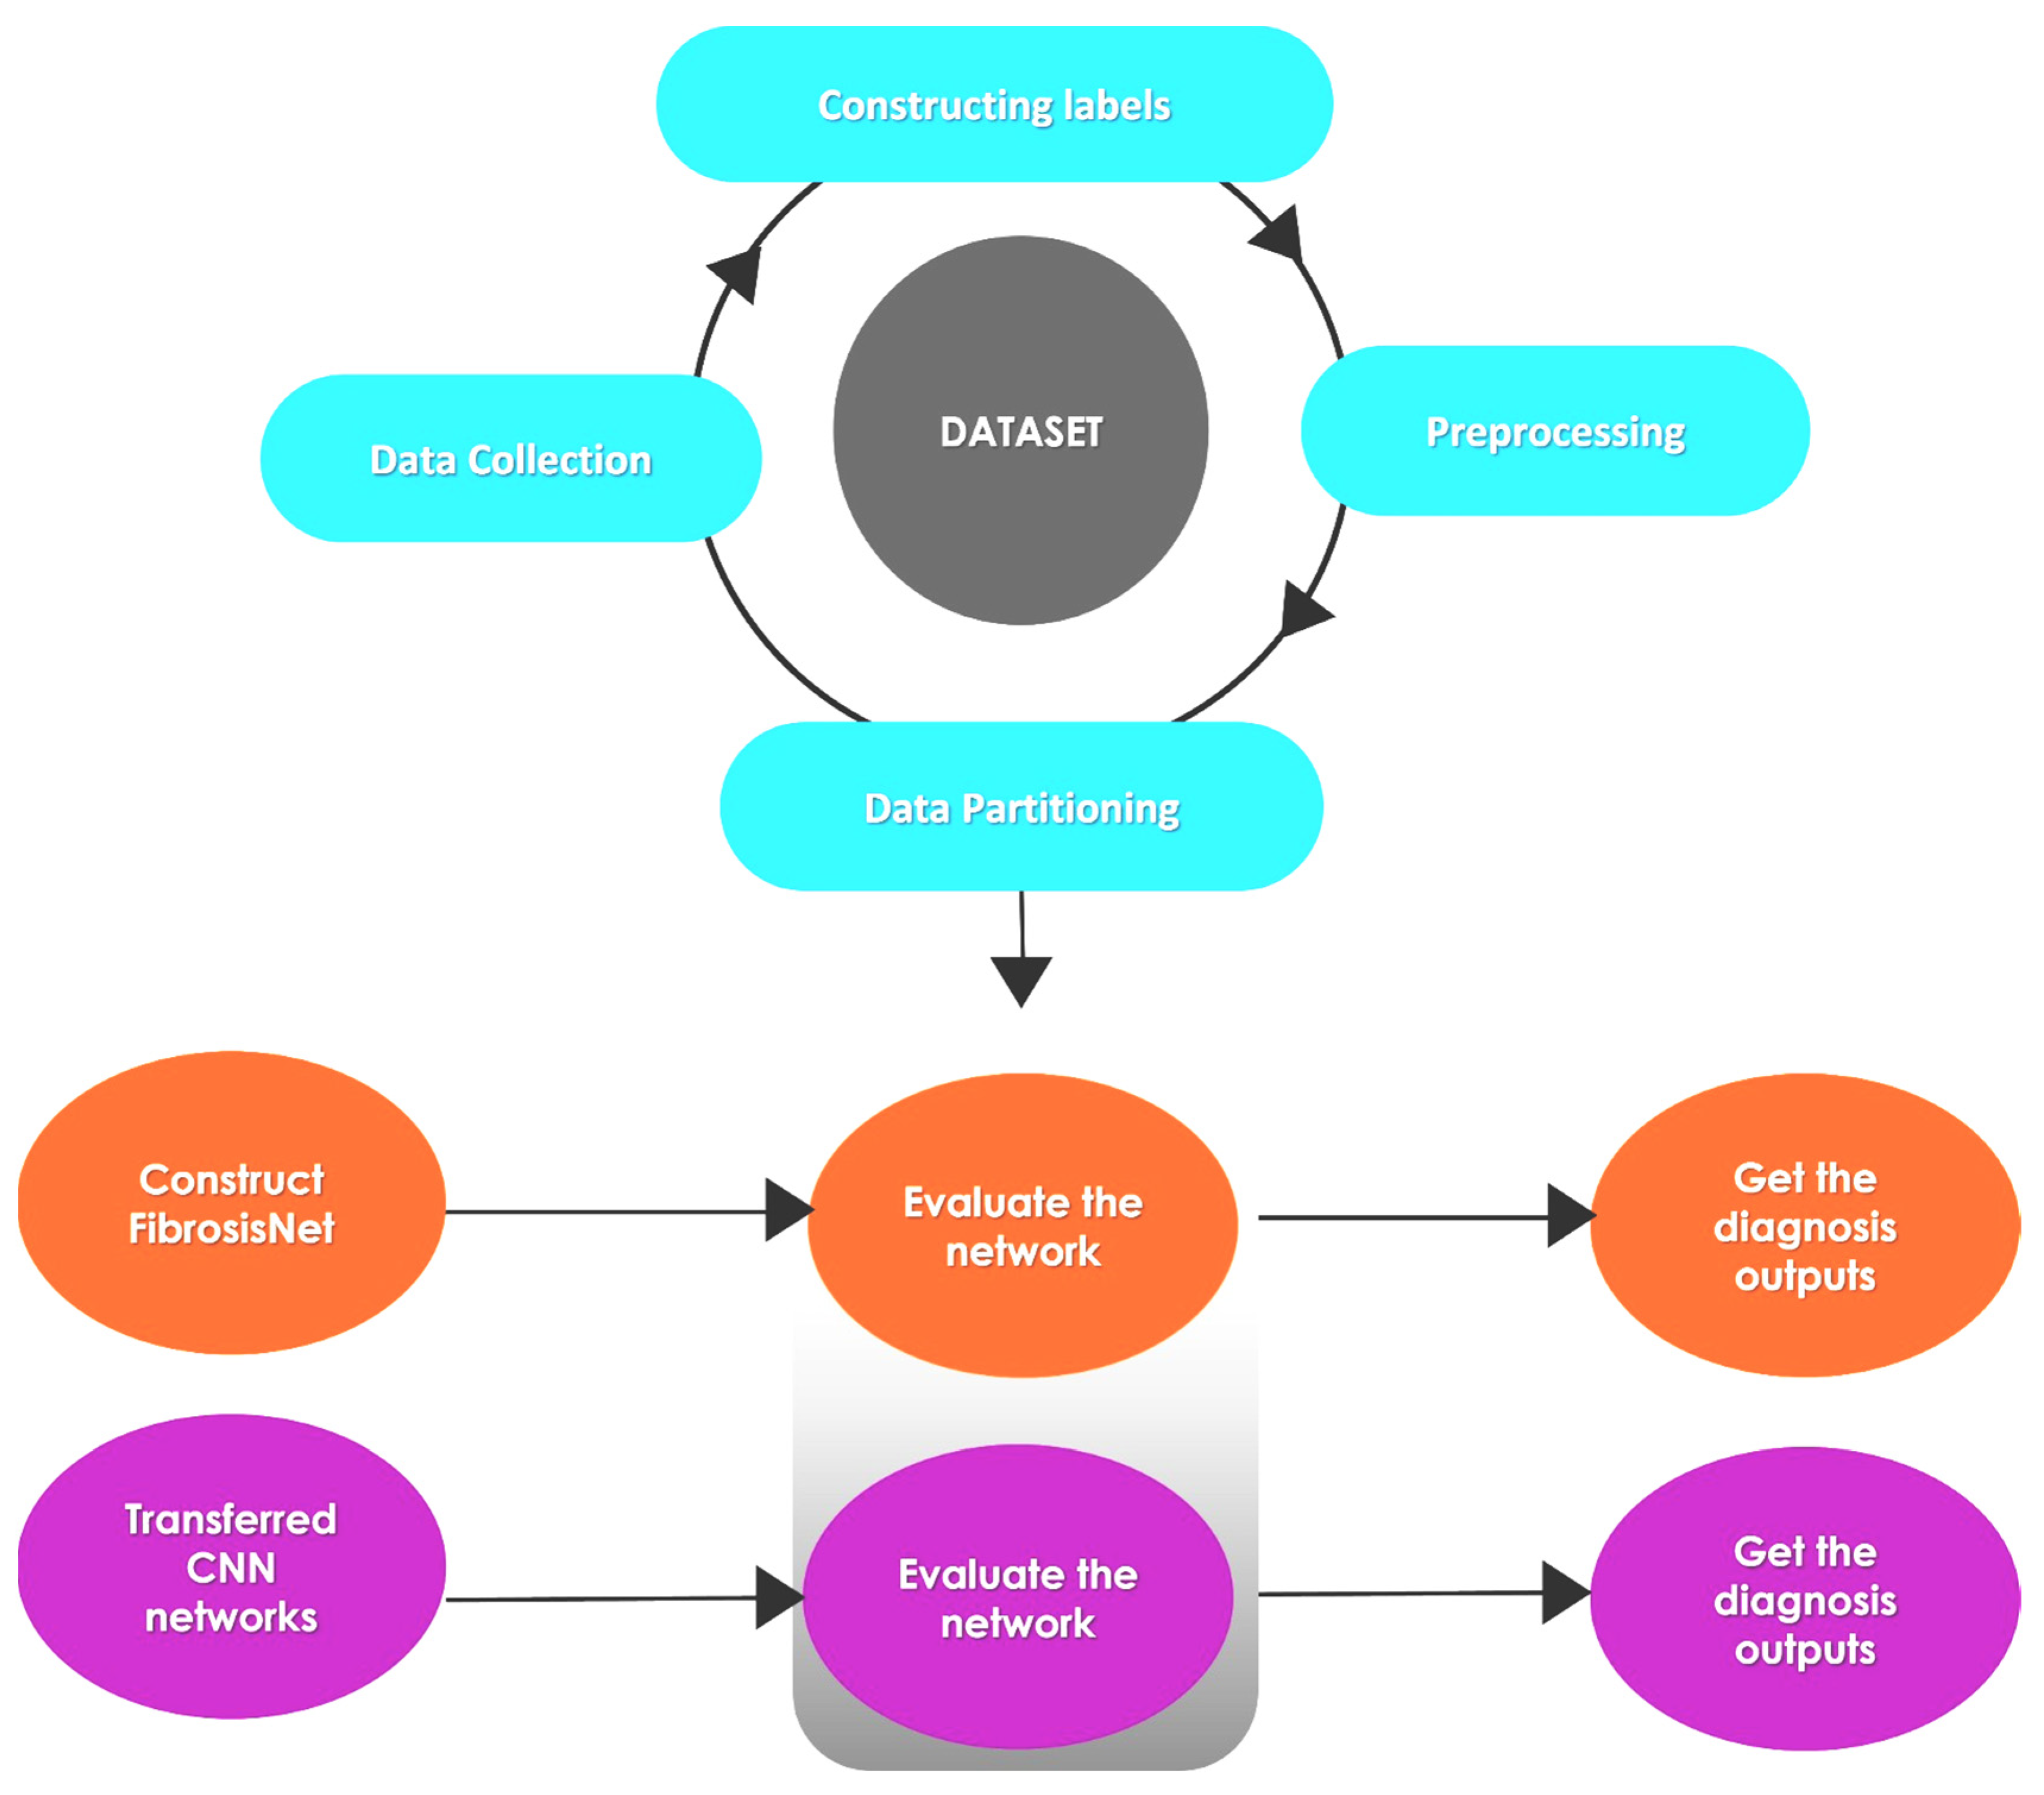
3. Methodology
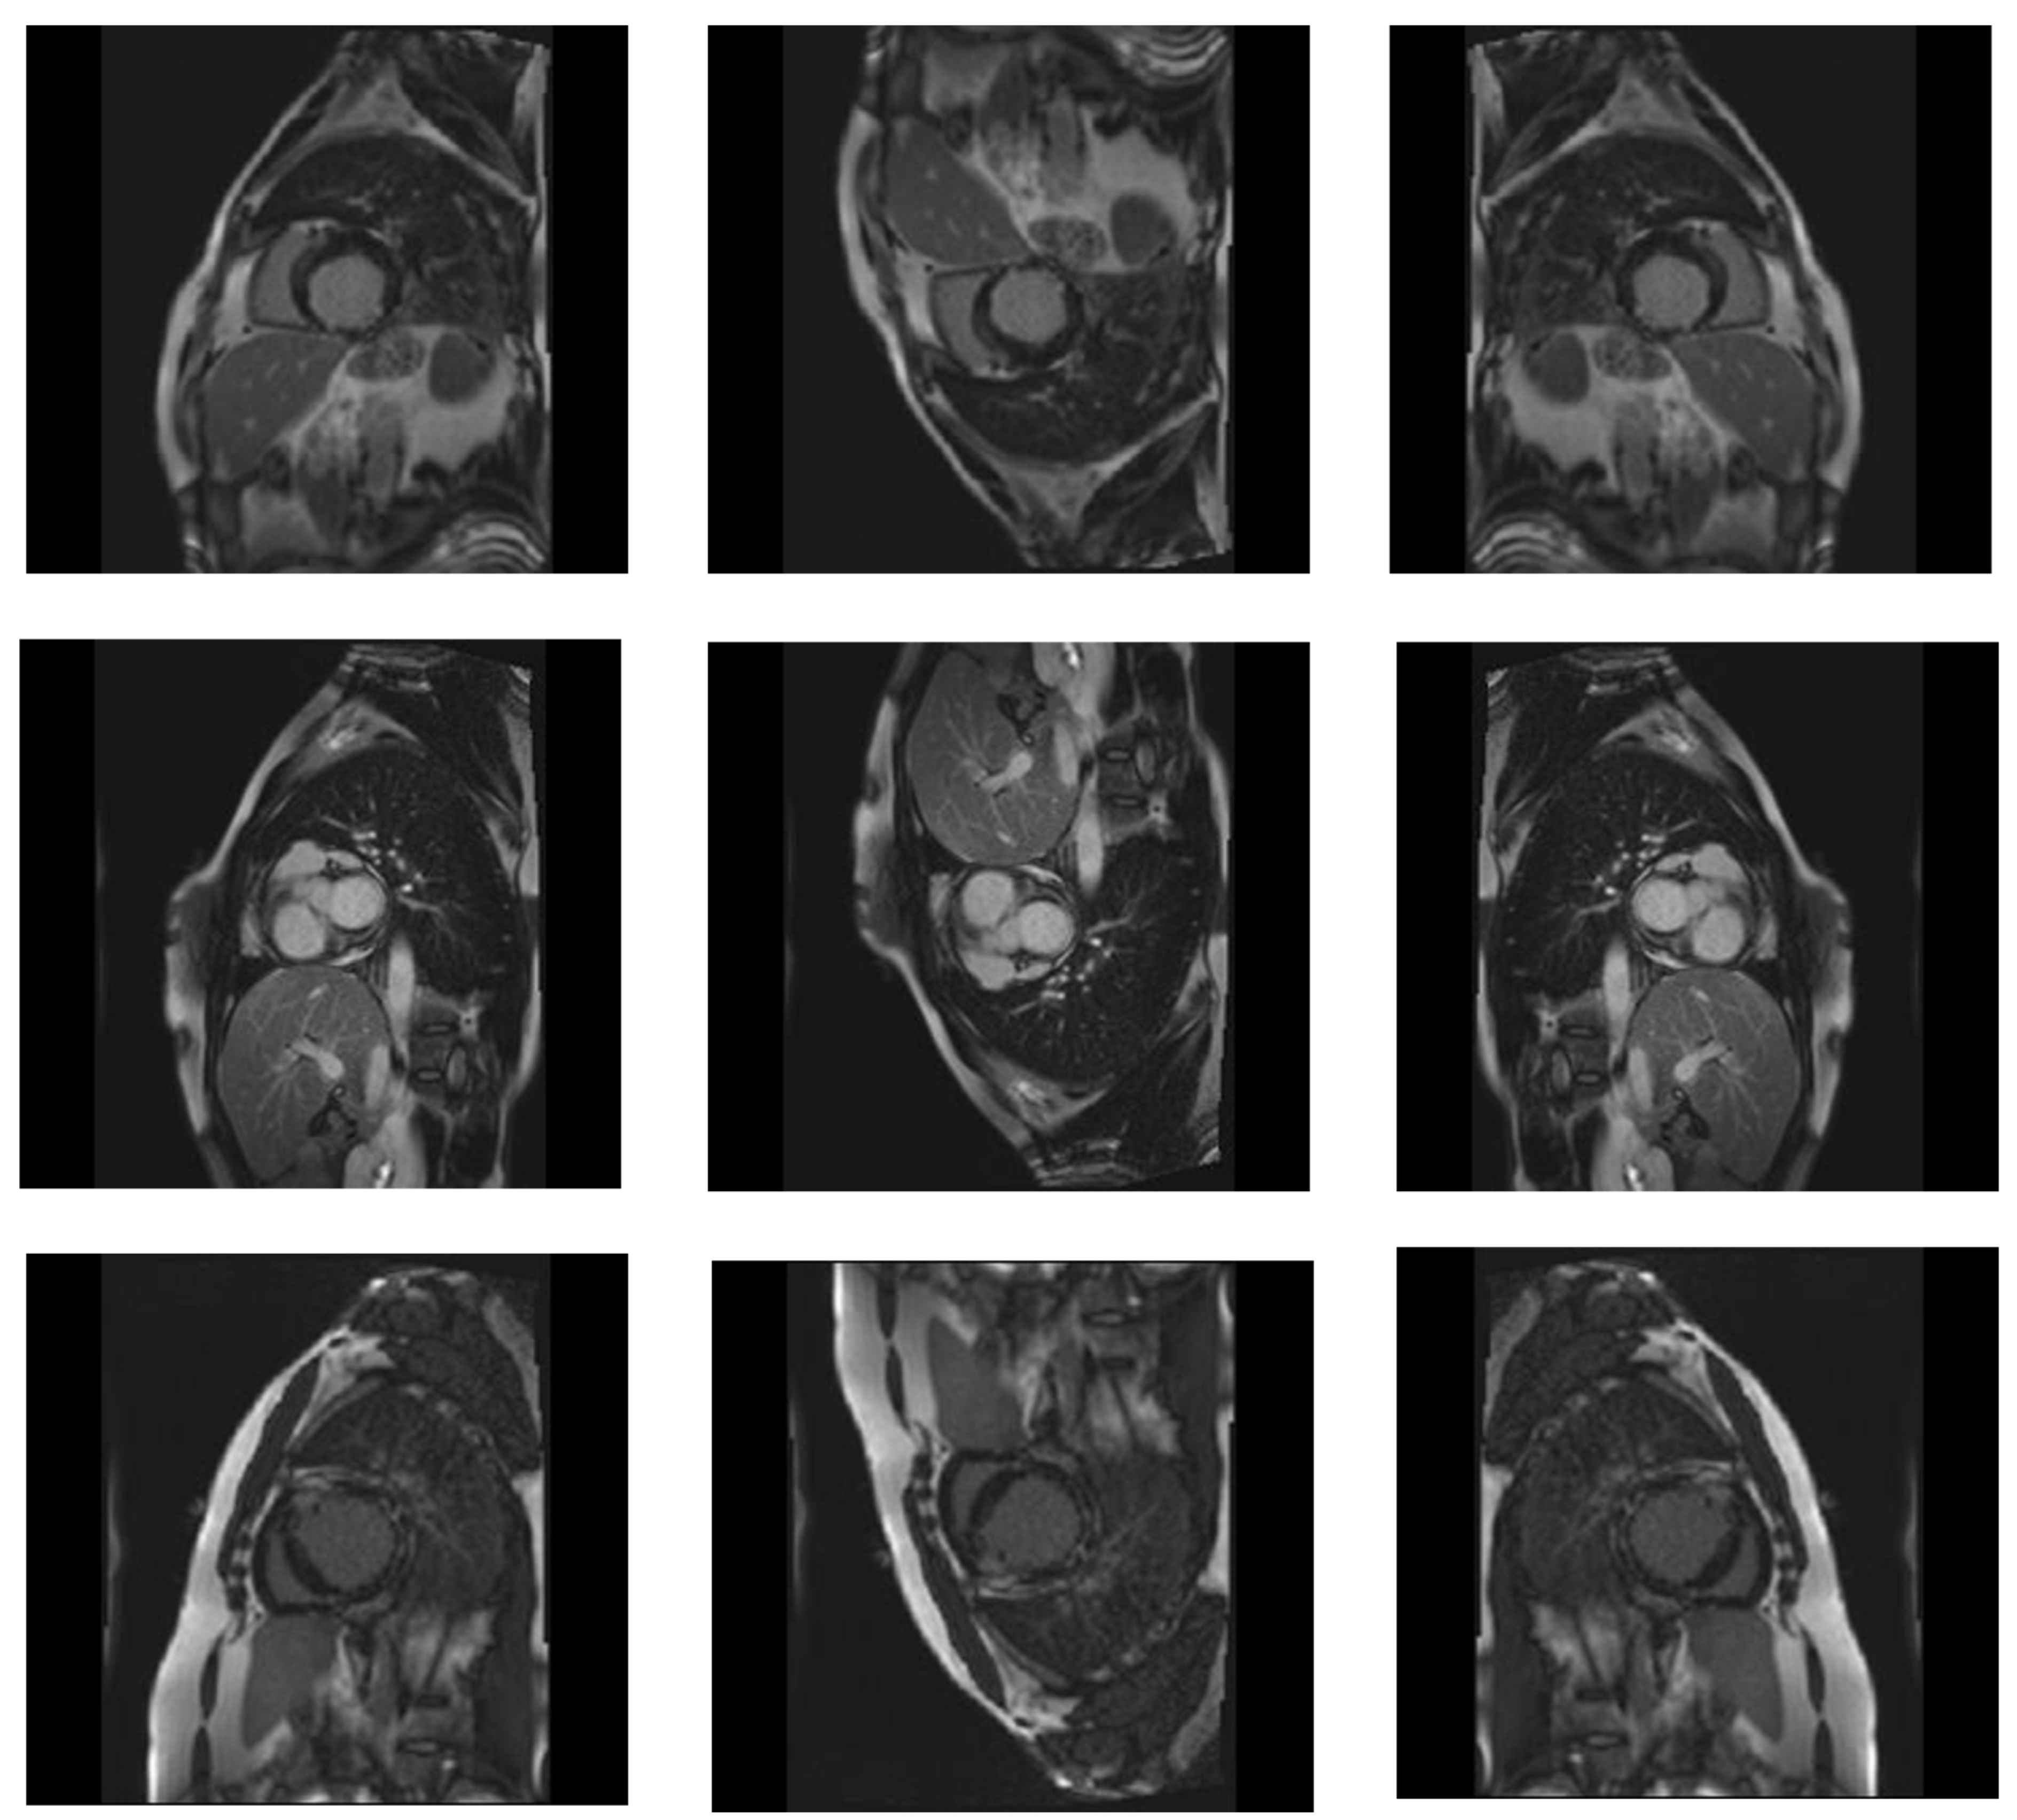
3.1. Dataset
3.2. Preprocessing
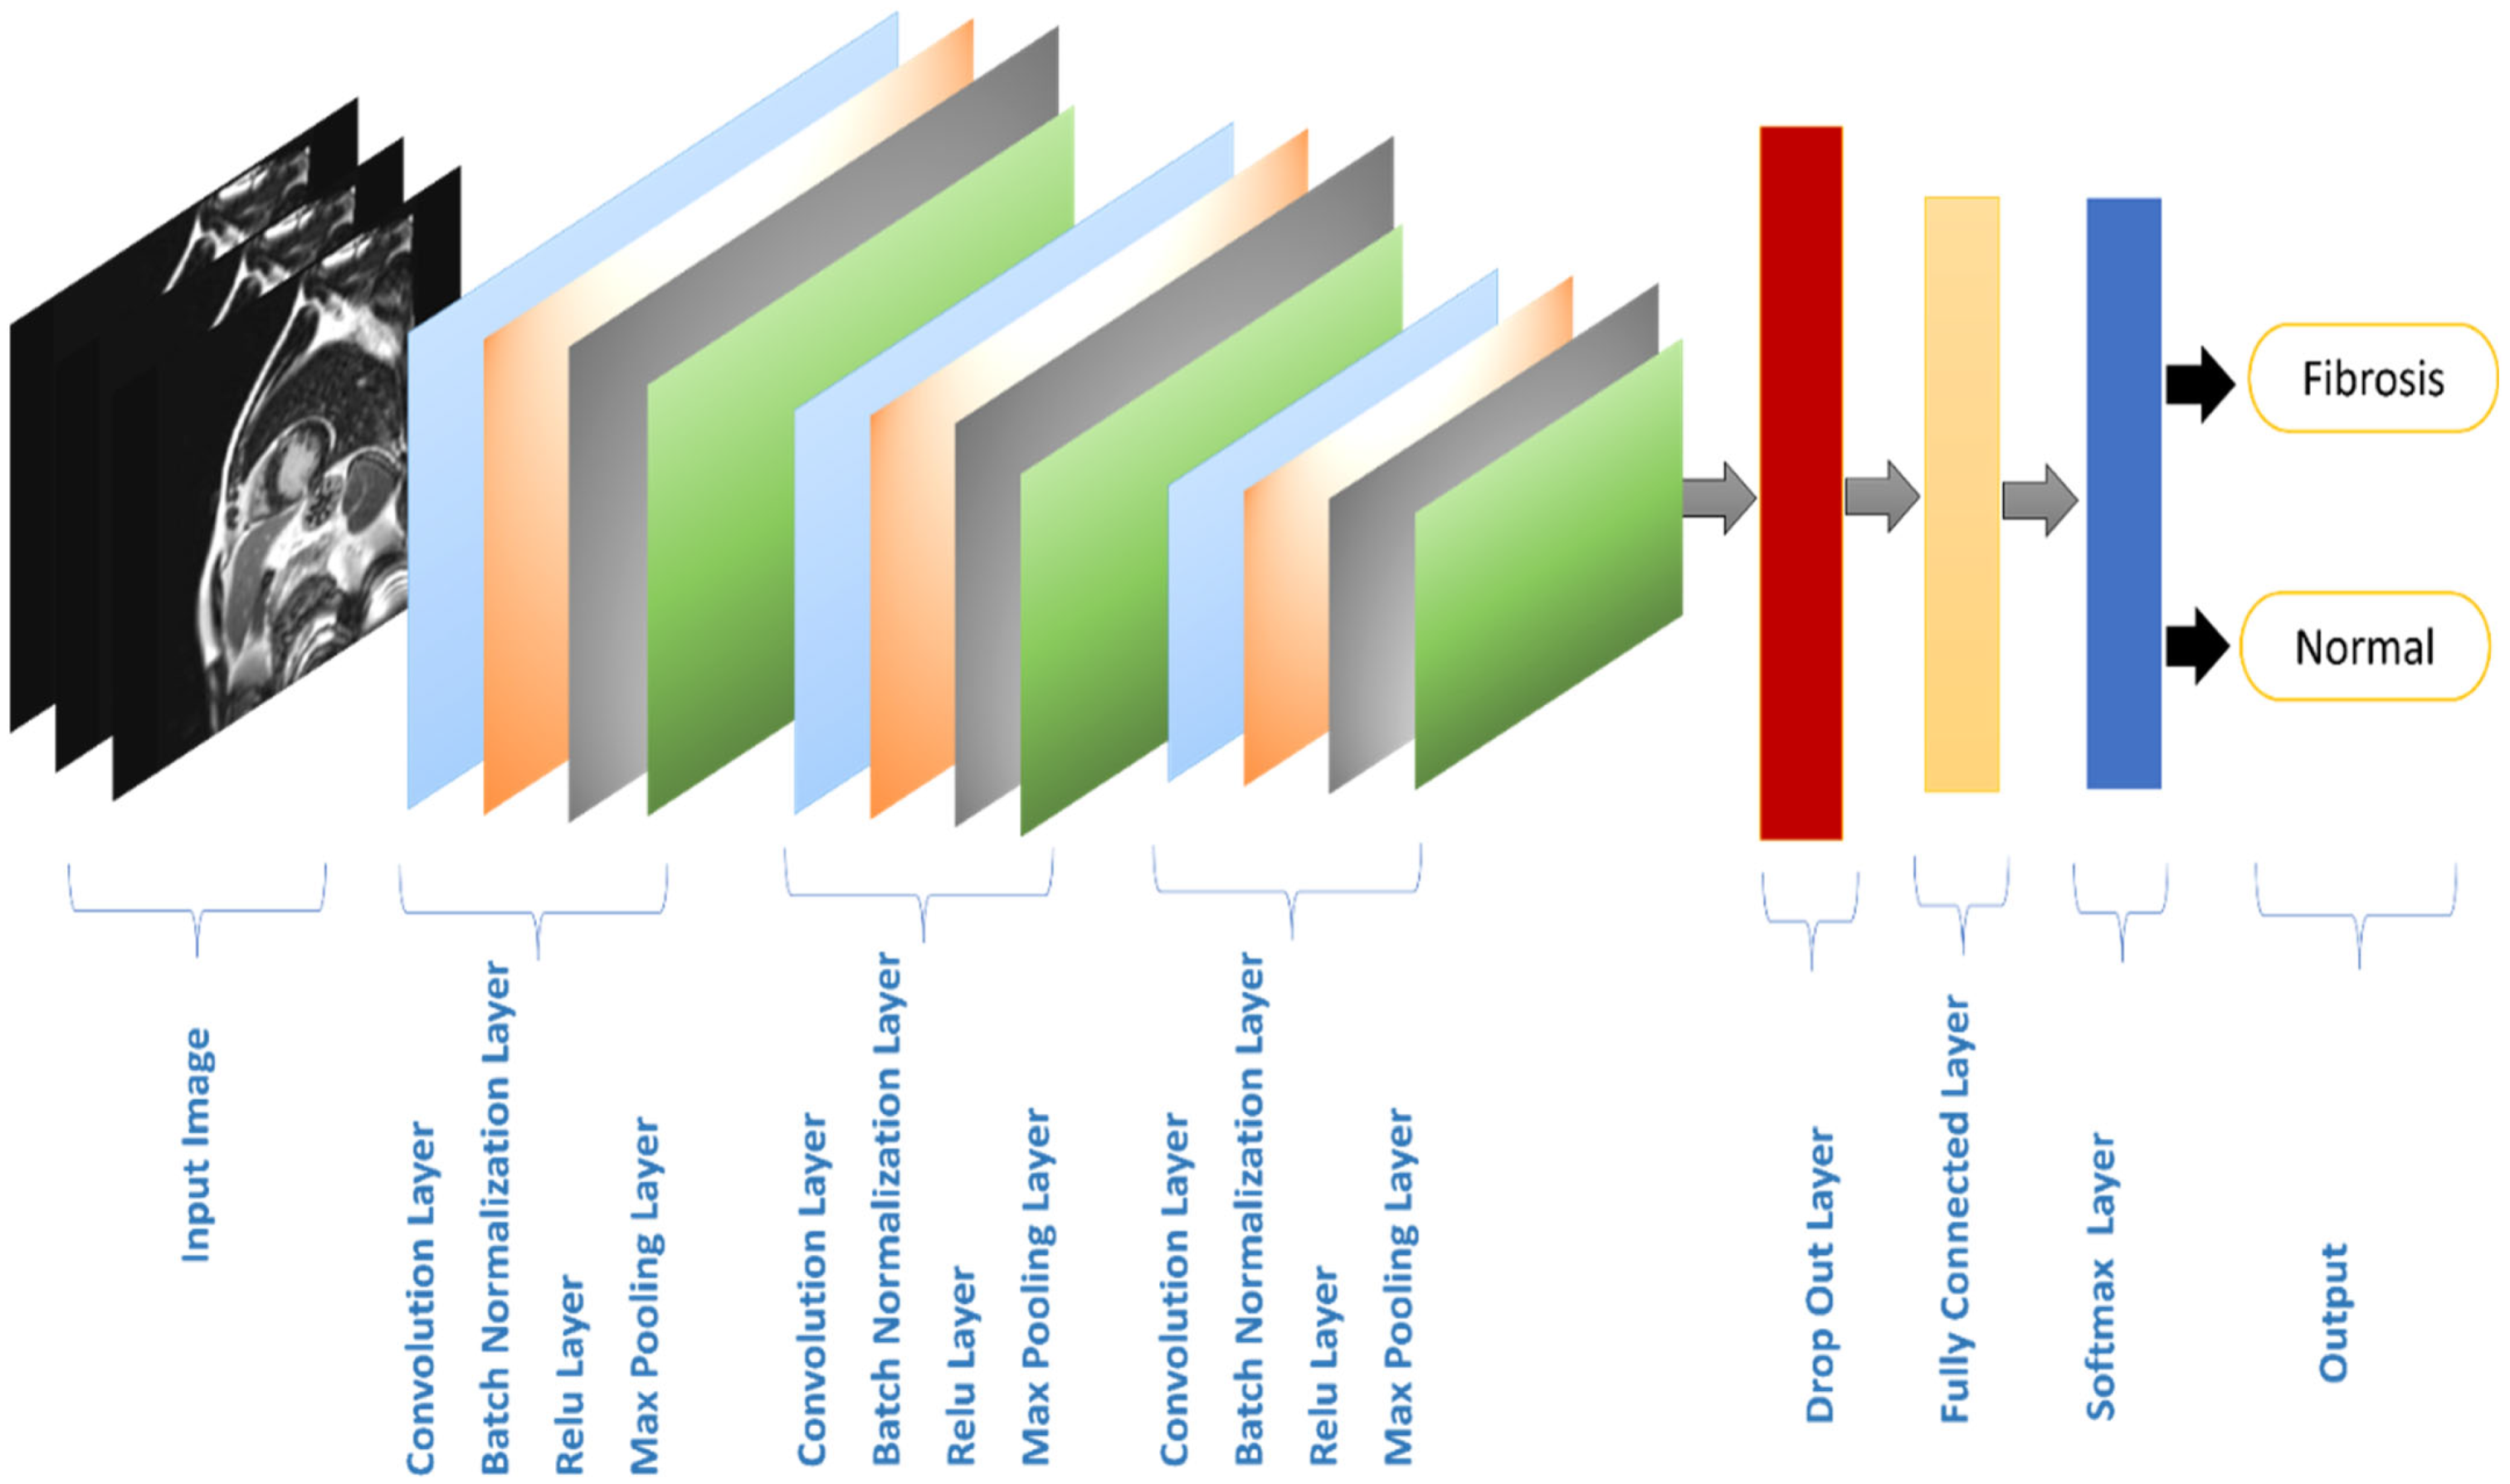
3.3. Processing
3.4. Transfer Learning CNN Architectures
3.4.1. MobileNet Model
3.4.2. GoogleNet Model
3.4.3. ResNet Model
4. Experimental Results
4.1. Software and Hardware Configuration
4.2. Evaluation Metrics
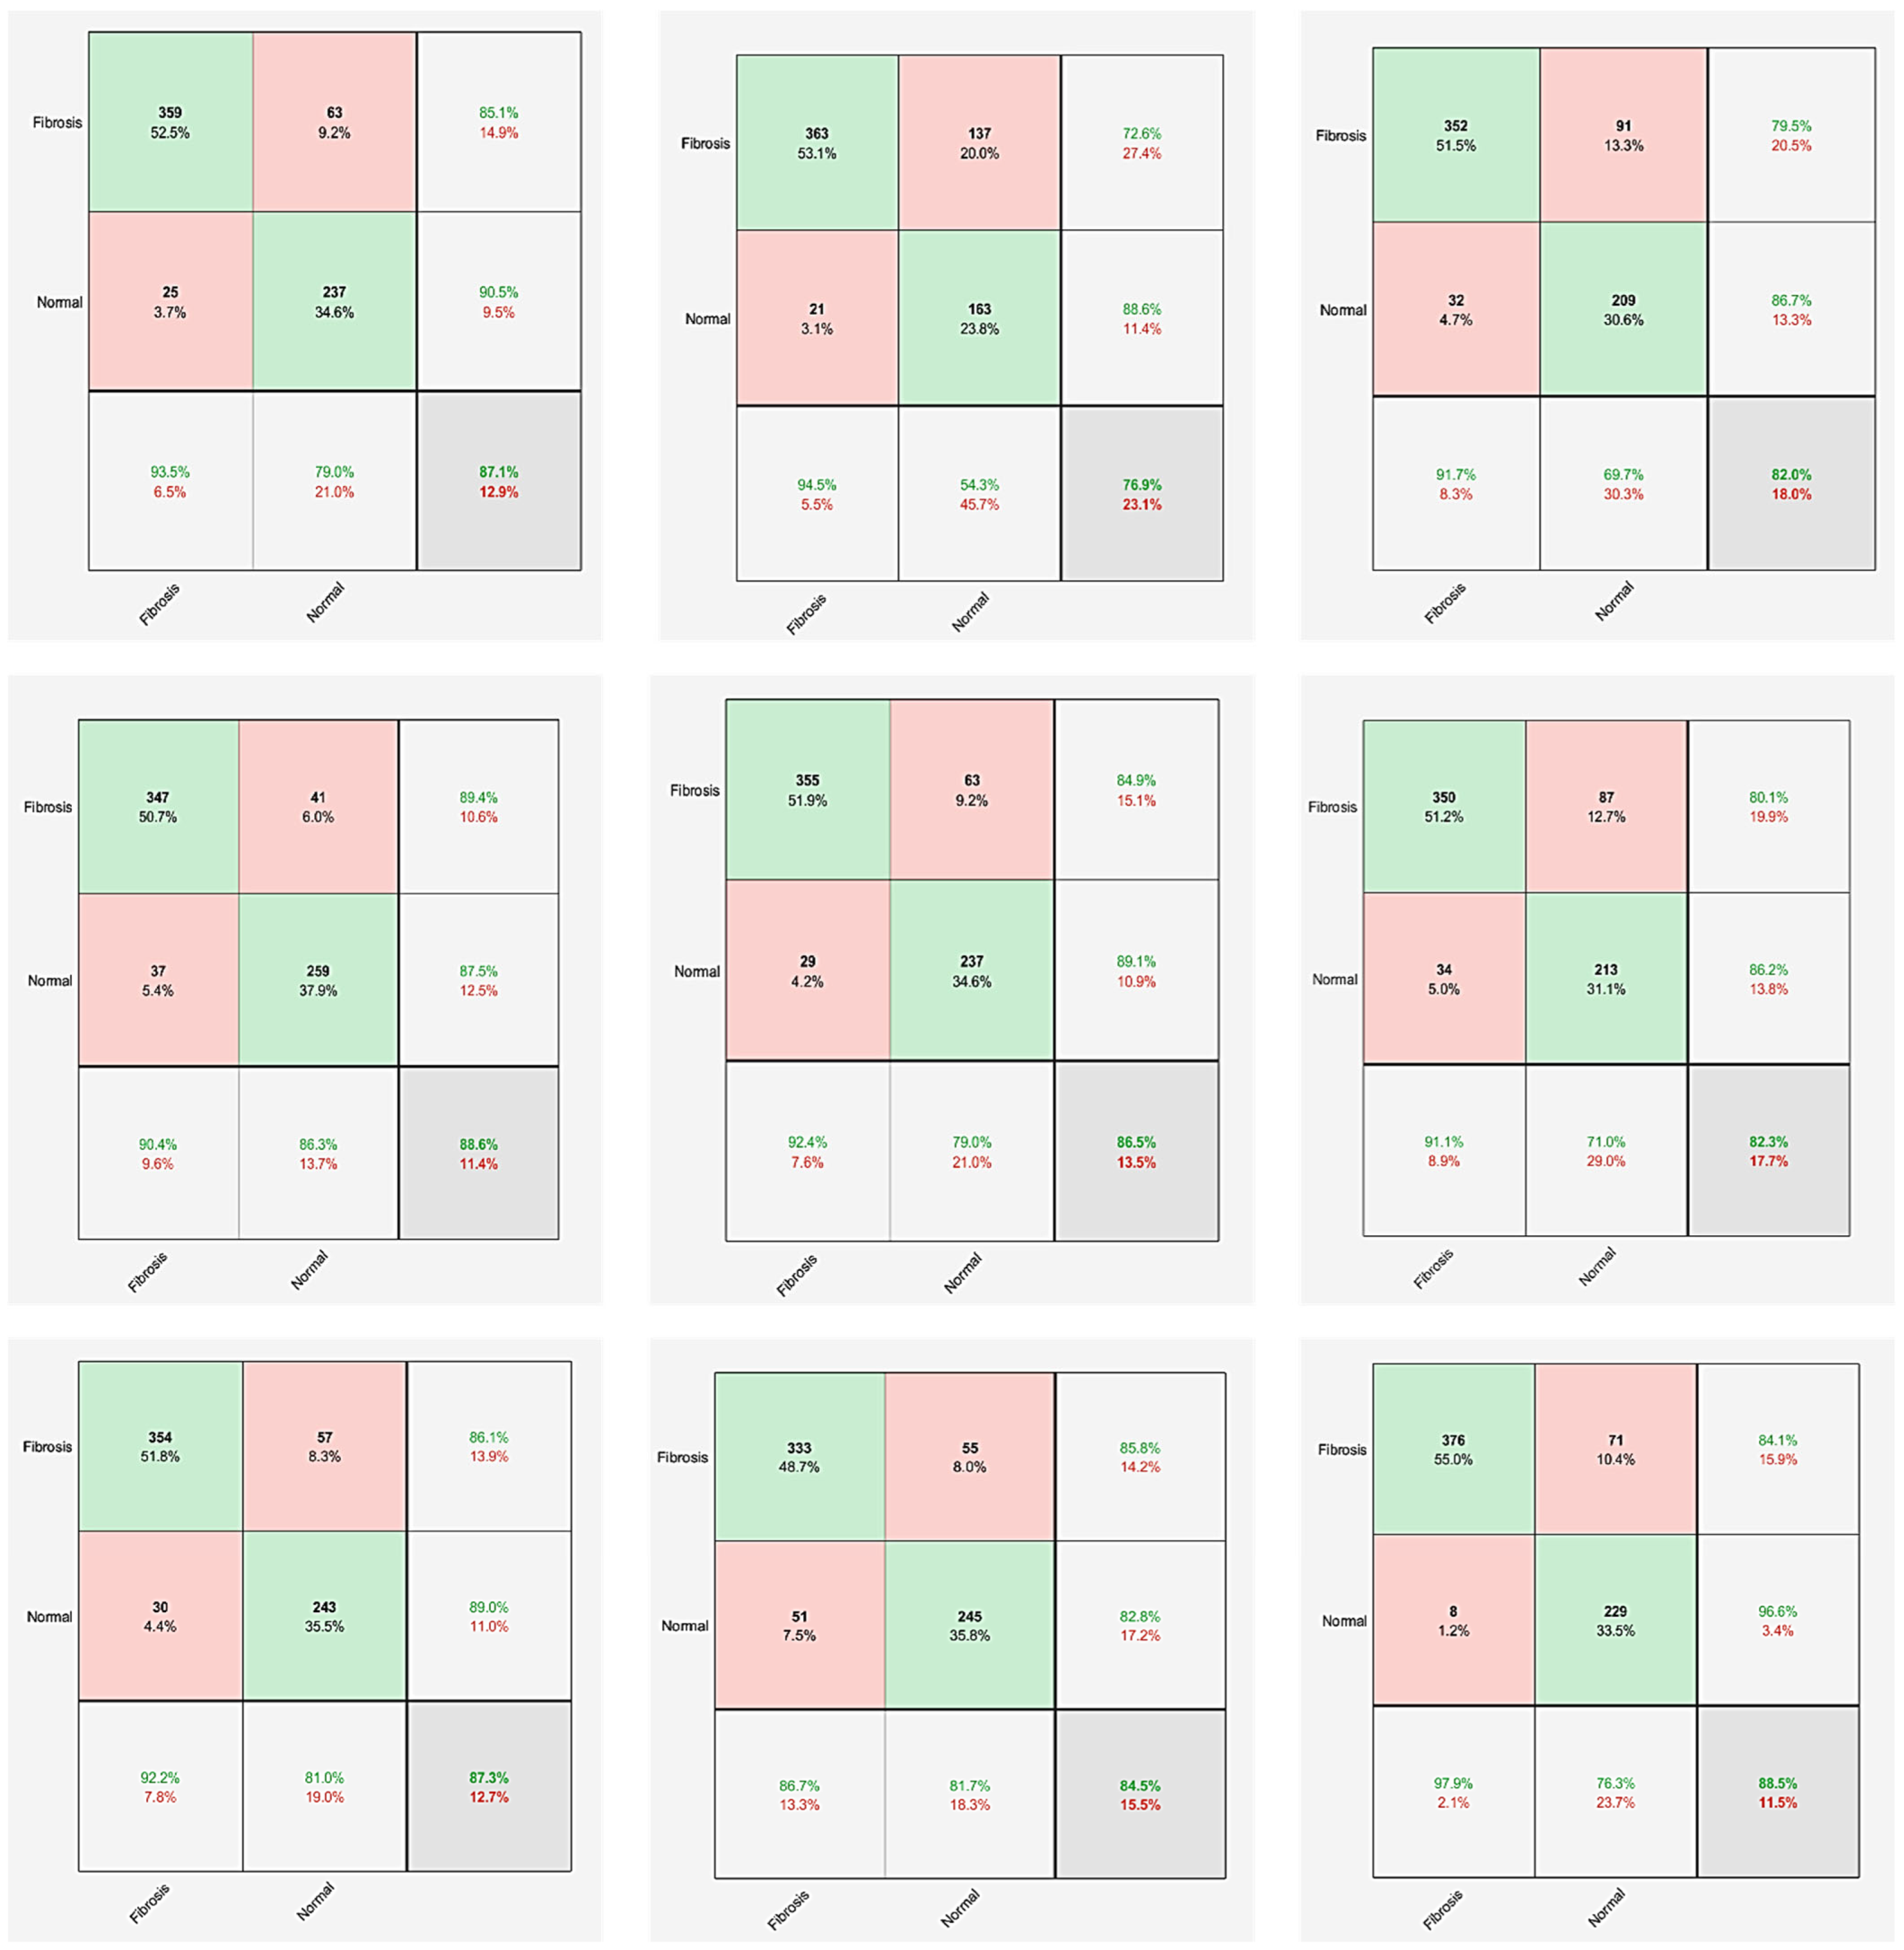
4.3. Results
4.4. Discussion
5. Conclusions
Author Contributions
Funding
Institutional Review Board Statement
Informed Consent Statement
Data Availability Statement
Acknowledgments
Conflicts of Interest
References
- Amegah, A.K. Tackling the growing burden of cardiovascular diseases in Sub-Saharan Africa. Circulation 2018, 138, 2449–2451. Available online: https://www.ahajournals.org/doi/full/10.1161/CIRCULATIONAHA.118.037367 (accessed on 17 September 2023). [CrossRef] [PubMed]
- Smith, S.C.; Collins, A.; Ferrari, R.; Holmes, D.R.; Logstrup, S.; McGhie, D.V.; Ralston, J.; Sacco, R.L.; Stam, H.; Taubert, K.; et al. Our Time: A call to save preventable death from cardiovascular disease (heart disease and stroke). Circulation 2012, 126, 2769–2775. Available online: https://www.ahajournals.org/doi/full/10.1161/CIR.0b013e318267e99f (accessed on 11 October 2023). [CrossRef] [PubMed]
- Chen, S.W.; Wang, S.L.; Qi, X.Z.; Samuri, S.M.; Yang, C. Review of ECG detection and classification based on deep learning: Coherent taxonomy, motivation, open challenges and recommendations. Biomed. Signal Process. Control 2022, 74, 103493. [Google Scholar] [CrossRef]
- Alsharqi, M.; Woodward, W.J.; Mumith, J.A.; Markham, D.C.; Upton, R.; Leeson, P. Artificial intelligence and echocardiography. Echo Res. Pract. 2018, 5, R115–R125. [Google Scholar] [CrossRef] [PubMed]
- Cassar, A.; Holmes, D.R.; Rihal, C.S.; Gersh, B.J. Chronic coronary artery disease: Diagnosis and management. Mayo Clin. Proc. 2009, 84, 1130–1146. [Google Scholar] [CrossRef] [PubMed]
- Houssein, E.H.; Hassaballah, M.; Ibrahim, I.E.; AbdElminaam, D.S.; Wazery, Y.M. An automatic arrhythmia classification model based on improved Marine Predators Algorithm and Convolutions Neural Networks. Expert Syst. Appl. 2022, 187, 115936. [Google Scholar] [CrossRef]
- Narula, S.; Shameer, K.; Omar, A.M.S.; Dudley, J.T.; Sengupta, P.P. Machine-Learning algorithms to automate morphological and functional assessments in 2D echocardiography. J. Am. Coll. Cardiol. 2016, 68, 2287–2295. [Google Scholar] [CrossRef]
- Kirişli, H.; Schaap, M.; Metz, C.; Dharampal, A.; Meijboom, W.; Papadopoulou, S.; Dedic, A.; Nieman, K.; de Graaf, M.; Meijs, M.; et al. Standardized evaluation framework for evaluating coronary artery stenosis detection, stenosis quantification and lumen segmentation algorithms in computed tomography angiography. Med. Image Anal. 2013, 17, 859–876. [Google Scholar] [CrossRef]
- Cau, R.; Solinas, C.; De Silva, P.; Lambertini, M.; Agostinetto, E.; Scartozzi, M.; Montisci, R.; Pontone, G.; Porcu, M.; Saba, L. Role of cardiac MRI in the diagnosis of immune checkpoint inhibitor-associated myocarditis. Int. J. Cancer 2022, 151, 1860–1873. [Google Scholar] [CrossRef]
- Rahman, H.; Scannell, C.M.; Demir, O.M.; Ryan, M.; McConkey, H.; Ellis, H.; Masci, P.G.; Perera, D.; Chiribiri, A. High-Resolution cardiac magnetic resonance imaging techniques for the identification of coronary microvascular dysfunction. JACC Cardiovasc. Imaging 2021, 14, 978–986. [Google Scholar] [CrossRef]
- Murtha, L.A.; Schuliga, M.J.; Mabotuwana, N.S.; Hardy, S.A.; Waters, D.W.; Burgess, J.K.; Knight, D.A.; Boyle, A.J. The processes and mechanisms of cardiac and pulmonary fibrosis. Front. Physiol. 2017, 8, 777. [Google Scholar] [CrossRef] [PubMed]
- Weber, K.T.; Sun, Y.; Bhattacharya, S.K.; Ahokas, R.A.; Gerling, I.C. Myofibroblast-mediated mechanisms of pathological remodelling of the heart. Nat. Rev. Cardiol. 2012, 10, 15–26. [Google Scholar] [CrossRef] [PubMed]
- Mozaffarian, D. Global scourge of cardiovascular disease. J. Am. Coll. Cardiol. 2017, 70, 26–28. [Google Scholar] [CrossRef] [PubMed]
- Moran, A.E.; Roth, G.A.; Narula, J.; Mensah, G.A. 1990–2010 Global Cardiovascular Disease Atlas. Glob. Heart 2014, 9, 3–16. [Google Scholar] [CrossRef] [PubMed]
- St John Sutton, M.G.; Sharpe, N. Left ventricular remodeling after myocardial infarction. Circulation 2000, 101, 2981–2988. [Google Scholar] [CrossRef] [PubMed]
- Kim, R.J.; Fieno, D.S.; Parrish, T.B.; Harris, K.; Chen, E.-L.; Simonetti, O.; Bundy, J.; Finn, J.P.; Klocke, F.J.; Judd, R.M. Relationship of MRI delayed contrast enhancement to irreversible injury, infarct age, and contractile function. Circulation 1999, 100, 1992–2002. [Google Scholar] [CrossRef] [PubMed]
- Ukwatta, E.; Arevalo, H.; Rajchl, M.; White, J.; Pashakhanloo, F.; Prakosa, A.; Herzka, D.A.; McVeigh, E.; Lardo, A.C.; Trayanova, N.A.; et al. Image-based reconstruction of three-dimensional myocardial infarct geometry for patient-specific modeling of cardiac electrophysiology. Med. Phys. 2015, 42, 4579–4590. [Google Scholar] [CrossRef]
- Marsan, N.A.; Bax, J.J. Myocardial fibrosis assessed by CMR to predict events in HCM. Nat. Rev. Cardiol. 2010, 7, 604–606. [Google Scholar] [CrossRef]
- Treibel, T.A.; Fontana, M.; Steeden, J.A.; Nasis, A.; Yeung, J.; White, S.K.; Sivarajan, S.; Punwani, S.; Pugliese, F.; Taylor, S.A.; et al. Automatic quantification of the myocardial extracellular volume by cardiac computed tomography: Synthetic ECV by CCT. J. Cardiovasc. Comput. Tomogr. 2017, 11, 221–226. [Google Scholar] [CrossRef]
- Barragán-Montero, A.; Javaid, U.; Valdés, G.; Nguyen, D.; Desbordes, P.; Macq, B.; Willems, S.; Vandewinckele, L.; Holmström, M.; Löfman, F.; et al. Artificial intelligence and machine learning for medical imaging: A technology review. Phys. Medica 2021, 83, 242–256. [Google Scholar] [CrossRef]
- Letourneau-Guillon, L.; Camirand, D.; Guilbert, F.; Forghani, R. Artificial intelligence applications for workflow, process optimization and predictive analytics. Neuroimaging Clin. N. Am. 2020, 30, e1–e15. [Google Scholar] [CrossRef] [PubMed]
- Avanzo, M.; Porzio, M.; Lorenzon, L.; Milan, L.; Sghedoni, R.; Russo, G.; Massafra, R.; Fanizzi, A.; Barucci, A.; Ardu, V.; et al. Artificial intelligence applications in medical imaging: A review of the medical physics research in Italy. Phys. Medica 2021, 83, 221–241. [Google Scholar] [CrossRef] [PubMed]
- Ali, M.; Ali, R. Multi-Input Dual-Stream Capsule Network for Improved Lung and Colon Cancer Classification. Diagnostics 2021, 11, 1485. [Google Scholar] [CrossRef] [PubMed]
- Shen, D.; Wu, G.; Suk, H.-I. Deep learning in medical image analysis. Annu. Rev. Biomed. Eng. 2017, 19, 221–248. [Google Scholar] [CrossRef] [PubMed]
- Haskins, G.; Kruger, U.; Yan, P. Deep learning in medical image registration: A survey. Mach. Vis. Appl. 2020, 31, 8. [Google Scholar] [CrossRef]
- Campese, S.; Agostini, F.; Sciarretta, T.; Pizzi, M.; Cipriani, A.; Zanetti, M. Myocardial fibrosis detection using kernel methods: Preliminary results from a cardiac magnetic resonance study. Eur. J. Echocardiogr. 2022, 23 (Suppl. 2), jeac141.005. [Google Scholar] [CrossRef]
- Dima, S.-M.; Panagiotou, C.; Mazomenos, E.B.; Rosengarten, J.A.; Maharatna, K.; Gialelis, J.V.; Curzen, N.; Morgan, J. On the Detection of Myocardial Scar Based on ECG/VCG Analysis. IEEE Trans. Biomed. Eng. 2013, 60, 3399–3409. [Google Scholar] [CrossRef] [PubMed]
- Zabihollahy, F.; Rajan, S.; Ukwatta, E. Machine Learning-Based Segmentation of Left Ventricular Myocardial Fibrosis from Magnetic Resonance Imaging. Curr. Cardiol. Rep. 2020, 22, 65. [Google Scholar] [CrossRef]
- Asif, A.; Charters, P.F.P.; Thompson, C.A.S.; Komber, H.M.E.I.; Hudson, B.J.; Rodrigues, J.C.L. Artificial intelligence can detect left ventricular dilatation on contrast-enhanced thoracic computer tomography relative to cardiac magnetic resonance imaging. Br. J. Radiol. 2022, 95, 20210852. [Google Scholar] [CrossRef]
- Sharkey, M.J.; Taylor, J.C.; Alabed, S.; Dwivedi, K.; Karunasaagarar, K.; Johns, C.S.; Rajaram, S.; Garg, P.; Alkhanfar, D.; Metherall, P.; et al. Fully automatic cardiac four-chamber and great vessel segmentation on CT pulmonary angiography using deep learning. Front. Cardiovasc. Med. 2022, 9, 983859. [Google Scholar] [CrossRef]
- Penso, M.; Babbaro, M.; Moccia, S.; Baggiano, A.; Carerj, M.L.; Guglielmo, M.; Fusini, L.; Mushtaq, S.; Andreini, D.; Pepi, M.; et al. A deep-learning approach for myocardial fibrosis detection in early contrast-enhanced cardiac CT images. Front. Cardiovasc. Med. 2023, 10, 1151705. [Google Scholar] [CrossRef] [PubMed]
- Shi, K.; Li, Y.; Zhang, T.J.; Li, Z.L.; Li, H.X.; Peng, W.L.; Xia, C.C. Early Assessment of Myocardial Fibrosis of Hypertrophic Cardiomyopathy with Native-T1-Mapping-Based Deep Learning: A Preliminary Study. J. Sichuan Univ. Med. Sci. Ed. 2021, 52, 819–824. [Google Scholar]
- Jafari, M.; Shoeibi, A.; Khodatars, M.; Ghassemi, N.; Moridian, P.; Alizadehsani, R.; Khosravi, A.; Ling, S.H.; Delfan, N.; Zhang, Y.-D.; et al. Automated diagnosis of cardiovascular diseases from cardiac magnetic resonance imaging using deep learning models: A review. Comput. Biol. Med. 2023, 160, 106998. [Google Scholar] [CrossRef] [PubMed]
- Popescu, D.M.; Abramson, H.G.; Yu, R.; Lai, C.; Shade, J.K.; Wu, K.C.; Maggioni, M.; Trayanova, N.A. Anatomically informed deep learning on contrast-enhanced cardiac magnetic resonance imaging for scar segmentation and clinical feature extraction. Cardiovasc. Digit. Health J. 2022, 3, 2–13. [Google Scholar] [CrossRef] [PubMed]
- Moccia, S.; Banali, R.; Martini, C.; Muscogiuri, G.; Pontone, G.; Pepi, M.; Caiani, E.G. Development and testing of a deep learning-based strategy for scar segmentation on CMR-LGE images. Magn. Reson. Mater. Phys. Biol. Med. 2018, 32, 187–195. [Google Scholar] [CrossRef] [PubMed]
- Gumpfer, N.; Grün, D.; Hannig, J.; Keller, T.; Guckert, M. Detecting myocardial scar using electrocardiogram data and deep neural networks. Biol. Chem. 2020, 402, 911–923. [Google Scholar] [CrossRef]
- Muthulakshmi, M.; Kavitha, G. Deep CNN with LM learning based myocardial ischemia detection in cardiac magnetic resonance images. In Proceedings of the 2019 41st Annual International Conference of the IEEE Engineering in Medicine and Biology Society (EMBC), Berlin, Germany, 23–27 July 2019. [Google Scholar] [CrossRef]
- Fahmy, A.S.; Rausch, J.; Neisius, U.; Chan, R.H.; Maron, M.S.; Appelbaum, E.; Menze, B.; Nezafat, R. Automated Cardiac MR Scar Quantification in Hypertrophic Cardiomyopathy Using Deep Convolutional Neural Networks. JACC Cardiovasc. Imaging 2018, 11, 1917–1918. [Google Scholar] [CrossRef]
- Sandler, M.; Howard, A.; Zhu, M.; Zhmoginov, A.; Chen, L. MobileNetV2: Inverted Residuals and Linear Bottlenecks. In Proceedings of the 2018 IEEE Conference on Computer Vision and Pattern Recognition (CVPR), Salt Lake City, UT, USA, 18–23 June 2018. [Google Scholar] [CrossRef]
- Yilmaz, E.; Trocan, M. A modified version of GoogleNet for melanoma diagnosis. J. Inf. Telecommun. 2021, 5, 395–405. [Google Scholar] [CrossRef]
- Sabour, S.; Frosst, N.; Hinton, G.E. Dynamic routing between capsules. arXiv 2017, arXiv:1710.09829v2. Available online: https://arxiv.org/pdf/1710.09829 (accessed on 11 October 2023).
- He, K.; Zhang, X.; Ren, S.; Sun, J. Deep Residual Learning for Image Recognition. In Proceedings of the 2016 IEEE Conference on Computer Vision and Pattern Recognition (CVPR), Las Vegas, NV, USA, 27–30 June 2016. [Google Scholar] [CrossRef]


| Reference | DL/ML | Dataset (Patient/ Images) | Target | Algorithm | Performance (%) | Limitations |
|---|---|---|---|---|---|---|
| Campese [26] | ML | 642 images | MF detection | CNN Kernel SVM | ACC = 71% SEN = 72% | Lack of accuracy and sensitivity |
| Dima et al. [27] | ML | Clinical | Detecting myocardial scar | CNN SVM | ACC = 89.22% SEN = 76% SPEC = 87.5% | Unsuitable performance metrics |
| Zabihollahy and Ukwatta [28] | ML + DL | 30 patients | Identification of MF | CNN Cascaded multi-planar U-Net | DSC = 88.61% | Not enough training data |
| Asif et al. [29] | DL | 77 patients | Automated diameter analysis | - | ACC = 71.9% | Less accuracy |
| Sharkey et al. [30] | DL | 1553 patients | Fully automated segmentation | CNN-UNet | ACC = 93% | Lack of training data |
| Penso et al. [31] | DL | 50 patients | Identification of myocardial fibrosis | CNN Tensorflow-Keras | ACC = 71% SEN = 73% | Insufficient sensitivity |
| Shi et al. [32] | DL | 60 patients | Detection ML | ResNext-50 | SPEC = 87% SEN = 79% AUC = 83% | Inadequate sensitivity |
| Jafari et al. [33] | DL | Clinical | LV scar | CTAEM-Net | ACC = 90.18% | Low accuracy |
| Popescu et al. [34] | DL | 2484 images | Scar segmentation | U-Net Res U-Net | ACC 1 = 96% ACC 2 = 75% | Not enough training data |
| Moccia et al. [35] | DL | 250 images | Scar segmentation | FCNNs | SEN = 88.07% | Less Sensitivity |
| Gumpfer et al. [36] | DL | 114 patients | Detecting myocardial scar | CNN + FNN | SPEC = 84.3% ACC = 78.0% SEN = 70.0% | Inappropriate performance metrics |
| Muthulakshmi and Kavitha [37] | DL | - | Estimate left ventricular volume | CNN + LM | ACC = 86.39%, SEN = 90% | Low accuracy |
| Ahmed et al. [38] | DL | 1041 patients | Automated scar quantification | DCN U-Net | ACC = 82% | lack of testing Low accuracy |
| Training Data | Testing Data | Total Dataset | ||
| Fibrosis | Normal | Fibrosis | Normal | |
| 1536 | 1200 | 384 | 300 | 3420 |
| Layer Order | Layer Name | Output Shape | Learnable Parameters |
|---|---|---|---|
| 1 | Image Input | [224, 224, 3] | 0 |
| 2 | 2D convolution | [222, 222, 10] | 760 |
| 3 | Batch Normalization | [222, 222, 10] | 20 |
| 4 | ReLU | [222, 222, 10] | 0 |
| 5 | 2D Max Pooling | [221, 221, 10] | 0 |
| 6 | 2D convolution | [219, 219, 10] | 2510 |
| 7 | Batch Normalization | [219, 219, 10] | 20 |
| 8 | ReLU | [219, 219, 10] | 0 |
| 9 | 2D Max Pooling | [218, 218, 10] | 0 |
| 10 | 2D convolution | [218, 218, 10] | 910 |
| 11 | Batch Normalization | [218, 218, 10] | 20 |
| 12 | ReLU | [218, 218, 10] | 0 |
| 13 | 2D Max Pooling | [218, 218, 10] | 0 |
| 14 | Dropout | [218, 218, 10] | 0 |
| 15 | Fully Connected | [1, 1, 2] | 950,482 |
| 16 | SoftMax | [1, 1, 2] | 0 |
| 17 | Classification output | [1, 1, 2] | 0 |
| Total Learnable parameters | 954,700 | ||
| Model | Layer Order | Old Layer | New Layer | Old Shape | New Shape |
|---|---|---|---|---|---|
| Model 1 | 152 | FC (1000 outputs) | FC (2 outputs) | [1, 1, 1000] | [1, 1, 2] |
| Model 2 | 151 | Average Pooling | ReLU | [1, 1, 1280] | [7, 7, 1280] |
| 152 | FC (1000 outputs) | FC (2 outputs) | [1, 1, 1000] | [1, 1, 2] | |
| Model 3 | 150 | ReLU | FC (20 outputs) | [7, 7, 1280] | [1, 1, 20] |
| 151 | Average Pooling | ReLU | [1, 1, 1280] | [7, 7, 1280] | |
| 152 | FC (1000 outputs) | FC (2 outputs) | [1, 1, 1000] | [1, 1, 2] |
| Model | Layer Order | Old Layer | New Layer | Old Shape | New Shape |
|---|---|---|---|---|---|
| Model 1 | 142 | FC (1000 outputs) | FC (2 outputs) | [1, 1, 1000] | [1, 1, 2] |
| Model 2 | 141 | Dropout | ReLU | [1, 1, 1024] | [1, 1, 1024] |
| 142 | FC (1000 outputs) | FC (2 outputs) | [1, 1, 1000] | [1, 1, 2] | |
| Model 3 | 140 | Average Pooling | FC (35 outputs) | [1, 1, 1024] | [1, 1, 35] |
| 141 | Dropout | ReLU | [1, 1, 1024] | [1, 1, 1024] | |
| 142 | FC (1000 outputs) | FC (2 outputs) | [1, 1, 1000] | [1, 1, 2] |
| Model | Layer Order | Old Layer | New Layer | Old Shape | New Shape |
|---|---|---|---|---|---|
| Model 1 | 175 | FC (1000 outputs) | FC (2 outputs) | [1, 1, 1000] | [1, 1, 2] |
| Model 2 | 174 | Average Pooling | ReLU | [1, 1, 2048] | [7, 7, 2048] |
| 175 | FC (1000 outputs) | FC (2 outputs) | [1, 1, 1000] | [1, 1, 2] | |
| Model 3 | 173 | ReLU | FC (20 outputs) | [7, 7, 2048] | [1, 1, 20] |
| 174 | Average Pooling | ReLU | [1, 1, 2048] | [7, 7, 2048] | |
| 175 | FC (1000 outputs) | FC (2 outputs) | [1, 1, 1000] | [1, 1, 2] |
| Network | Modified Model | TP | TN | FP | FN | ACC | SEN (Recall) | SPC | PPV (Precision) | NPV | F1-Score | MCC |
|---|---|---|---|---|---|---|---|---|---|---|---|---|
| MobileNetV2 | Model 1 | 359 | 237 | 25 | 63 | 87.13% | 85.07% | 90.46% | 93.49% | 79.00% | 89.08% | 73.99% |
| Model 2 | 363 | 163 | 21 | 137 | 76.90% | 72.60% | 88.59% | 94.53% | 54.33% | 82.13% | 54.68% | |
| Model 3 | 352 | 209 | 32 | 91 | 82.02% | 79.46% | 86.72% | 91.67% | 69.67% | 85.13% | 63.71% | |
| GoogleNet | Model 1 | 347 | 259 | 37 | 41 | 88.60% | 89.43% | 87.50% | 90.36% | 86.33% | 89.90% | 76.82% |
| Model 2 | 355 | 237 | 29 | 63 | 86.55% | 84.93% | 89.10% | 92.45% | 79.00% | 88.53% | 72.73% | |
| Model 3 | 350 | 213 | 34 | 87 | 82.31% | 80.09% | 86.23% | 91.15% | 71.00% | 85.26% | 64.20% | |
| ResNet50 | Model 1 | 354 | 243 | 30 | 57 | 87.28% | 86.13% | 89.01% | 92.19% | 81.00% | 89.06% | 74.16% |
| Model 2 | 333 | 245 | 51 | 55 | 84.50% | 85.82% | 82.77% | 86.72% | 81.67% | 86.27% | 68.49% | |
| Model 3 | 376 | 229 | 8 | 71 | 88.45% | 84.12% | 96.62% | 97.92% | 76.33% | 90.49% | 77.43% | |
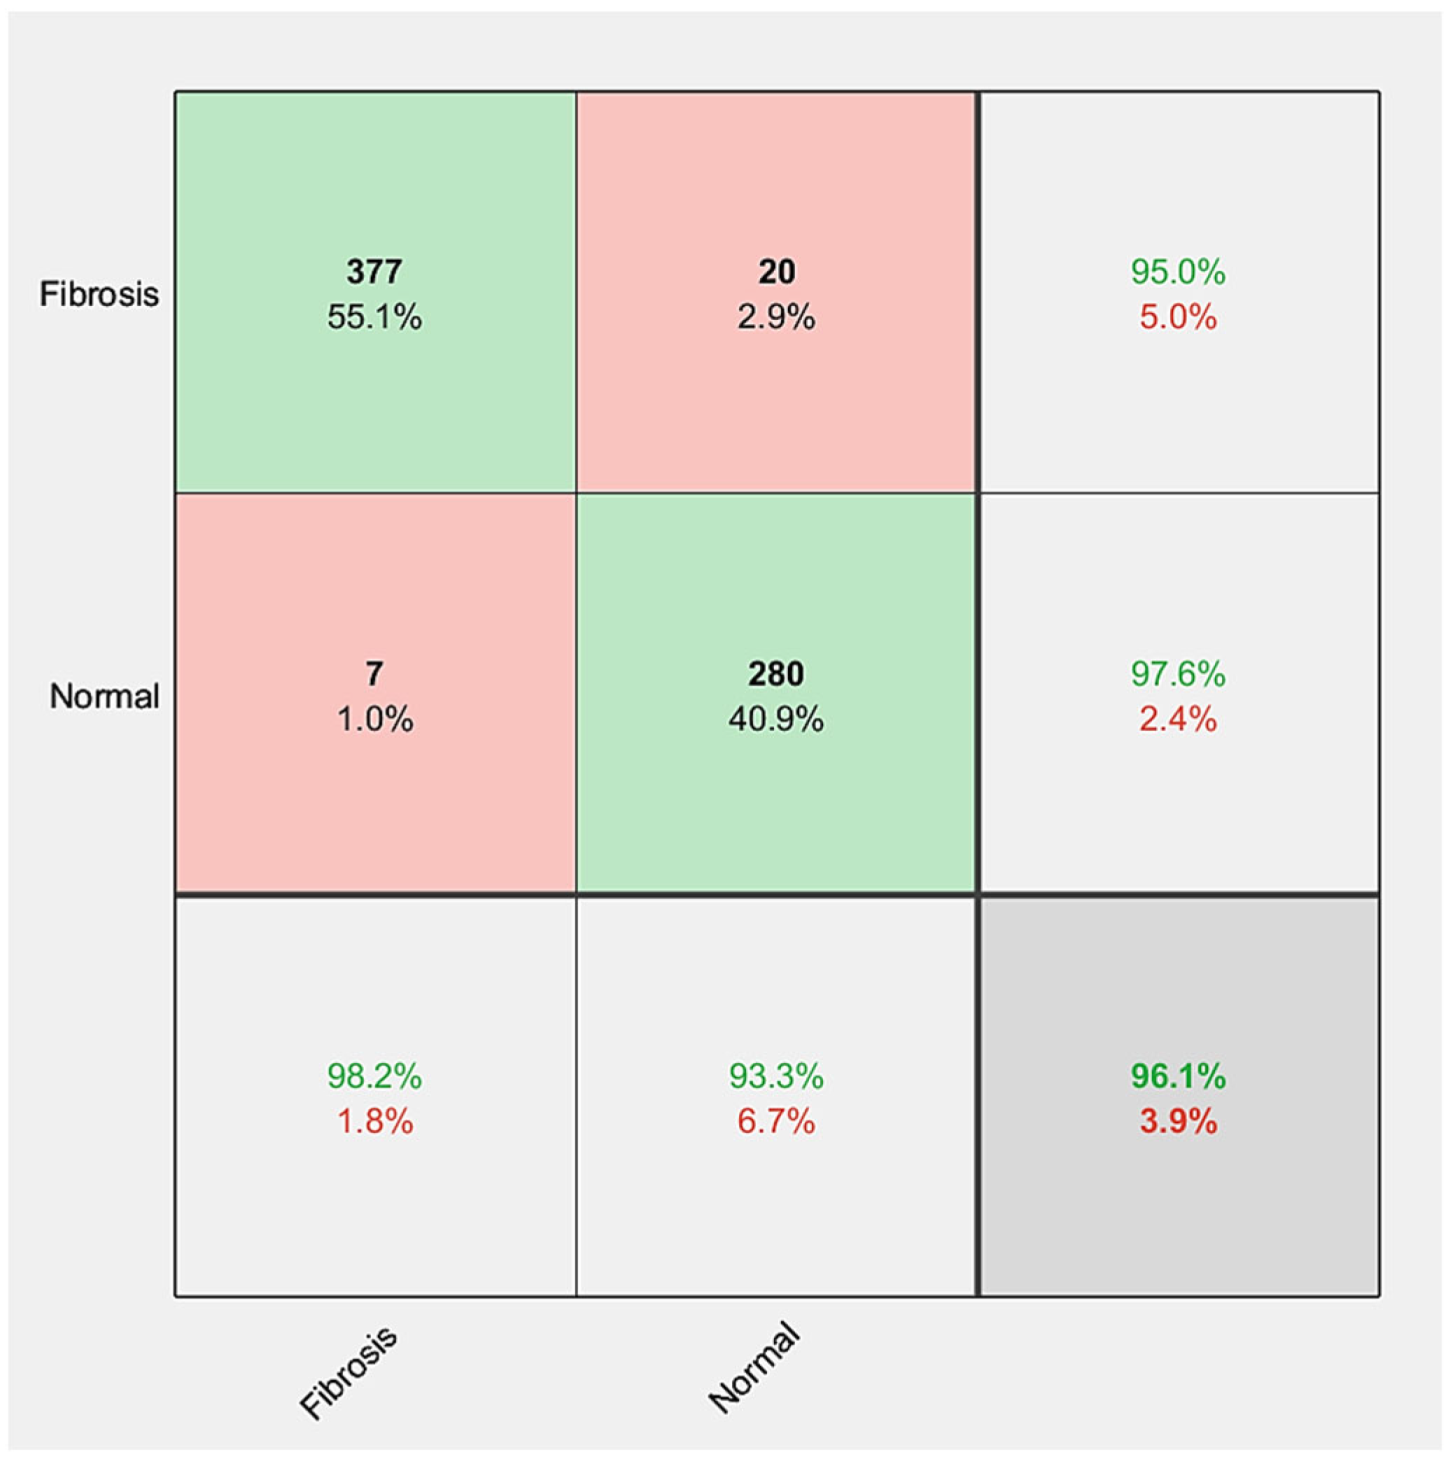
| FibrosisNet | 377 | 280 | 7 | 20 | 96.05% | 94.96% | 97.56% | 98.18% | 93.33% | 96.54% | 92.02% | |
| Reference | Images | Performance% | Detection Method |
|---|---|---|---|
| Campese [26] | 642 images | ACC = 71% SEN = 72% | ML CNN |
| Dima et al. [27] | – | ACC = 89.22% SEN = 76% SPEC = 87.5% | ML CNN |
| Popescu et al. [34] | 2484 images | ACC 1 = 96% ACC 2 = 75% | U-Net Res U-Net |
| Moccia et al. [35] | 250 images | SEN = 88.07% | FCNNs |
| Gumpfer et al. [36] | 114 patients | 84.3% | DL CNN + FNN |
| Proposed method (FibrosisNet) | 1140 patients 3420 images | ACC = 96.05% PPV = 98.18% | DL CNN |
Disclaimer/Publisher’s Note: The statements, opinions and data contained in all publications are solely those of the individual author(s) and contributor(s) and not of MDPI and/or the editor(s). MDPI and/or the editor(s) disclaim responsibility for any injury to people or property resulting from any ideas, methods, instructions or products referred to in the content. |
© 2024 by the authors. Licensee MDPI, Basel, Switzerland. This article is an open access article distributed under the terms and conditions of the Creative Commons Attribution (CC BY) license (https://creativecommons.org/licenses/by/4.0/).
Share and Cite
Bekheet, M.; Sallah, M.; Alghamdi, N.S.; Rusu-Both, R.; Elgarayhi, A.; Elmogy, M. Cardiac Fibrosis Automated Diagnosis Based on FibrosisNet Network Using CMR Ischemic Cardiomyopathy. Diagnostics 2024, 14, 255. https://doi.org/10.3390/diagnostics14030255
Bekheet M, Sallah M, Alghamdi NS, Rusu-Both R, Elgarayhi A, Elmogy M. Cardiac Fibrosis Automated Diagnosis Based on FibrosisNet Network Using CMR Ischemic Cardiomyopathy. Diagnostics. 2024; 14(3):255. https://doi.org/10.3390/diagnostics14030255
Chicago/Turabian StyleBekheet, Mohamed, Mohammed Sallah, Norah S. Alghamdi, Roxana Rusu-Both, Ahmed Elgarayhi, and Mohammed Elmogy. 2024. "Cardiac Fibrosis Automated Diagnosis Based on FibrosisNet Network Using CMR Ischemic Cardiomyopathy" Diagnostics 14, no. 3: 255. https://doi.org/10.3390/diagnostics14030255
APA StyleBekheet, M., Sallah, M., Alghamdi, N. S., Rusu-Both, R., Elgarayhi, A., & Elmogy, M. (2024). Cardiac Fibrosis Automated Diagnosis Based on FibrosisNet Network Using CMR Ischemic Cardiomyopathy. Diagnostics, 14(3), 255. https://doi.org/10.3390/diagnostics14030255