
Enhancing Dysarthric Voice Conversion with Fuzzy Expectation Maximization in Diffusion Models for Phoneme Prediction

Abstract
1. Introduction
- Spastic Dysarthria: Associated with damage to upper motor neurons in the motor areas of the cerebral cortex. This type typically causes strained, strangled speech quality, imprecise articulation, and a slow rate of speech due to increased muscle tone and spasticity [8].
- Ataxic Dysarthria: Primarily caused by cerebellar dysfunction, leading to a lack of coordination and control over speech movements. This type is characterized by irregular articulatory breakdowns, variable speech rate, and a jerky, uneven quality of speech [10].
- Hyperkinetic Dysarthria: Linked to disorders of the extrapyramidal system, such as Huntington’s disease, this type features involuntary movements that disrupt speech production, leading to irregular pitch, loudness variations, and erratic speech rhythm [11].
- Hypokinetic Dysarthria: Also related to extrapyramidal system disorders, particularly Parkinson’s disease, this type is marked by reduced range of motion, slow speech rate, and a monotonous voice due to diminished movement amplitude [12].
- Mixed Dysarthria: Involves a combination of symptoms from two or more types of dysarthria, typically resulting from damage across multiple neurological areas. Speech characteristics will reflect a mix of different dysarthria types, complicating diagnosis and treatment [1].
2. Materials and Methods
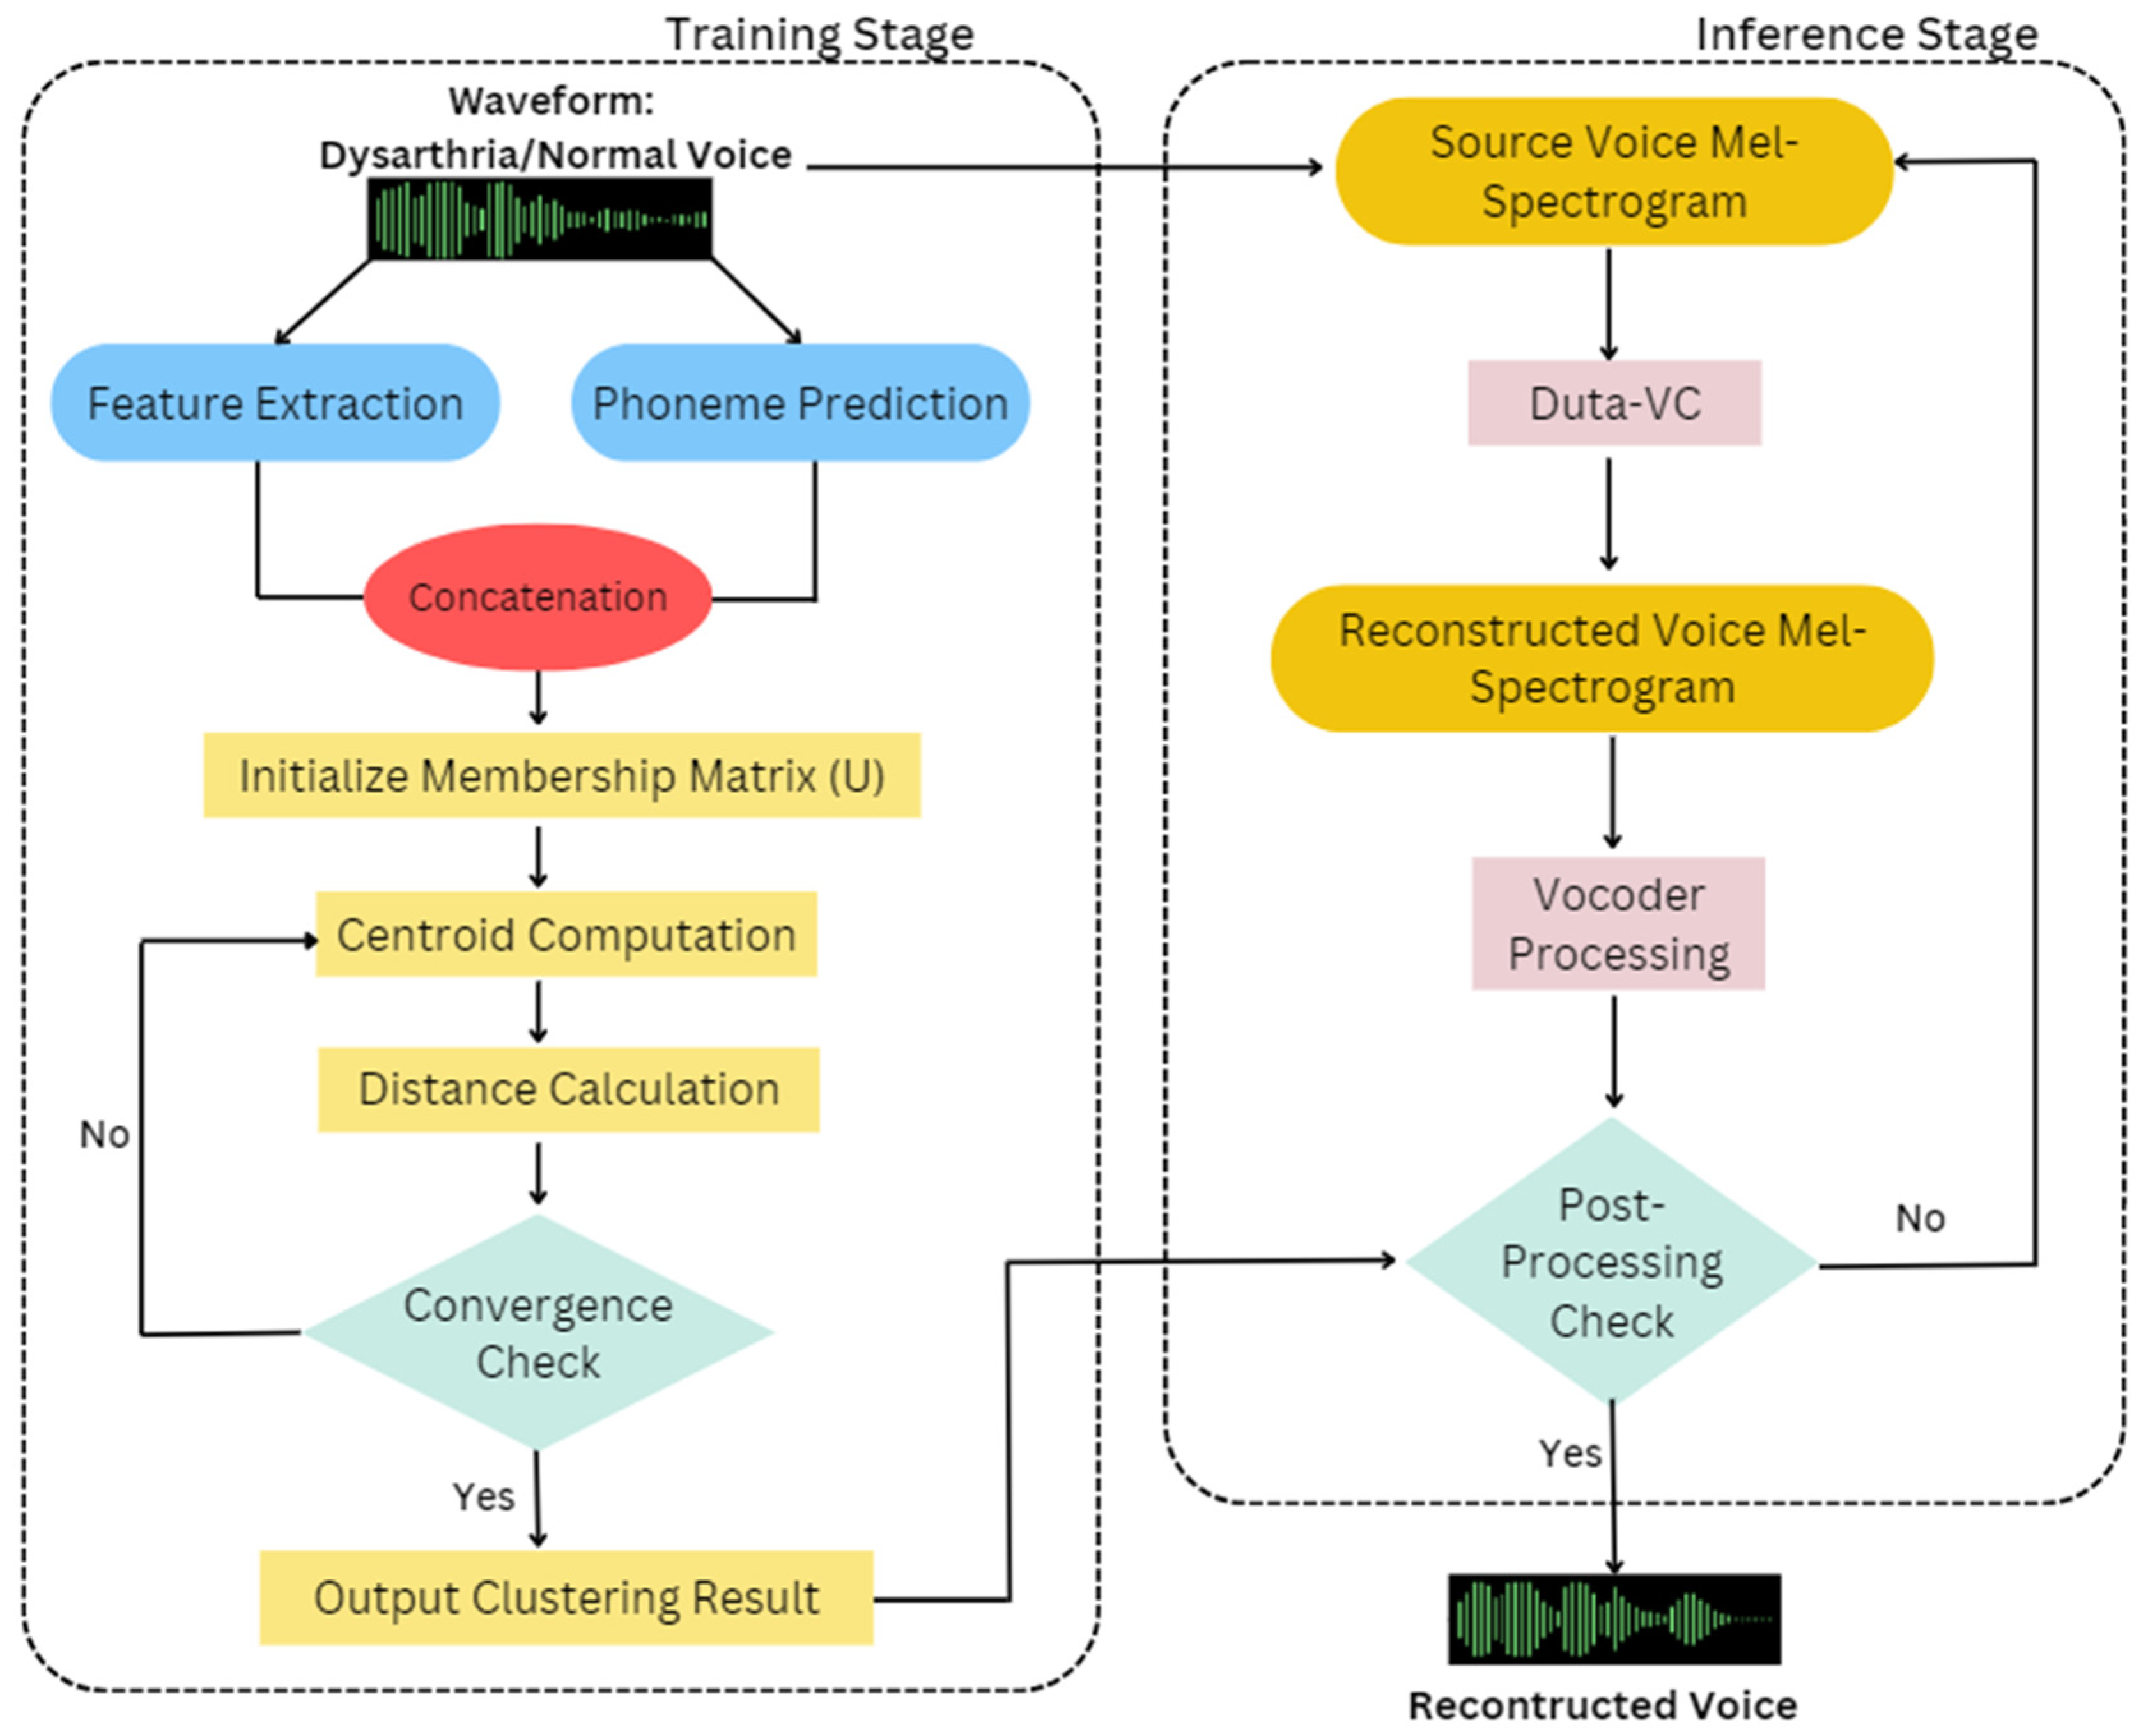
- Training Stage
- Waveform Input: The process begins with the input of an audio waveform, representing either dysarthric or normal speech.
- Feature extraction: Key features are extracted from the waveform, which includes essential elements like Mel-Frequency Cepstral Coefficients (MFCCs). To enhance temporal dynamics, the feature vector integrates both the first (delta) and second (delta-delta) derivatives of MFCCs. As a result, the complete feature vector comprises multi-dimensions, encompassing the original MFCCs along with their delta and delta-delta coefficients. The MFCC’s feature is as follows:where , for the MFCC features of frame t, we denote them as vector , which is a -dimensional vector.
- Phoneme Prediction: The FastSpeech-based phoneme predictor uses a feed-forward transformer (FFT) architecture, combining self-attention in the transformer and 1D convolution. The FFT structure has N blocks each for phoneme-to-Mel-spectrogram transformation, separated by a length regulator to address sequence length differences. Each FFT block integrates self-attention with multi-head attention for cross-position information, and a 2-layer 1D convolutional network with ReLU activation, replacing the dense network in the original transformer [43]. The feature is jointly optimized with a phoneme predictor using a frame-level cross-entropy (CE) loss during training. The ground truth phoneme labels and durations are obtained through forced alignment. The extracted features are then used to predict phonemes, contributing to the analysis of speech patterns. The phoneme prediction feature is as follows:for the phoneme label of frame , we represent it as a vector , which is a -dimensional vector.
- Concatenation: The outputs from feature extraction and phoneme prediction are concatenated to form a unified dataset, which serves as the input for the clustering algorithm.
- After expansion, we can express it as:
- Initialize Membership Matrix (U): The FEM clustering process starts with the random initialization of the membership matrix, denoted as U.
- Centroid Computation: The centroids for each cluster are computed based on the initialized membership matrix, providing a reference point for each cluster in the data.
- Distance Calculation: The distances between each data point and the computed centroids are calculated, guiding the reassignment of membership degrees.
- Convergence Check: The process iteratively checks for convergence by examining whether the differences in the membership matrix fall below a predefined threshold (e.g., Frobenius norm).
- If not converged: The process repeats the steps of centroid computation and distance calculation.
- If converged: The final clustering results are output based on the stable membership matrix.
- Inference Stage
- Source Voice Mel-Spectrogram: The source voice is converted into a Mel-spectrogram, which serves as the input for the Duta-VC model.
- Duta-VC: The Duta-VC model processes the source Mel-spectrogram, transforming it into a reconstructed voice Mel-spectrogram that aligns with the target voice characteristics.
- Vocoder Processing: The reconstructed Mel-spectrogram is passed through a vocoder, converting it back into a waveform.
- Post-Processing Check: A check is performed to predict whether the converted voice is normal. If it passes, the final reconstructed voice is accepted; otherwise, further processing may be required.
2.1. Dataset and Pre-Processing
2.2. Application of Fuzzy EM Clustering in Voice Conversion
| Algorithm 1: FEMPPDM-DVC (Fuzzy Expectation Maximization Clustering Stage) |
Input:
|
2.3. Inference Stage
- Forward Diffusion: Noise is gradually added to the input Mel-spectrogram, simulating the progression of dysarthric speech characteristics.
- Reverse Diffusion: This phase focuses on noise reduction, effectively reversing the forward diffusion process. The goal here is to restore the Mel-spectrogram to a form that closely resembles normal speech patterns.
2.4. Evaluation Metrics and Methodology
- Mean Opinion Score (MOS)The Mean Opinion Score (MOS) is a widely used subjective evaluation metric in the fields of speech synthesis, voice conversion, and audio quality assessment. This method involves human listeners rating the quality of audio output on a predefined scale, typically ranging from 1 (unacceptable) to 5 (excellent). The MOS represents the average of all individual ratings and provides insight into how well the converted speech is perceived by users.In the context of voice conversion, MOS evaluations are particularly useful because they capture human perceptions of speech naturalness, intelligibility, and overall sound quality, which are difficult to measure through purely objective metrics. Multiple listeners will be recruited to evaluate the converted speech, ensuring that the MOSs reflect a broad consensus on the quality of the output.The MOS serves as a critical metric for gauging the subjective quality of the voice conversion model, offering insights into how well the synthesized speech mimics human-like speech characteristics.
- Word Error Rate (WER)The Word Error Rate (WER) is an objective evaluation metric that measures the accuracy of the system’s speech conversion by comparing the generated text with a reference or ground truth transcription. WER is a common metric in tasks, such as speech recognition, machine translation, and text correction, and it quantifies how well the system transcribes or converts speech compared to a reference standard.WER is calculated based on three key operations:
- Substitution (S): Replacing a correct word with an incorrect one.
- Deletion (D): Omission of a word that should have been present.
- Insertion (I): Addition of an extraneous word that does not belong.
The formula to compute WER is:where N is the total number of words in the reference transcription. A lower WER implies a more accurate voice conversion, indicating fewer mistakes in the output. It provides an objective measure to assess how closely the system’s output matches the expected result and serves as a benchmark to compare the performance of various models. - Ablation ExperimentsThe ablation experiment is a technique used to evaluate the contribution of different components or features in a model by systematically removing or altering them and observing the impact on overall performance. In the context of voice conversion, this experiment is designed to assess the importance of individual modules or processing steps, such as feature extraction, diffusion models, or clustering algorithms, in the conversion process.By selectively disabling or modifying specific components of the voice conversion pipeline, we can understand how each part contributes to overall performance in terms of both subjective (MOS) and objective (WER) metrics. The ablation study helps identify which parts of the system are most critical to achieving high-quality speech conversion, thereby guiding further improvements and optimizations.
3. Result and Discussion
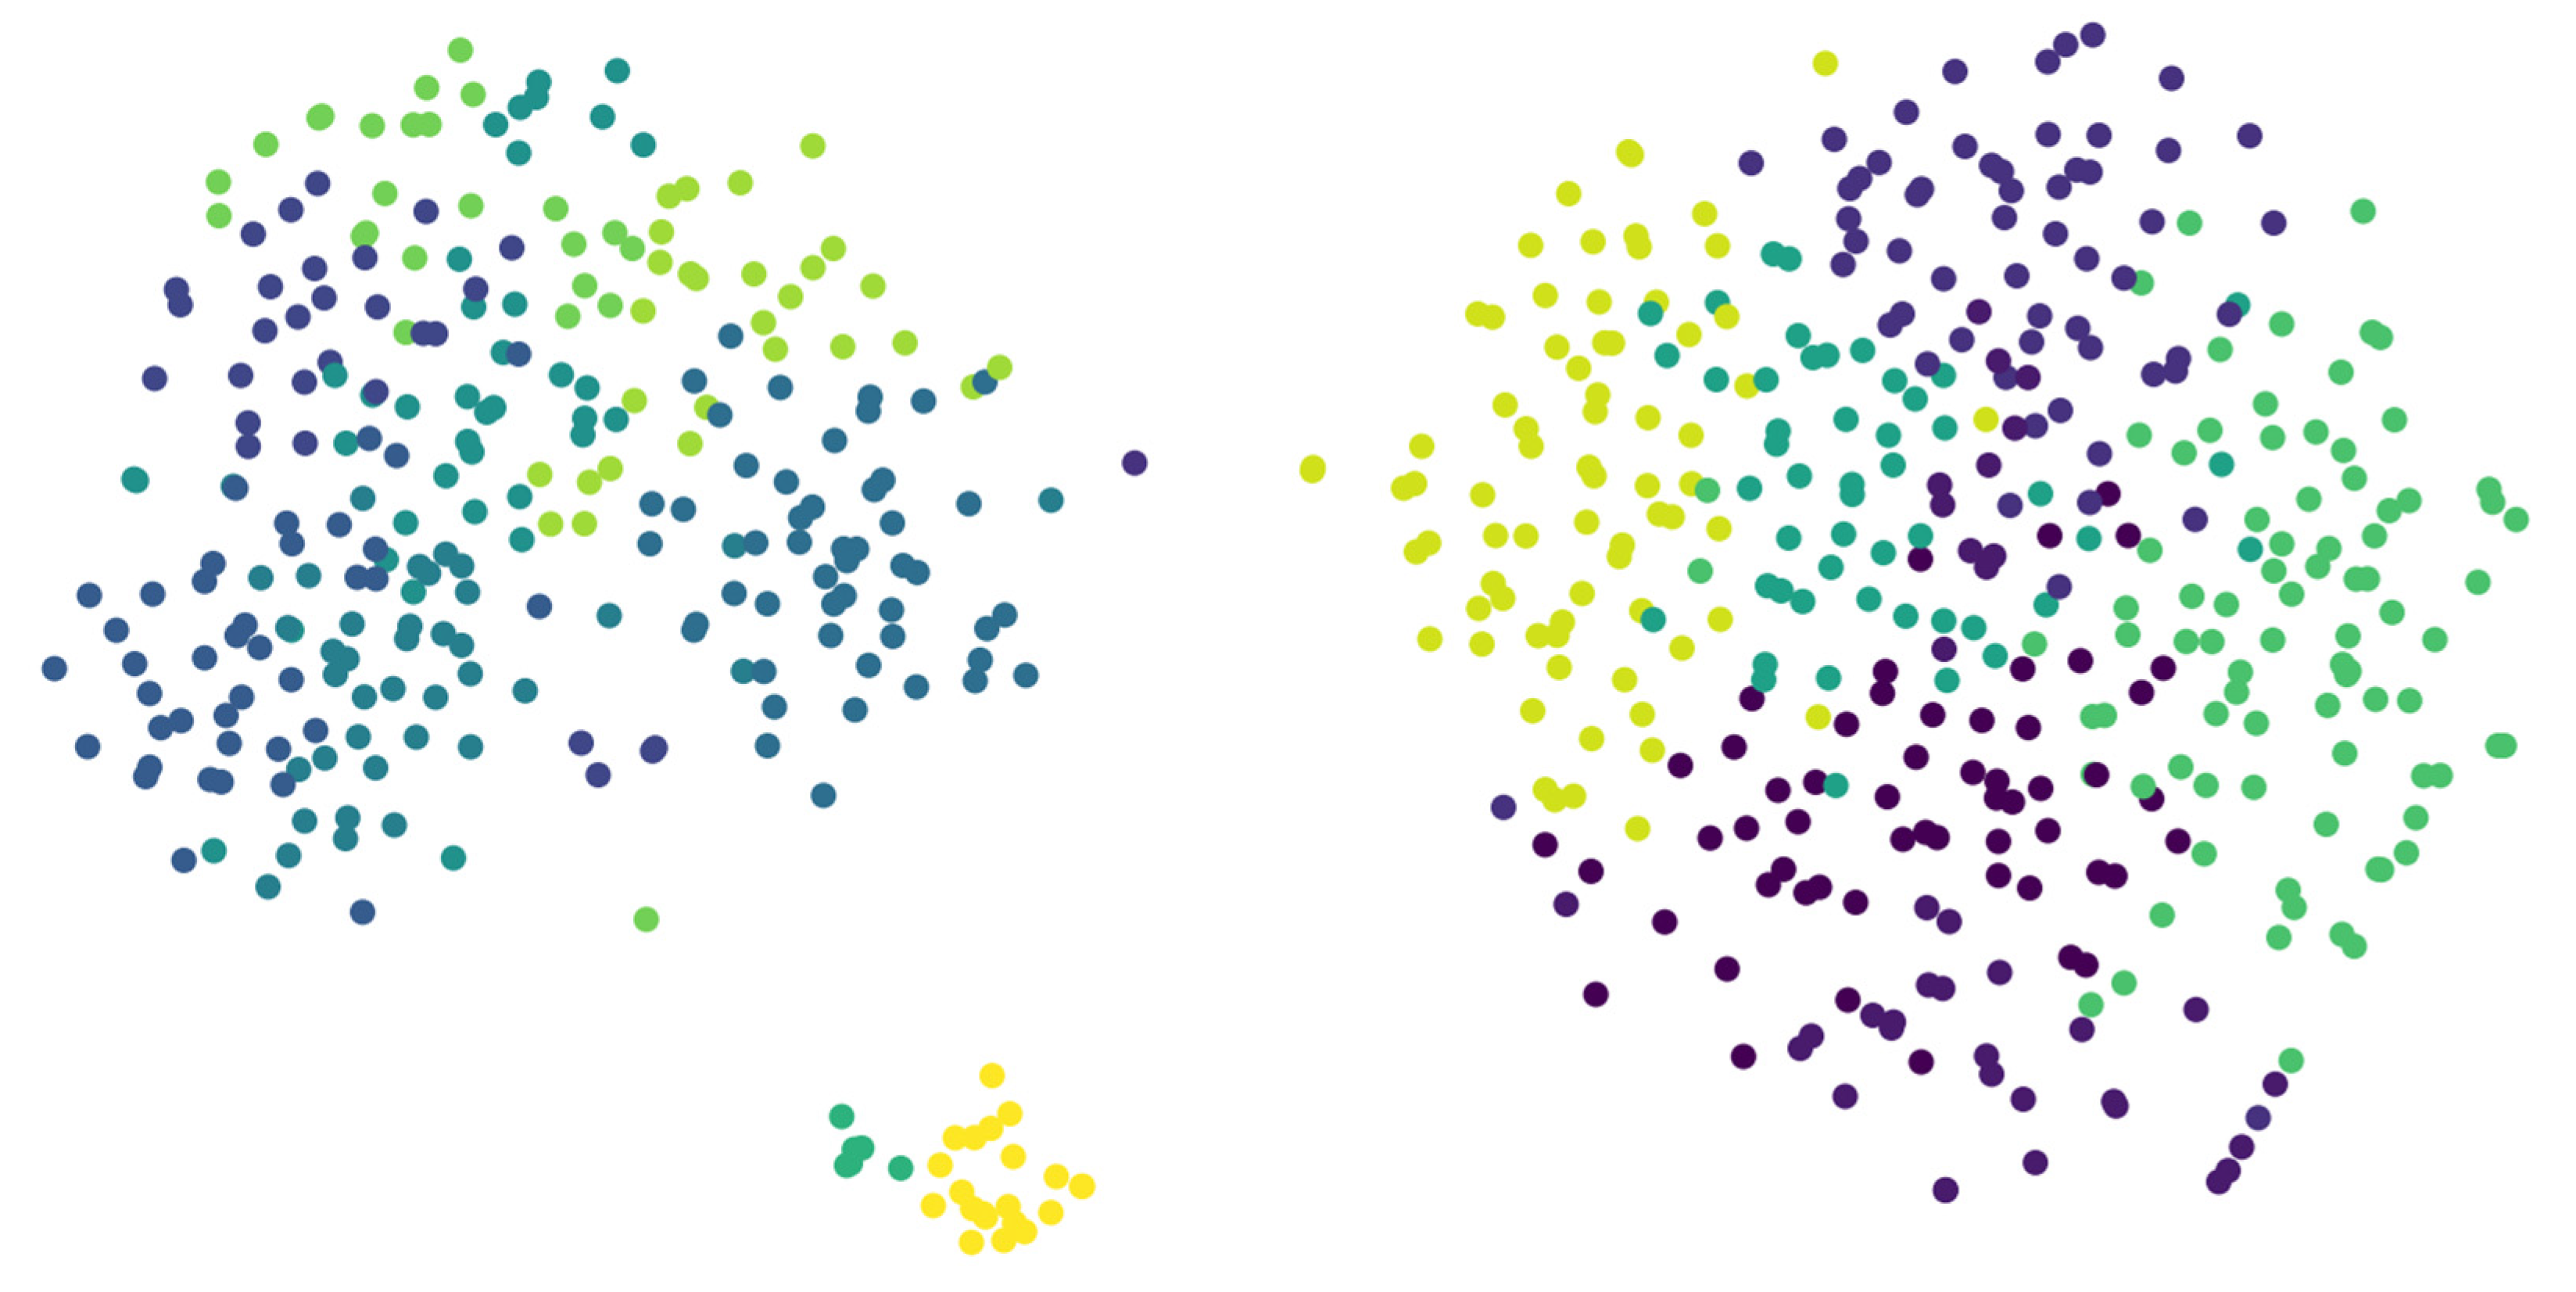
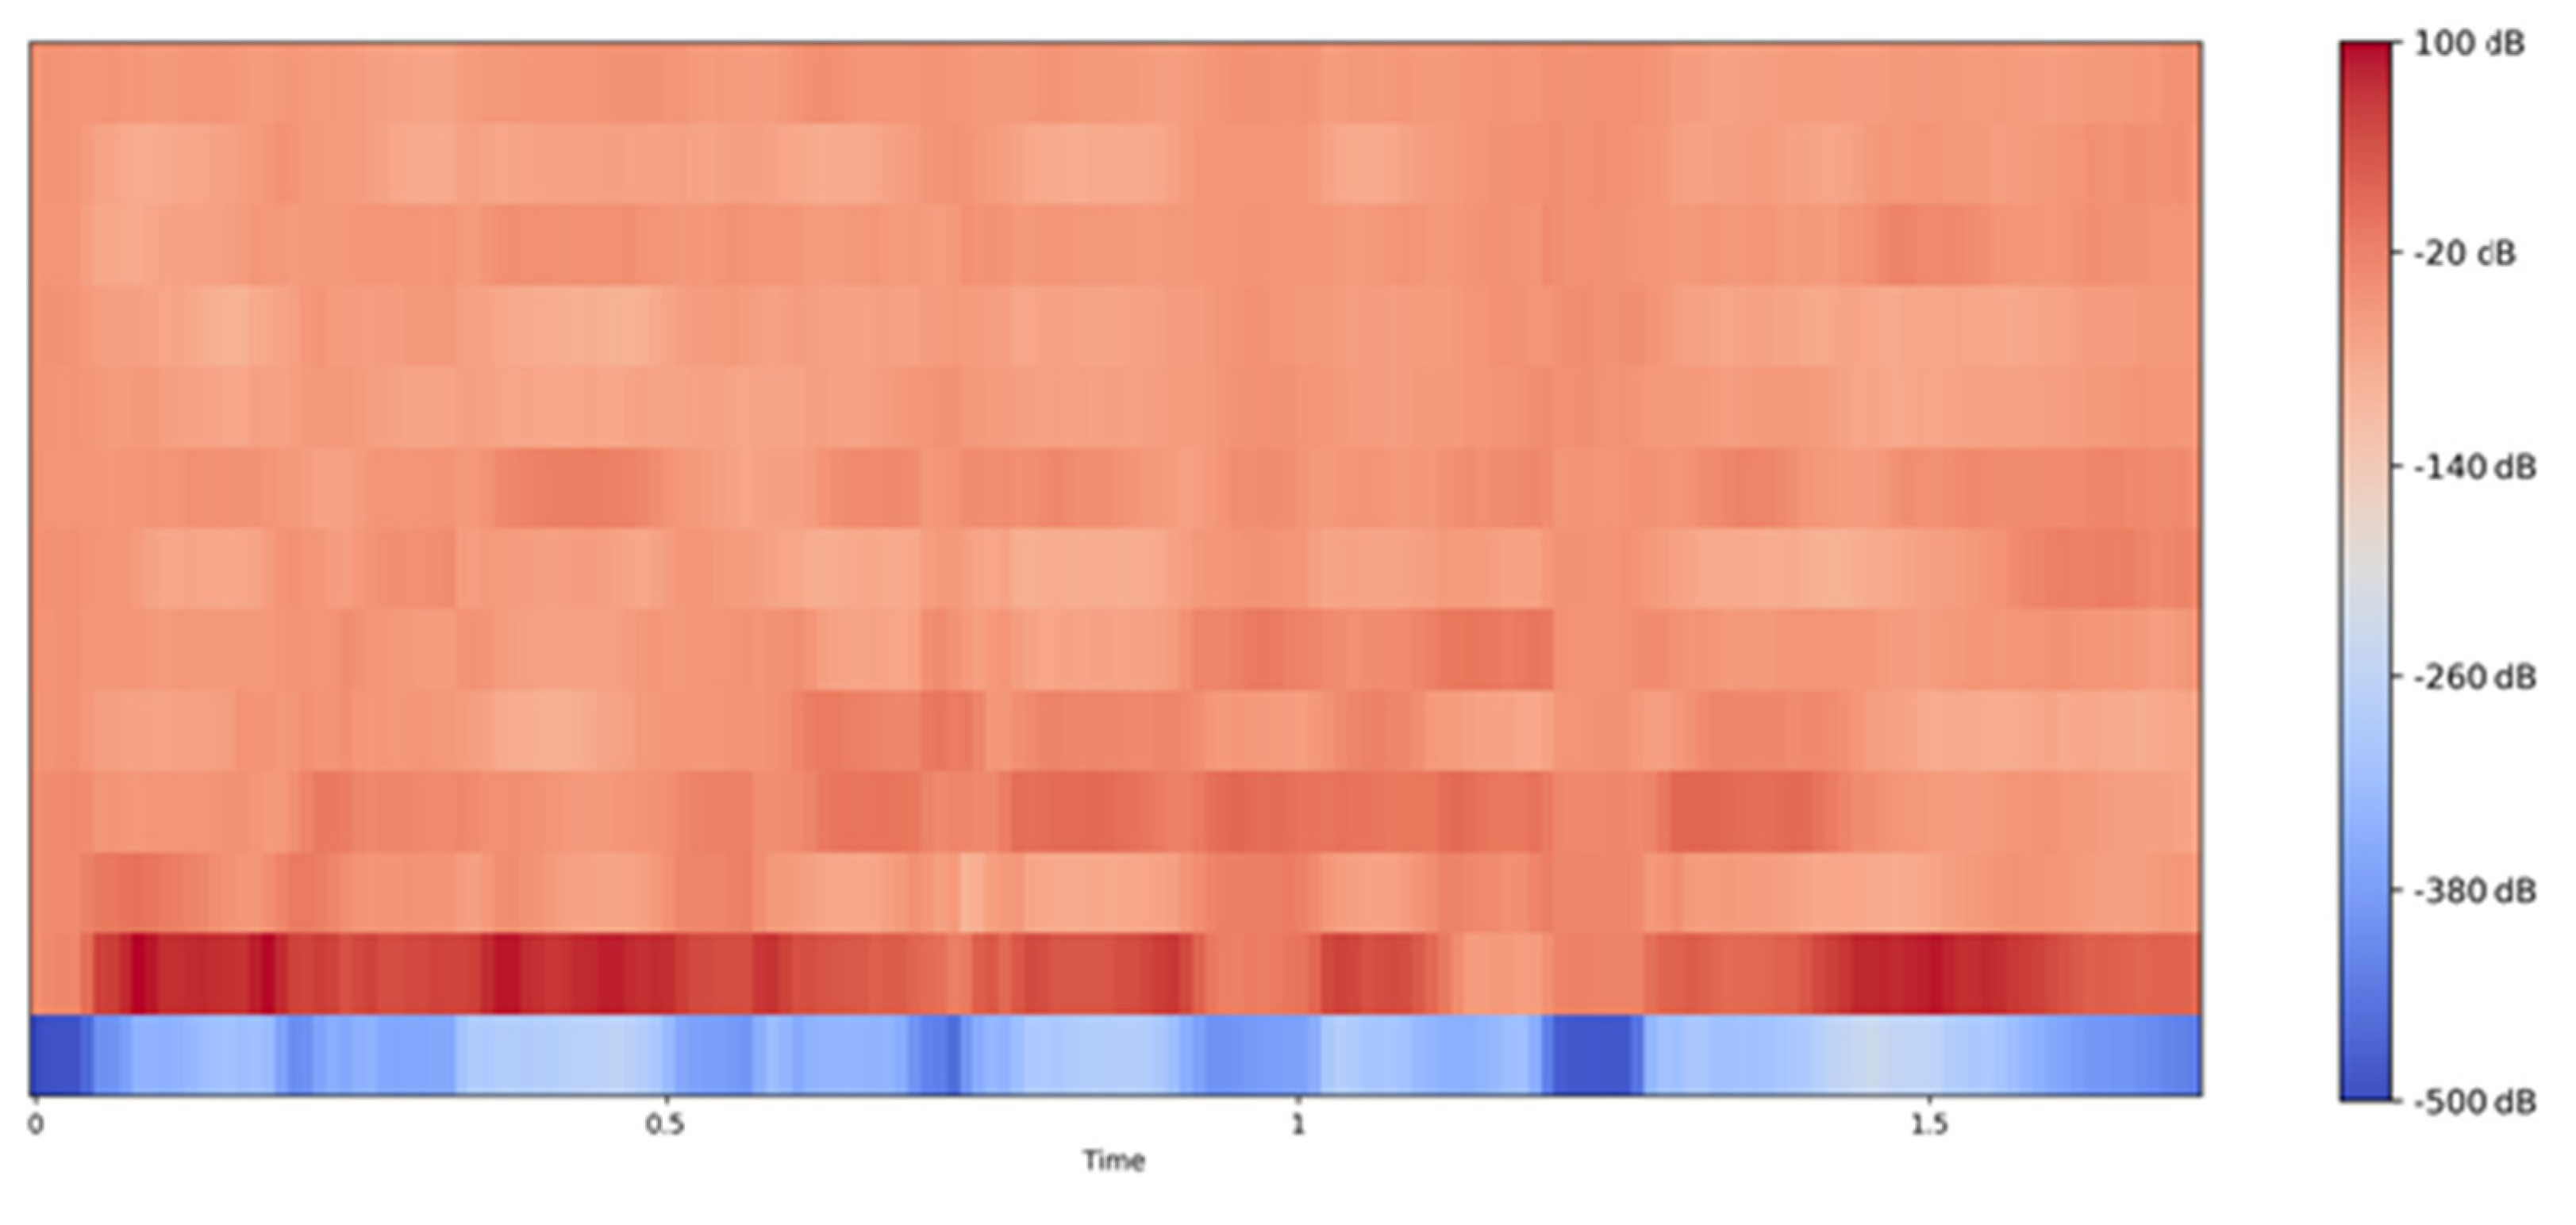
- MFCC Visualization:
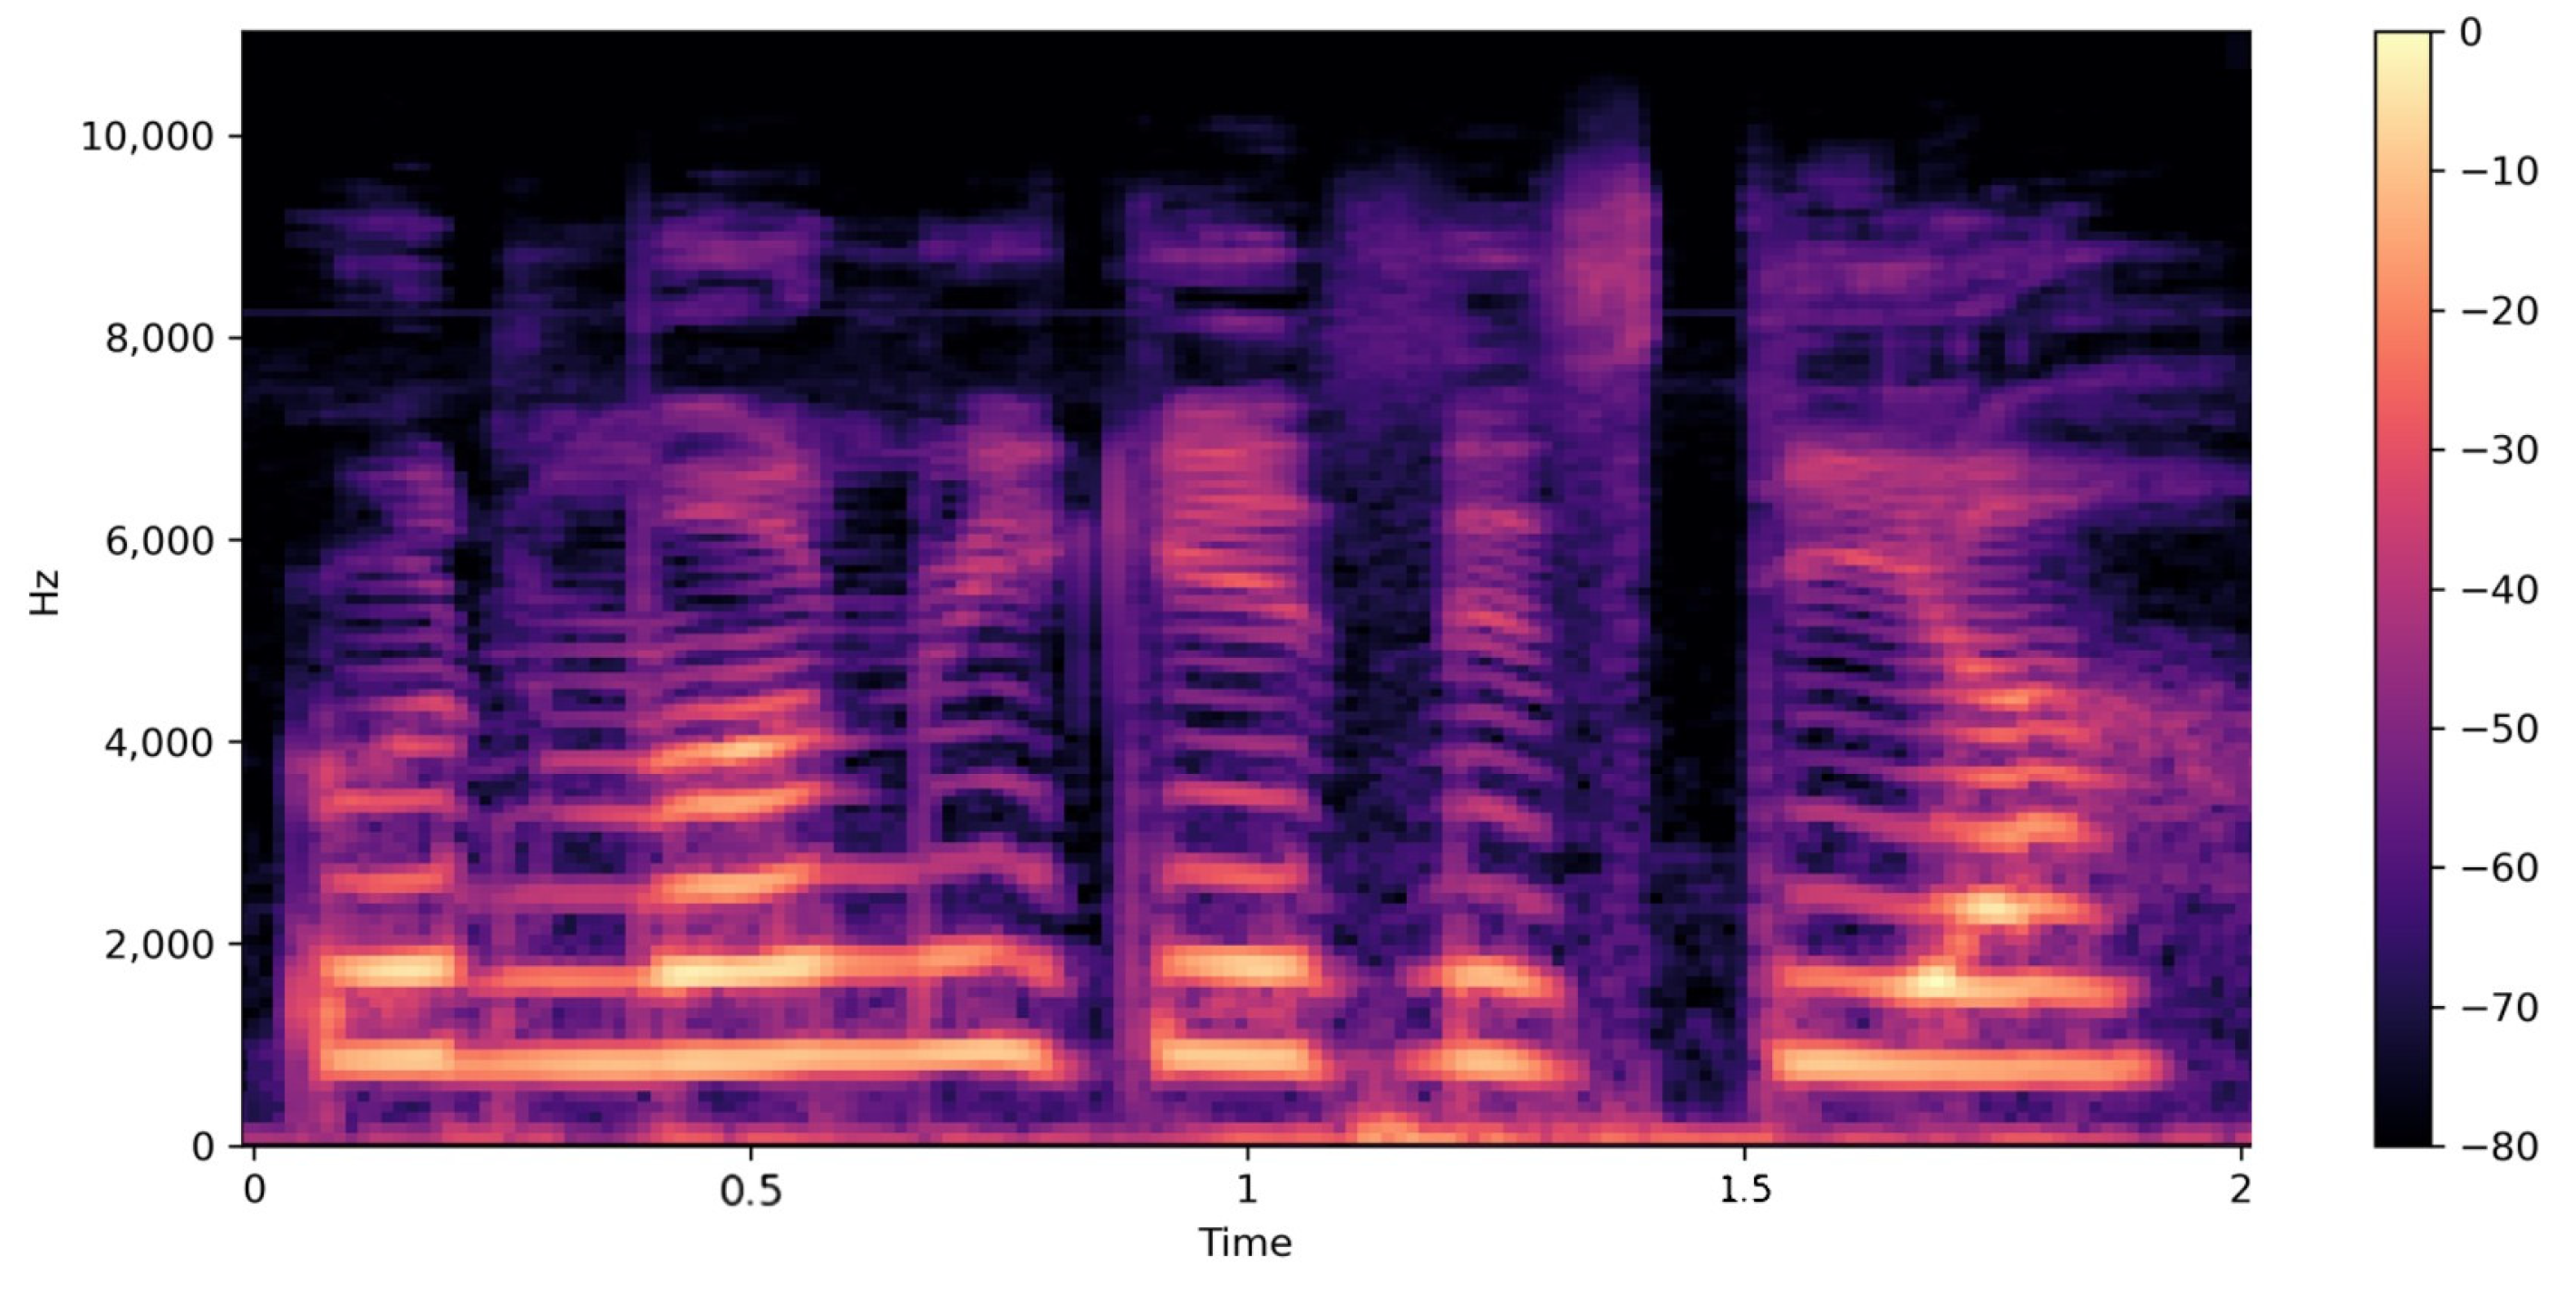
- Mel-spectrogram Visualization:
- Results of MOS Evaluation
- Naturalness: The proposed method achieves a score of 3.44, slightly outperforming Duta-VC (3.42) and significantly outperforming all other methods, indicating that the proposed model produces speech that is more natural and less robotic.
- Intelligibility: With a score of 3.54, the proposed method also surpasses other models in terms of improving speech clarity, making it more intelligible than models like Auto-VC and CycleGAN-VC. This improvement suggests that the proposed voice conversion method is highly effective in preserving or enhancing the clarity of the converted speech.
- Speaker Similarity: The proposed method achieves the highest score of 3.96, outperforming Duta-VC (3.94) and all other compared models. This indicates that the converted speech is very similar to the target speaker’s voice, supporting the success of the arbitrary-to-arbitrary conversion goal.
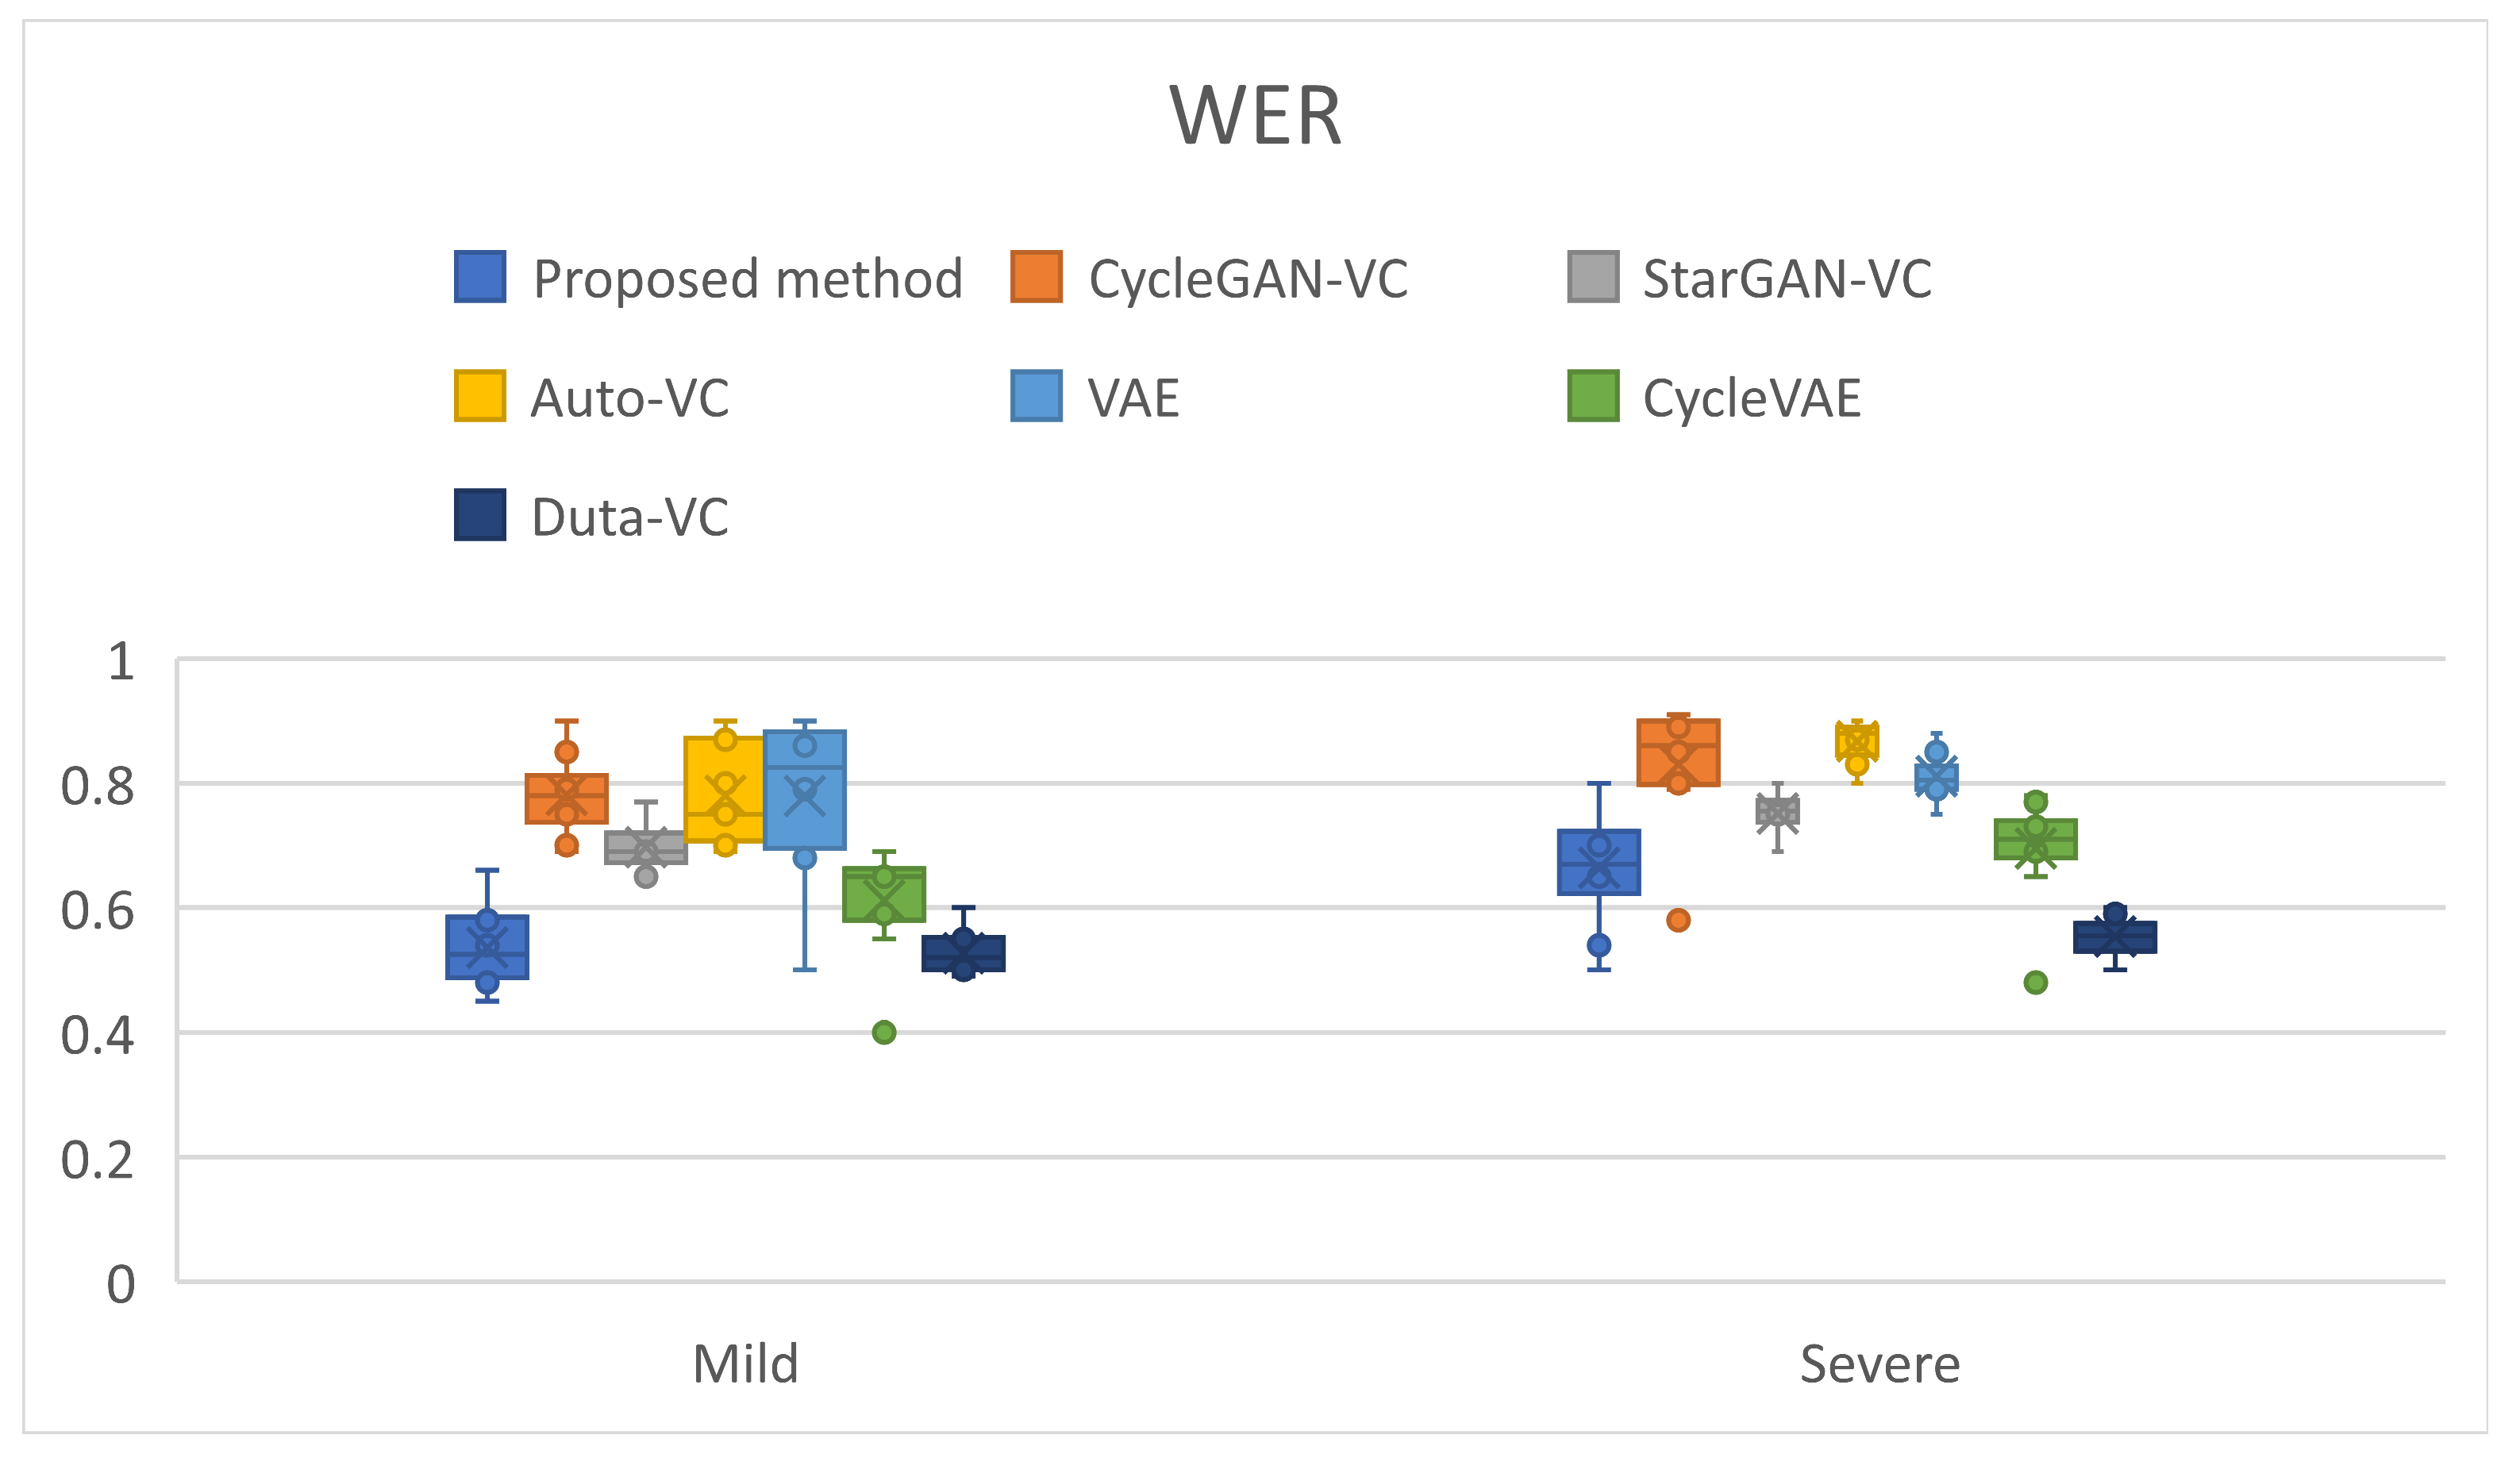
- Word Error Rate (WER) Comparison for Mild and Severe Dysarthria
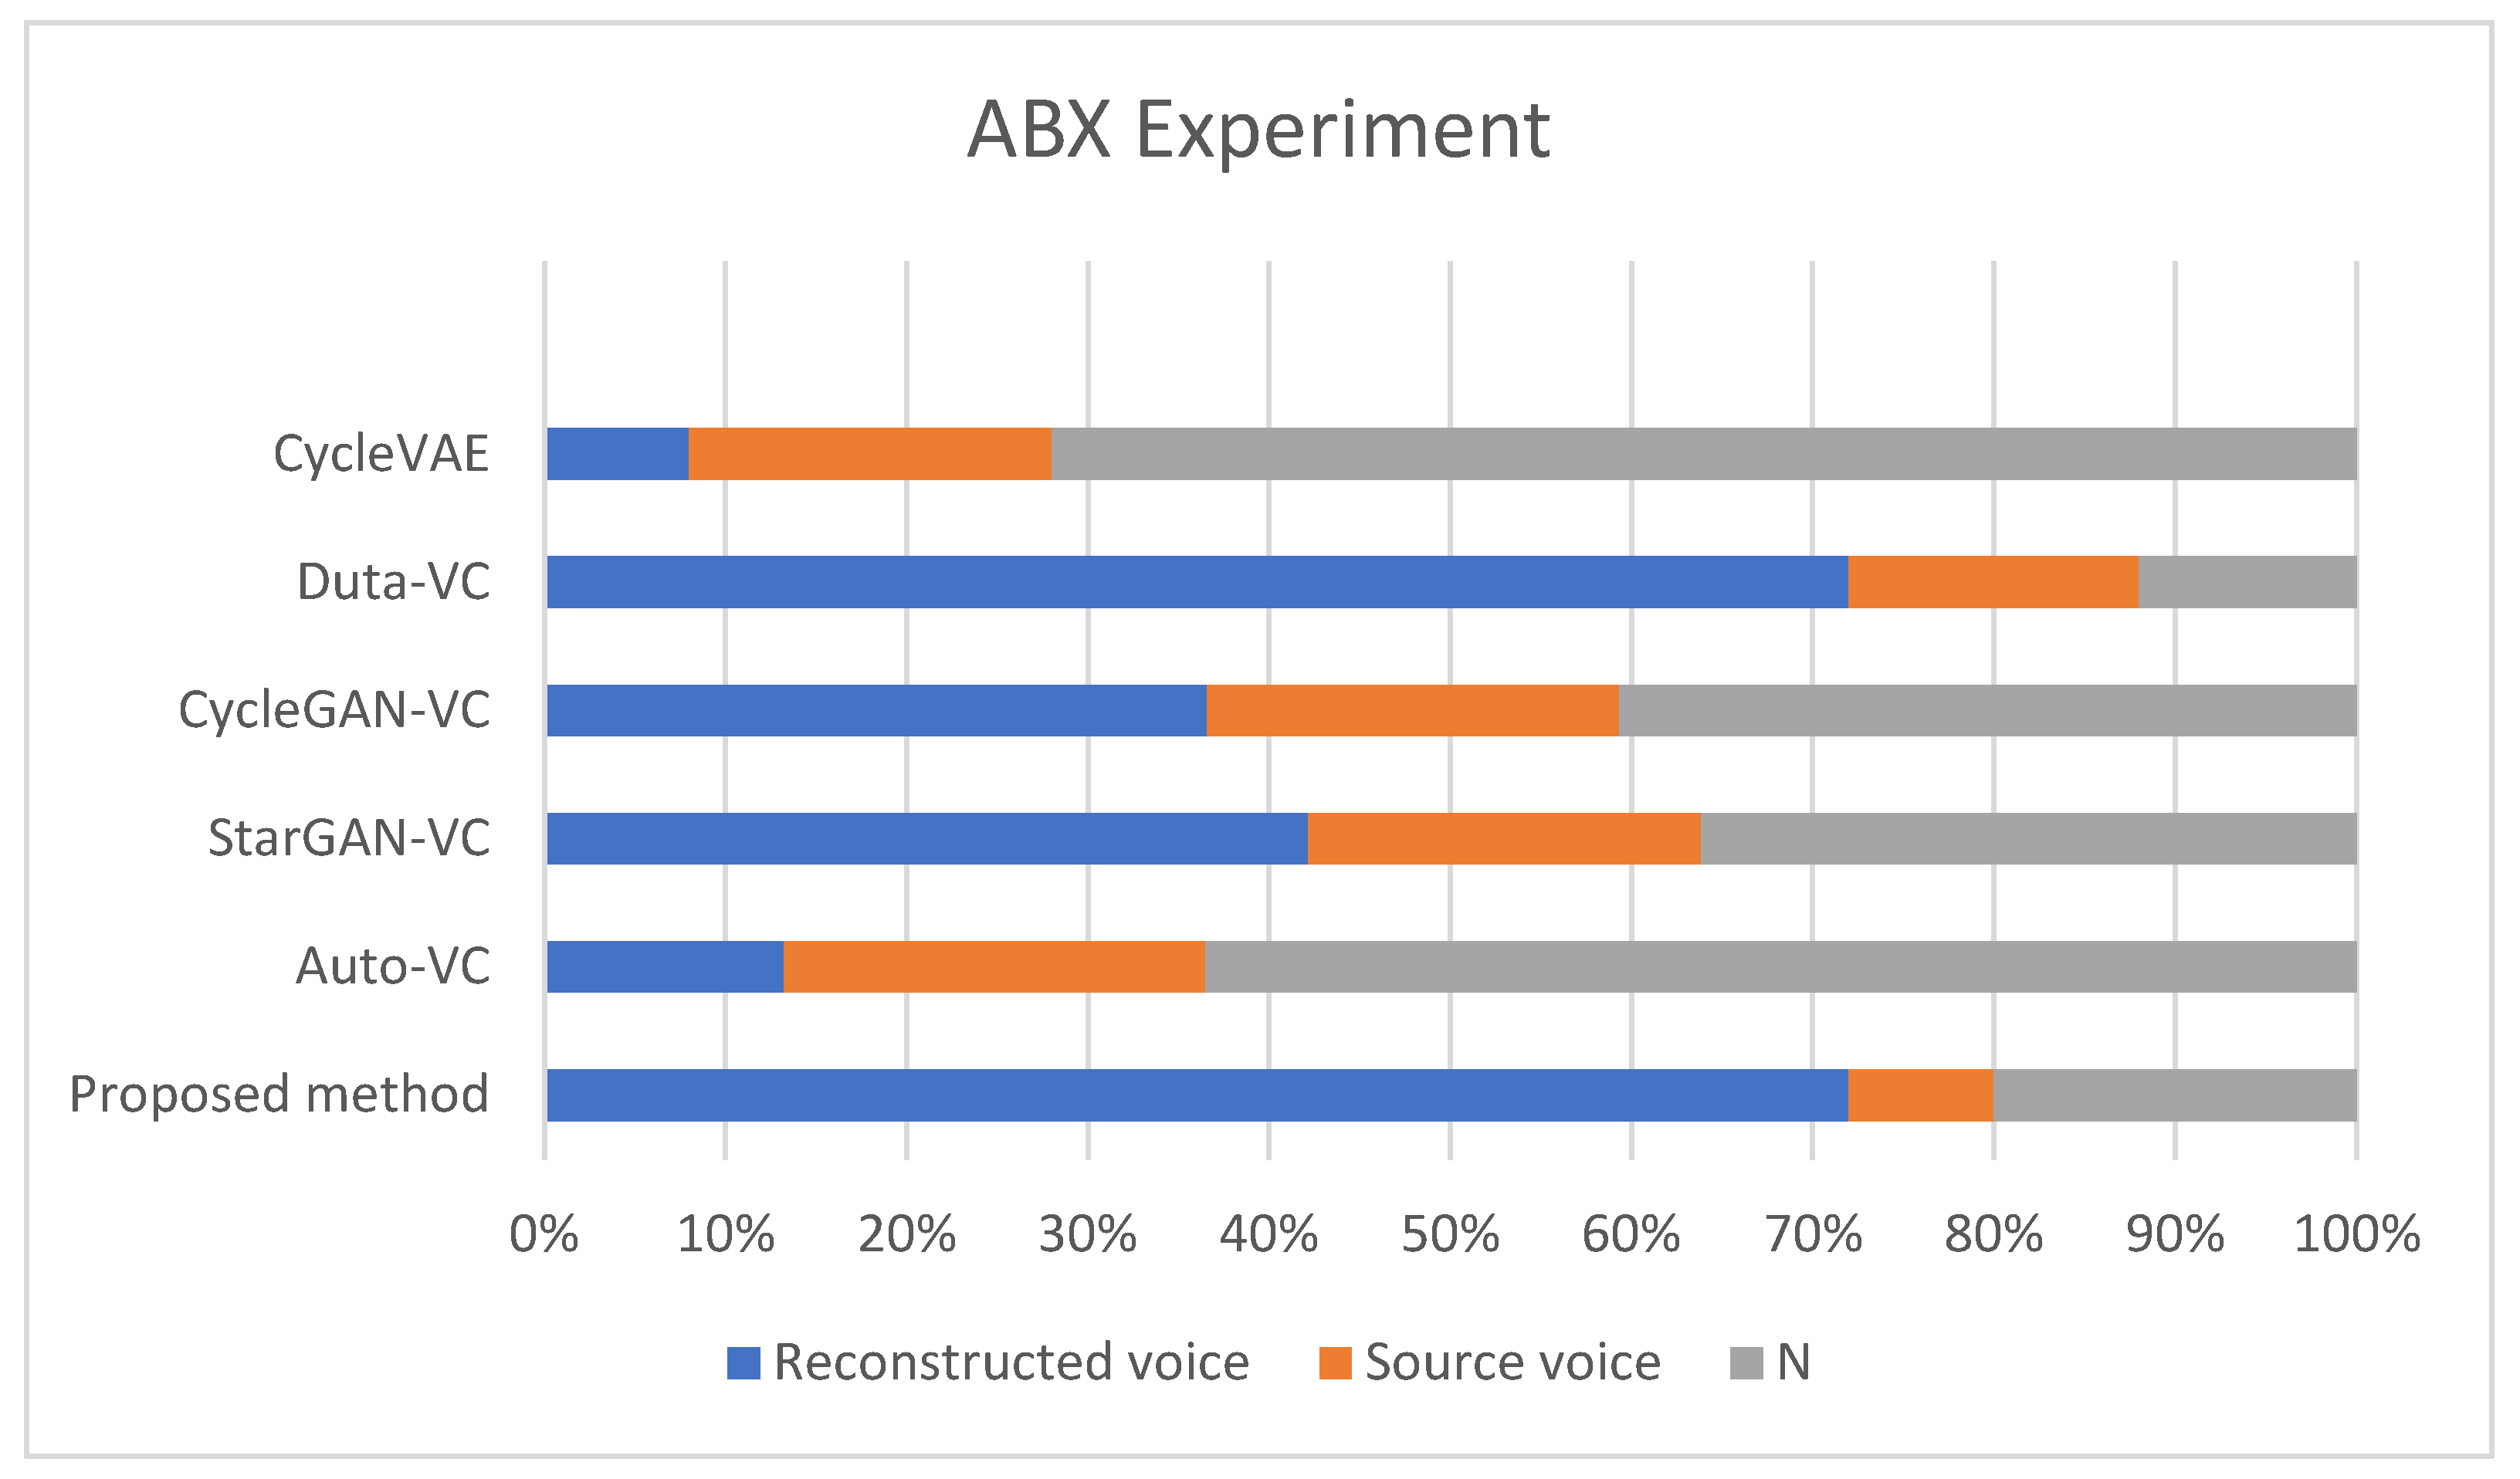
- Ablation Experiments
- CycleVAE: Exhibited the least effective performance, with around 10% of votes favoring the reconstructed voice. This poor result is likely due to the lack of feature extraction relevant to naturalness, causing significant degradation in both naturalness and intelligibility.
- Duta-VC: Demonstrated moderate performance, with about 50% of votes favoring the reconstructed voice. The absence of the speaker-encoder moderately affects the speech quality, though the model still manages to retain some degree of intelligibility.
- CycleGAN-VC: Achieved roughly 40% preference for the reconstructed voice, suggesting that the model relies heavily on the speaker-encoder to maintain voice characteristics.
- StarGAN-VC: Showed similar results to CycleGAN-VC, with approximately 45% of votes favoring the reconstructed voice. The absence of the speaker-encoder results in a noticeable degradation in naturalness.
- Auto-VC: The absence of the speaker-encoder severely impacted Auto-VC’s performance, with about 60% of votes leaning towards the source voice. This indicates that the speaker-encoder plays a vital role in retaining the naturalness of the converted voice.
- Proposed Method (diffusion-based): Achieved the best results, with around 70% of votes in favor of the reconstructed voice. Even without the speaker-encoder, the proposed method retains superior performance in both naturalness and intelligibility, indicating its robustness. The diffusion-based approach effectively manages speech conversion, even without the direct input of speaker features, which highlights its strength in complex voice conversion tasks.
4. Conclusions
Author Contributions
Funding
Institutional Review Board Statement
Informed Consent Statement
Data Availability Statement
Conflicts of Interest
Correction Statement
References
- Enderby, P. Disorders of communication: Dysarthria. Handb. Clin. Neurol. 2013, 110, 273–281. [Google Scholar] [PubMed]
- De Russis, L.; Corno, F. On the impact of dysarthric speech on contemporary ASR cloud platforms. J. Reliab. Intell. Environ. 2019, 5, 163–172. [Google Scholar] [CrossRef]
- Ballati, F.; Corno, F.; De Russis, L. Assessing virtual assistant capabilities with Italian dysarthric speech. In Proceedings of the 20th International ACM SIGACCESS Conference on Computers and Accessibility, Galway, Ireland, 22–24 October 2018; pp. 93–101. [Google Scholar]
- Ballati, F.; Corno, F.; De Russis, L. “Hey Siri, Do You Understand Me?”: Virtual Assistants and Dysarthria. In Proceedings of the International Workshop on the Reliability of Intelligent Environments (Workshops), Rome, Italy, 25–28 June 2018; pp. 557–566. [Google Scholar]
- Illner, V.; Tykalova, T.; Skrabal, D.; Klempir, J.; Rusz, J. Automated Vowel Articulation Analysis in Connected Speech Among Progressive Neurological Diseases, Dysarthria Types, and Dysarthria Severities. J. Speech Lang. Hear. Res. 2023, 66, 2600–2621. [Google Scholar] [CrossRef]
- Convey, R.B.; Ihalainen, T.; Liu, Y.; Räsänen, O.; Ylinen, S.; Penttilä, N. A comparative study of automatic vowel articulation index and auditory-perceptual assessments of speech intelligibility in Parkinson’s disease. Int. J. Speech-Lang. Pathol. 2023, 26, 663–673. [Google Scholar] [CrossRef]
- Ayush, T.; Swapnil, B.; Sunil, K.K. Automatic speaker independent dysarthric speech intelligibility assessment system. Comput. Speech Lang. 2021, 69, 101213. [Google Scholar]
- Lévêque, N.; Slis, A.; Lancia, L.; Bruneteau, G.; Fougeron, C. Acoustic change over time in spastic and/or flaccid dysarthria in motor neuron diseases. J. Speech Lang. Hear. Res. 2022, 65, 1767–1783. [Google Scholar] [CrossRef]
- Clark, H.M.; Duffy, J.R.; Strand, E.A.; Hanley, H.; Solomon, N.P. Orofacial muscle strength across the dysarthrias. Brain Sci. 2022, 12, 365. [Google Scholar] [CrossRef]
- Kent, R.D.; Kent, J.F.; Duffy, J.R.; Thomas, J.E.; Weismer, G.; Stuntebeck, S. Ataxic dysarthria. J. Speech Lang. Hear. Res. 2000, 43, 1275–1289. [Google Scholar] [CrossRef] [PubMed]
- Barkmeier-Kraemer, J.M.; Clark, H.M. Speech–Language Pathology Evaluation and Management of Hyperkinetic Disorders Affecting Speech and Swallowing Function. Tremor Other Hyperkinet. Mov. 2017, 7, 489. [Google Scholar] [CrossRef]
- Atalar, M.S.; Oguz, O.; Genc, G. Hypokinetic Dysarthria in Parkinson’s Disease: A Narrative Review. Sisli Etfal Hastan Tip Bul. 2023, 57, 163–170. [Google Scholar] [CrossRef] [PubMed]
- Purohit, M.; Patel, M.; Malaviya, H.; Patil, A.; Parmar, M.; Shah, N.; Doshi, S.; Patil, H. Intelligibility Improvement of Dysarthric Speech using MMSE DiscoGAN. In Proceedings of the 2020 International Conference on Signal Processing and Communications (SPCOM), Bangalore, India, 19–24 July 2020; pp. 1–5. [Google Scholar]
- Suresh, M.; Rajan, R.; Thomas, J. Dysarthria Speech Disorder Classification Using Traditional and Deep Learning Models. In Proceedings of the 2023 Second International Conference on Electrical, Electronics, Information and Communication Technologies (ICEEICT), Trichirappalli, India, 5–7 April 2023; pp. 1–6. [Google Scholar]
- Joshy, A.A.; Rajan, R. Automated dysarthria severity classification: A study on acoustic features and deep learning techniques. IEEE Trans. Neural Syst. Rehabil. Eng. 2022, 30, 1147–1157. [Google Scholar] [CrossRef]
- Wang, H.; Thebaud, T.; Villalba, J.; Sydnor, M.; Lammers, B.; Dehak, N.; Moro-Velazquez, L. DuTa-VC: A Duration-aware Typical-to-atypical Voice Conversion Approach with Diffusion Probabilistic Model. In Proceedings of the Interspeech 2023, Dublin, Ireland, 20–24 August 2023; pp. 1548–1552. [Google Scholar]
- MacQueen, J.B. Some methods for classification and analysis of multivariate observations. In Proceedings of the Fifth Berkeley Symposium on Mathematical Statistics and Probability; University of California Press: Berkeley, CA, USA, 1967; pp. 281–297. [Google Scholar]
- Forgy, E. Cluster analysis of multivariate data: Efficiency versus interpretability of classifications. Biometrics 1965, 21, 768–776. [Google Scholar]
- Selim, S.Z.; Ismail, M.A. K-means type algorithms: A generalized convergence theorem and characterization of local optimality. IEEE Trans. Pattern Anal. Mach. Intell. 1984, 6, 81–87. [Google Scholar] [CrossRef] [PubMed]
- Nasser, S.; Alkhaldi, R.; Vert, G. A Modified Fuzzy K-means Clustering using Expectation Maximization. In Proceedings of the 2006 IEEE International Conference on Fuzzy Systems, Vancouver, BC, Canada, 16–21 July 2006; pp. 231–235. [Google Scholar]
- Bezdek, J.C. Fuzzy Mathematics in Pattern Classification; Cornell University: Ithaca, NY, USA, 1973. [Google Scholar]
- Borlea, I.D.; Precup, R.E.; Borlea, A.B. Improvement of K-means Cluster Quality by Post Processing Resulted Clusters. Procedia Comput. Sci. 2022, 199, 63–70. [Google Scholar] [CrossRef]
- Ghosh, S.; Dubey, S.K. Comparative analysis of k-means and fuzzy c-means algorithms. Int. J. Adv. Comput. Sci. Appl. 2013, 4, 35–39. [Google Scholar] [CrossRef]
- Chen, N.; Zhang, Y.; Zen, H.; Weiss, R.J.; Norouzi, M.; Chan, W. WaveGrad: Estimating gradients for waveform generatioN. In Proceedings of the 9th International Conference on Learning Representations (ICLR), Virtual, 3–7 May 2021. [Google Scholar]
- Song, Y.; Sohl-Dickstein, J.; Kingma, D.P.; Kumar, A.; Ermon, S.; Poole, B. Score-based generative modeling through stochastic differential equations. In Proceedings of the 9th International Conference on Learning Representations (ICLR), Virtual, 3–7 May 2021. [Google Scholar]
- Liu, J.; Li, C.; Ren, Y.; Chen, F.; Liu, P.; Zhao, Z. DiffSinger: Singing Voice Synthesis via Shallow Diffusion Mechanism. In Proceedings of the AAAI Conference on Artificial Intelligence, Virtual, 22 March 2022; pp. 11020–11028. [Google Scholar]
- Ho, J.; Jain, A.; Abbeel, P. Denoising diffusion probabilistic models. Adv. Neural Inf. Process. Syst. 2020, 33, 6840–6851. [Google Scholar]
- Yang, X.; Zhou, D.; Feng, J.; Wang, X. Diffusion probabilistic model made slim. In Proceedings of the IEEE/CVF Conference on Computer Vision and Pattern Recognition, Vancouver, BC, Canada, 18–22 June 2023; pp. 22552–22562. [Google Scholar]
- Esser, P.; Kulal, S.; Blattmann, A.; Entezari, R.; Müller, J.; Saini, H.; Levi, Y.; Lorenz, D.; Sauer, A.; Boesel, F.; et al. Scaling rectified flow transformers for high-resolution image synthesis. In Proceedings of the 41st International Conference on Machine Learning, Vienna, Austria, 21–27 July 2024. [Google Scholar]
- Ramesh, A.; Dhariwal, P.; Nichol, A.; Chu, C.; Chen, M. Hierarchical text-conditional image generation with clip latents. arXiv 2022, arXiv:2204.06125. [Google Scholar]
- Kong, Z.; Ping, W. On fast sampling of diffusion probabilistic models. arXiv 2021, arXiv:2106.00132. [Google Scholar]
- Watson, D.; Ho, J.; Norouzi, M.; Chan, W. Learning to efficiently sample from diffusion probabilistic models. arXiv 2021, arXiv:2106.03802. [Google Scholar]
- Popov, V.; Vovk, I.; Gogoryan, V.; Sadekova, T.; Kudinov, M. Grad-TTS: A diffusion probabilistic model for text-to-speech. In Proceedings of the 38th International Conference on Machine Learning, Virtual, 18–24 July 2021; pp. 8599–8608. [Google Scholar]
- Luo, C. Understanding diffusion models: A unified perspective. arXiv 2022, arXiv:2208.11970. [Google Scholar]
- Amit, T.; Shaharbany, T.; Nachmani, E.; Wolf, L. Segdiff: Image segmentation with diffusion probabilistic models. arXiv 2021, arXiv:2112.00390. [Google Scholar]
- Nichol, A.Q.; Dhariwal, P. Improved denoising diffusion probabilistic models. In Proceedings of the 38th International Conference on Machine Learning, Virtual, 18–24 July 2021; pp. 8162–8171. [Google Scholar]
- Lugmayr, A.; Danelljan, M.; Romero, A.; Yu, F.; Timofte, R.; Van Gool, L. RePaint: Inpainting using Denoising Diffusion Probabilistic Models. In Proceedings of the 2022 IEEE/CVF Conference on Computer Vision and Pattern Recognition (CVPR), New Orleans, LA, USA, 18–24 June 2022; pp. 11451–11461. [Google Scholar]
- Choi, J.; Kim, S.; Jeong, Y.; Gwon, Y.; Yoon, S. ILVR: Conditioning Method for Denoising Diffusion Probabilistic Models. In Proceedings of the 2021 IEEE/CVF International Conference on Computer Vision (ICCV), Montreal, QC, Canada, 11–17 October 2021; pp. 14347–14356. [Google Scholar]
- Kim, J.; Kim, S.; Kong, J.; Yoon, S. Glow-TTS: A Generative Flow for Text-to Speech via Monotonic Alignment Search. Adv. Neural Inf. Process. Syst. 2020, 33, 8067–8077. [Google Scholar]
- Kong, Z.; Ping, W.; Huang, J.; Zhao, K.; Catanzaro, B. DiffWave: A Versatile Diffusion Model for Audio Synthesis. In Proceedings of the International Conference on Learning Representations, Virtual, 3–7 May 2021. [Google Scholar]
- Jeong, M.; Kim, H.; Cheon, S.J.; Choi, B.J.; Kim, N.S. Diff-TTS: A denoising diffusion model for text-to-speech. arXiv 2021, arXiv:2104.01409. [Google Scholar]
- Barry, W.J.; Pützer, M. Saarbrucken Voice Database. Institute of Phonetics, University of Saarland, June 2019. Available online: https://stimmdb.coli.uni-saarland.de/help_en.php4 (accessed on 17 May 2024).
- Ren, Y.; Ruan, Y.; Tan, X.; Qin, T.; Zhao, S.; Zhao, Z.; Liu, T. Fastspeech: Fast, robust and controllable text to speech. In Proceedings of the Conference on Neural Information Processing Systems (NeurIPS), Vancouver, BC, Canada, 8–14 December 2019; Wallach, H.M., Larochelle, H., Beygelzimer, A., d’Alche-Buc, F., Fox, E.B., Garnett, R., Eds.; Curran Associates Inc.: Red Hook, NY, USA, 2019; pp. 3165–3174. [Google Scholar]
- Kameoka, H.; Kaneko, T.; Tanaka, K.; Hojo, N. StarGAN-VC: Nonparallel many-to-many voice conversion using star generative adversarial networks. In Proceedings of the 2018 IEEE Spoken Language Technology Workshop (SLT), Athens, Greece, 18–21 December 2018; pp. 266–273. [Google Scholar]
- Qian, K.; Zhang, Y.; Chang, S.; Yang, X.; Hasegawa-Johnson, M. AutoVC: Zero-shot voice style transfer with only autoencoder loss. In Proceedings of the 36th International Conference on Machine Learning, Long Beach, CA, USA, 9–15 June 2019; pp. 5210–5219. [Google Scholar]
- Kaneko, T.; Kameoka, H. CycleGAN-VC: Non-parallel voice conversion using cycle-consistent adversarial networks. In Proceedings of the IEEE 26th European Signal Processing Conference (EUSIPCO), Rome, Italy, 3–7 September 2018; pp. 2100–2104. [Google Scholar]
- Kingma, D.P.; Welling, M. Auto-encoding variational Bayes. arXiv 2013, arXiv:1312.6114. [Google Scholar]
- van den Oord, A.; Vinyals, O.; Kavukcuoglu, K. Neural discrete representation learning. In Proceedings of the Conference on Neural Information Processing Systems (NIPS), Long Beach, CA, USA, 4–9 December 2017; pp. 1–10. [Google Scholar]
- MatsubaraKetal, K. High-intelligibility speech synthesis for dysarthric speakers with LPCNet-based TTS and CycleVAE-based VC. In Proceedings of the IEEE International Conference on Acoustics, Speech and Signal Processing (ICASSP), Toronto, ON, Canada, 6–11 June 2021; pp. 7058–7062. [Google Scholar]


| Naturalness | Intelligibility | Speaker Similarity | |
|---|---|---|---|
| Source voice | 3.00 | 3.46 | 3.84 |
| StarGAN-VC | 1.71 | 2.08 | 2.23 |
| Auto-VC | 1.64 | 1.94 | 2.08 |
| CycleGAN-VC | 1.55 | 1.65 | 2.00 |
| VAE | 1.86 | 2.98 | 1.92 |
| CycleVAE | 2.06 | 2.70 | 2.82 |
| Duta-VC | 3.42 | 3.33 | 3.94 |
| Proposed method | 3.44 | 3.54 | 3.96 |
| Mild | Severe | Total | |
|---|---|---|---|
| StarGAN-VC | 0.697 | 0.751 | 0.724 |
| Auto-VC | 0.78 | 0.867 | 0.8235 |
| CycleGAN-VC | 0.781 | 0.83 | 0.8055 |
| VAE | 0.779 | 0.867 | 0.823 |
| CycleVAE | 0.612 | 0.695 | 0.6535 |
| Duta-VC | 0.527 | 0.554 | 0.5405 |
| Proposed Method | 0.507 | 0.548 | 0.5275 |
Disclaimer/Publisher’s Note: The statements, opinions and data contained in all publications are solely those of the individual author(s) and contributor(s) and not of MDPI and/or the editor(s). MDPI and/or the editor(s) disclaim responsibility for any injury to people or property resulting from any ideas, methods, instructions or products referred to in the content. |
© 2024 by the authors. Licensee MDPI, Basel, Switzerland. This article is an open access article distributed under the terms and conditions of the Creative Commons Attribution (CC BY) license (https://creativecommons.org/licenses/by/4.0/).
Share and Cite
Hsu, W.-S.; Lin, G.-T.; Wang, W.-H. Enhancing Dysarthric Voice Conversion with Fuzzy Expectation Maximization in Diffusion Models for Phoneme Prediction. Diagnostics 2024, 14, 2693. https://doi.org/10.3390/diagnostics14232693
Hsu W-S, Lin G-T, Wang W-H. Enhancing Dysarthric Voice Conversion with Fuzzy Expectation Maximization in Diffusion Models for Phoneme Prediction. Diagnostics. 2024; 14(23):2693. https://doi.org/10.3390/diagnostics14232693
Chicago/Turabian StyleHsu, Wen-Shin, Guang-Tao Lin, and Wei-Hsun Wang. 2024. "Enhancing Dysarthric Voice Conversion with Fuzzy Expectation Maximization in Diffusion Models for Phoneme Prediction" Diagnostics 14, no. 23: 2693. https://doi.org/10.3390/diagnostics14232693
APA StyleHsu, W.-S., Lin, G.-T., & Wang, W.-H. (2024). Enhancing Dysarthric Voice Conversion with Fuzzy Expectation Maximization in Diffusion Models for Phoneme Prediction. Diagnostics, 14(23), 2693. https://doi.org/10.3390/diagnostics14232693