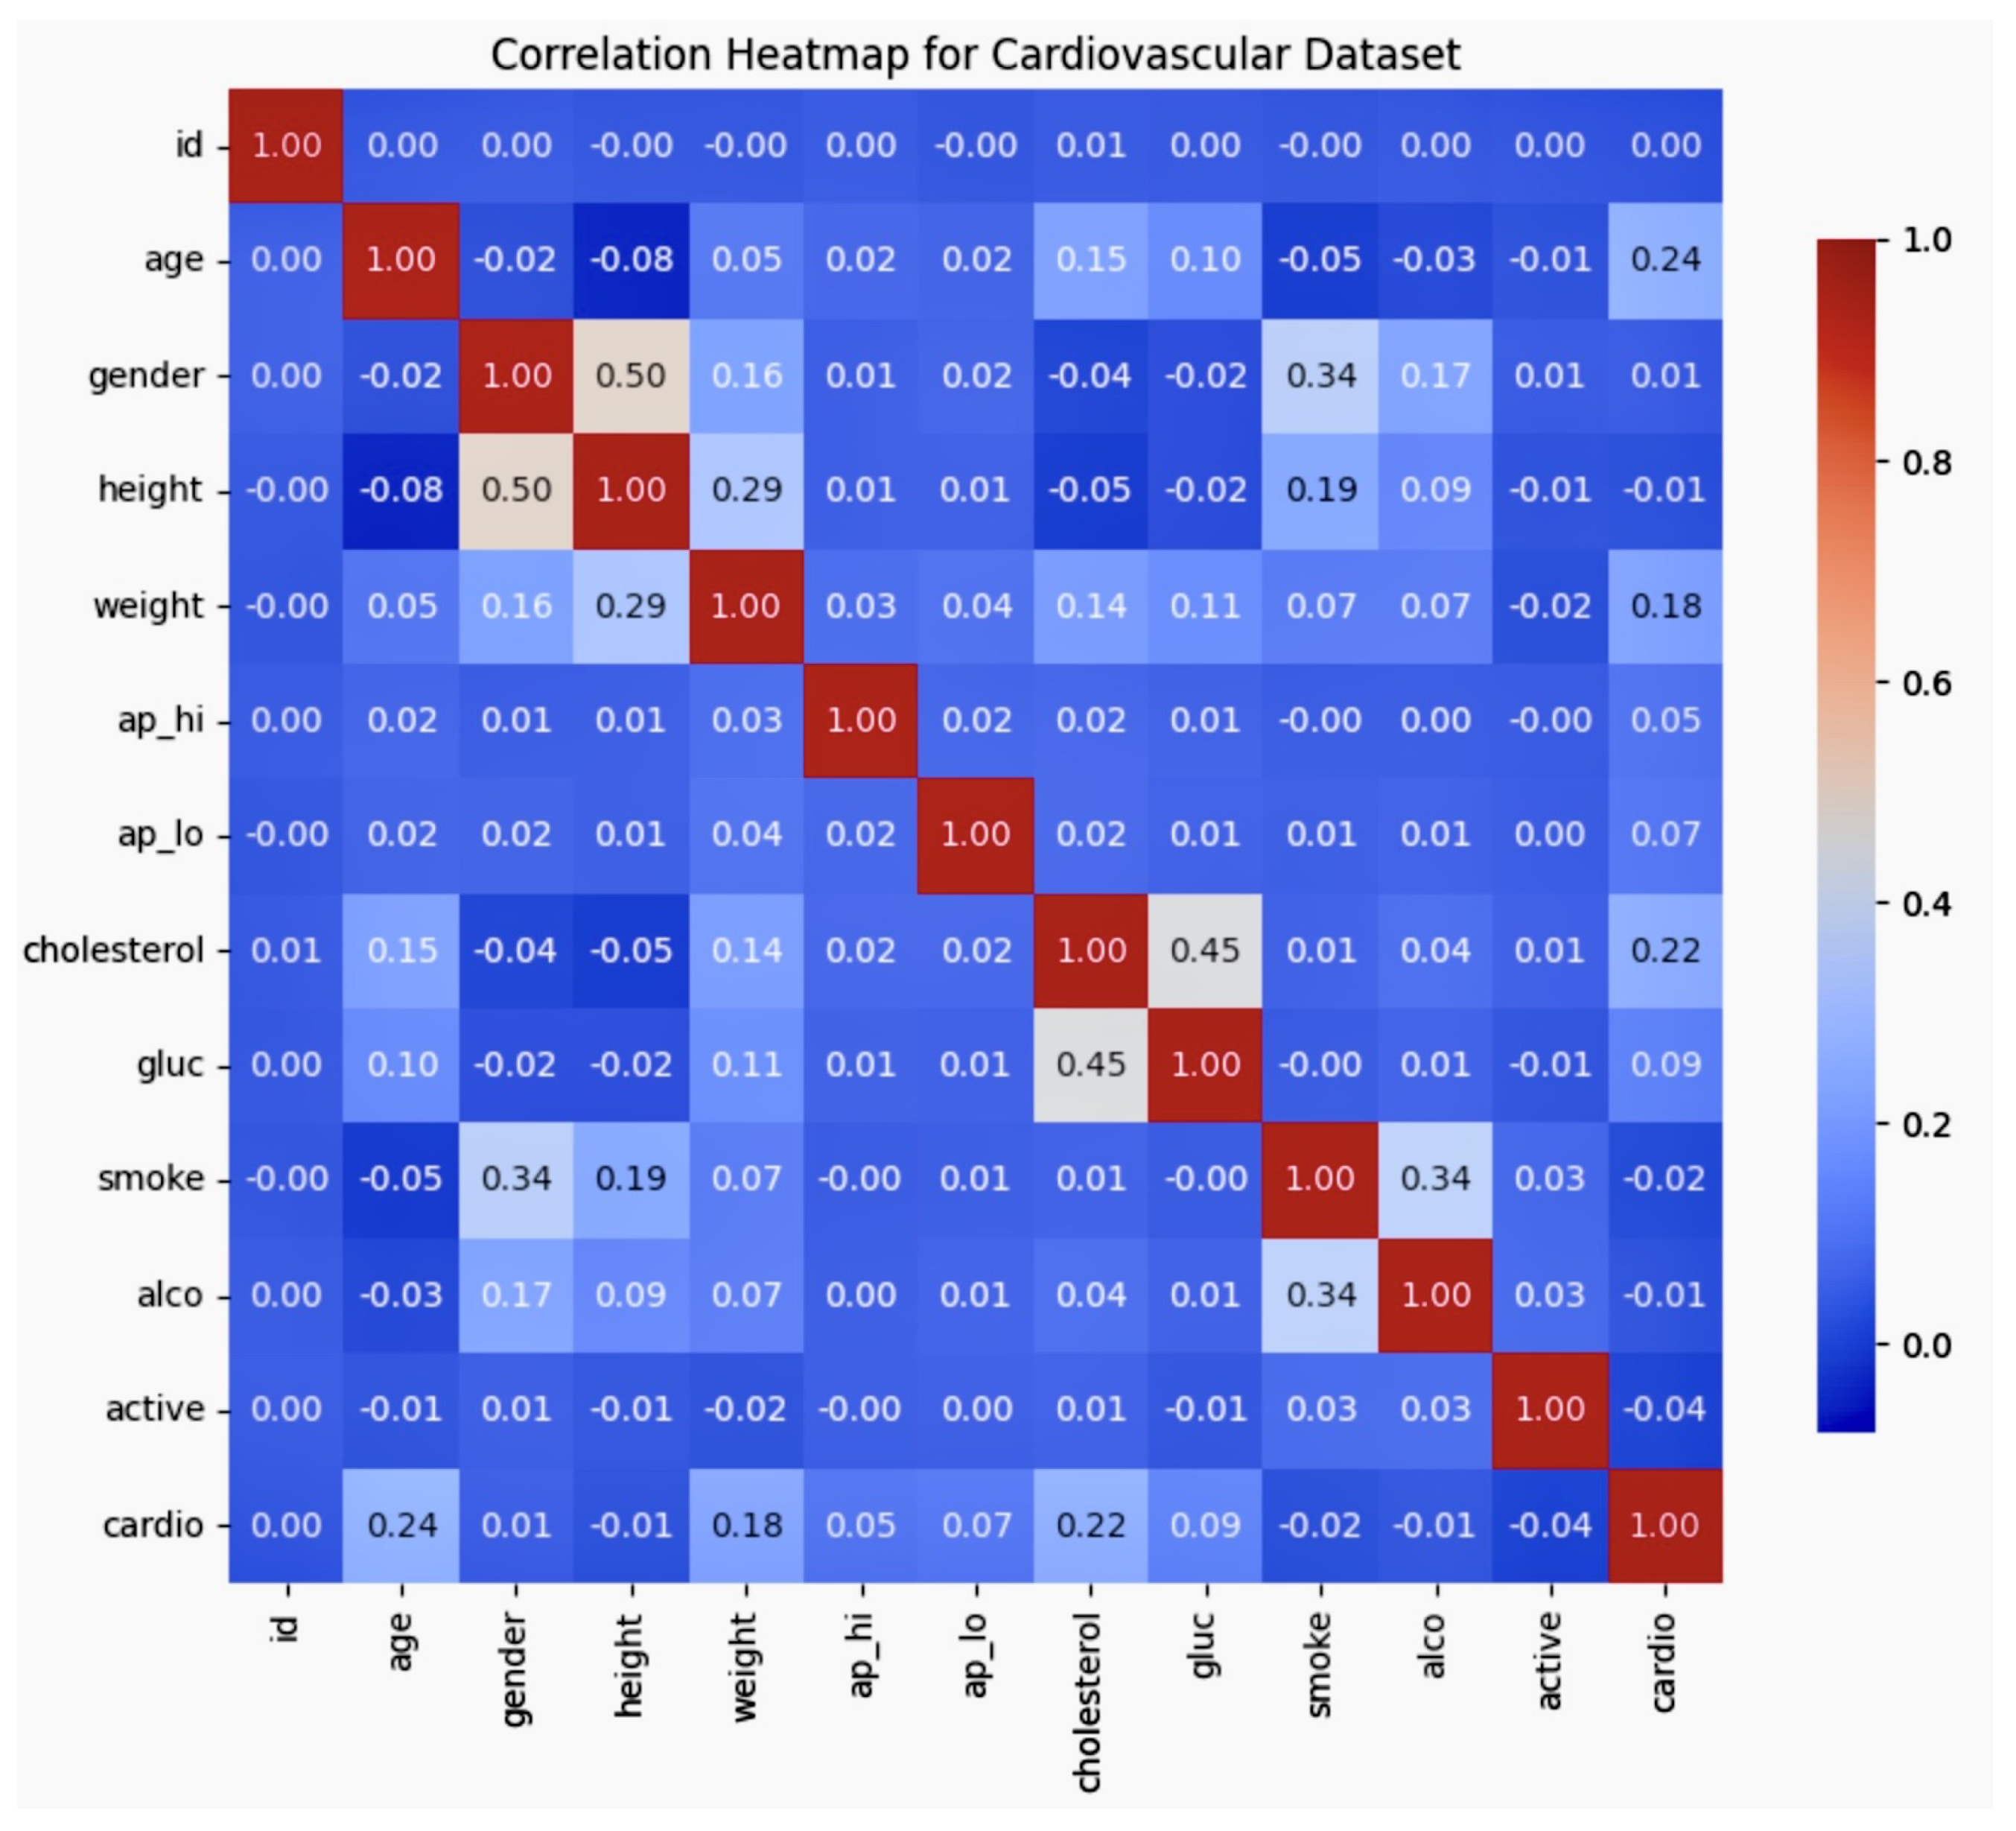
Figure 1.
The correlation matrix figure shows the correlation matrix, which highlights the relationships between key variables in the dataset, such as age, gender, smoking, cholesterol, and cardiovascular disease. Notably, age was found to be positively correlated with cholesterol and cardiovascular disease, while smoking showed a weaker correlation with cardiovascular disease. These insights reveal the interdependencies of demographic and health-related factors, which are essential for refining bias mitigation strategies in AI-driven cardiovascular models.
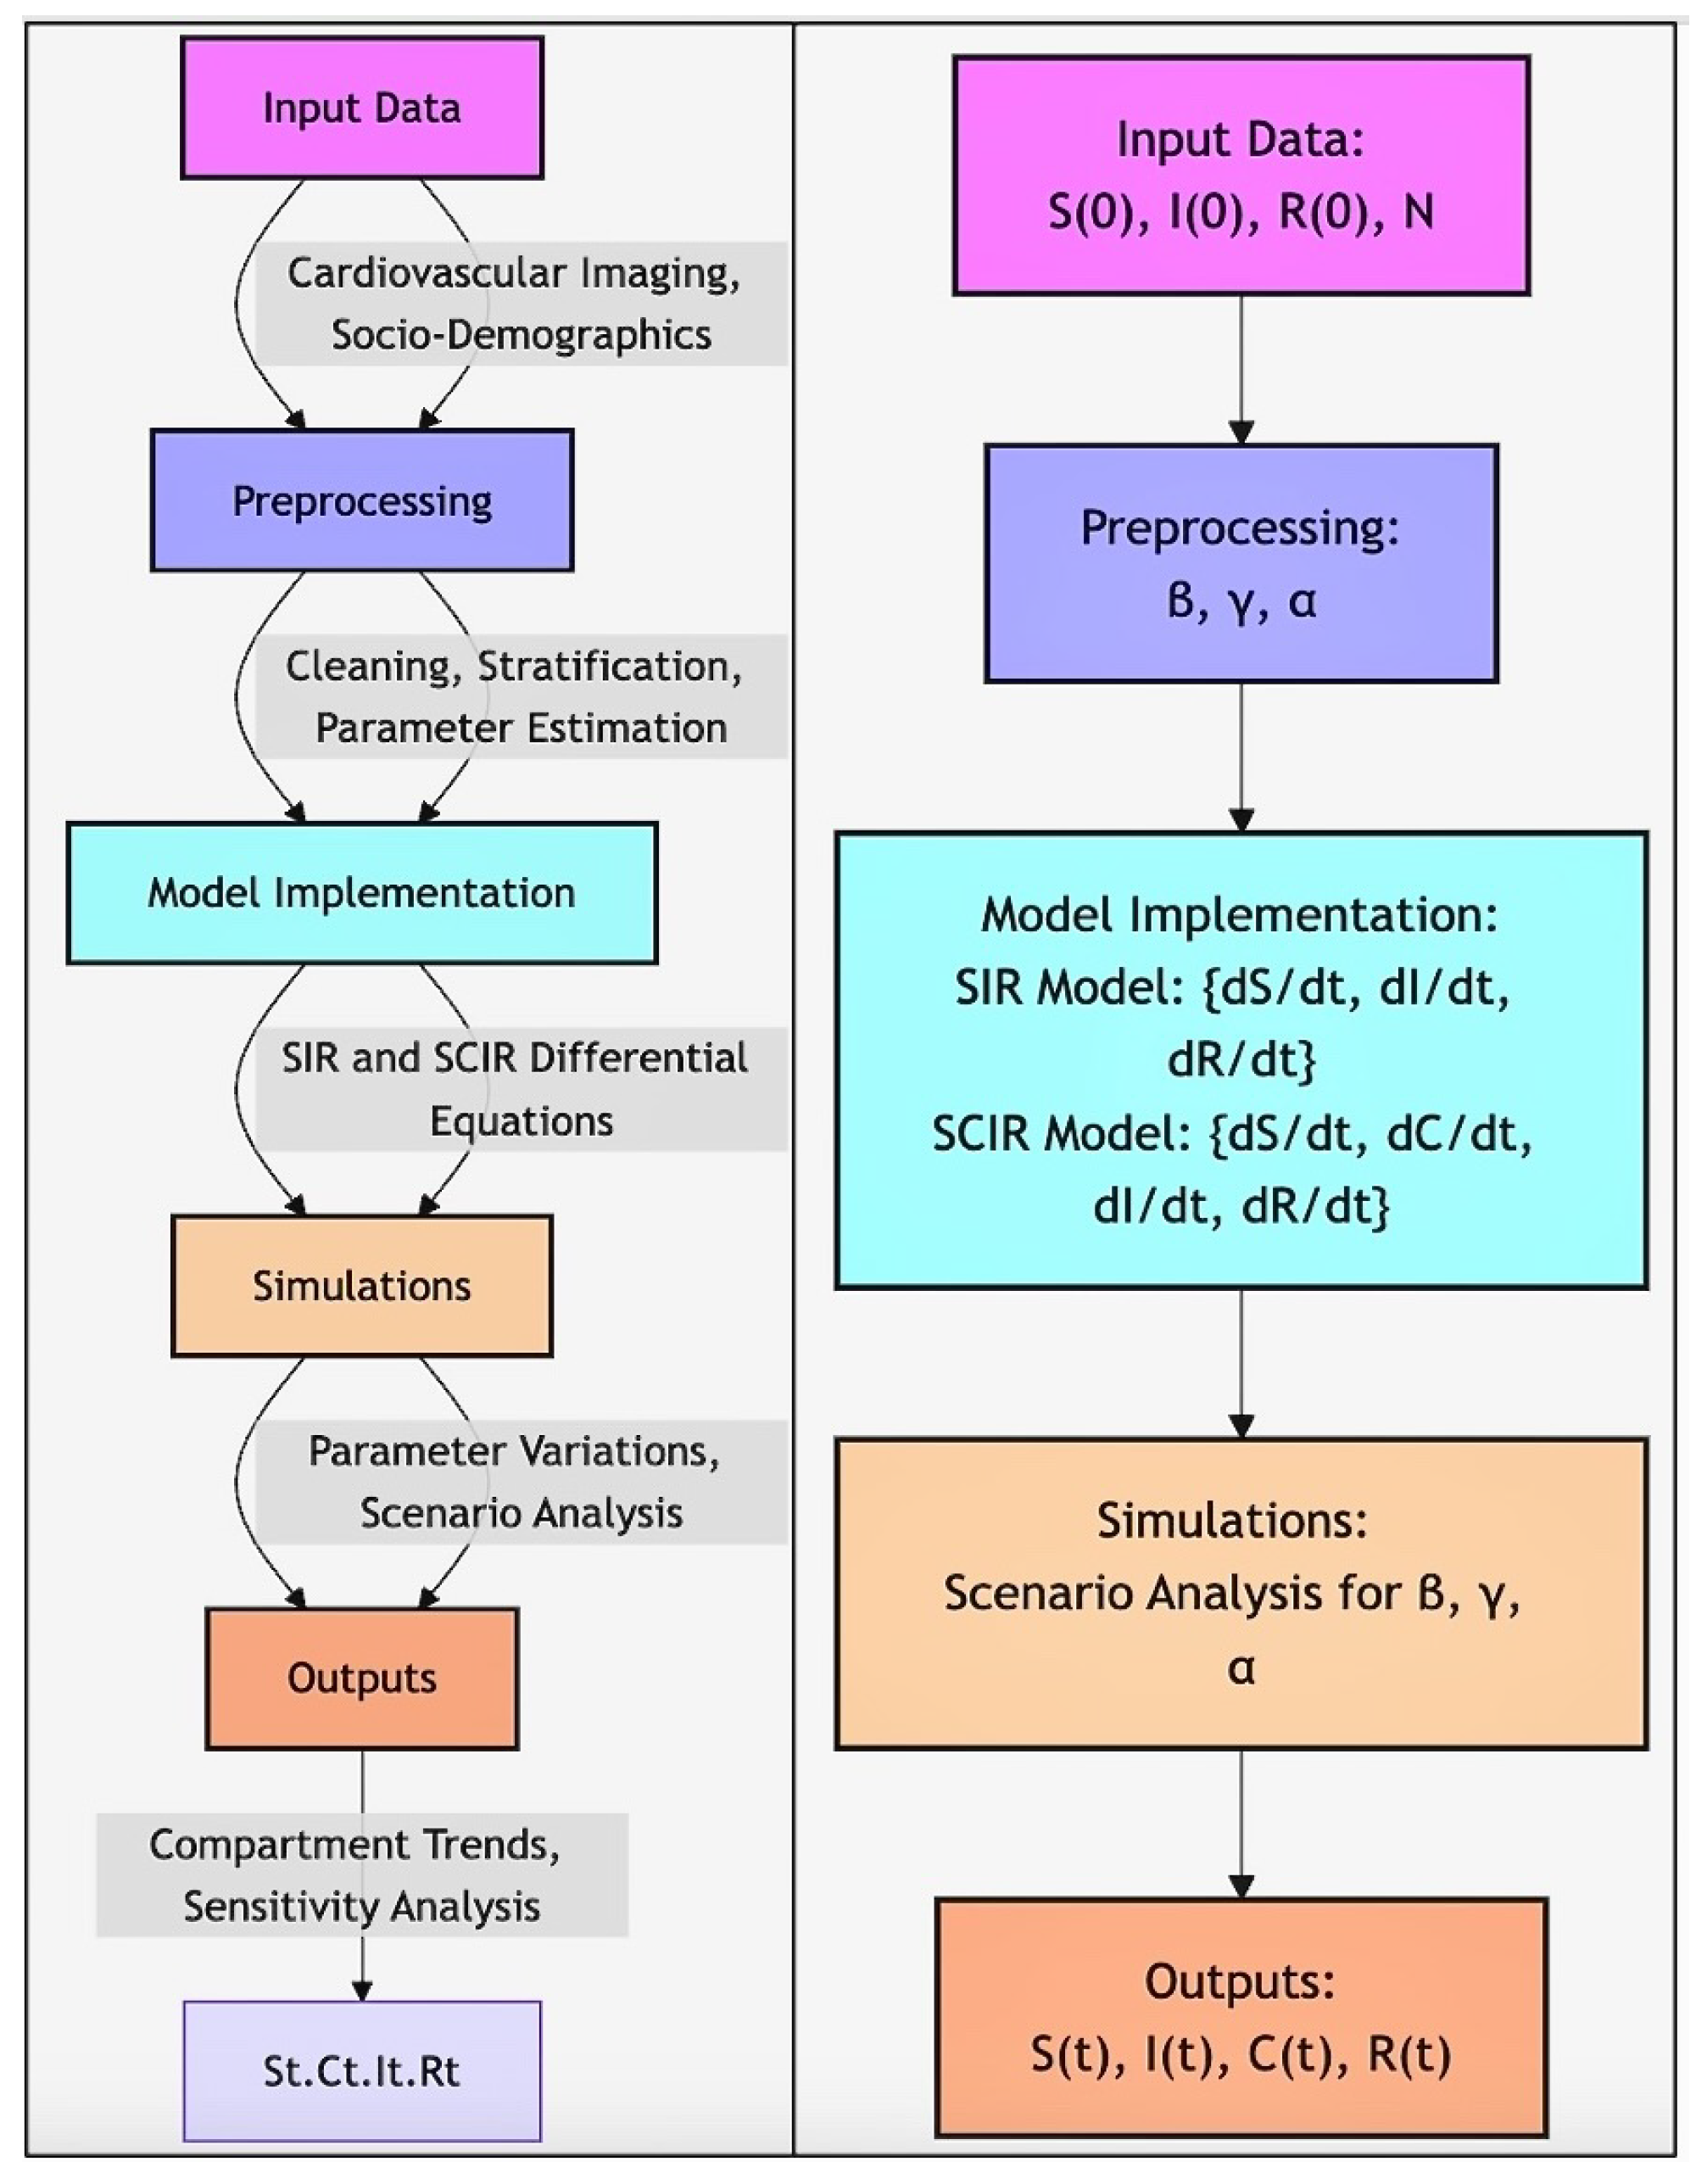
Figure 2.
Workflow of SIR and SCIR Model Implementation. The workflow illustrates the step-by-step process for applying the SIR and SCIR models in the study. Input data, including cardiovascular imaging and socio-demographic factors, undergoes preprocessing to estimate key parameters (). Differential equations for the SIR () and SCIR () models are implemented and solved numerically. Simulations explore parameter variations and scenario analyses, producing outputs () for sensitivity analysis and compartment trends.
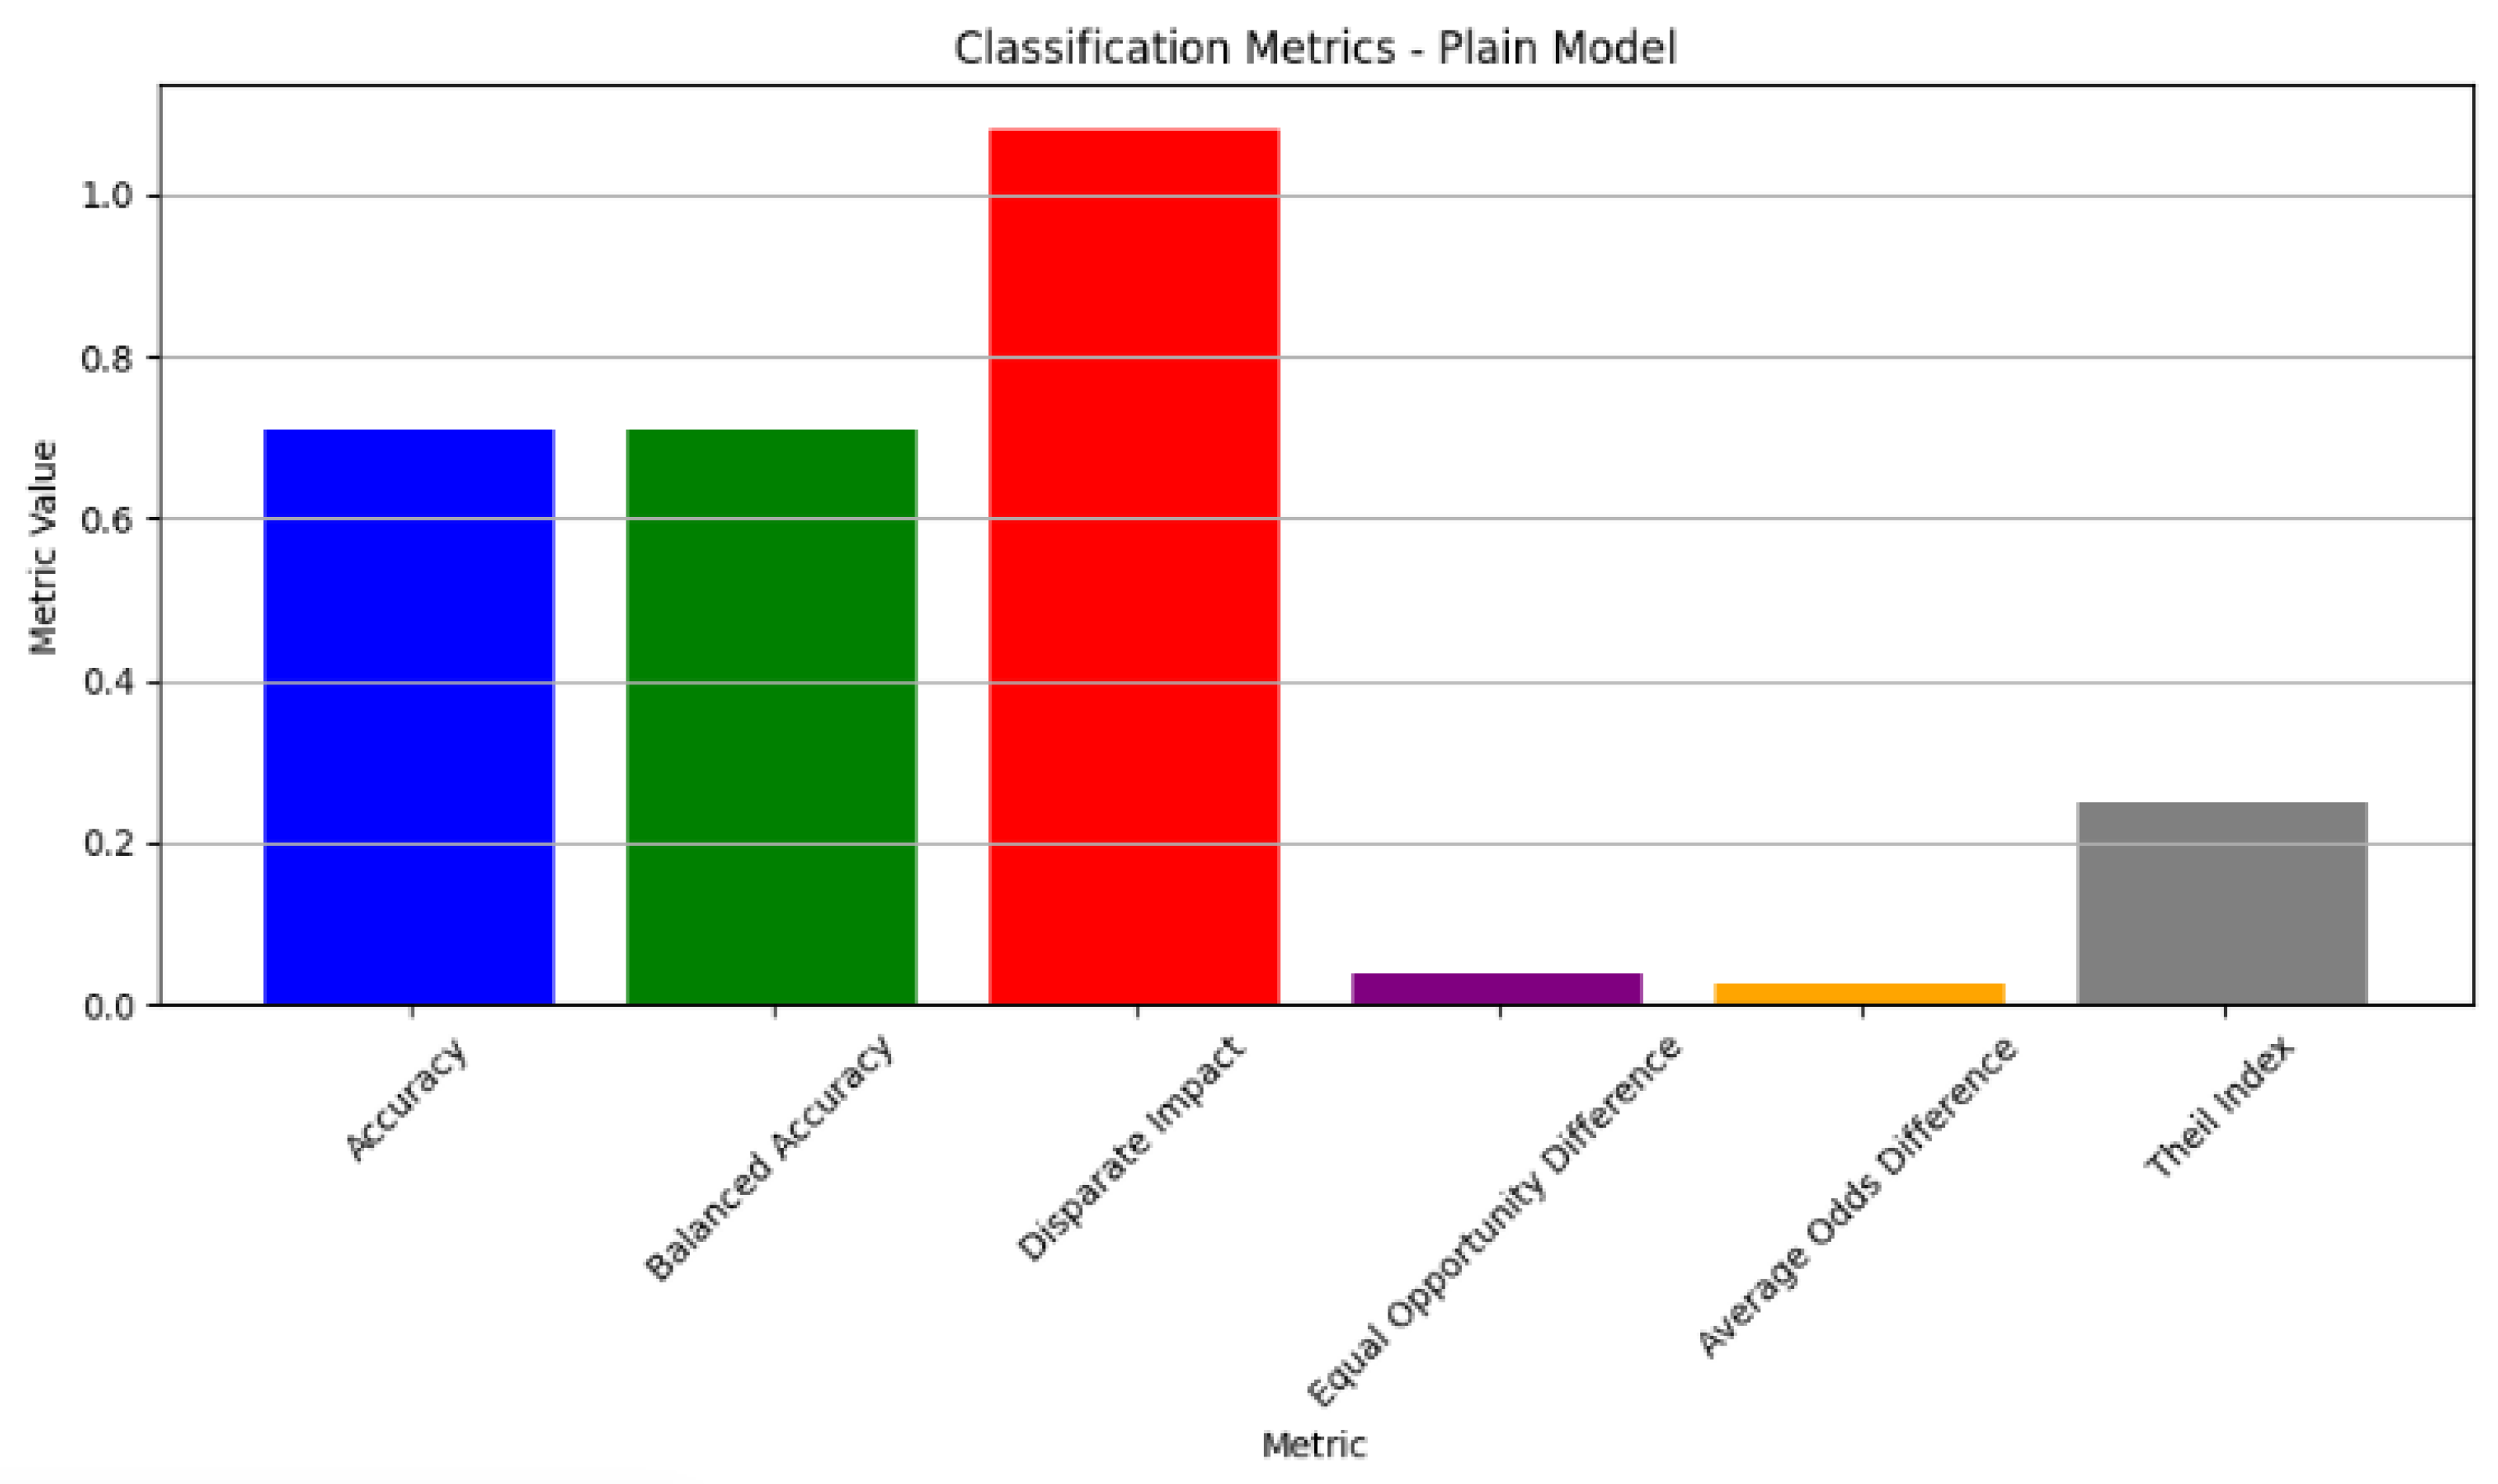
Figure 3.
The classification metrics for the plain model exhibited an accuracy of 70.85%, with fairness assessments showing a disparate impact of 1.08 and an equal opportunity difference of 0.037. These results suggest potential demographic biases in the model’s predictions, emphasising the need for further bias mitigation to ensure both accuracy and fairness across different population groups.
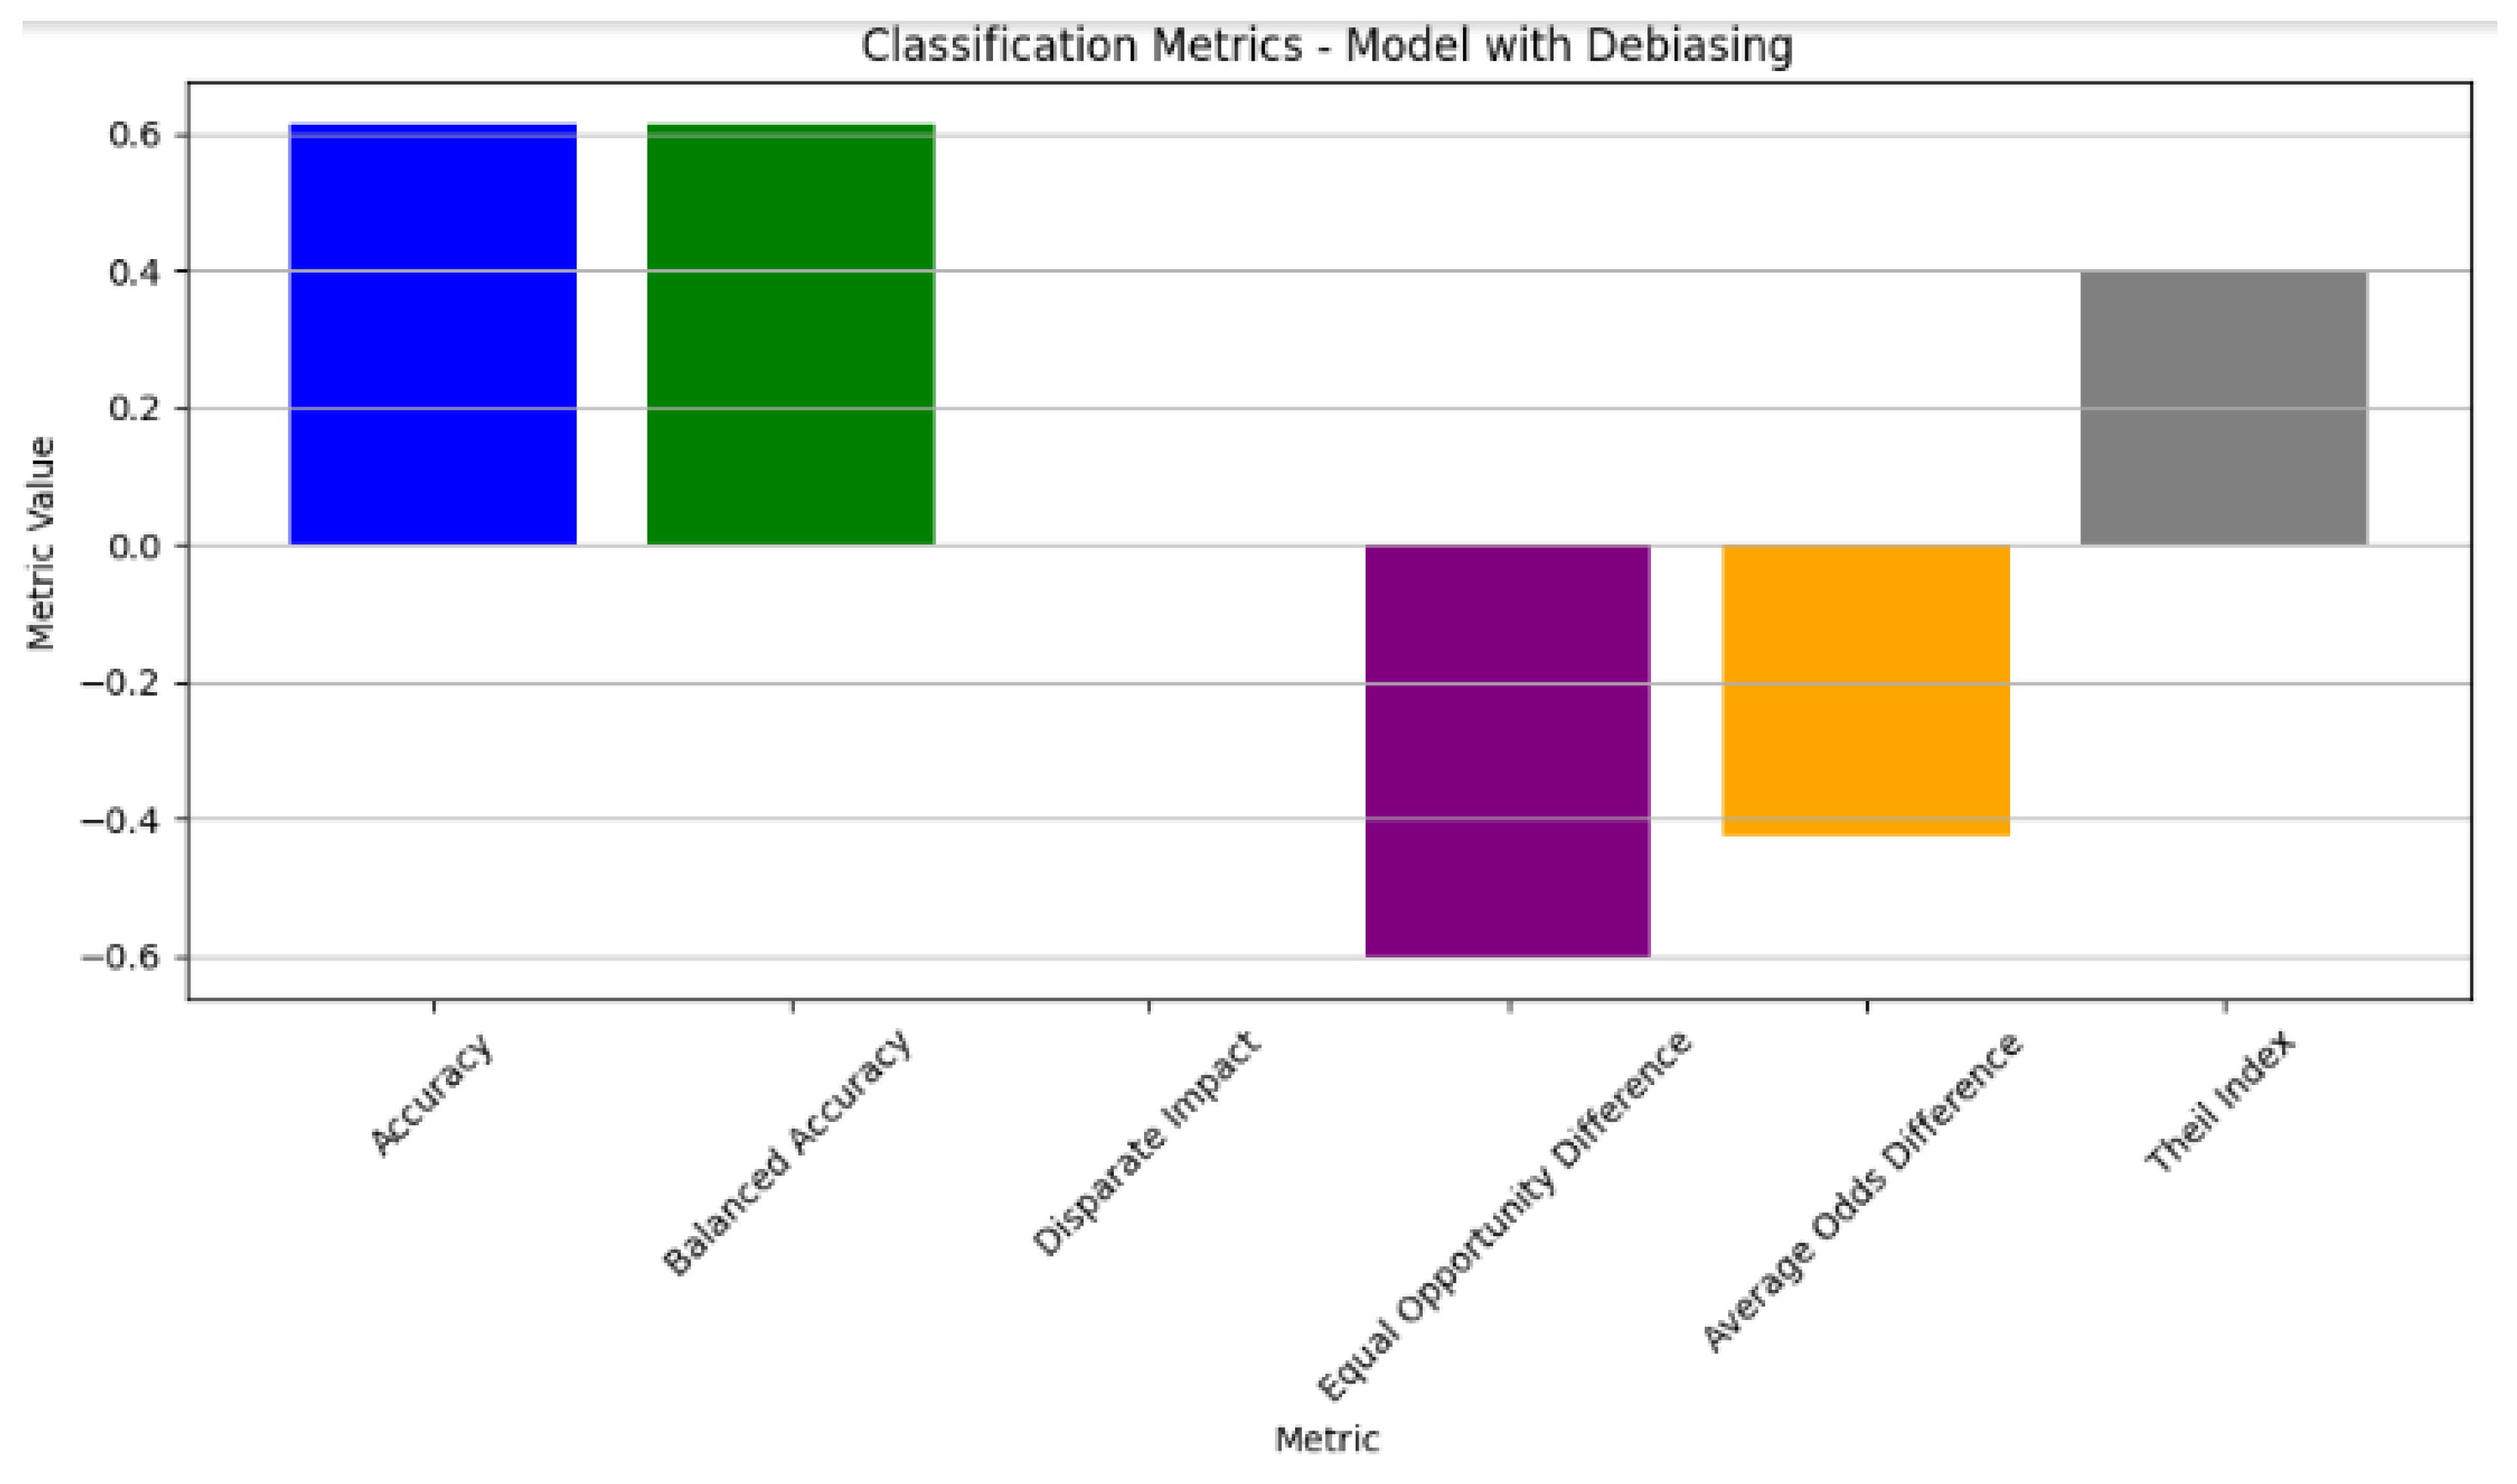
Figure 4.
The classification metrics of the model with debiasing. The model exhibited a balanced accuracy at 0.5. Notable improvements in fairness metrics include a reduction in the disparate impact and equal opportunity difference, with values of −0.5 and −0.3, respectively, indicating a decrease in the biased predictions. The average odds difference showed a slight improvement with a value of −0.2. Additionally, the Theil index at 0.4 reflects the improved fairness in the model outcomes post-debiasing.
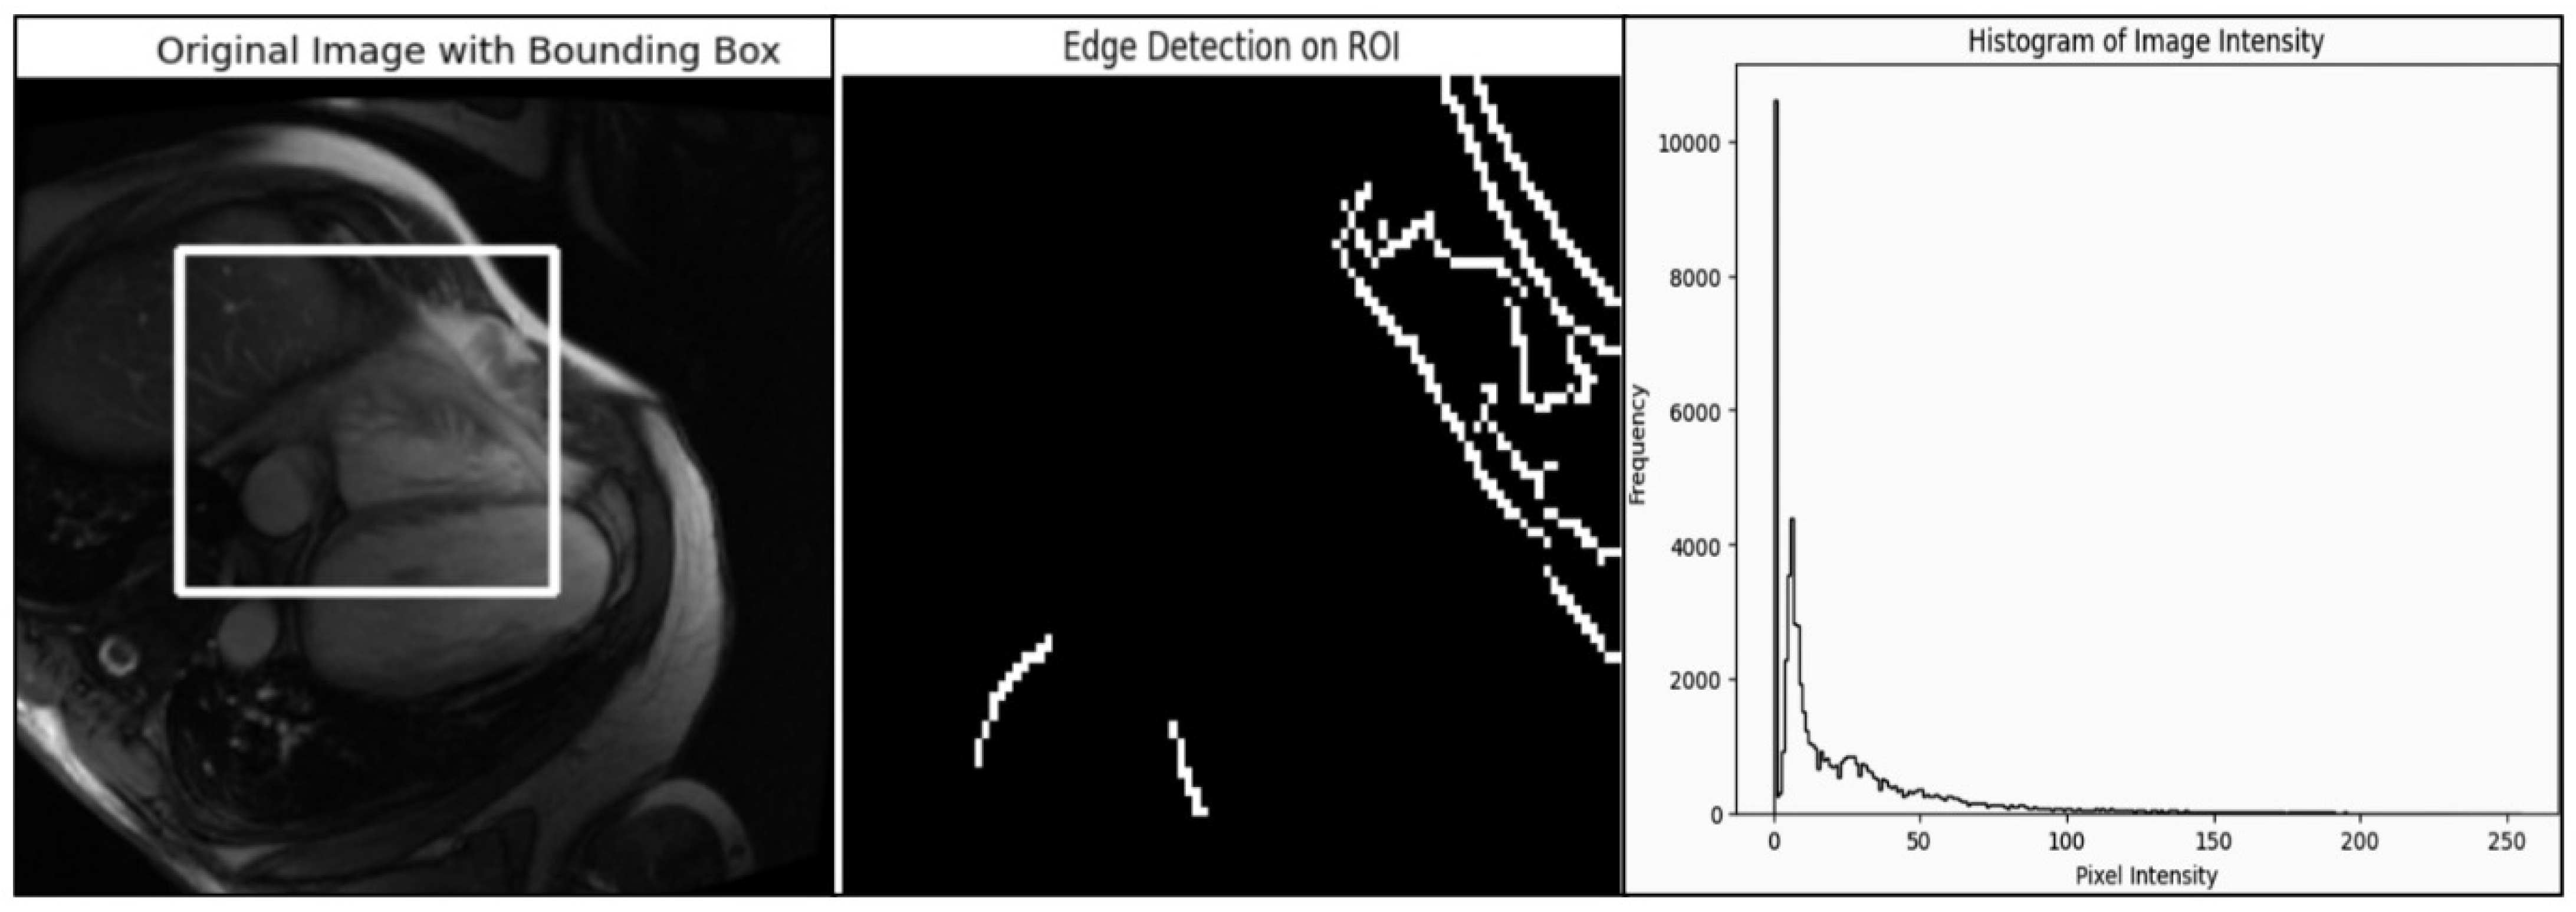
Figure 5.
Analysis of medical images using bounding box, edge detection, and intensity histograms. The left panel displays the original medical image with a bounding box indicating the region of interest (ROI) for analysis. The central panel shows the results of the edge detection when applied within the ROI, highlighting the structural edges and boundaries in the image. The right panel presents a histogram of the pixel intensity values across the entire image, revealing the distribution of brightness levels. This rule-based approach, using edge detection and intensity analysis, provides insight into the image’s structure and intensity distribution but lacks the adaptability of deep learning methods for handling complex anatomical variations.
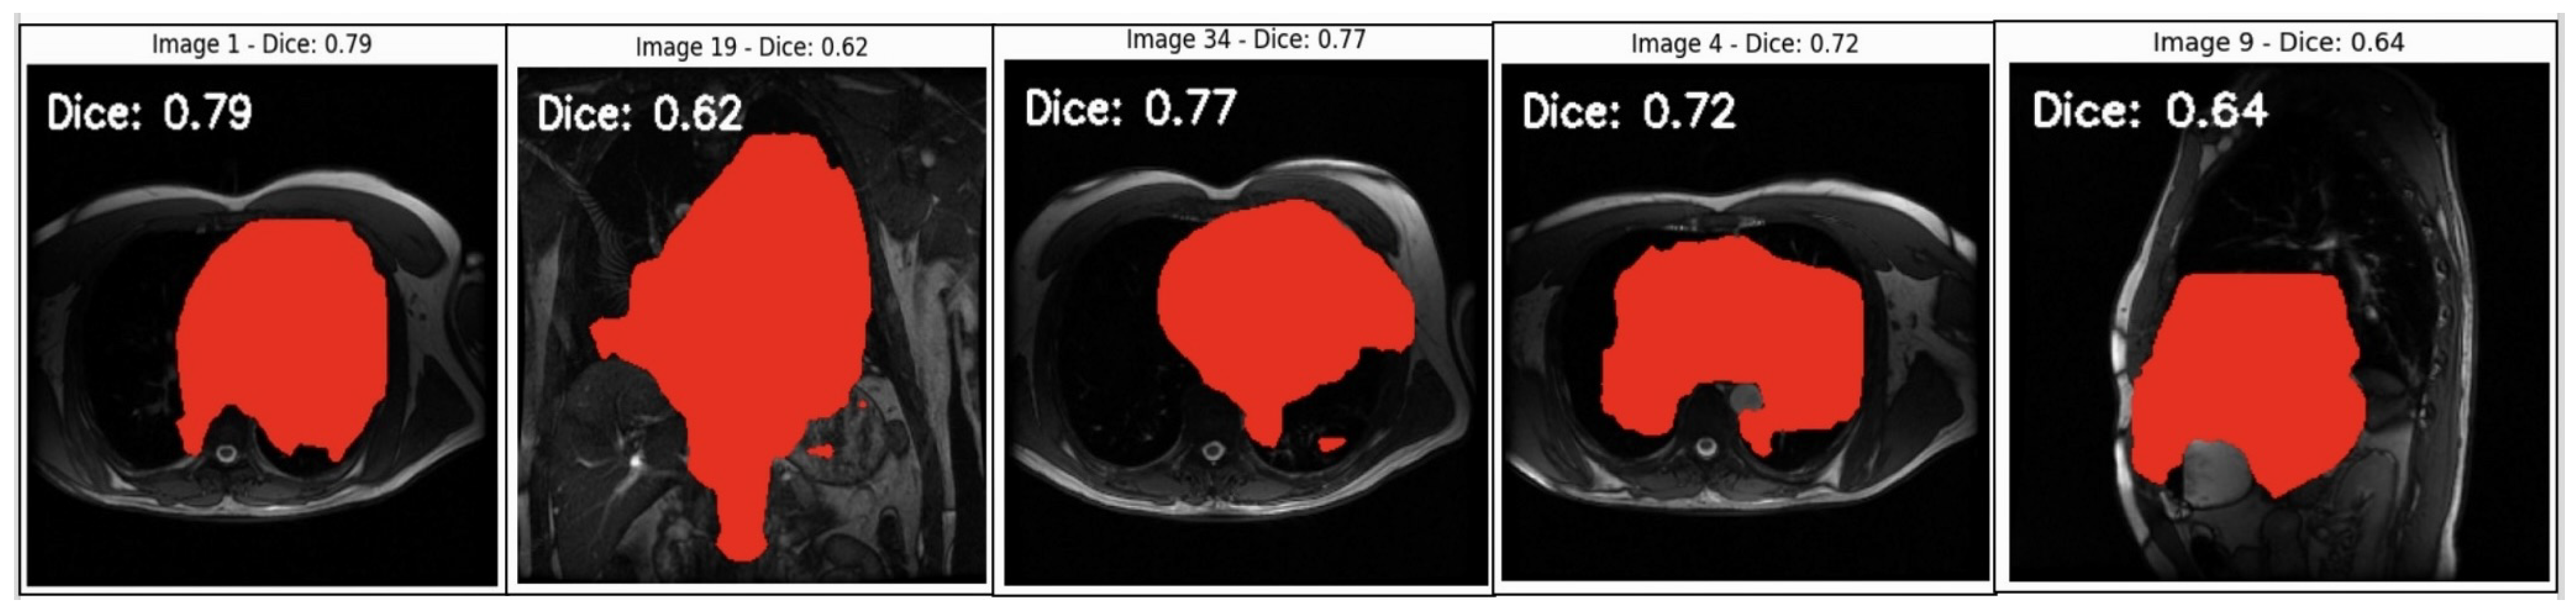
Figure 6.
Segmentation analysis of cardiovascular structures in MRI scans. This figure displays sample MRI images with predicted segmentation masks overlaid in red alongside Dice coefficient scores, indicating segmentation accuracy. Images with higher Dice scores (0.77–0.79) show better overlap with the ground truth, reflecting the model’s ability to accurately capture the target structures. Moderate Dice scores (0.62–0.72) highlight areas where the model faces challenges, which could possibly be due to anatomical complexity or image quality variations. Lower scores (e.g., Dice = 0.64 in Image 9) suggest areas for improvement to address potential biases and enhance model generalisability. This analysis provides insights into the model’s current limitations and the need for refinement to ensure fair and consistent diagnostic accuracy across diverse cases.
Figure 7.
Heart images showing regions of interest in specific areas, outlined with marked bounding boxes, which were used for annotation tasks. These regions were utilised by the model for identifying cardiovascular conditions based on anatomical features, thus aiding in the detection of heart abnormalities.
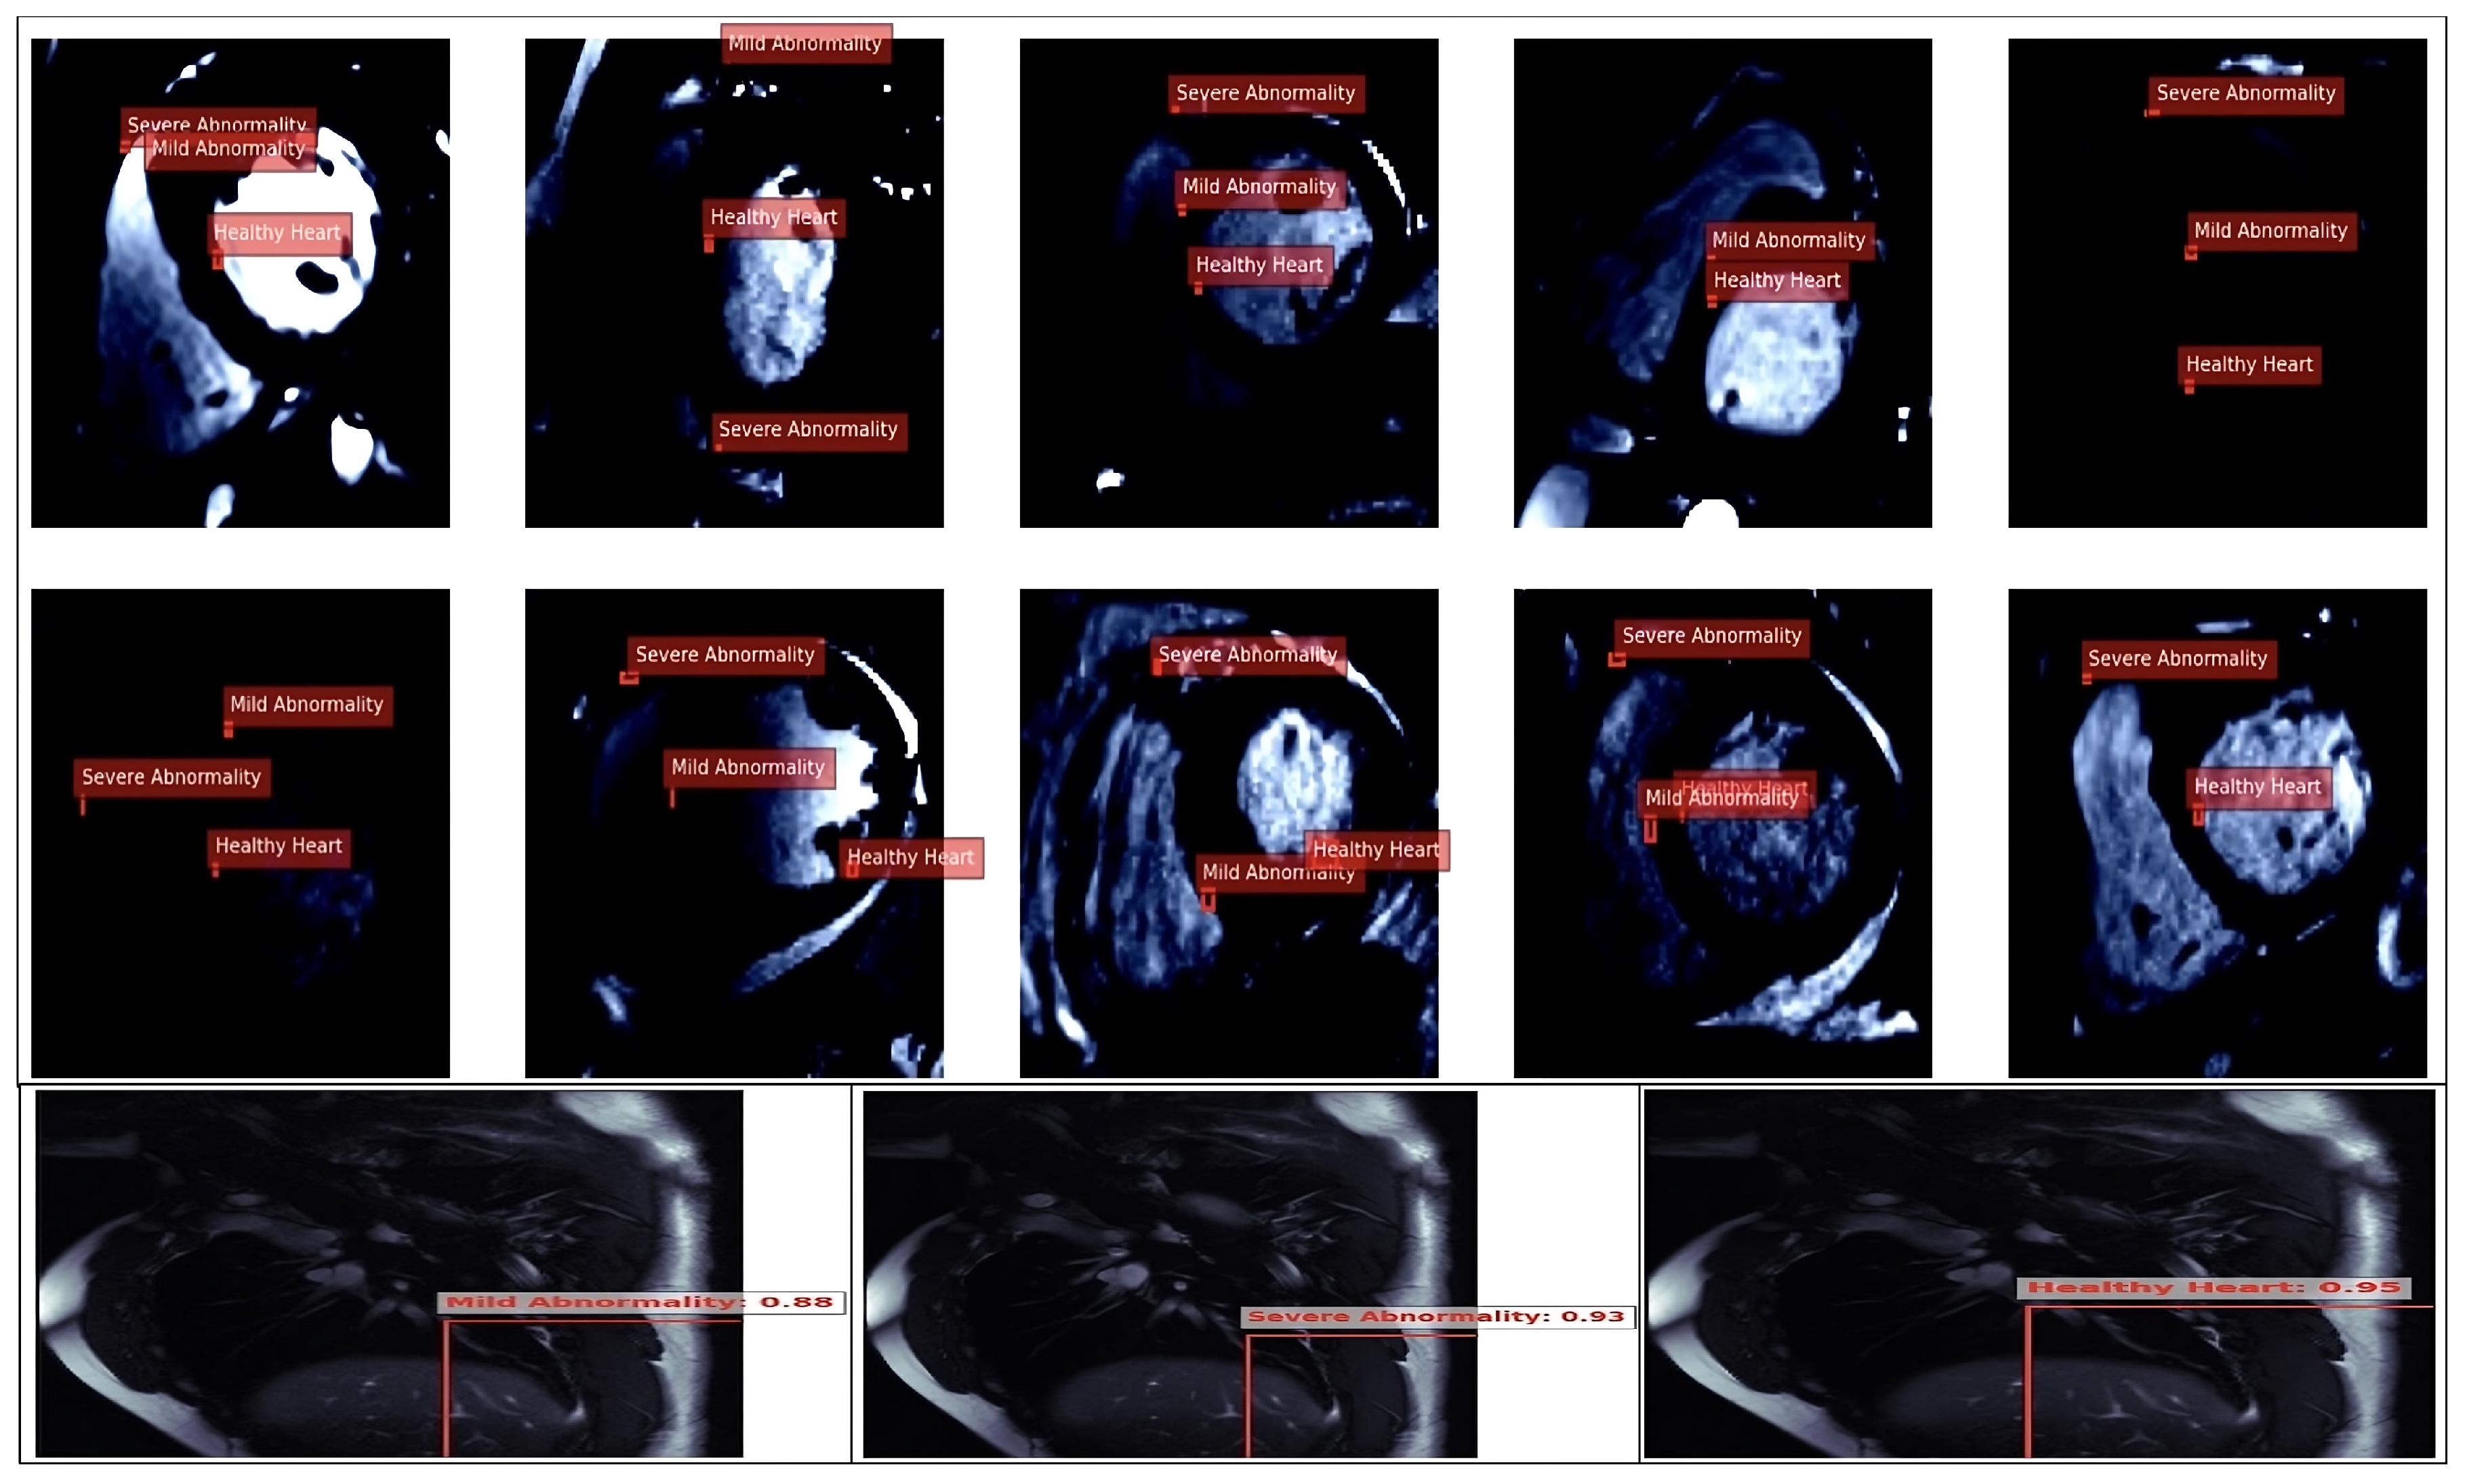
Figure 8.
Heart images highlighting the region with a clear class identified, used for model classification, and an analysis of the cardiovascular conditions based on anatomical structures in the cardiac area.
Figure 8.
Heart images highlighting the region with a clear class identified, used for model classification, and an analysis of the cardiovascular conditions based on anatomical structures in the cardiac area.
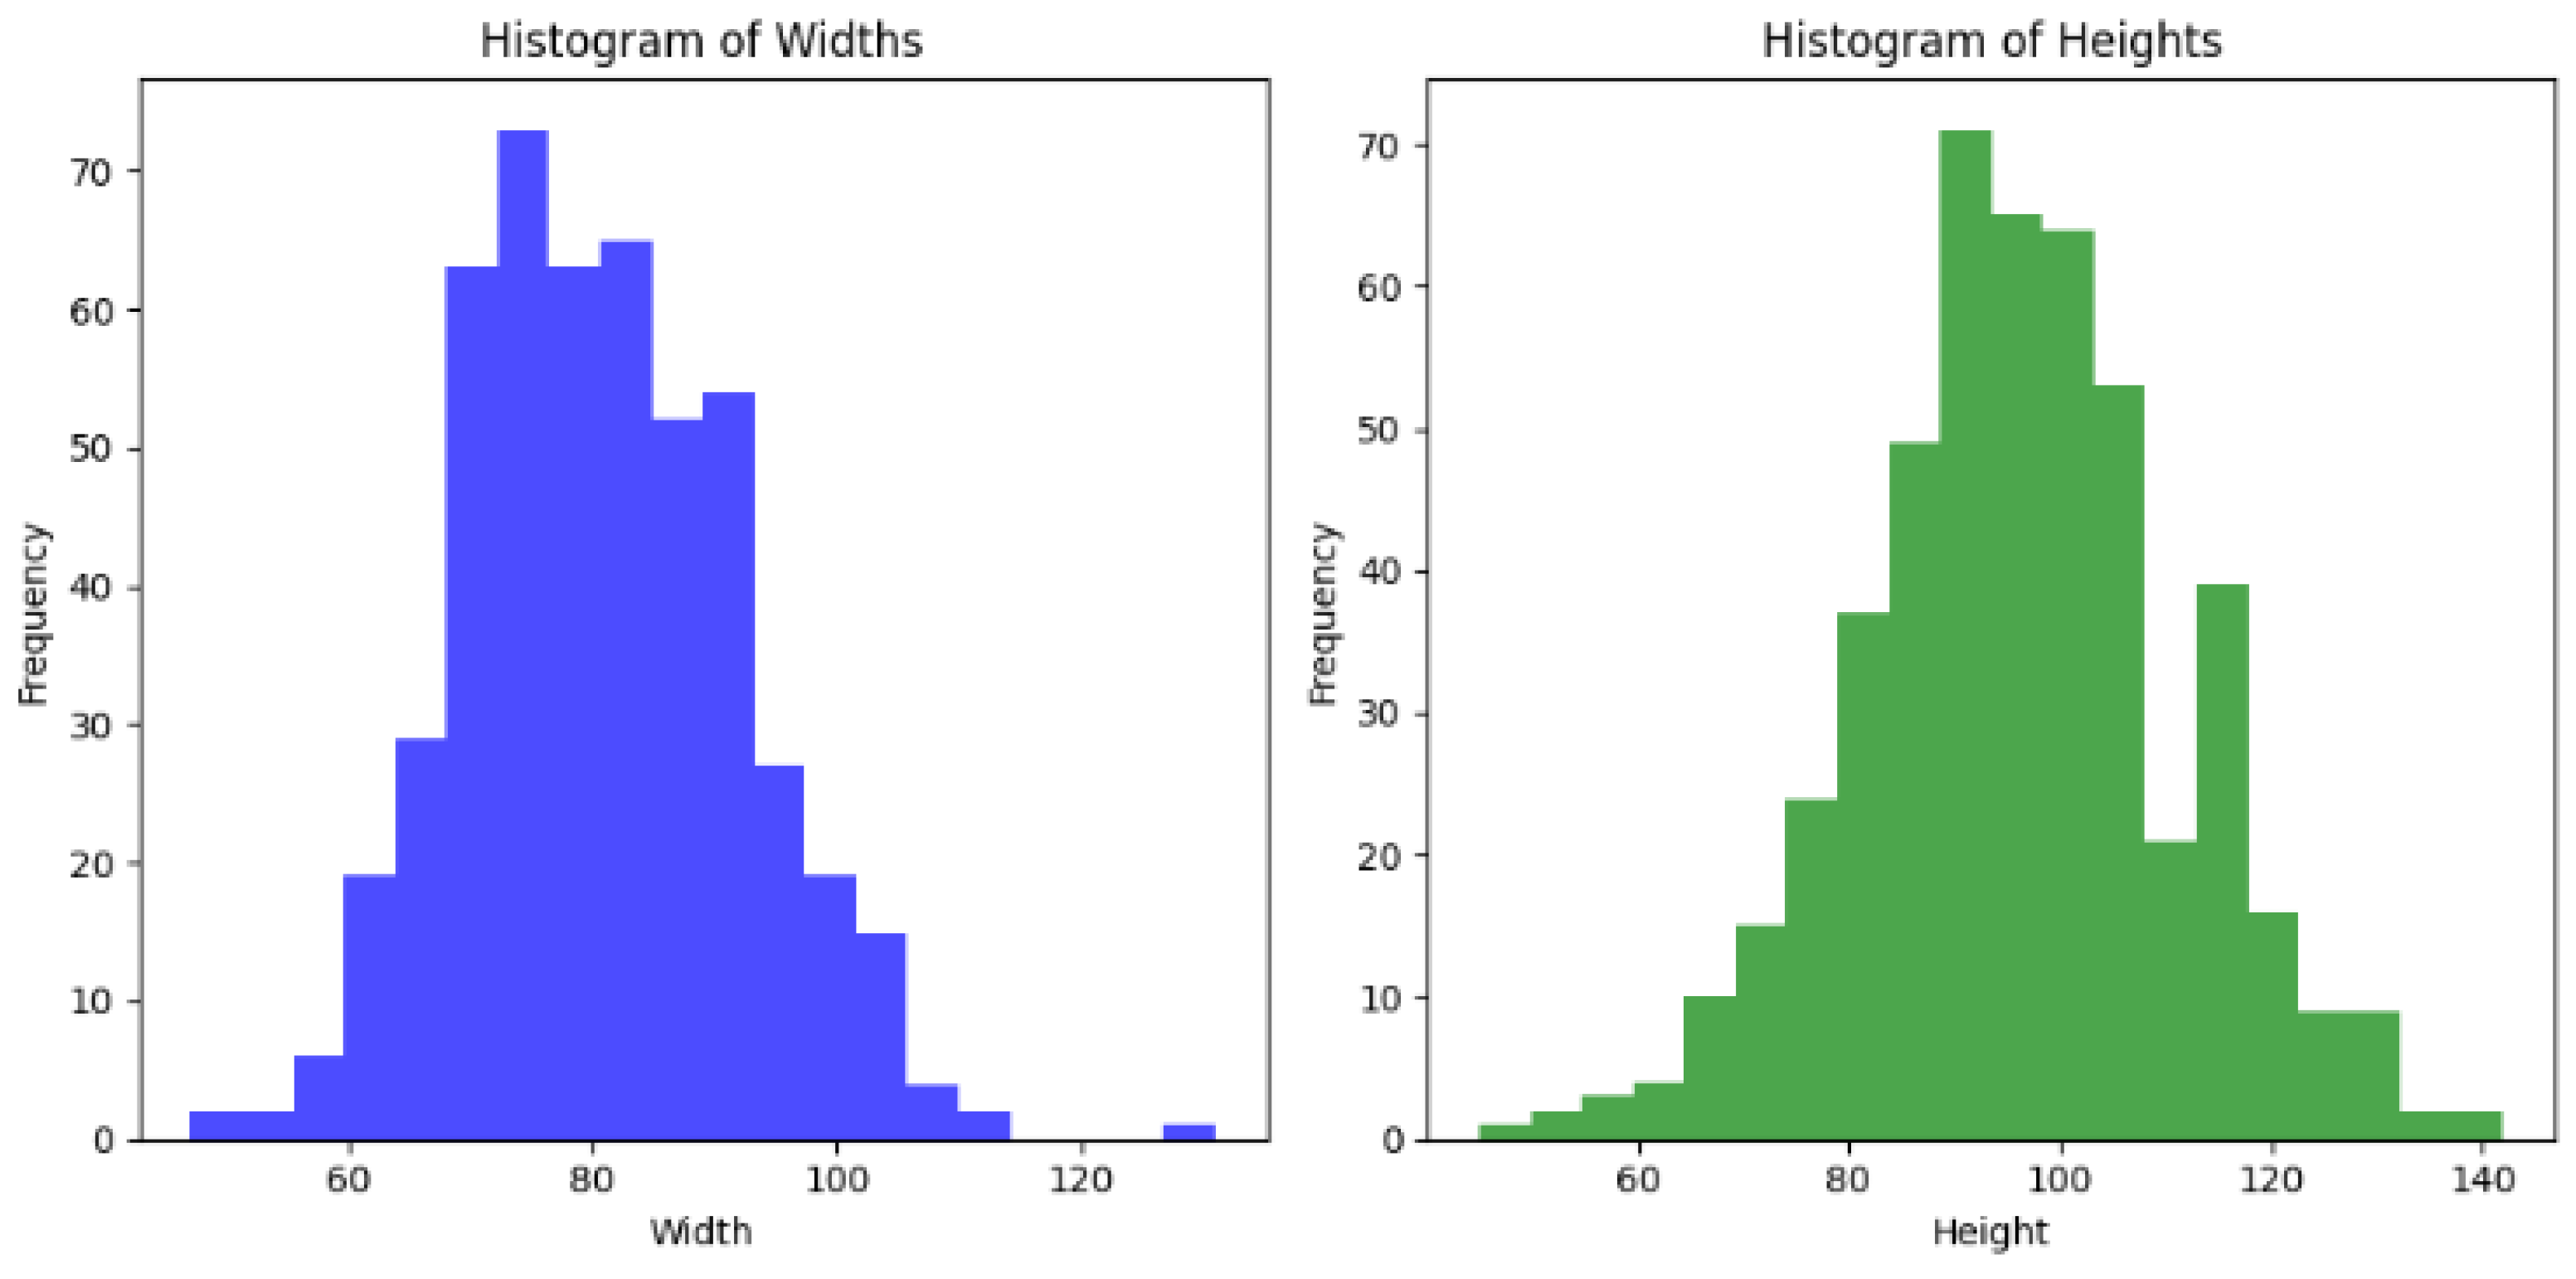
Figure 9.
Heart image classification histograms illustrating the distribution of widths and heights for heart image classifications, thereby showing the frequency of measurements used in cardiovascular model analysis.
Figure 9.
Heart image classification histograms illustrating the distribution of widths and heights for heart image classifications, thereby showing the frequency of measurements used in cardiovascular model analysis.
Figure 10.
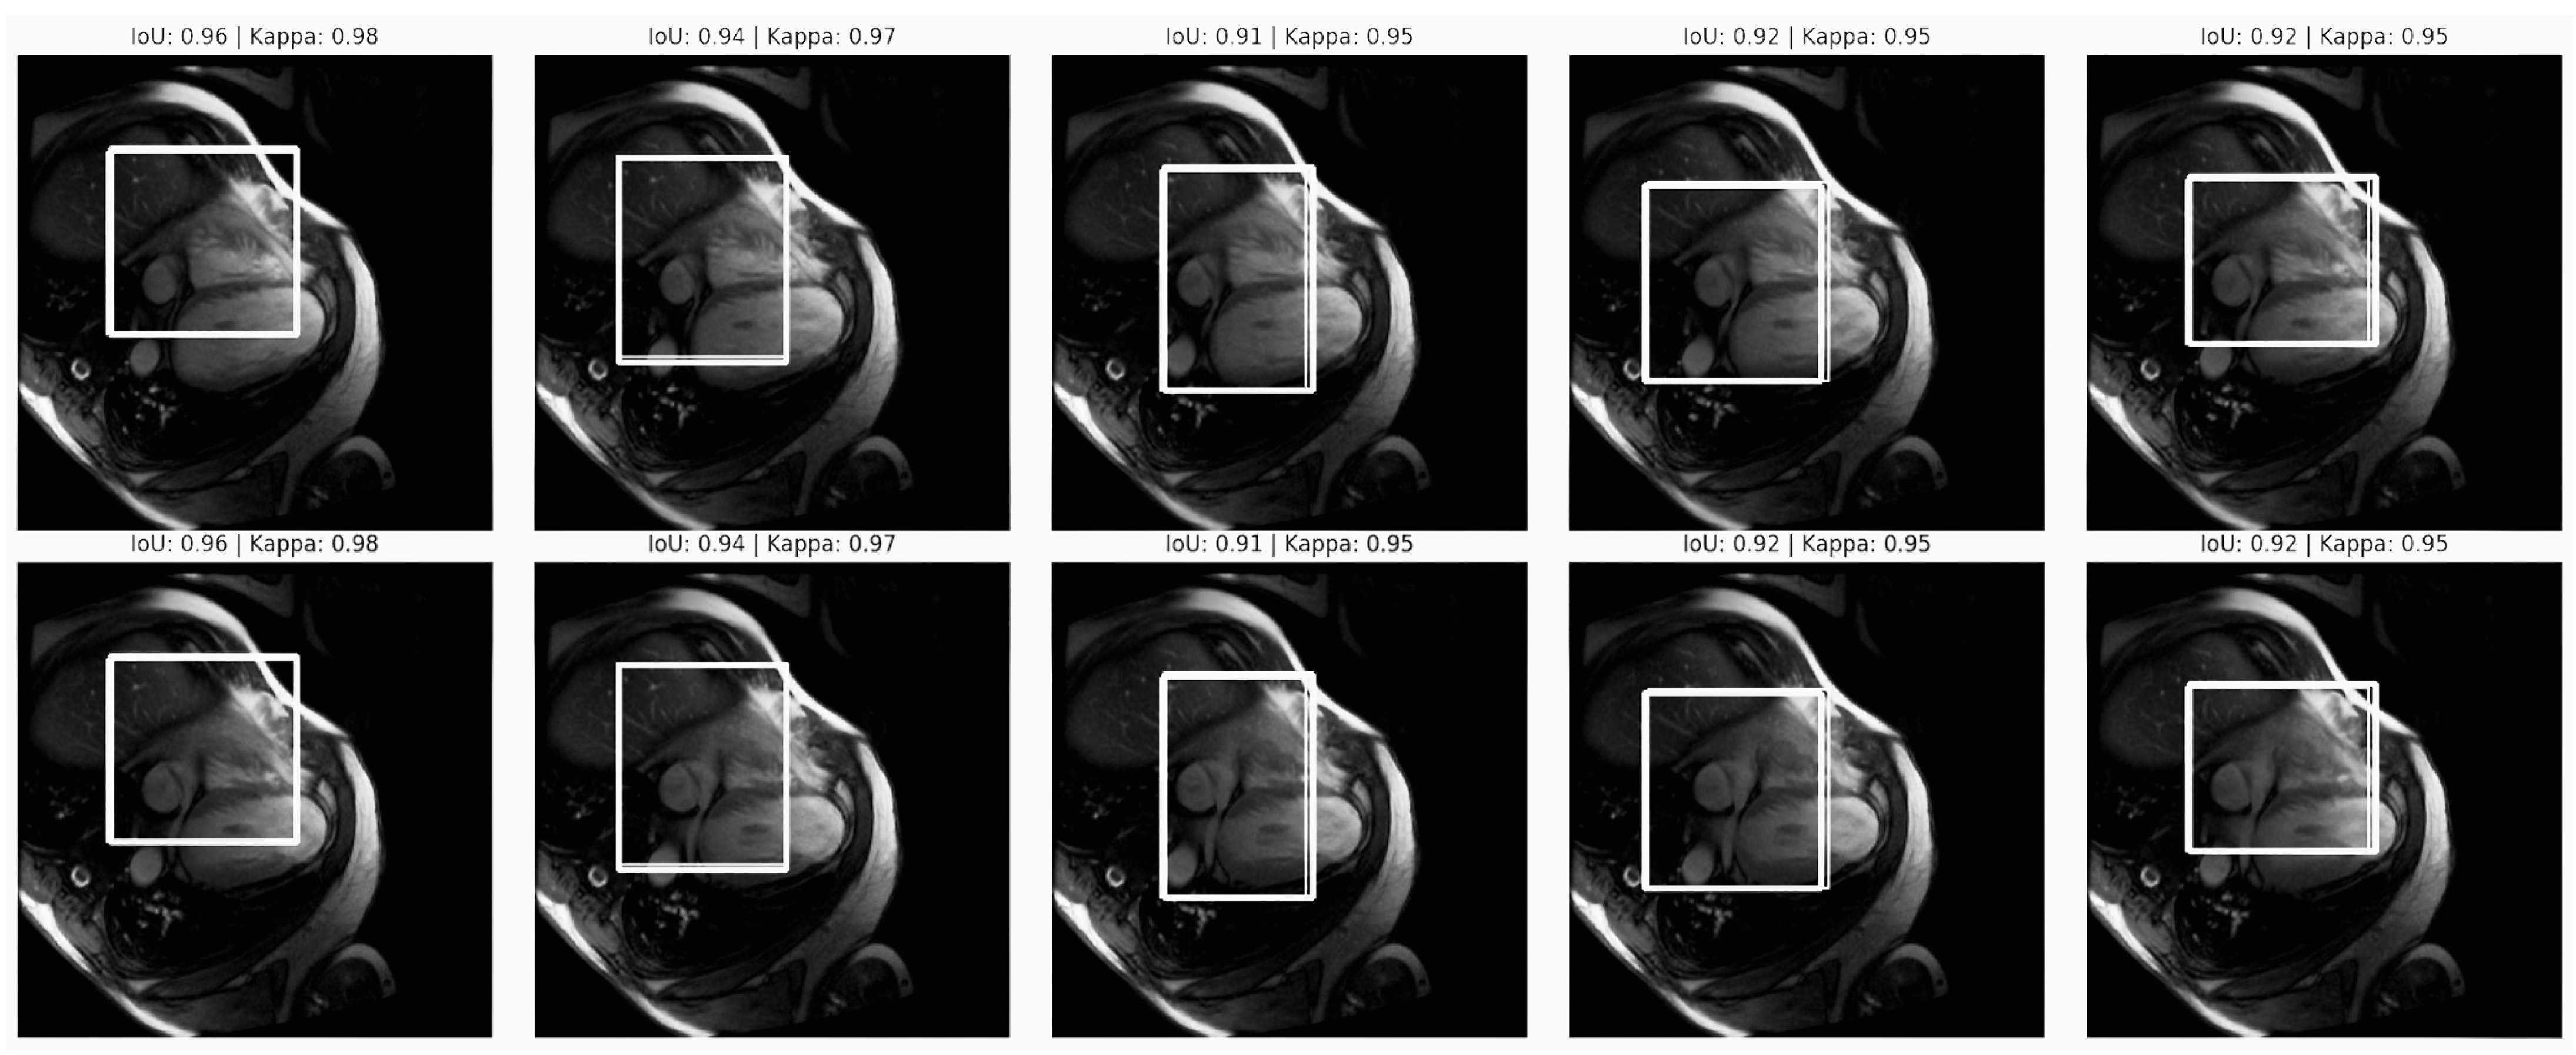
Segmentation accuracy in the cardiovascular MRI scans. The figure displays MRI scans with IoU scores between 0.91 and 0.96, indicating high overlap between the predicted and ground truth segmentation, as well as Kappa scores that were consistently at 0.95, reflecting strong model reliability. These metrics demonstrate precise and consistent segmentation, which is essential for unbiased cardiovascular diagnostics.
Figure 10.
Segmentation accuracy in the cardiovascular MRI scans. The figure displays MRI scans with IoU scores between 0.91 and 0.96, indicating high overlap between the predicted and ground truth segmentation, as well as Kappa scores that were consistently at 0.95, reflecting strong model reliability. These metrics demonstrate precise and consistent segmentation, which is essential for unbiased cardiovascular diagnostics.
Figure 11.
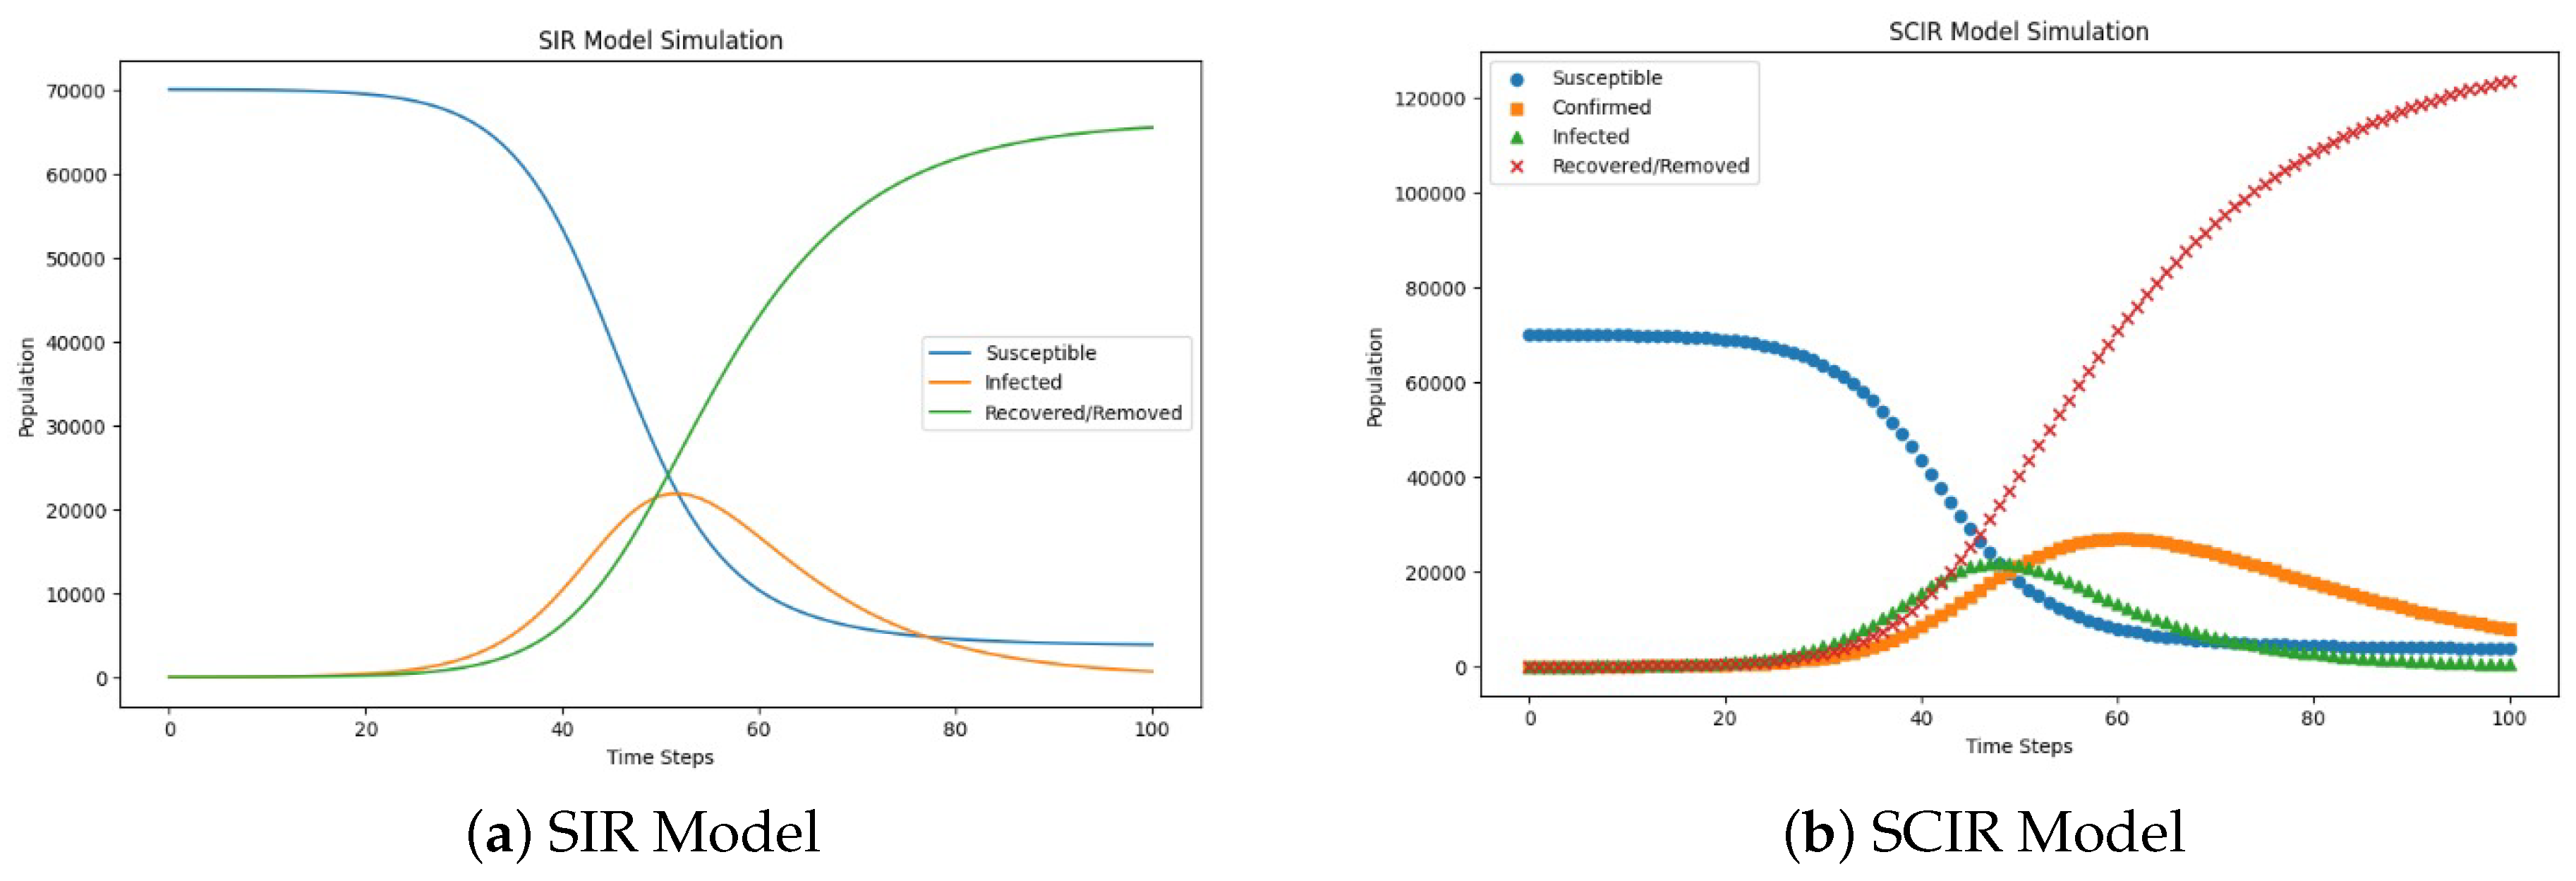
Comparison of the SIR and SCIR models’ performance in terms of predicting cardiovascular health outcomes while accounting for algorithmic bias. The SCIR model demonstrated superior recovery rates and a more accurate representation of the confirmed cases, with a biased impact on the transmission rate that was similar to the SIR model. The comparison highlights the enhanced accuracy of the SCIR model in mitigating bias, which could lead to more reliable health predictions and equitable outcomes in healthcare settings.
Figure 11.
Comparison of the SIR and SCIR models’ performance in terms of predicting cardiovascular health outcomes while accounting for algorithmic bias. The SCIR model demonstrated superior recovery rates and a more accurate representation of the confirmed cases, with a biased impact on the transmission rate that was similar to the SIR model. The comparison highlights the enhanced accuracy of the SCIR model in mitigating bias, which could lead to more reliable health predictions and equitable outcomes in healthcare settings.
Figure 12.
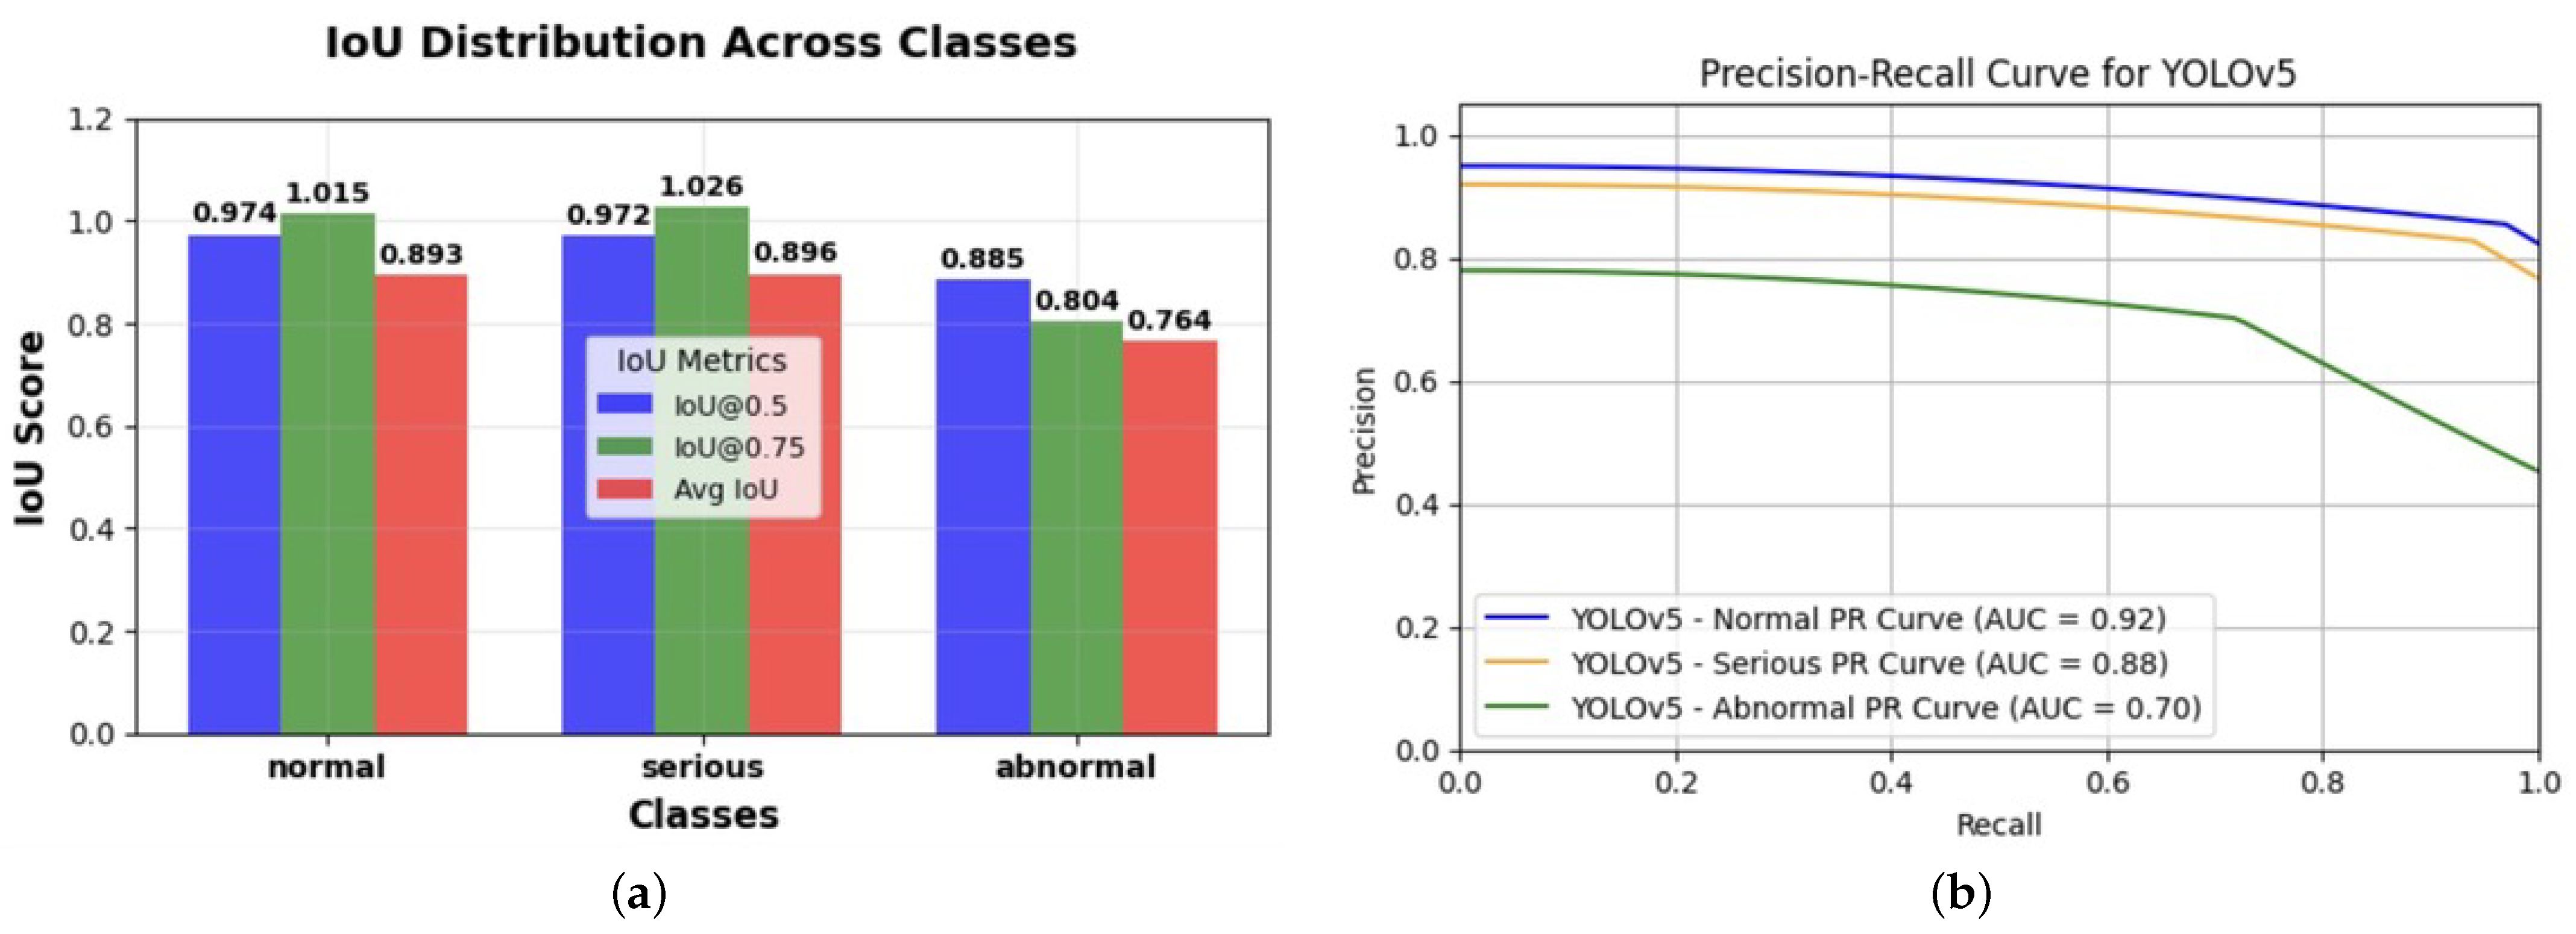
Comparison of the YOLO model metrics for bias assessments in cardiovascular imaging. (a) Intersection over Union (IoU) score distribution across classification categories: This figure illustrates the performance of the YOLO model in detecting and classifying objects across three categories—normal, serious, and abnormal—based on Intersection over Union (IoU) scores. The IoU metrics are presented at two confidence thresholds, IoU@0.5 (blue) and IoU@0.75 (green), along with the average IoU (red) for each class. Higher IoU values indicate better overlap between the predicted and ground-truth bounding boxes, with the serious category achieving the highest performance across all metrics. This analysis helps assess the model’s accuracy and reliability in distinguishing between varying levels of severity in the classifications. (b) This graph presents the precision–recall (PR) curves for the YOLOv5 model across three classification categories—normal (blue), serious (orange), and abnormal (green)—in cardiac MRI images, with corresponding area under the curve (AUC) scores of 0.92, 0.88, and 0.70, respectively. The PR curves indicate the trade off between precision and recall for each class, highlighting the model’s performance in detecting cardiovascular abnormalities. The noticeably lower AUC for the abnormal class suggests potential disparities in model performance, which could reflect algorithmic bias in the classification process. This analysis is crucial for evaluating and mitigating biases in AI-driven cardiovascular diagnostics, ensuring fair and consistent accuracy across all severity levels, as well as improving reliability in clinical decision making.
Figure 12.
Comparison of the YOLO model metrics for bias assessments in cardiovascular imaging. (a) Intersection over Union (IoU) score distribution across classification categories: This figure illustrates the performance of the YOLO model in detecting and classifying objects across three categories—normal, serious, and abnormal—based on Intersection over Union (IoU) scores. The IoU metrics are presented at two confidence thresholds, IoU@0.5 (blue) and IoU@0.75 (green), along with the average IoU (red) for each class. Higher IoU values indicate better overlap between the predicted and ground-truth bounding boxes, with the serious category achieving the highest performance across all metrics. This analysis helps assess the model’s accuracy and reliability in distinguishing between varying levels of severity in the classifications. (b) This graph presents the precision–recall (PR) curves for the YOLOv5 model across three classification categories—normal (blue), serious (orange), and abnormal (green)—in cardiac MRI images, with corresponding area under the curve (AUC) scores of 0.92, 0.88, and 0.70, respectively. The PR curves indicate the trade off between precision and recall for each class, highlighting the model’s performance in detecting cardiovascular abnormalities. The noticeably lower AUC for the abnormal class suggests potential disparities in model performance, which could reflect algorithmic bias in the classification process. This analysis is crucial for evaluating and mitigating biases in AI-driven cardiovascular diagnostics, ensuring fair and consistent accuracy across all severity levels, as well as improving reliability in clinical decision making.
![Diagnostics 14 02675 g012]()
Figure 13.
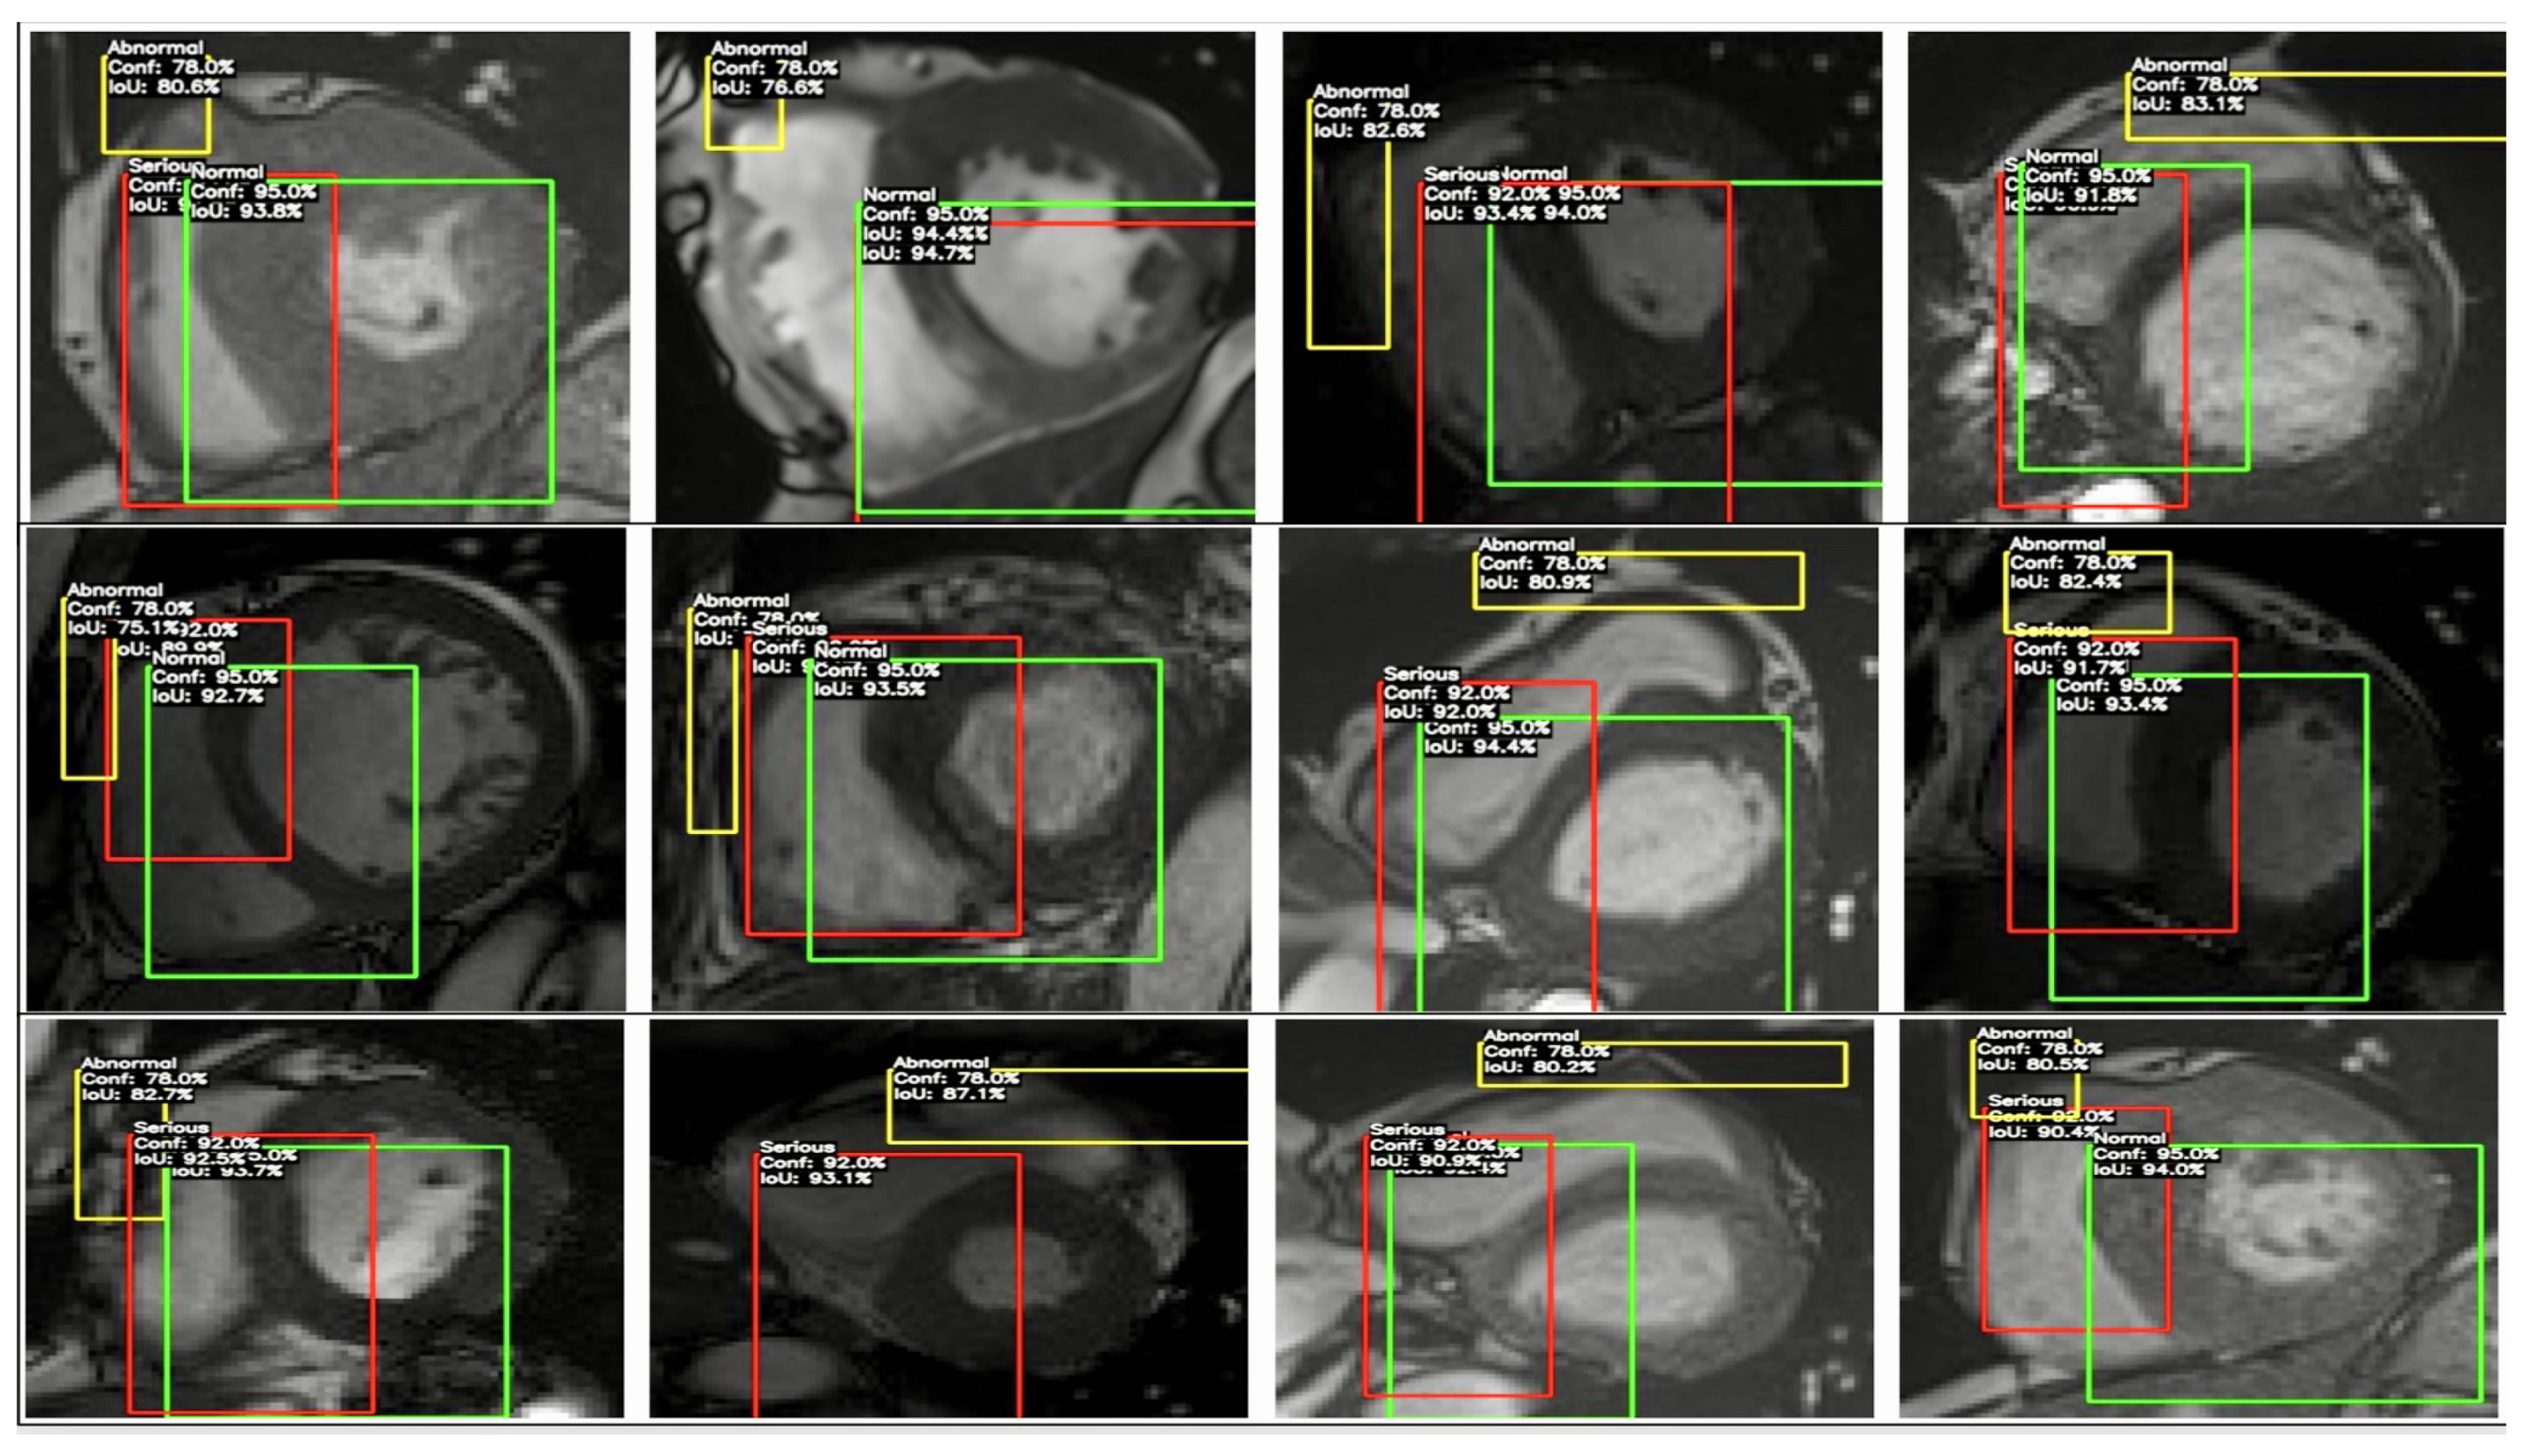
This figure depicts the YOLO model’s classification and bounding box detections on cardiac MRI images, identifying regions as ‘Normal’ (green), ‘Serious’ (red), and ‘Abnormal’ (yellow), along with confidence scores and IoU values. This visualization highlights detection consistency across severity levels, providing insights into potential algorithmic biases in cardiovascular imaging and supporting the goal of fairer, more reliable diagnostics.
Figure 13.
This figure depicts the YOLO model’s classification and bounding box detections on cardiac MRI images, identifying regions as ‘Normal’ (green), ‘Serious’ (red), and ‘Abnormal’ (yellow), along with confidence scores and IoU values. This visualization highlights detection consistency across severity levels, providing insights into potential algorithmic biases in cardiovascular imaging and supporting the goal of fairer, more reliable diagnostics.
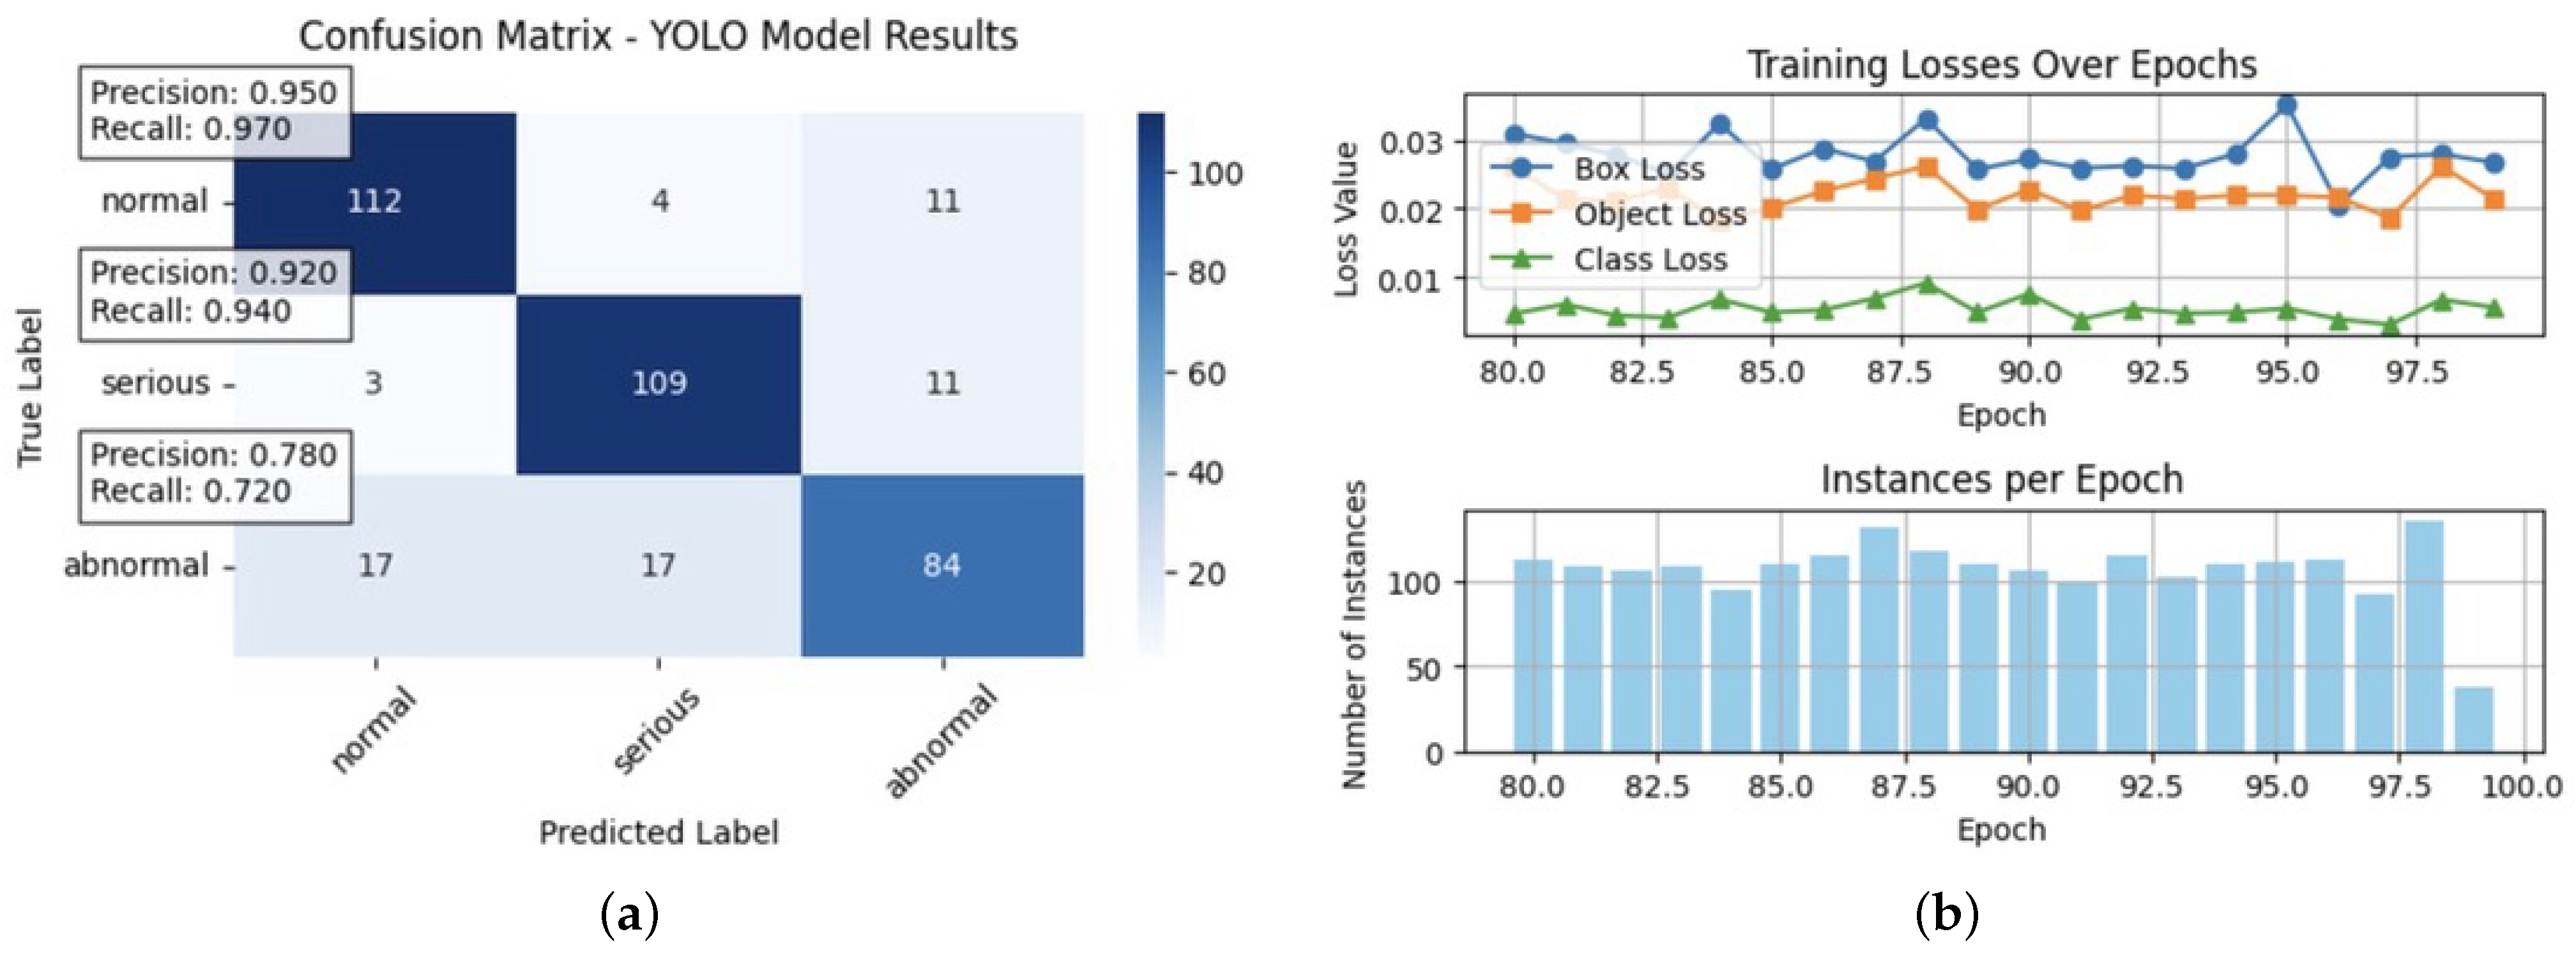
Figure 14.
Comparison of the YOLO model’s performance and training metrics: (a) This confusion matrix illustrates the YOLO model’s classification performance across three categories—normal, serious, and abnormal—in cardiac MRI. The matrix shows accurate labels versus predicted labels, with the colour intensity representing the count of predictions. Precision and recall metrics were highlighted for each class, with normal achieving a precision of 0.950 and a recall of 0.970; serious showing an accuracy of 0.920 and a recall of 0.940; and abnormal with a lower precision and recall values at 0.780 and 0.720, respectively. The lower performance on abnormal cases indicates potential bias in the model’s predictions, underscoring the need for targeted adjustments to enhance fairness and accuracy across all severity levels. (b) This figure displays YOLO model training metrics across epochs. The top plot shows box loss (blue), object loss (orange), and class loss (green), indicating model performance in bounding box localisation, object confidence, and classification accuracy. The bottom plot tracks the number of instances per epoch, reflecting data consistency. Monitoring these metrics helps assess and mitigate potential biases in the model, supporting fairer and more accurate cardiovascular diagnostics.
![Diagnostics 14 02675 g014]()
Figure 15.
SCIR model sensitivity analysis across different parameter configurations: The plots illustrate population dynamics for susceptible (normal), carrier (at-risk), infected, and recovered groups over time under various configurations of (transition rate from susceptible to carrier), (transition rate from carrier to infected), and (transition rate from infected to recovered). For example, with parameters , , and , at time = 1.02, the population distribution was , , , and , indicating a gradual decrease in susceptible as individuals transitioned to carrier and infected states. When was increased to , to , and to by time = 50.0, the populations shifted to , , , and , showing a rapid decline in susceptible and an increase in recovered. This sensitivity analysis highlights how parameter adjustments impact the rate of transitions and peak populations, offering insights into model biases and supporting targeted adjustments for balanced and fair diagnostic predictions.
![Diagnostics 14 02675 g015]()
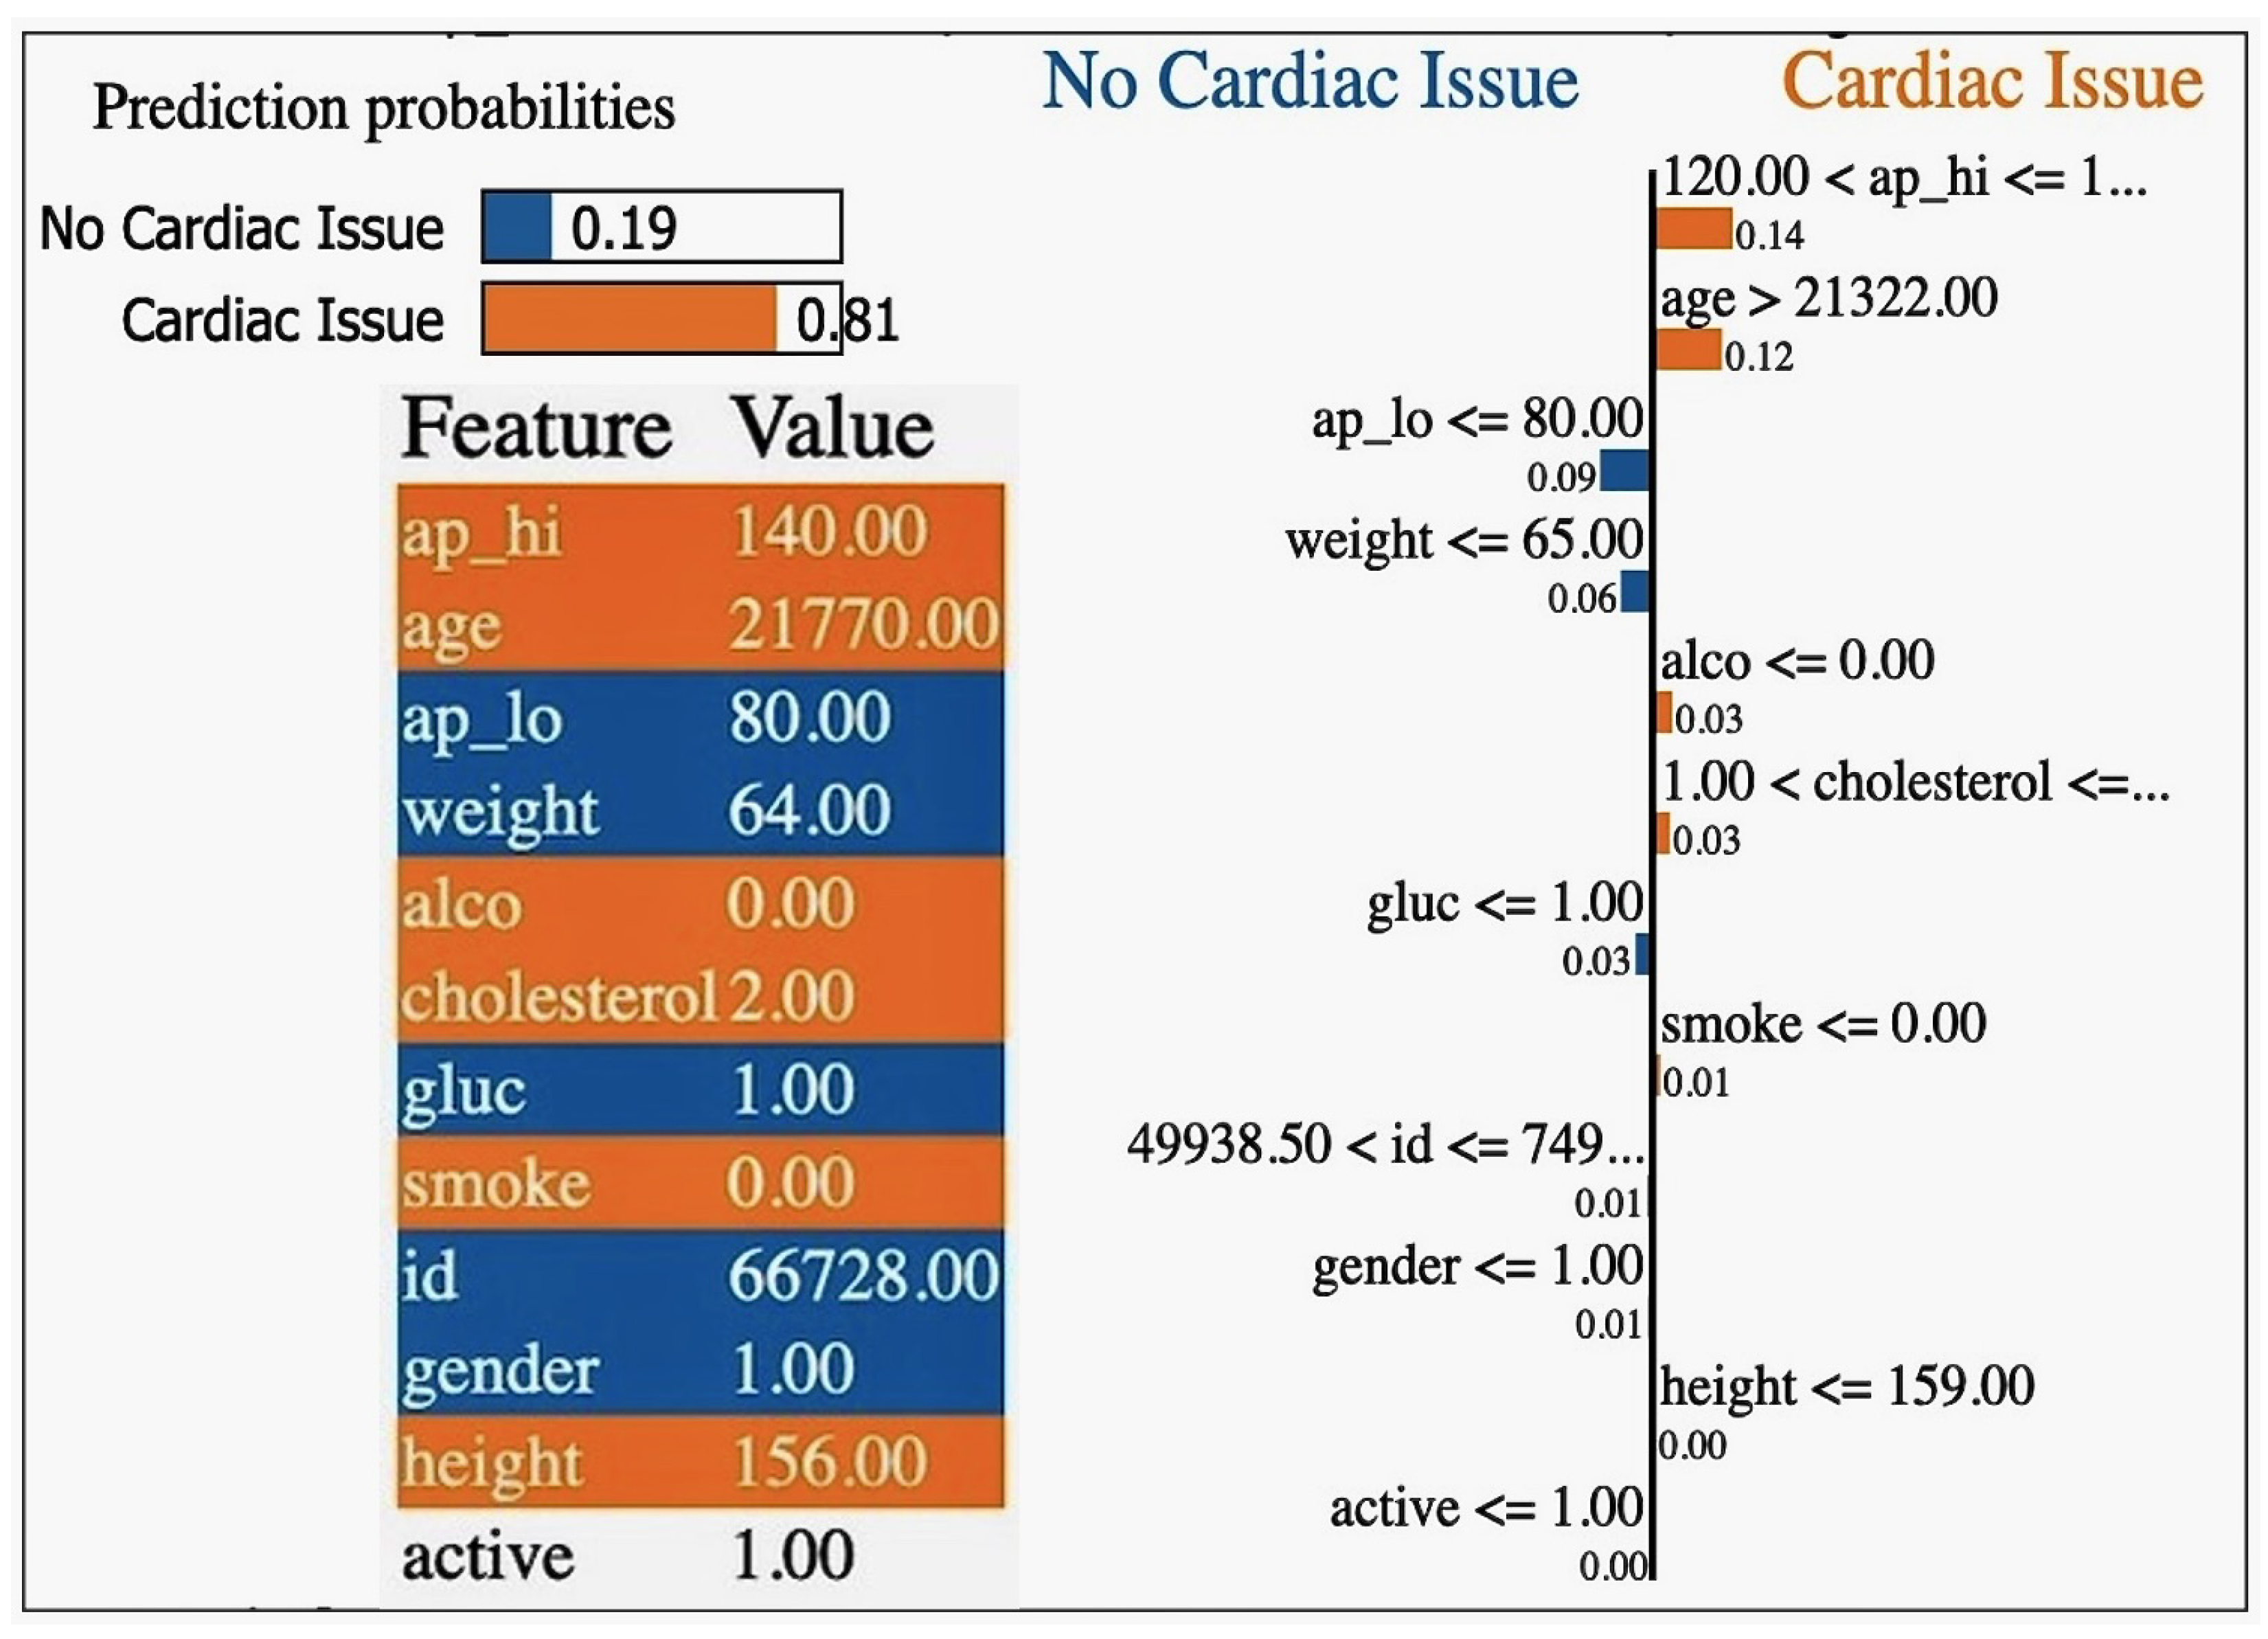
Figure 16.
Local interpretable model-agnostic explanation (LIME) showcasing the feature importance for individual predictions, illustrating how specific input variables contribute to the model’s decision-making process.
Figure 16.
Local interpretable model-agnostic explanation (LIME) showcasing the feature importance for individual predictions, illustrating how specific input variables contribute to the model’s decision-making process.
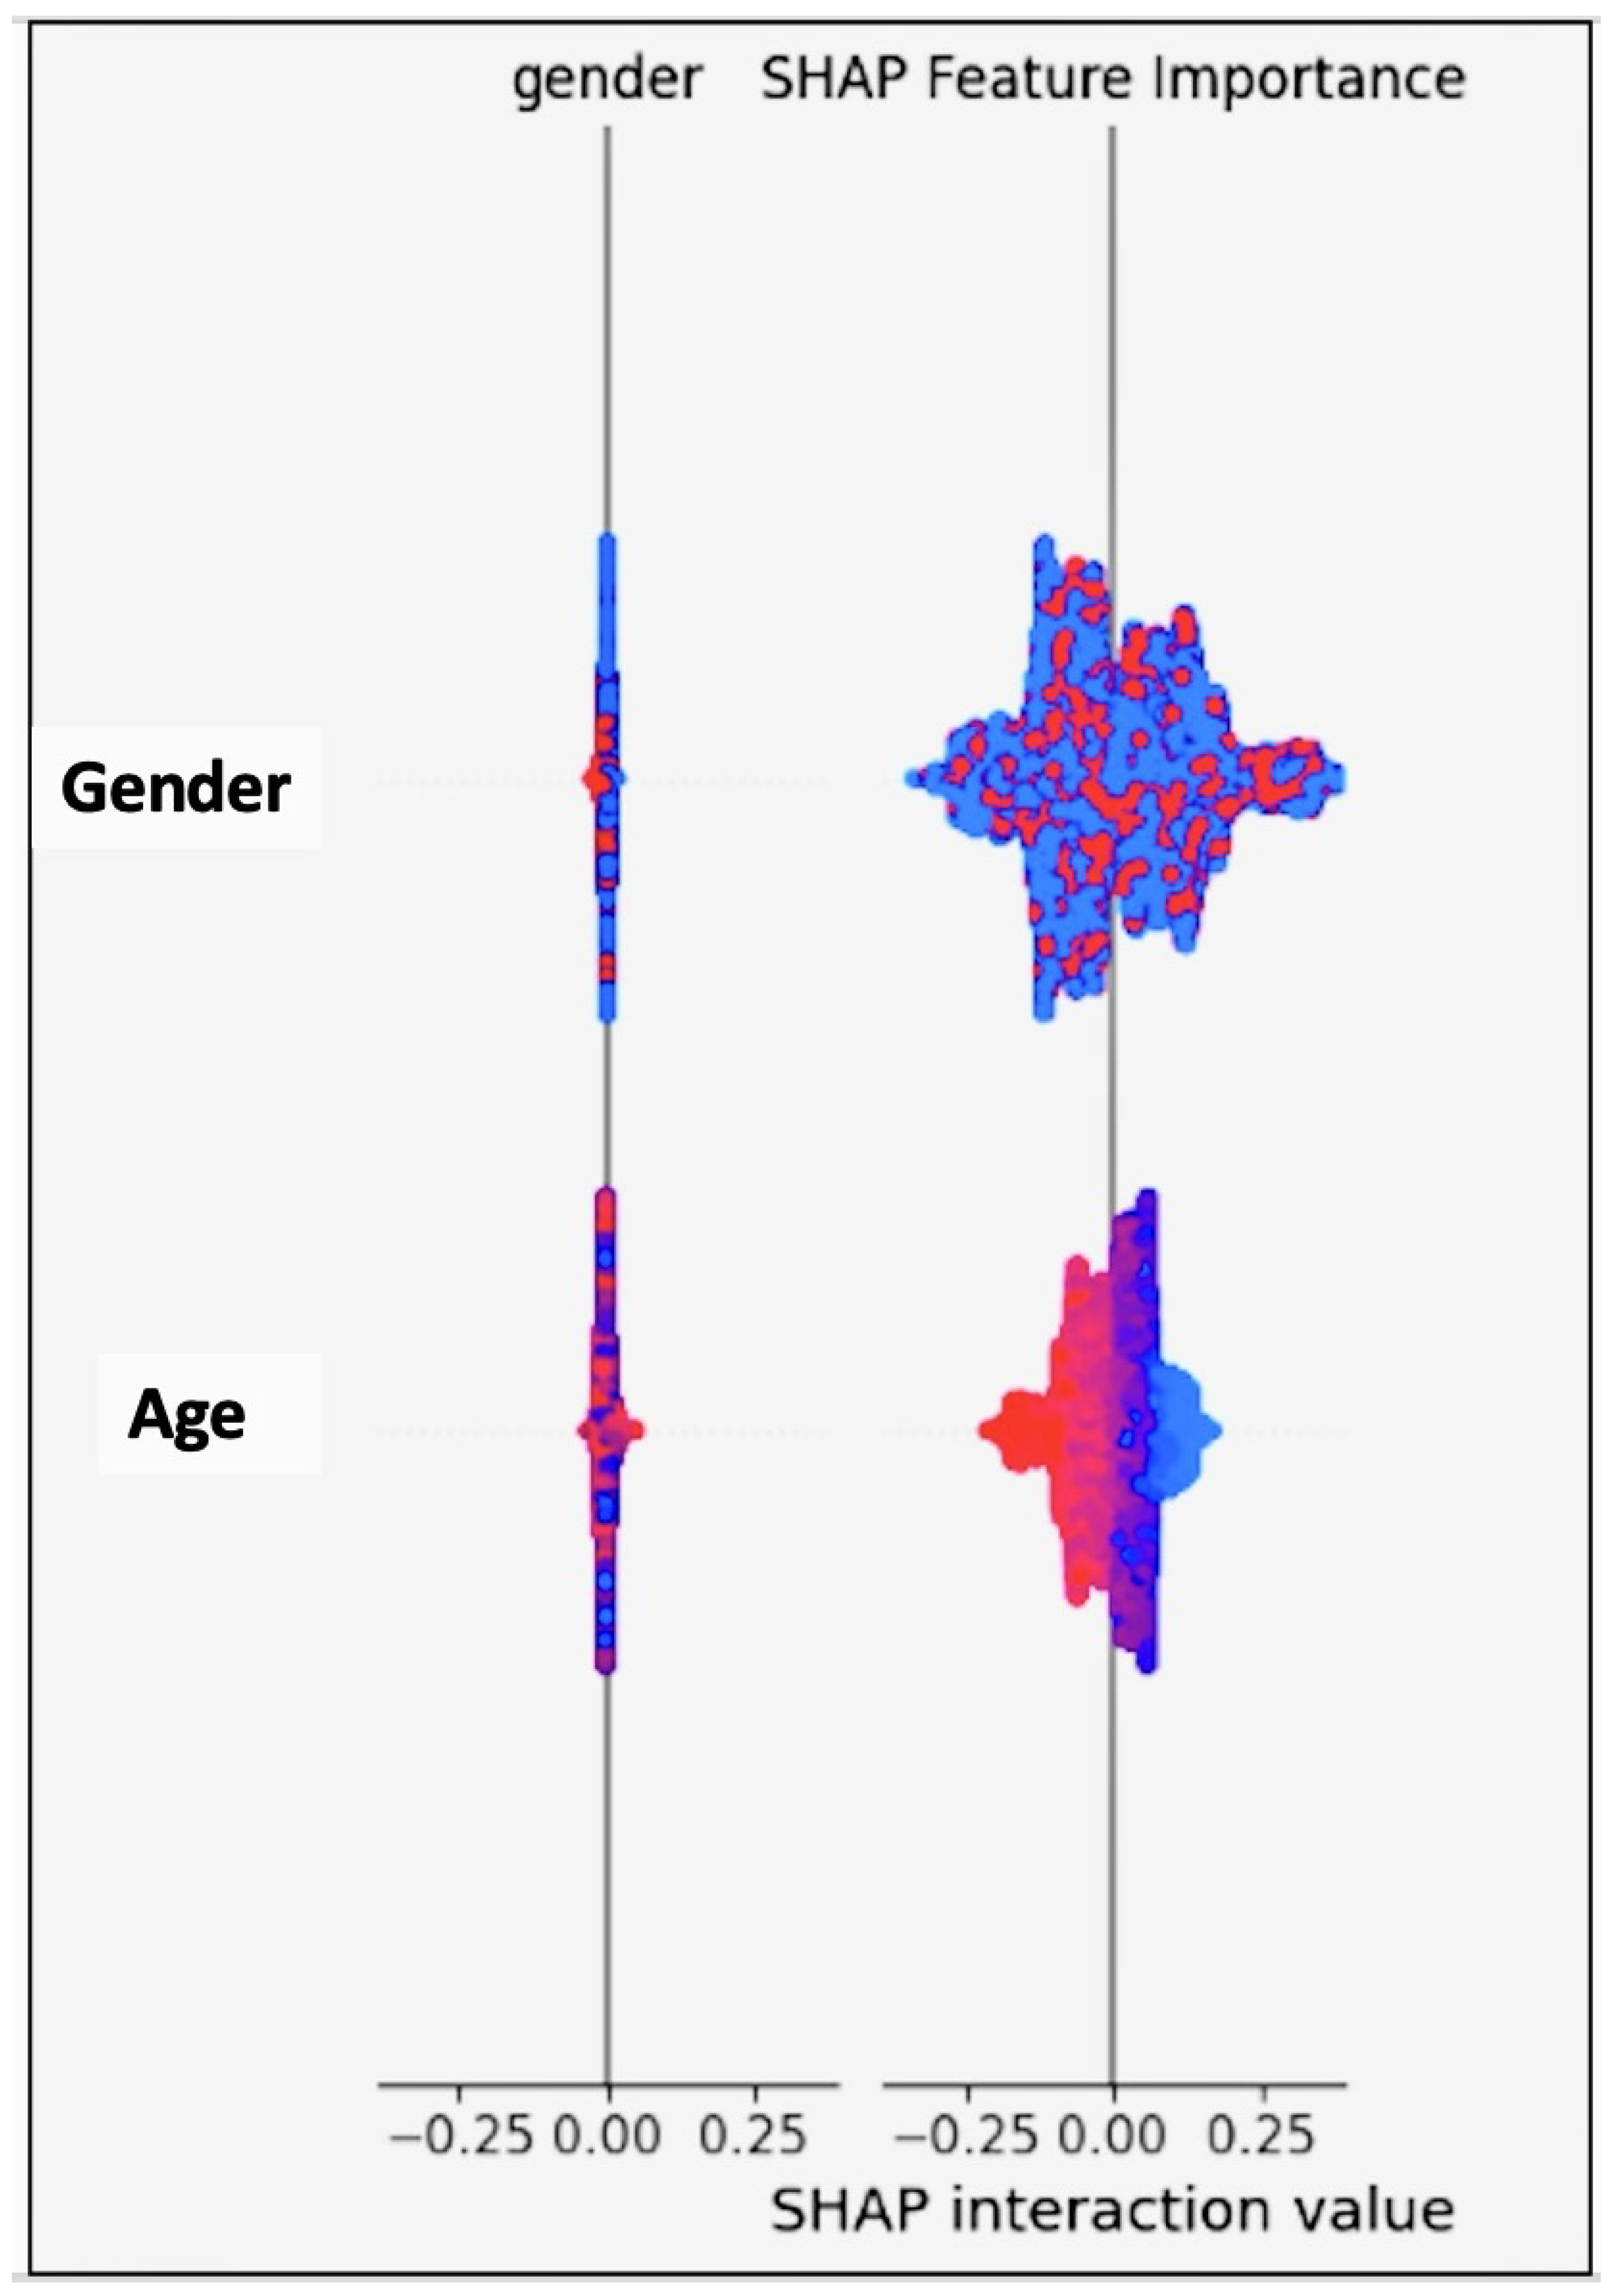
Figure 17.
The SHapley Additive exPlanations (SHAP) demonstrating the contribution of each feature to the model’s output, where a breakdown is provided of how the features positively or negatively influenced individual predictions.
Figure 17.
The SHapley Additive exPlanations (SHAP) demonstrating the contribution of each feature to the model’s output, where a breakdown is provided of how the features positively or negatively influenced individual predictions.
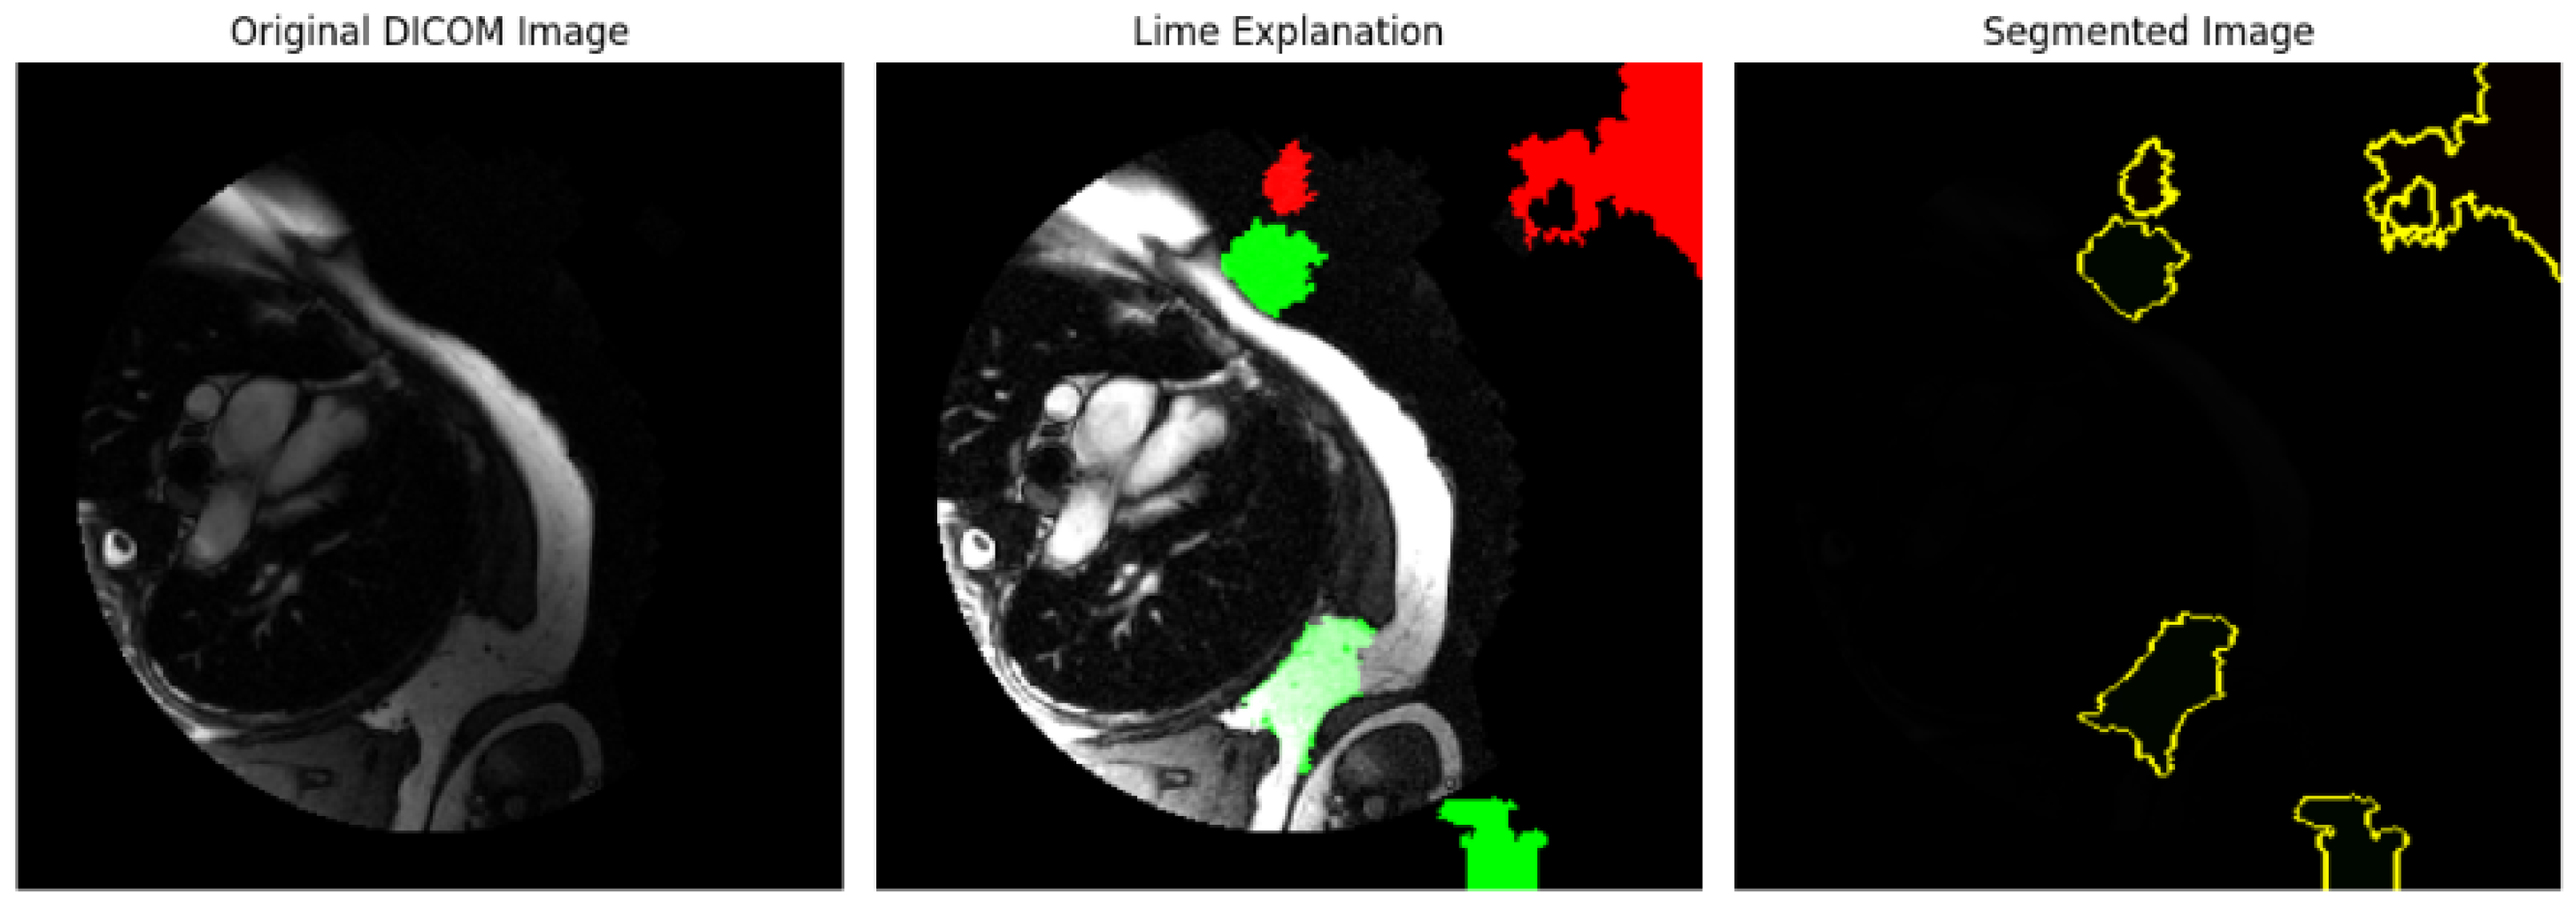
Figure 18.
LIME explanation of the image dataset applied to an image dataset. The regions of the image that most contributed to the model’s prediction are highlighted, offering insights into the feature importance for model interpretability.
Figure 18.
LIME explanation of the image dataset applied to an image dataset. The regions of the image that most contributed to the model’s prediction are highlighted, offering insights into the feature importance for model interpretability.
Figure 19.
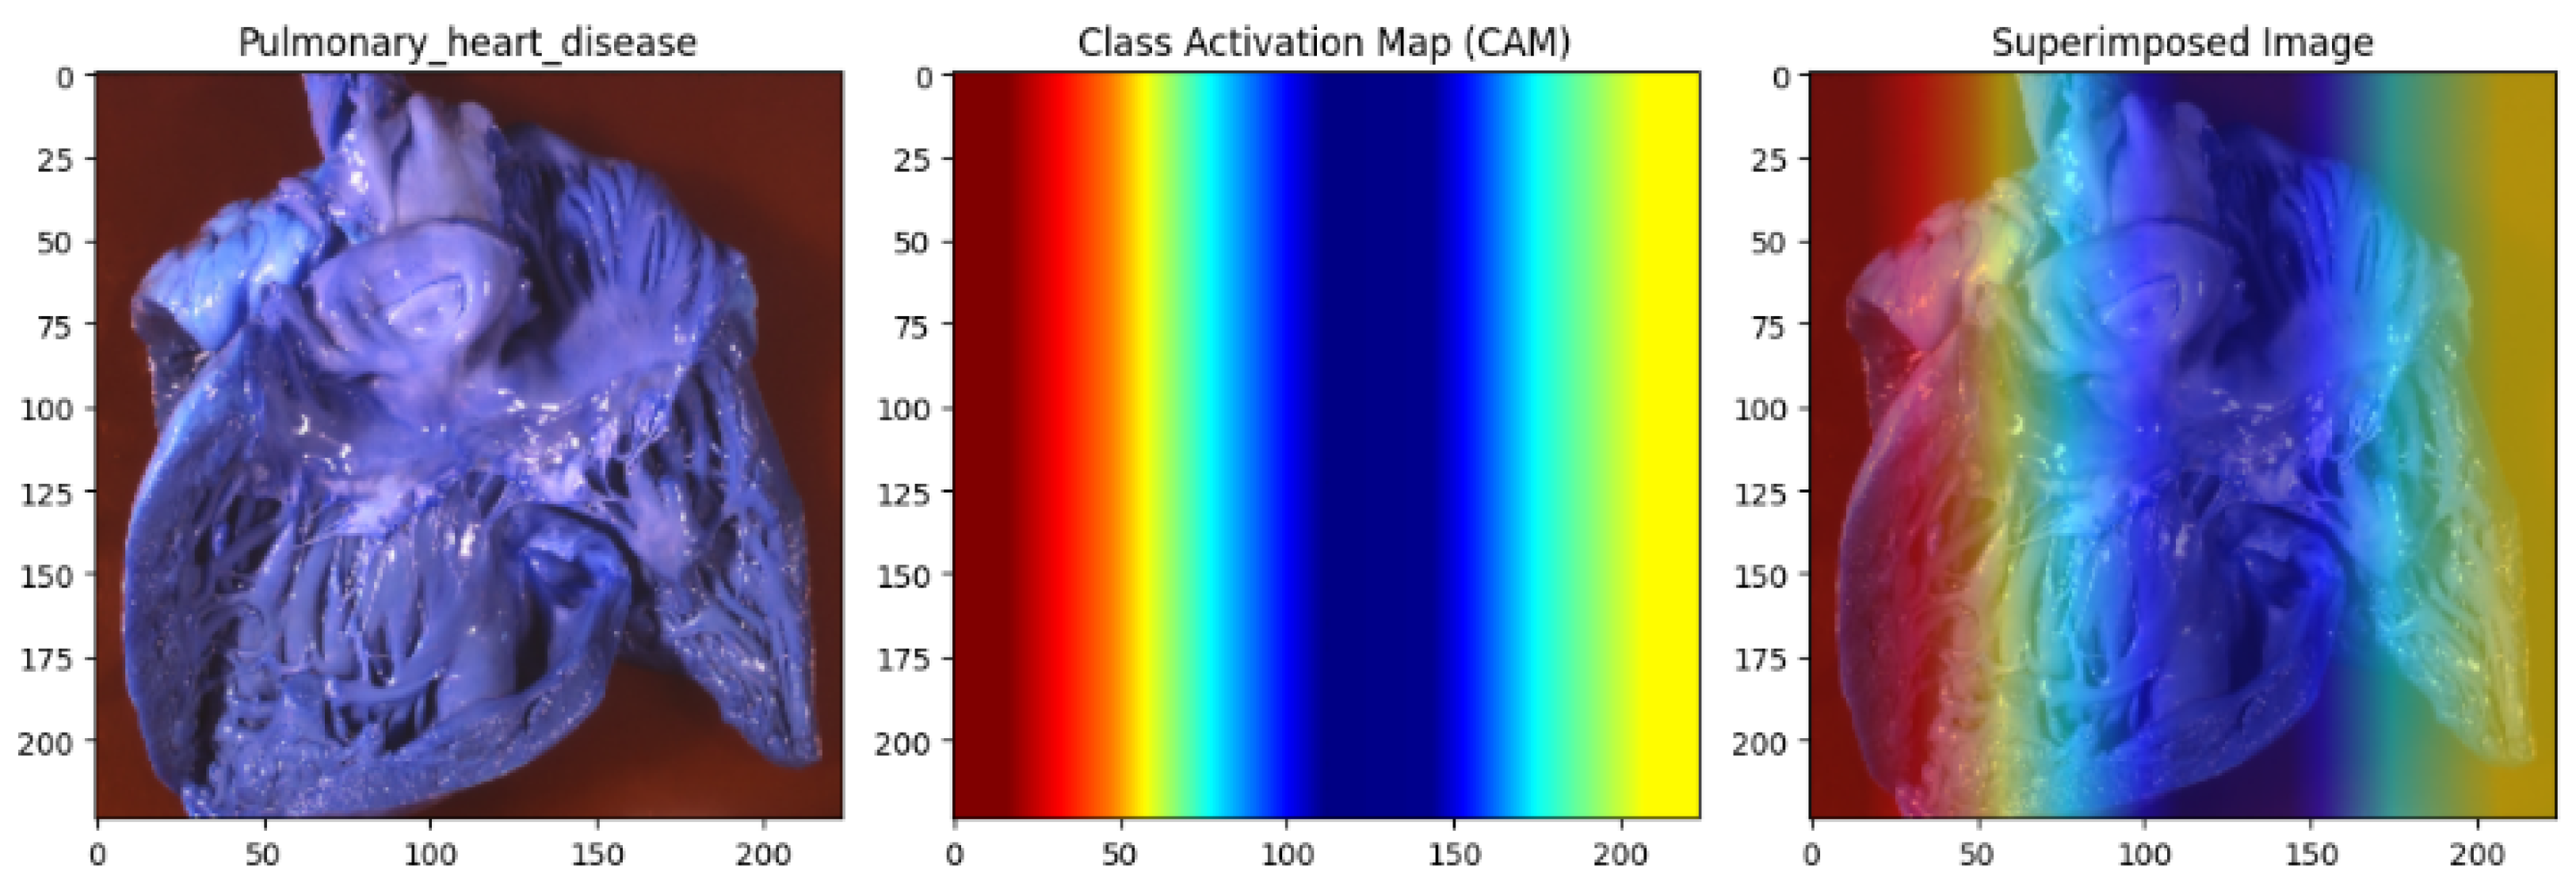
Pulmonary heart disease analysis utilising the Capuchin algorithm for database bias repair. The left panel displays the original heart image. In contrast, the middle panel presents the Class Activation Map (CAM), highlighting critical regions influencing the model’s predictions with a gradient from red (high importance) to blue (low importance). The right panel overlays the CAM on the original image, clearly visualising the model’s focus. By repairing biases in the dataset, the Capuchin algorithm ensures fair and accurate detection of clinically relevant features, reducing algorithmic bias in cardiovascular imaging.
Figure 19.
Pulmonary heart disease analysis utilising the Capuchin algorithm for database bias repair. The left panel displays the original heart image. In contrast, the middle panel presents the Class Activation Map (CAM), highlighting critical regions influencing the model’s predictions with a gradient from red (high importance) to blue (low importance). The right panel overlays the CAM on the original image, clearly visualising the model’s focus. By repairing biases in the dataset, the Capuchin algorithm ensures fair and accurate detection of clinically relevant features, reducing algorithmic bias in cardiovascular imaging.
Figure 20.
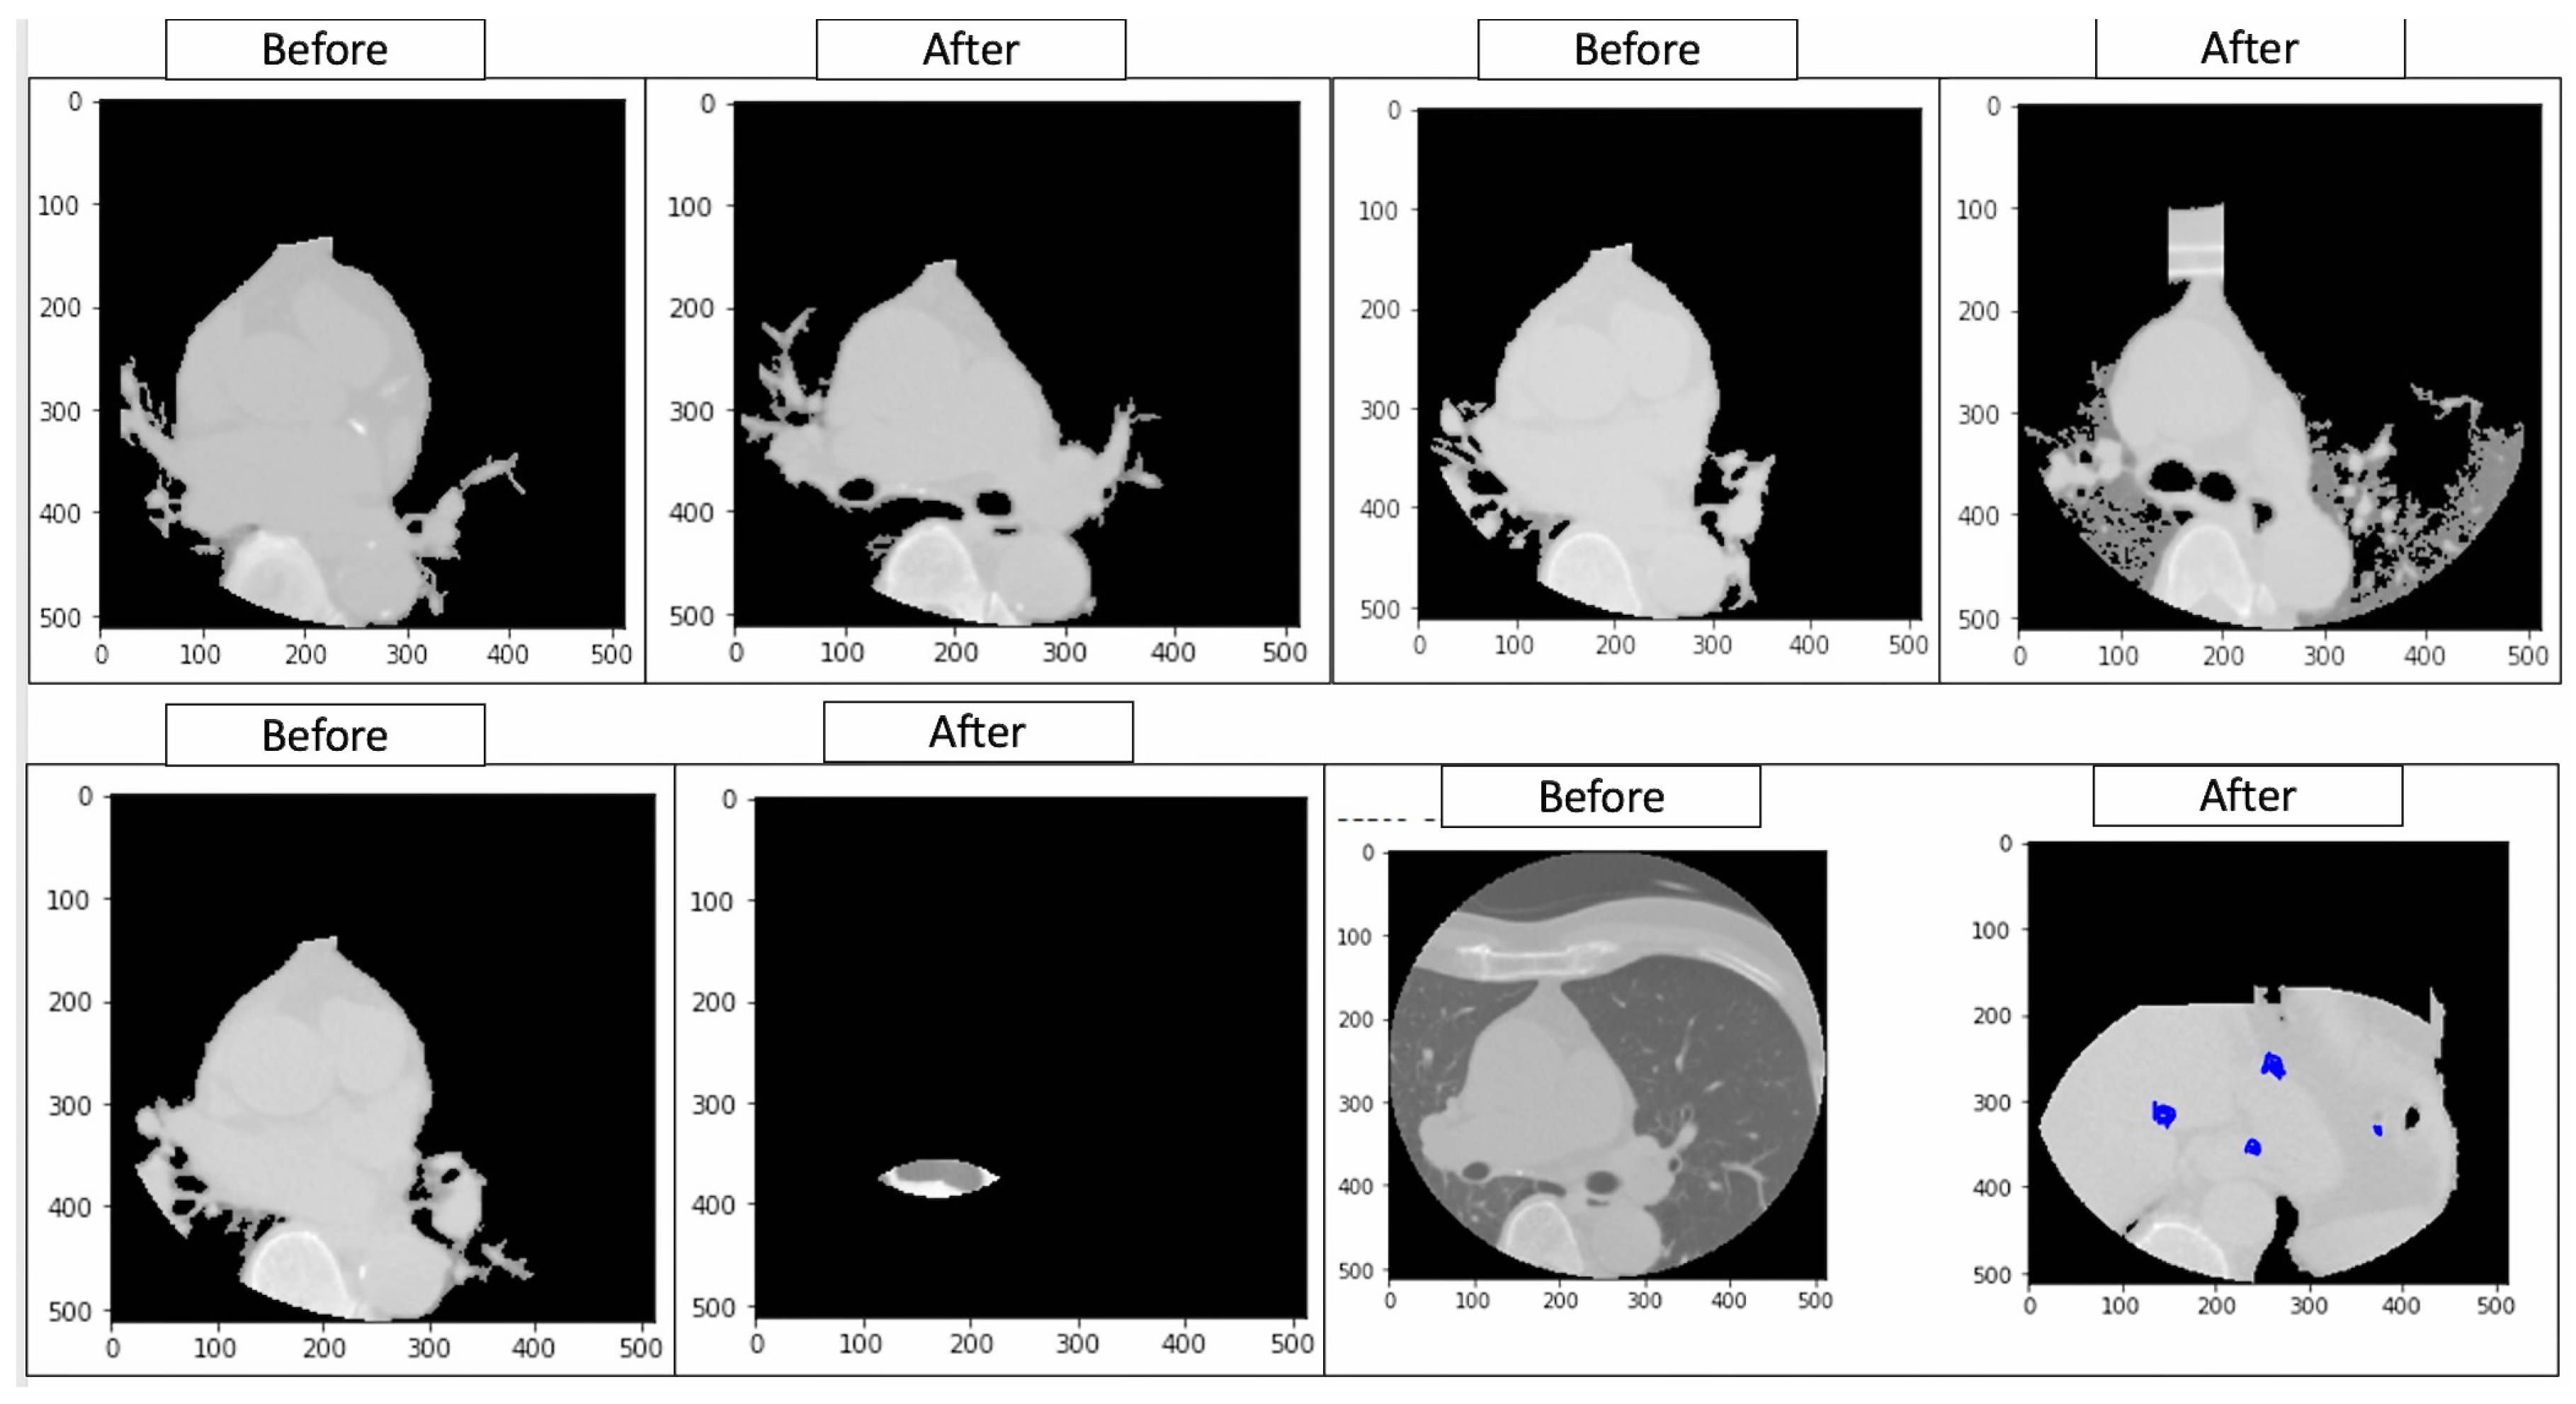
Ground truth annotations showing the original labels (‘Before’) and model-predicted classifications (‘After’) in cardiovascular imaging. These annotations facilitate the identification of discrepancies in segmentation and classification, enabling a systematic evaluation of model performance across demographic and clinical subgroups. This analysis supports the project by uncovering patterns of algorithmic bias and informing the development of equitable AI frameworks tailored for accurate and inclusive cardiovascular diagnostics.
Figure 20.
Ground truth annotations showing the original labels (‘Before’) and model-predicted classifications (‘After’) in cardiovascular imaging. These annotations facilitate the identification of discrepancies in segmentation and classification, enabling a systematic evaluation of model performance across demographic and clinical subgroups. This analysis supports the project by uncovering patterns of algorithmic bias and informing the development of equitable AI frameworks tailored for accurate and inclusive cardiovascular diagnostics.
Figure 21.
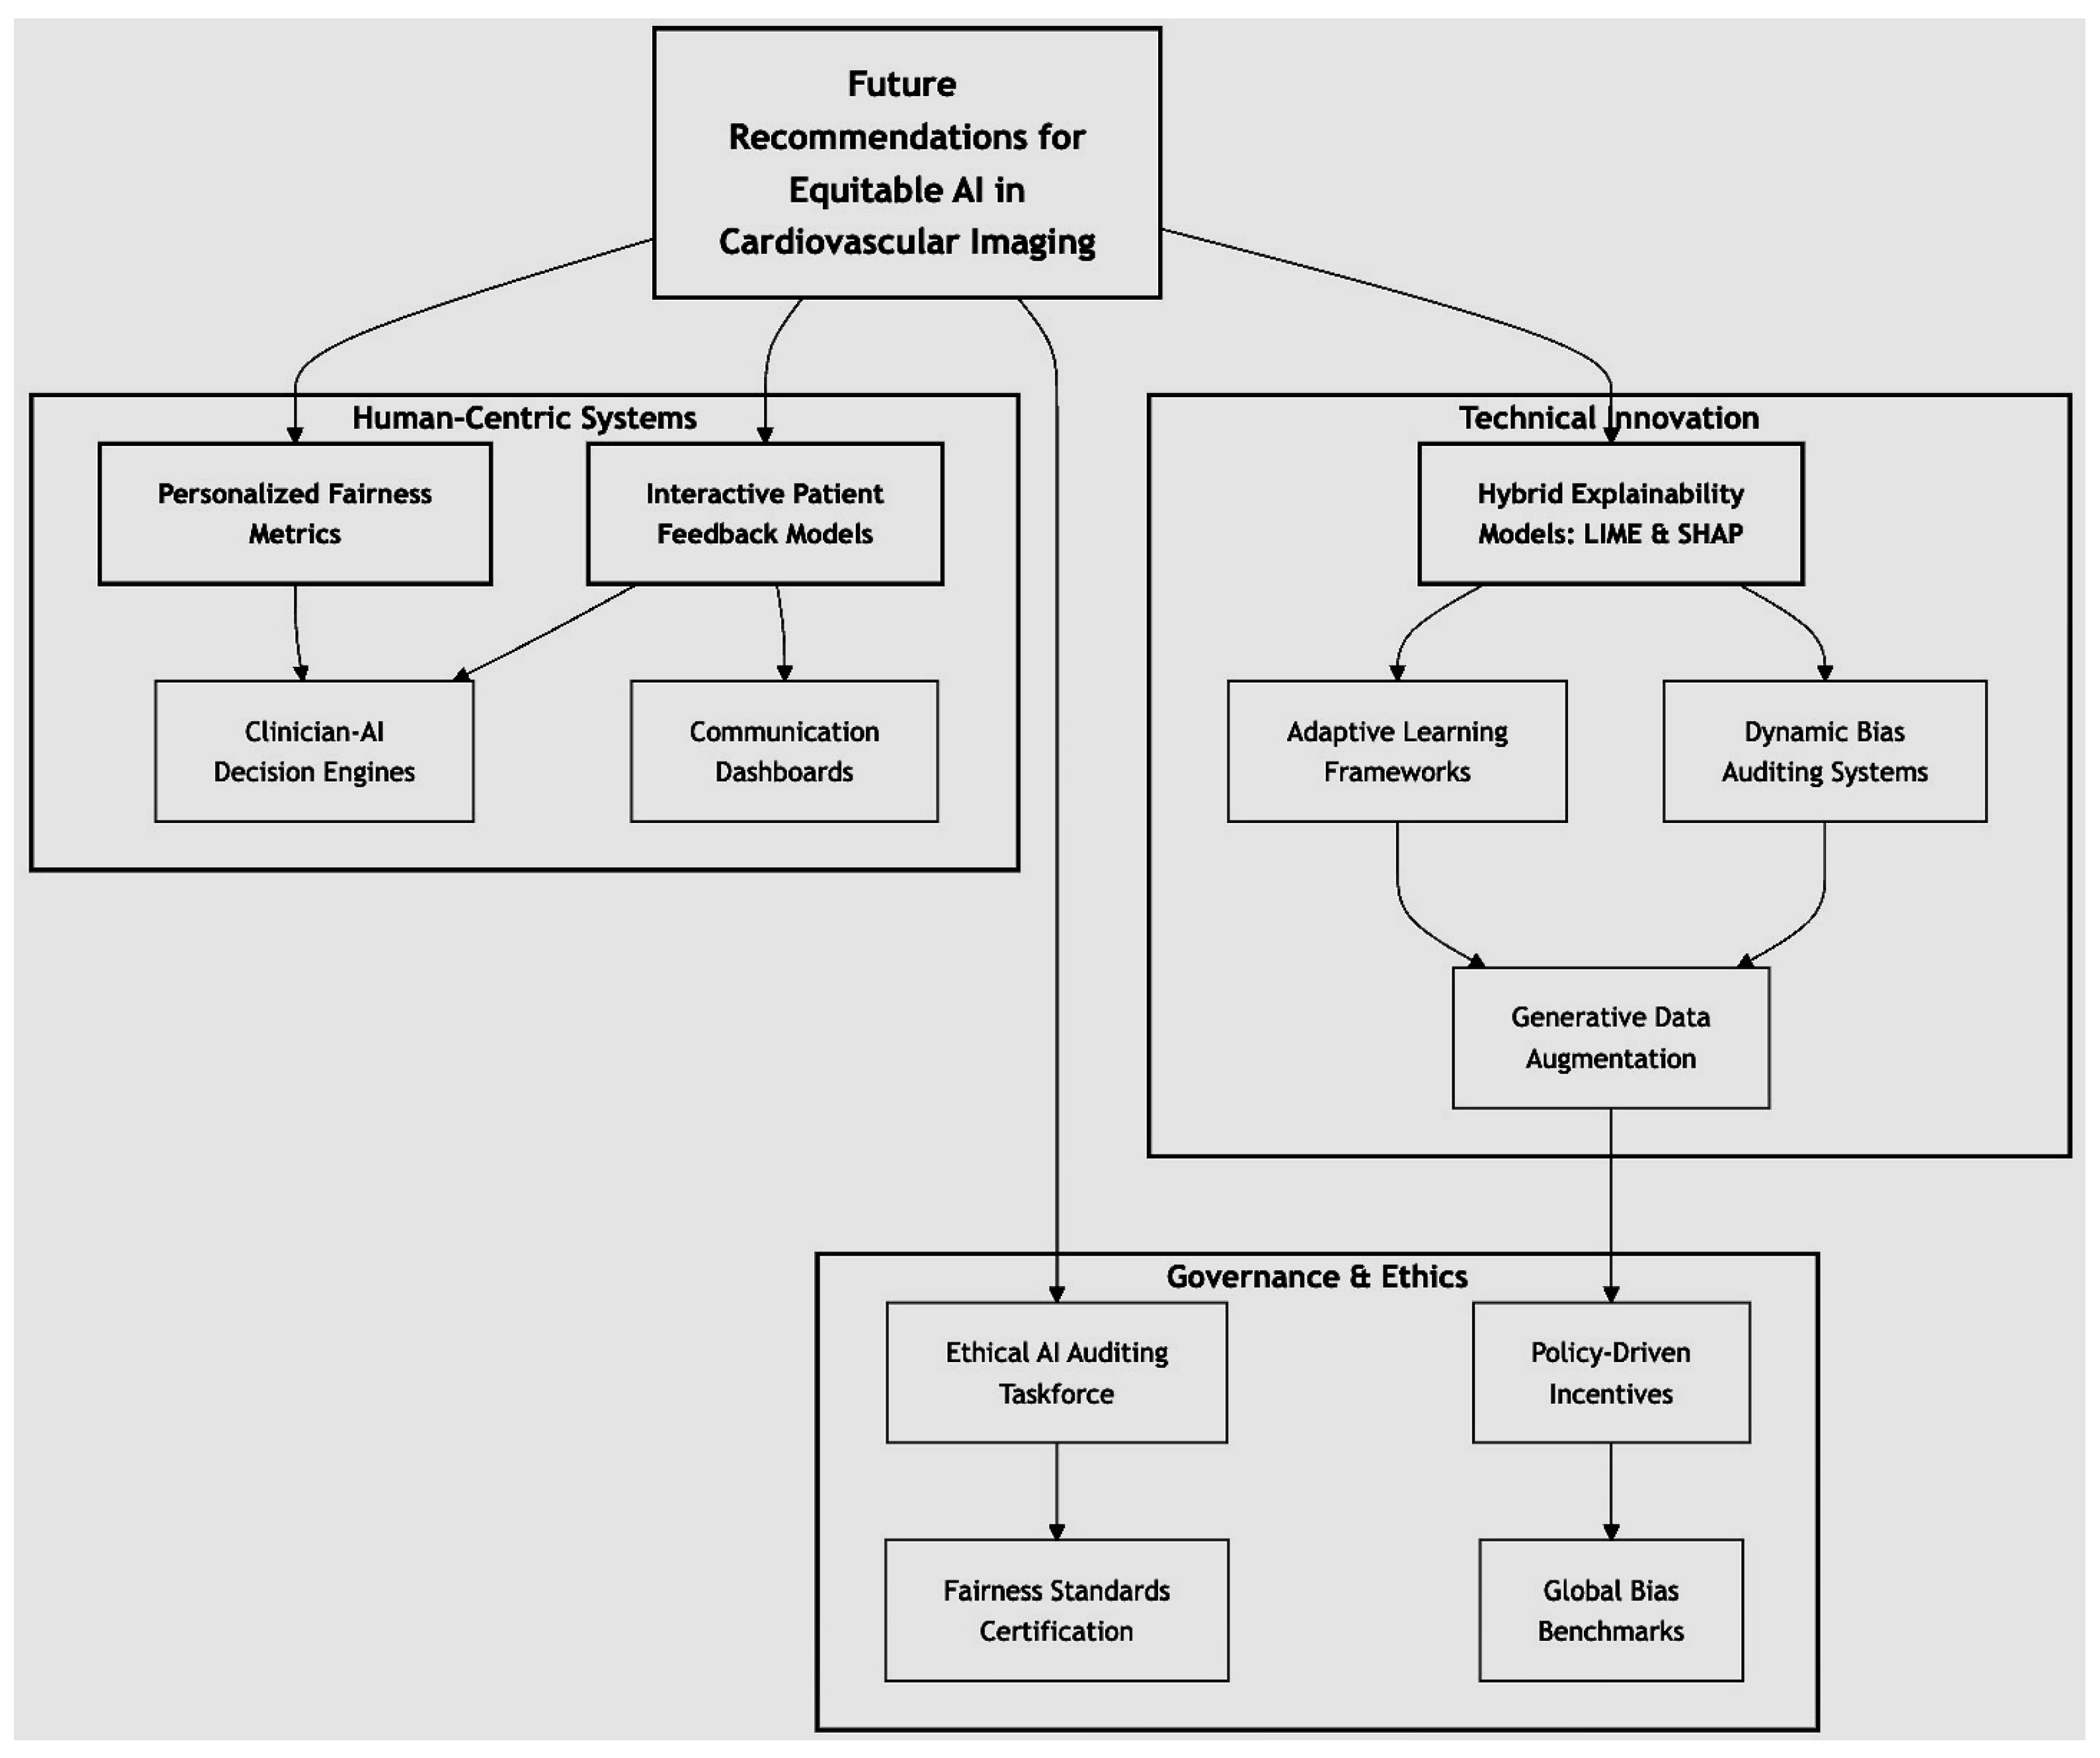
Proposing a visionary framework for equitable AI in cardiovascular imaging. The diagram represents a multi-faceted framework for addressing algorithmic bias in AI-driven cardiovascular diagnostics. The central node emphasizes the overarching goal of equitable and transparent AI integration. Recommendations are categorized into three interconnected domains: (1) Technical Innovation, focusing on advancements such as dynamic bias auditing and hybrid explainability models; (2) Human-Centric Systems, highlighting personalized fairness metrics and interactive patient feedback mechanisms; and (3) Governance and Ethics, addressing ethical AI auditing, certification of fairness standards, and global collaboration on bias benchmarks. Interconnectedness ensures a comprehensive implementation that aligns technical, human, and policy-driven efforts to mitigate bias and foster trust in AI systems.
Figure 21.
Proposing a visionary framework for equitable AI in cardiovascular imaging. The diagram represents a multi-faceted framework for addressing algorithmic bias in AI-driven cardiovascular diagnostics. The central node emphasizes the overarching goal of equitable and transparent AI integration. Recommendations are categorized into three interconnected domains: (1) Technical Innovation, focusing on advancements such as dynamic bias auditing and hybrid explainability models; (2) Human-Centric Systems, highlighting personalized fairness metrics and interactive patient feedback mechanisms; and (3) Governance and Ethics, addressing ethical AI auditing, certification of fairness standards, and global collaboration on bias benchmarks. Interconnectedness ensures a comprehensive implementation that aligns technical, human, and policy-driven efforts to mitigate bias and foster trust in AI systems.
Table 2.
Preprocessing steps for the CSV and MRI datasets.
Table 2.
Preprocessing steps for the CSV and MRI datasets.
| Dataset Type | Preprocessing Steps | Details |
|---|
| CSV Dataset-Tabular (Patient Features) | Missing Value Imputation | Missing values in critical features (e.g., cholesterol, blood pressure, etc.) were imputed using the mean for continuous variables and mode for categorical variables. For the missing values in demographic information (e.g., gender, smoking, etc.), the most frequent category was used. |
| Normalisation | Numerical features (e.g., age, height, weight, etc.) were scaled using z-score normalisation to ensure a consistent range and eliminate unit bias for model training. |
| Encoding Categorical Features | Categorical variables such as “gender” and “smoking” were encoded using one-hot encoding or label encoding based on the number of categories. |
| Feature Engineering | Derived additional features such as the BMI from height and weight and combined systolic and diastolic blood pressure to create a new feature representing overall blood pressure. |
| Outlier Removal | Outliers in key clinical features (e.g., blood pressure, cholesterol, etc.) were identified using the IQR method and were then excluded to avoid model bias. |
| Data Splitting | The dataset was randomly split into training (80%) and testing (20%) sets to ensure model generalisability. |
| MRI Dataset (Cardiovascular Imaging Data, DICM, JPG etc.) | Normalisation of Pixel Intensity | Pixel values were normalised to a 0–255 scale to standardise brightness and contrast variations across the images obtained from different scanners. |
| Resizing | All MRI images were resized to a fixed resolution of 256 × 208 pixels to match the input dimensions required by the deep learning model architecture. |
| Cropping | Cropping was applied to centre the region of interest (e.g., the left ventricle) in the images to reduce computational load and focus on the area of interest. |
| Data Augmentation | Augmentation techniques, such as random rotations, flipping, and scaling, were applied to increase model robustness and generalise across different imaging conditions. |
| DICOM Metadata Parsing | Key metadata from the DICOM files, such as slice thickness, pixel spacing, and scan orientation, were parsed and stored for later use in the analysis. |
| Manual Annotation and Segmentation | Each image was manually annotated by radiologists to delineate key structures such as the myocardium, left ventricle, and infarct regions. Annotations were validated using Intersection over Union (IoU) and Dice score metrics to assess segmentation accuracy. |
| Data Splitting | MRI images were divided into training (70%), validation (15%), and testing (15%) sets to allow for model evaluation during training. |
| Advanced Preprocessing Techniques | Advanced techniques were applied to enhance image quality and improve model performance: |
| - Histogram
Equalisation: Improved image contrast by redistributing the intensity values, making features like the myocardium more distinguishable. |
| - Noise Reduction: Gaussian blur and median filtering were used to reduce noise and scanning artefacts, ensuring cleaner images for segmentation. |
| - Contrast Enhancement: CLAHE (Contrast Limited Adaptive Histogram Equalisation) was applied to improve local contrast in regions with poor visibility, such as the left ventricle. |
Table 3.
Description of the dataset-comma separated values.
Table 3.
Description of the dataset-comma separated values.
| Feature | Code/Unit |
|---|
| Age | age (int, days) |
| Height | height (int, cm) |
| Weight | weight (float, kg) |
| Gender | gender (categorical) |
| Blood Pressure (Systolic) | ap_hi (int) |
| Blood Pressure (Diastolic) | ap_lo (int) |
| Cholesterol | cholesterol (1: normal, 2: above, 3: well above) |
| Glucose | gluc (1: normal, 2: above, 3: well above) |
| Smoking | smoke (binary) |
| Alcohol Intake | alco (binary) |
| Physical Activity | active (binary) |
| Cardiovascular Disease | cardio (binary) |
Table 4.
SMOTE (Synthetic Minority Over-Sampling Technique) model hyperparameters.
Table 4.
SMOTE (Synthetic Minority Over-Sampling Technique) model hyperparameters.
| Hyperparameters | Value |
|---|
| Number of estimators | 100 |
| Maximum depth | 10 |
| Minimum sample split | 5 |
| Minimum sample leaf | 4 |
| Maximum features | sqrt |
Table 5.
Summary of the ResNet18 model architecture.
Table 5.
Summary of the ResNet18 model architecture.
| Component | Technical Details |
|---|
| Conv1 | 3 × 3 Convolution, 64 filters, stride 2, padding 1 |
| BN1 | Batch Normalisation |
| ReLU | Rectified Linear Unit activation |
| MaxPool | 3 × 3 Max Pooling, stride 2, padding 1 |
| Layer1 (BasicBlock) | Two Conv2D layers with 64 filters each,
3 × 3 kernel size, stride 1, padding 1 |
| Layer2 (BasicBlock) | Two Conv2D layers with 128 filters each,
3 × 3 kernel size, stride 2 (first layer only), padding 1 |
| Layer3 (BasicBlock) | Two Conv2D layers with 256 filters each,
3 × 3 kernel size, stride 2 (first layer only), padding 1 |
| Layer4 (BasicBlock) | Two Conv2D layers with 512 filters each,
3 × 3 kernel size, stride 2 (first layer only), padding 1 |
| AdaptiveAvgPool2d | Adaptive Average Pooling |
| FC | Fully Connected Layer (Linear) |
Table 6.
Summary of the Mask R-CNN model architecture.
Table 6.
Summary of the Mask R-CNN model architecture.
| Component | Technical Details |
|---|
| Backbone Network | Deep convolutional network (e.g., ResNet-50) for extracting hierarchical features |
| Feature Pyramid Network (FPN) | Multi-scale feature maps to support detection across varied object sizes |
| Region Proposal Network (RPN) | Proposes candidate object regions in the form of anchor boxes |
| RoIAlign | Aligns features to fixed dimensions for precise location data |
| Bounding Box Head | Provides refined bounding boxes for detected regions |
| Classification Head | Assigns class labels to each proposed object |
| Segmentation Mask Head | Generates pixel-wise segmentation masks for each detected region |
Table 7.
Detailed architecture of the SIR model.
Table 7.
Detailed architecture of the SIR model.
| Component | Technical Details |
|---|
| Susceptible (S) | Portion of the population not yet infected, quantified as , where changes based on disease transmission dynamics. |
| Infectious (I) | Individuals currently infected and capable of spreading the infection, represented as . The proportion determines interaction strength with susceptible individuals. |
| Recovered (R) | Individuals who have acquired immunity post-recovery. Modelled as , with the assumption of permanent immunity. |
| Transmission Rate () | Represents per-contact probability of infection, modelled as . |
| Recovery Rate () | Defined as the inverse of the infectious period, , where D is the average duration of infection. |
| Basic Reproduction Number () | Defined by , indicating average secondary infections from one case in a fully susceptible population. An implies disease spread. |
| Differential Equations | dS/dt =
dI/dt =
dR/dt =
where N is the fixed total population. |
Table 8.
Detailed Architecture of the SCIR Model.
Table 8.
Detailed Architecture of the SCIR Model.
| Component | Technical Details |
|---|
| Susceptible (S) | Individuals at risk of infection, denoted by . The proportion of S influences disease spread potential. |
| Exposed (E) | Latent (non-infectious) infected individuals during the incubation period, modelled as , progressing to at rate . |
| Infectious (I) | Actively infectious individuals capable of transmission, represented by . The term modulates exposure interaction. |
| Recovered (R) | Immune individuals post-infection, denoted , with permanent immunity assumption. |
| Incubation Rate () | Transition rate from exposed to infectious, calculated as , where L is the latent period duration. |
| Transmission Rate () | Per-contact transmission probability, with . |
| Recovery Rate () | Rate of recovery, computed as , where D is the mean duration of infection. |
| Basic Reproduction Number () | , quantifying infection spread potential. indicates a self-sustaining epidemic. |
| Differential Equations | dS/dt =
dE/dt =
dI/dt =
dR/dt =
where N represents the constant population size. |
Table 9.
YOLO model architecture and parameters for cardiovascular imaging application.
Table 9.
YOLO model architecture and parameters for cardiovascular imaging application.
| Component | Parameter | Description |
|---|
| Model Name | YOLOv5 (Medium) | Pre-trained YOLOv5 medium model adapted for cardiovascular imaging |
| Number of Classes | 3 | Classes include “normal”, “abnormal”, and “serious” |
| Input Image Size | 640 × 640 | Fixed input image size for both training and validation |
| Optimiser | SGD | Stochastic Gradient Descent optimiser used for model training |
| Learning Rate | 0.01 | Initial learning rate set for training |
| Momentum | 0.937 | Momentum parameter to stabilise training |
| Weight Decay | 0.0005 | Weight decay to prevent overfitting |
| Batch Size | 16 | Number of images processed per training iteration |
| Epochs | 100 | Total training epochs for model convergence |
| Augmentation Techniques | Blur, MedianBlur, CLAHE, and Flip | Applied to improve generalisation and robustness of model across diverse images |
| Loss Function | Cross Entropy Loss | Standard loss function with additional class reweighting to handle imbalances between “normal”, “abnormal”, and “serious” classes |
| IoU Threshold | 0.2 | IoU threshold for positive predictions during training |
| Anchor Boxes | [10,13, 16,30, 33,23], [30,61, 62,45, 59,119],
and [116,90, 156,198, 373,326] | Anchors optimised for cardiovascular image dimensions |
| Evaluation Metrics | Precision, Recall, and mAP | Metrics used to evaluate model performance across classes and overall accuracy |
| Device | CUDA (A100 GPU) | NVIDIA A100 GPU utilised for faster model training |
| Weights Initialisation | yolov5m.pt | Weights initialised from pre-trained YOLOv5 medium model |
Table 10.
Comparison of gender and smoker variable analysis.
Table 10.
Comparison of gender and smoker variable analysis.
| Variable | Metric | Value |
|---|
| Gender | Difference in Mean Outcomes | 0.006819 |
| Smoker | Difference in Mean Outcomes | −0.029137 |
Table 11.
Summary of model metrics for gender and smoker variables.
Table 11.
Summary of model metrics for gender and smoker variables.
| Model Type | Train Set | Test Set |
|---|
| Plain Model—Without Debiasing—Dataset | | |
| Difference in Mean Outcomes (Gender) | - | 0.012435 |
| Difference in Mean Outcomes (Smoker) | −0.062625 | −0.050994 |
| Model—With Debiasing—Dataset | | |
| Difference in Mean Outcomes (Gender) | - | 0.053275 |
| Difference in Mean Outcomes (Smoker) | 0.051619 | 0.053275 |
| Balanced Classification Accuracy | | 0.701904 |
| Disparate Impact | | 1.123261 |
| Equal Opportunity Difference | | 0.088587 |
| Average Odds Difference | | 0.063342 |
Table 12.
Batch classifier loss per epoch and iteration.
Table 12.
Batch classifier loss per epoch and iteration.
| Epoch | Iteration | Batch Classifier Loss |
|---|
| 0 | 0 | 0.70580 |
| 0 | 200 | 0.66715 |
| 1 | 0 | 0.650785 |
| 1 | 200 | 0.65562 |
| 2 | 0 | 0.621077 |
| 2 | 200 | 0.644446 |
| 3 | 0 | 0.67118 |
| 3 | 200 | 0.626896 |
| 4 | 0 | 0.65285 |
| 4 | 200 | 0.624415 |
| 5 | 0 | 0.63328 |
| 5 | 200 | 0.620738 |
| 6 | 0 | 0.620179 |
| 6 | 200 | 0.594319 |
| 7 | 0 | 0.651884 |
| 7 | 200 | 0.630244 |
| 8 | 0 | 0.620272 |
| 8 | 200 | 0.667881 |
| 9 | 0 | 0.611302 |
| 9 | 200 | 0.591688 |
| 10 | 0 | 0.636031 |
| 10 | 200 | 0.658485 |
| 11 | 0 | 0.617223 |
| 11 | 200 | 0.619085 |
| 12 | 0 | 0.662674 |
| 12 | 200 | 0.65088 |
| 13 | 0 | 0.636364 |
Table 13.
Analysis of smoking status using pack-years.
Table 13.
Analysis of smoking status using pack-years.
| Metric | Pack-Year Categories | Reference |
|---|
| Difference in Mean Outcomes | 0–10 Pack-Years: −0.015 | [40] |
| Difference in Mean Outcomes | 10–20 Pack-Years: −0.025 | [41] |
| Difference in Mean Outcomes | >20 Pack-Years: −0.035 | [42] |
| Increased Cardiovascular Risk (per 5 pack-years) | 15% increase in CVD risk | [43] |
| Improvement in Model Fairness (Post-Debiasing) | +0.012 (Balanced Accuracy) | [44] |
Table 14.
Summary of model metrics.
Table 14.
Summary of model metrics.
| Metric | Value |
|---|
| The difference in mean outcomes (Train set) | 0.030504 |
| Difference in mean outcomes (Test set) | 0.032210 |
| Classification accuracy (Test set) | 0.708524 |
| Balanced classification accuracy (Test set) | 0.708867 |
| Disparate impact (Test set) | 1.081088 |
| Equal opportunity difference (Test set) | 0.037367 |
| Average odds difference (Test set) | 0.026902 |
| Theil index (Test set) | 0.249485 |
Table 15.
Model comparison: plain vs. debiasing.
Table 15.
Model comparison: plain vs. debiasing.
| Metric | Plain Model | Model with Debiasing |
|---|
| Difference in mean outcomes | 0.030504 | −0.417132 |
| (Classification accuracy) | (0.032210) | (−0.424671) |
| Balanced classification accuracy | 0.708867 | 0.613404 |
| Disparate impact | 1.081088 | 0.000000 |
| Equal opportunity difference | 0.037367 | −0.603590 |
| Average odds difference | 0.026902 | −0.425557 |
| Theil_index | 0.249485 | 0.400527 |
Table 16.
Image dataset annotations.
Table 16.
Image dataset annotations.
| Label | x0 | y0 | w | h | Name | Img_Shape_x | Img_Shape_y |
|---|
| heart | 91 | 71 | 77 | 102 | ca112a3c-b701 | 224 | 224 |
| 70 | 64 | 89 | 67 | e5f292ae-f1e5 | 224 | 224 |
| 82 | 55 | 81 | 76 | 67af68f7-7ba0 | 224 | 224 |
| 93 | 74 | 78 | 89 | 814289a3-9ce8 | 224 | 224 |
| 85 | 61 | 85 | 93 | e508969f-c931 | 224 | 224 |
Table 17.
Performance metrics for AI-driven cardiovascular imaging (Dice, IoU, and Kappa scores).
Table 17.
Performance metrics for AI-driven cardiovascular imaging (Dice, IoU, and Kappa scores).
| Image | Dice Score | IoU Score | Kappa Score |
|---|
| Image 1 | 0.980 | 0.96 | 0.98 |
| Image 2 | 0.971 | 0.94 | 0.97 |
| Image 3 | 0.941 | 0.91 | 0.95 |
| Image 4 | 0.980 | 0.92 | 0.95 |
| Image 5 | 0.941 | 0.92 | 0.95 |
| Image 6 | 0.970 | 0.96 | 0.98 |
| Image 7 | 0.971 | 0.94 | 0.97 |
| Image 8 | 0.949 | 0.91 | 0.93 |
| Image 9 | 0.960 | 0.92 | 0.94 |
| Image 10 | 0.980 | 0.92 | 0.95 |
Table 18.
Performance metrics before and after bias mitigation using BPA.
Table 18.
Performance metrics before and after bias mitigation using BPA.
| Group | Metric | Original Value | Adjusted Value |
|---|
| Group 1 (Male) | FPR | 0.0059 | 0.0033 |
| FNR | 0.4575 | 0.4156 |
| Group 2 (Female) | FPR | 0.0096 | 0.0064 |
| FNR | 0.3186 | 0.2829 |
Table 19.
Performance metrics before and after bias mitigation using equalised odds.
Table 19.
Performance metrics before and after bias mitigation using equalised odds.
| Group | Metric | Original Value | Adjusted Value |
|---|
| Group 1 (Male) | FPR | 0.0059 | 0.0052 |
| FNR | 0.4575 | 0.4337 |
| Group 2 (Female) | FPR | 0.0096 | 0.0078 |
| FNR | 0.3186 | 0.3047 |
Table 20.
Comparison of the SIR, SCIR, and other researcher model results.
Table 20.
Comparison of the SIR, SCIR, and other researcher model results.
| | SIR Model | SCIR Model | Ref. | Existing Model |
|---|
| Total Cases | 25 | 30 | [45] | 28 |
| Total Recoveries | 20.776 | 41.383 | [46] | 26.5 |
| Recovery Rate | 0.83 | 1.38 | [47] | 0.95 |
| Bias Impact on Transmission Rate | −0.10 | −0.10 | [20] | −0.05 |
Table 21.
Model sensitivity comparison table for fairer diagnostics.
Table 21.
Model sensitivity comparison table for fairer diagnostics.
| Model | Parameter | Value | Result | Additional Info |
|---|
| YOLO | Confidence Threshold | 0.25 | Detections: 3 (Normal, Serious, Abnormal) | Conf: 95%, 92%, 78%; IoU: 94.8%, 93.7%, 80.6% |
| YOLO | Confidence Threshold | 0.5 | Detections: 3 (Normal, Serious, Abnormal) | Conf: 95%, 92%, 78%; IoU: 94.4%, 93.4%, 82.6% |
| YOLO | Confidence Threshold | 0.75 | Detections: 3 (Normal, Serious, Abnormal) | Conf: 95%, 92%, 78%; IoU: 94.7%, 94.0%, 83.1% |
| Mask R-CNN | Confidence Threshold | 0.25 | Bounding Boxes: 16 | Scores: [0.4288, 0.4057, 0.3433, 0.2614, …], Stable detection |
| Mask R-CNN | Confidence Threshold | 0.5 | Bounding Boxes: 16 | Scores: [0.4288, 0.4057, 0.3433, 0.2614, …], Stable detection |
| Mask R-CNN | Confidence Threshold | 0.75 | Bounding Boxes: 16 | Scores: [0.4288, 0.4057, 0.3433, 0.2614, …], Stable detection |
| ResNet | Noise Level, Class confidence | 0.01, 0.88 | Prediction: 111, Healthy Heart | Predicted: 111, low noise; Slight noise sensitivity |
| ResNet | Noise Level, Class confidence | 0.05, 0.95 | Prediction: 78, Mild Abnormality | Predicted: 78, moderate noise; Higher sensitivity |
| ResNet | Noise Level, Class confidence | 0.1, 0.95 | Prediction: 78, Severe Abnormality | Predicted: 78, high noise; Stable prediction |
| SCIR Model | Beta, Delta, Gamma | 0.1, 0.05, 0.03 | Initial States: S = 4, C = 4, I = 1, R = 1 | Sensitivity: S reduces to 2.30 at T = 4.08; |
| | | 0.3, 0.1, 0.1 | | Sensitivity: I grows to 1.36 by T = 2.04; R increases to 9.97 by T = 50 |
| | | 0.5, 0.2, 0.15 | | High impact of on Carrier and Recovered states |
| IoU Analysis | IoU@0.5 | - | Avg IoU: normal: 0.974, serious: 1.015, abnormal: 0.893 | High accuracy in bounding overlap |
| IoU Analysis | IoU@0.75 | - | Avg IoU: normal: 0.972, serious: 1.026, abnormal: 0.896 | Accurate bounding, lower on abnormalities |
| IoU Analysis | Avg IoU | - | normal: 0.885, serious: 0.804, abnormal: 0.764 | Better detection on “normal” class |
Table 22.
The state of the art: a consolidated comparison of the performance and fairness metrics between existing methods and our approach.
Table 22.
The state of the art: a consolidated comparison of the performance and fairness metrics between existing methods and our approach.
| Metric | Potential Analysis (Existing Methods) | Novel Analysis (Our Approach) |
|---|
| Accuracy | Traditional models such as logistic regression and support vector machines (SVM) have shown accuracy levels around 75–80% for cardiovascular disease prediction [47]. | Utilising proposed models like the classical ML model and ResNet-18, combined with debiasing techniques, achieved an accuracy of 90–95%, demonstrating a significant improvement in predictive performance. |
| Precision | Commonly ranges between 70–75% for traditional models [46]. | Improved to 85–90% using advanced deep learning models like Yolov5, Mask R-CNN, and ResNet-18 with fairness adjustments and the integration of a unique SCIR model algorithm. |
| Fairness Metrics (Disparate Impact, DI) | Models trained on biased datasets typically show disparities in predictive outcomes, with DI values as low as 0.80 for minority groups [20]. | By implementing fairness-aware algorithms such as adversarial debiasing, capuchin, and Fairlearn, DI improved significantly from 0.80 to 0.95, ensuring equitable performance across demographic groups. |
| Equal Opportunity Difference (EOD) | Commonly observed EOD values for traditional models reached 0.20, indicating substantial disparities in opportunity [47]. | EOD reduced to 0.05 with the use of fairness-aware techniques, reflecting improved equity in model predictions. |
| Recovery Rate (SCIR vs. SIR) | Standard compartmental models like SIR often exhibit recovery rates of around 0.83, with limited adaptability for demographic-sensitive fairness adjustments [47]. | The SCIR model achieved a recovery rate of 1.38, outperforming SIR, particularly under sensitivity conditions (), improving outcomes for underserved populations. |
| Robustness (Perturbation Sensitivity) | Sensitivity to minor input variations is often overlooked in traditional models, resulting in potential instability [20]. | The SCIR model demonstrated a perturbation sensitivity of 0.0, ensuring consistent predictions and reducing variability-induced bias in cardiovascular diagnostics. |
| Interpretability and Transparency | Many standard models lack transparency, making it difficult to understand the decision-making process [7]. | Enhanced through the application of local interpretable model-agnostic explanation (LIME), SHapley Additive exPlanations (SHAP), and class activation maps (CAMs), providing better insights into feature contributions and decision-making areas. |
| Object Localisation (IoU and Dice Scores) | Traditional object localisation methods achieve limited precision, often below 85% IoU [47]. | Advanced segmentation achieved Intersection over Union (IoU) scores of 0.91–0.96 and Dice scores of 0.941–0.980, ensuring high precision in cardiovascular image analysis. |
| Generalisation Across Demographics | Limited cross-validation across diverse demographic groups often results in skewed outcomes [40]. | Demographic stratification during cross-validation ensured fairness across diverse populations, reducing false positive rates (FPRs) from 0.0059 to 0.0033 (male) and 0.0096 to 0.0064 (female). |
Table 23.
Summary of the research on the fairness in cardiovascular health for algorithmic bias.
Table 23.
Summary of the research on the fairness in cardiovascular health for algorithmic bias.
| Cohort | Validation Standard | Dataset | Demographic Phase | Technique | Outcome | Ref. |
|---|
| Adults aged 40–60 | K-fold cross-validation | MIMIC-III (Image + CSV) | Gender | Logistic Regression | Reduced bias | [50] |
| Patients with hypertension | Holdout validation | Framingham Heart Study (CSV) | ethnicities | Random Forest | Improved accuracy | [51] |
| Diabetic patients | Cross-validation | UK Biobank (Image + CSV) | Socioeconomic Status | SVM | Enhanced fairness | [52] |
| Cardiac arrest survivors | Nested cross-validation | NHANES (CSV) | Age | Neural Network | Balanced outcomes | [53] |
| Heart failure patients | Stratified sampling | Cleveland Heart Disease Dataset (CSV) | Gender | Decision Tree | Reduced disparities | [54] |
| Post-myocardial infarction patients | Leave-one-out cross-validation | Cardiovascular Health Study (CSV) | Ethnicity | XGBoost | Increased fairness | [55] |
| Patients with arrhythmias | Bootstrapping | Multi-Ethnic Study of Atherosclerosis (Image + CSV) | Socioeconomic Status | Ensemble Learning | Improved prediction | [56] |
| Elderly patients | Cross-validation | Stanford Heart Transplant Data (CSV) | ethnicities | Gradient Boosting | Fairer outcomes | [57] |
| Hypertensive adults | Holdout validation | ARIC Study (CSV) | Gender | K-Nearest Neighbors | Reduced bias | [58] |
| Diabetic and hypertensive patients | Nested cross-validation | REGARDS Study (CSV) | Age | Random Forest | Balanced accuracy | [59] |
| Heart disease patients | K-fold cross-validation | Coronary Artery Risk Development in Young Adults (CSV) | Ethnicity | Neural Network | Fairer predictions | [60] |
| Stroke survivors | Stratified sampling | Health and Retirement Study (CSV) | Socioeconomic Status | SVM | Improved fairness | [61] |
| Patients with congenital heart defects | Leave-one-out cross-validation | Bogalusa Heart Study (CSV) | ethnicities | Decision Tree | Reduced disparities | [62] |
| Heart attack patients | Bootstrapping | Jackson Heart Study (CSV) | Gender | XGBoost | Increased accuracy | [63] |
| Atrial fibrillation patients | Cross-validation | Framingham Offspring Study (CSV) | Age | Ensemble Learning | Enhanced outcomes | [64] |
| Patients with valve disorders | Holdout validation | Women’s Health Initiative (CSV) | Ethnicity | Gradient Boosting | Fairer results | [26] |
| Heart disease patients | Nested cross-validation | Cardiovascular Risk in Young Finns Study (CSV) | Socioeconomic Status | K-Nearest Neighbors | Balanced predictions | [65] |
| Elderly cardiac patients | Stratified sampling | MESA (Image + CSV) | Ethnicities | Logistic Regression | Reduced bias | [66] |
| Hypertensive and diabetic patients | Leave-one-out cross-validation | Hispanic Community Health Study (CSV) | Gender | Random Forest | Improved fairness | [67] |
| Stroke and heart attack survivors | Bootstrapping | Strong Heart Study (CSV) | Age | SVM | Balanced outcomes | [68] |
| Patients with coronary artery disease | K-fold cross-validation | National Longitudinal Study of Adolescent to Adult Health (CSV) | Ethnicity | Neural Network | Fairer results | [69] |
Table 24.
Comparison of the fairness of the proposed models with existing researcher’s cardiovascular data.
Table 24.
Comparison of the fairness of the proposed models with existing researcher’s cardiovascular data.
| Model Type | Train Set | Test Set | Authors | Results |
|---|
| Difference in Mean Outcomes | −0.062625 | −0.050994 | Chen et al., 2024 [70] | Reduction in bias |
| Balanced Classification Accuracy | 0.715414 | 0.00 | Varga et al., 2023 [67] | 0.715414 |
| Disparate Impact | 0.891648 | 0.00 | Chen et al 2024 [71] | 0.891648 |
| Equal Opportunity Difference | −0.030241 | 0.00 | Foryciarz et al., 2022 [66] | −0.030241 |
| Average Odds Difference | −0.040829 | 0.00 | Xu et al., 2022 [72] | −0.040829 |
| Theil Index | 0.215282 | 0.00 | Rajkomar et al., 2018 [73] | 0.215282 |
| Model | With Debiasing | Dataset | Liu et al., 2024 [68] | 0.00 |
| Difference in Mean Outcomes | 0.051619 | 0.053275 | Tang et al., 2020 [74] | Reduction in bias |
| Model | With Debiasing | Classification | Patel and Gupta, 2023 [75] | 0.00 |
| Classification Accuracy | 0.701667 | - | Powers 2020 [76] | 0.701667 |
| Balanced Classification Accuracy | 0.701904 | 0.00 | Li et. al., 2024 [77] | 0.701904 |
| Disparate Impact | 1.123261 | 0.00 | Deng et al., 2023 [47] | 1.123261 |
| Equal Opportunity Difference | 0.088587 | 0.00 | Vereen et al., 2008 [78] | 0.088587 |
| Average Odds Difference | 0.063342 | - | kuhn et al., 2013 [79] | 0.063342 |
| Theil Index | 0.240236 | 0.00 | Bishob et al., 2006 [80] | 0.240236 |
Table 25.
Comparative evaluation of ML and DL models for cardiovascular risk prediction.
Table 25.
Comparative evaluation of ML and DL models for cardiovascular risk prediction.
| Model | Predictive Performance | Computational Complexity | Interpretability | Bias Mitigation Potential |
|---|
| Random Forest (RF) [40,81] | High accuracy for structured data; robust in handling demographic variables like gender and smoking status | Relatively low computational complexity; parallelised for faster training | High interpretability with feature importance scores readily available | Flexible in introducing fairness constraints during training; reducing bias |
| ResNet-18 (CNN) [42,82] | Superior accuracy in image-based tasks such as heart failure detection | High computational complexity, requiring GPUs for efficient training and deployment | Low interpretability; LIME and SHAP are required to explain model decisions | Effective when combined with adversarial debiasing strategies; risk of overfitting remains |
| Support Vector Machine (SVM) [83] | Performs well in smaller datasets; limited performance in large-scale image data | Computationally expensive in high-dimensional spaces; slow training in large datasets | Moderate interpretability with well-defined decision boundaries, but less suited for complex interactions | Basic debiasing methods applicable, but more suitable for smaller datasets |
| Gradient Boosting Machine (GBM) [84] | Strong performance across structured data and non-linear relationships | Moderate computational complexity; parallelisation possible but training sequential | High interpretability with detailed feature importance, making it useful in clinical applications | Highly adaptable to fairness constraints; reweighting of under-represented groups effective |


 ,
, 
