
Evaluation of a Vendor-Agnostic Deep Learning Model for Noise Reduction and Image Quality Improvement in Dental CBCT

 ,
,  , ,
, ,  , ,
, ,  and
and
Abstract
1. Introduction
2. Materials and Methods
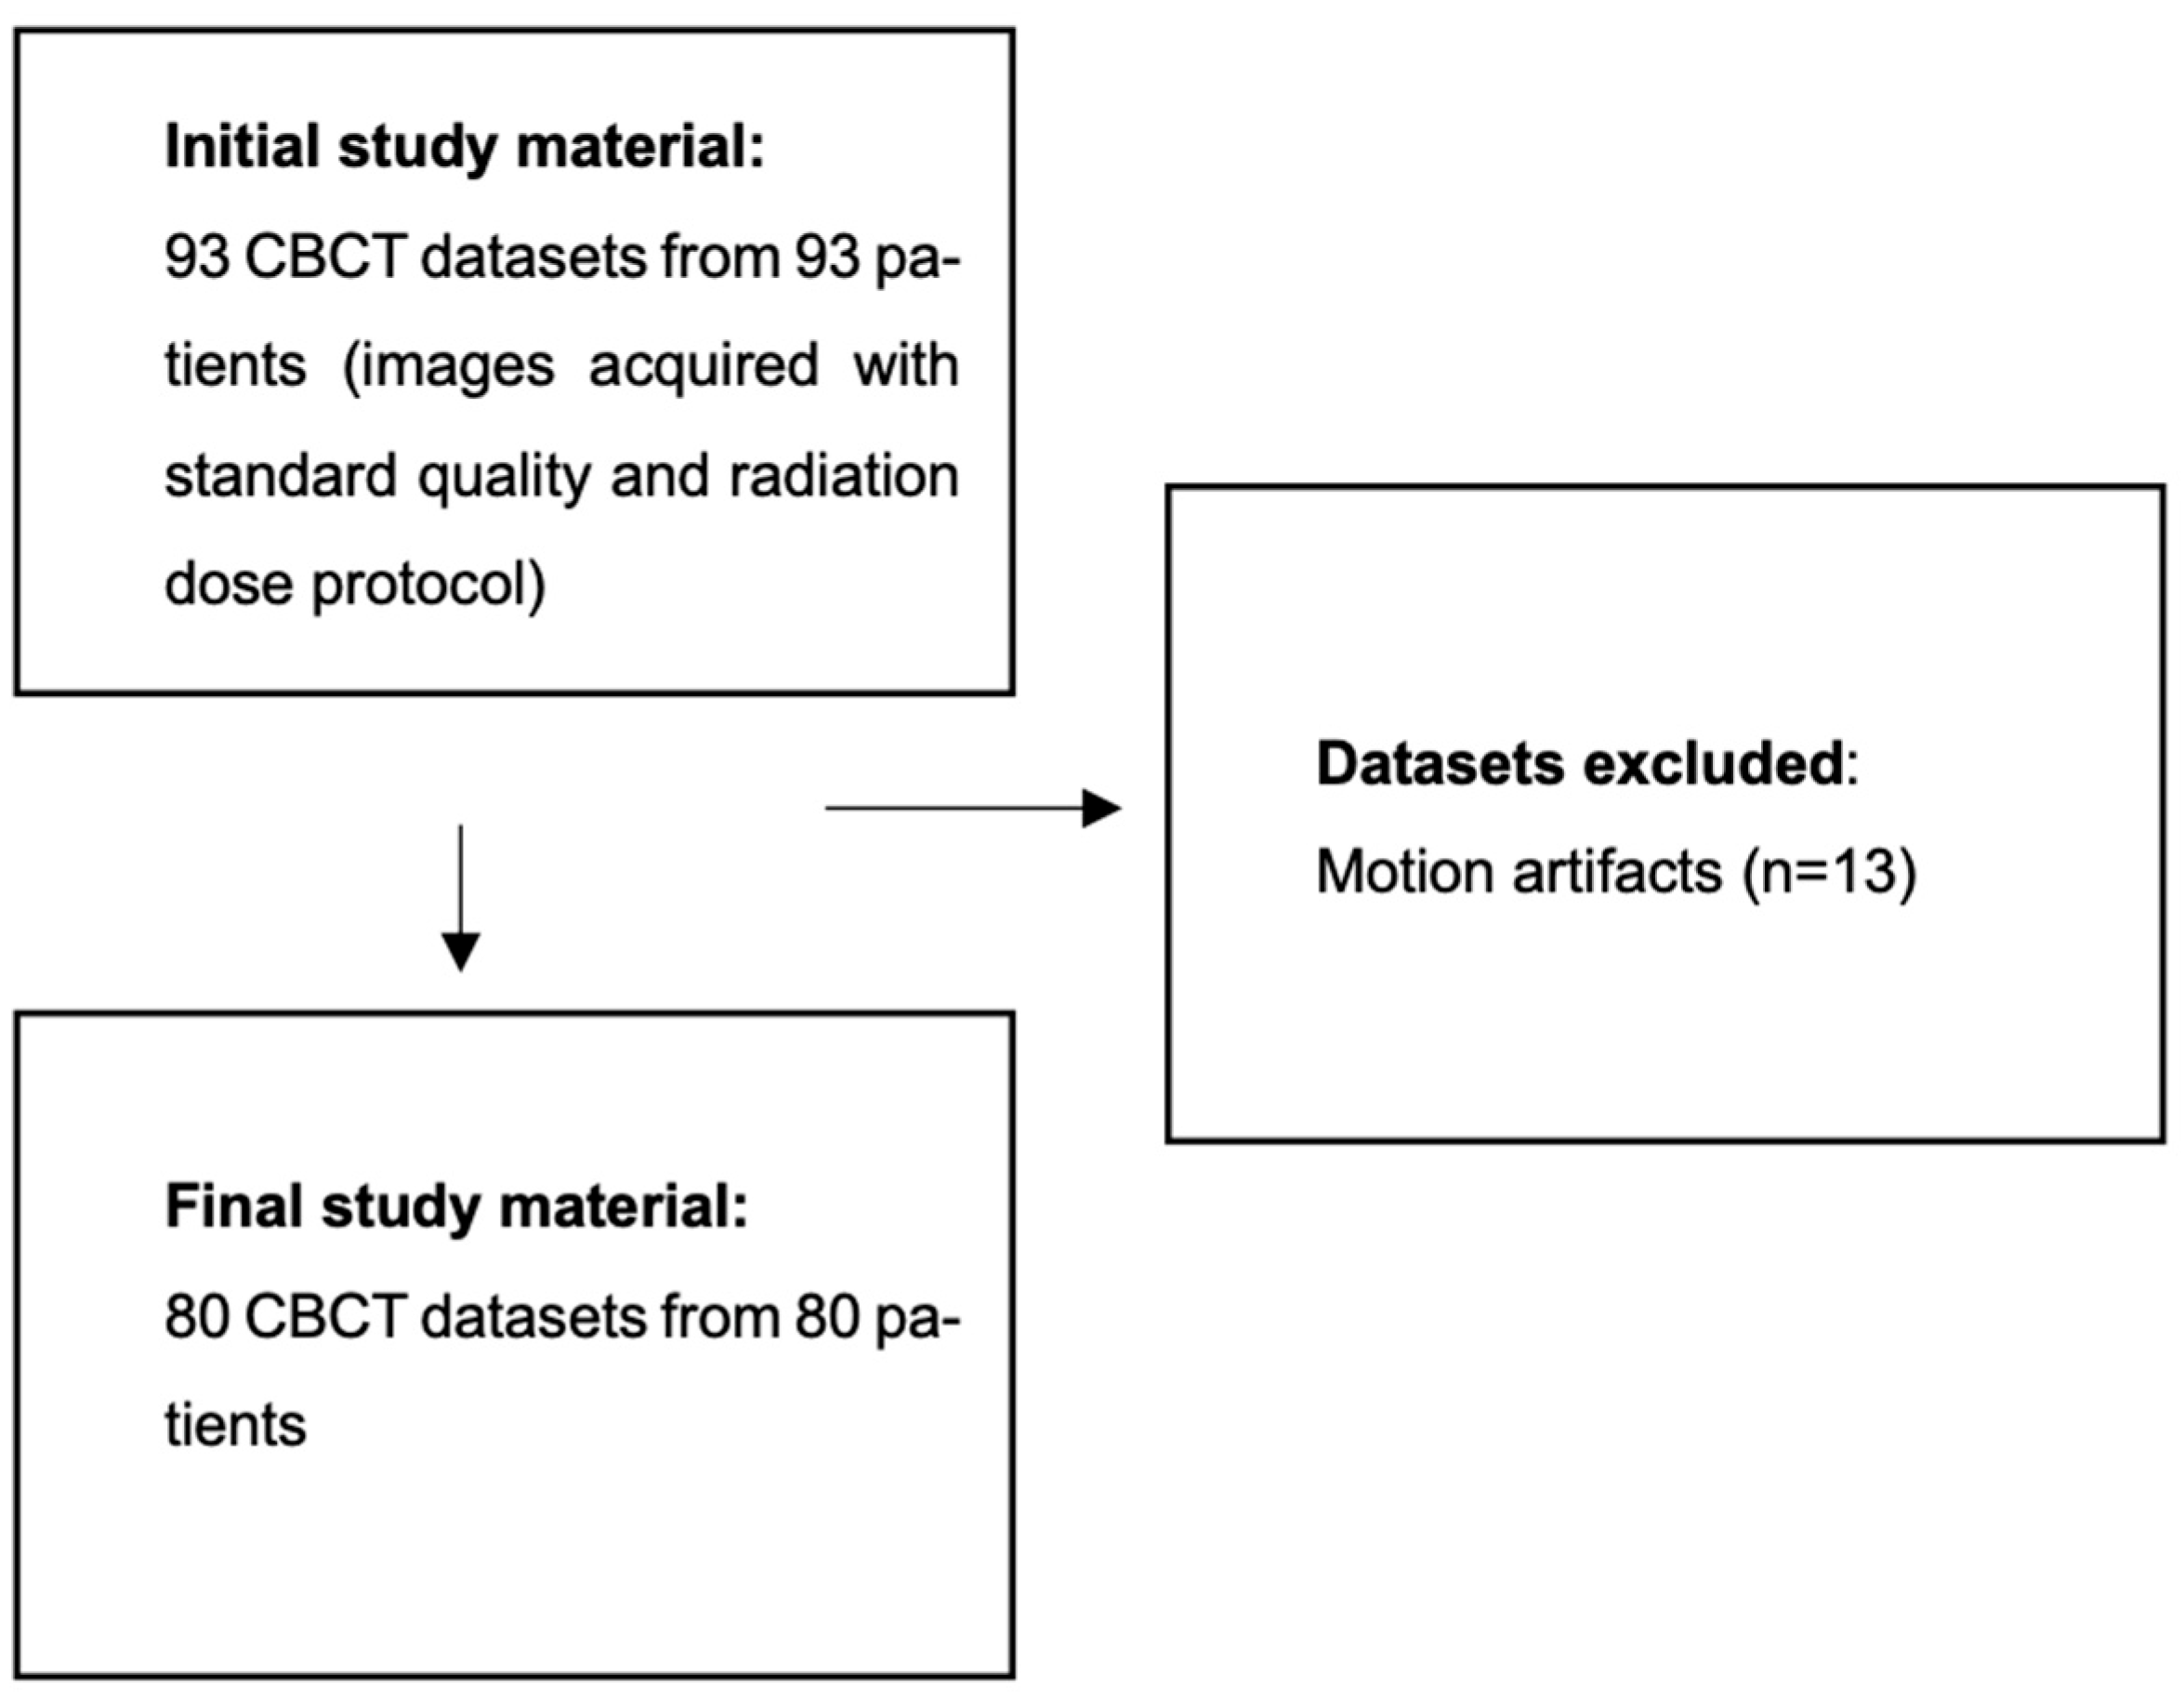
2.1. Population
2.2. Image Acquisition and Postprocessing
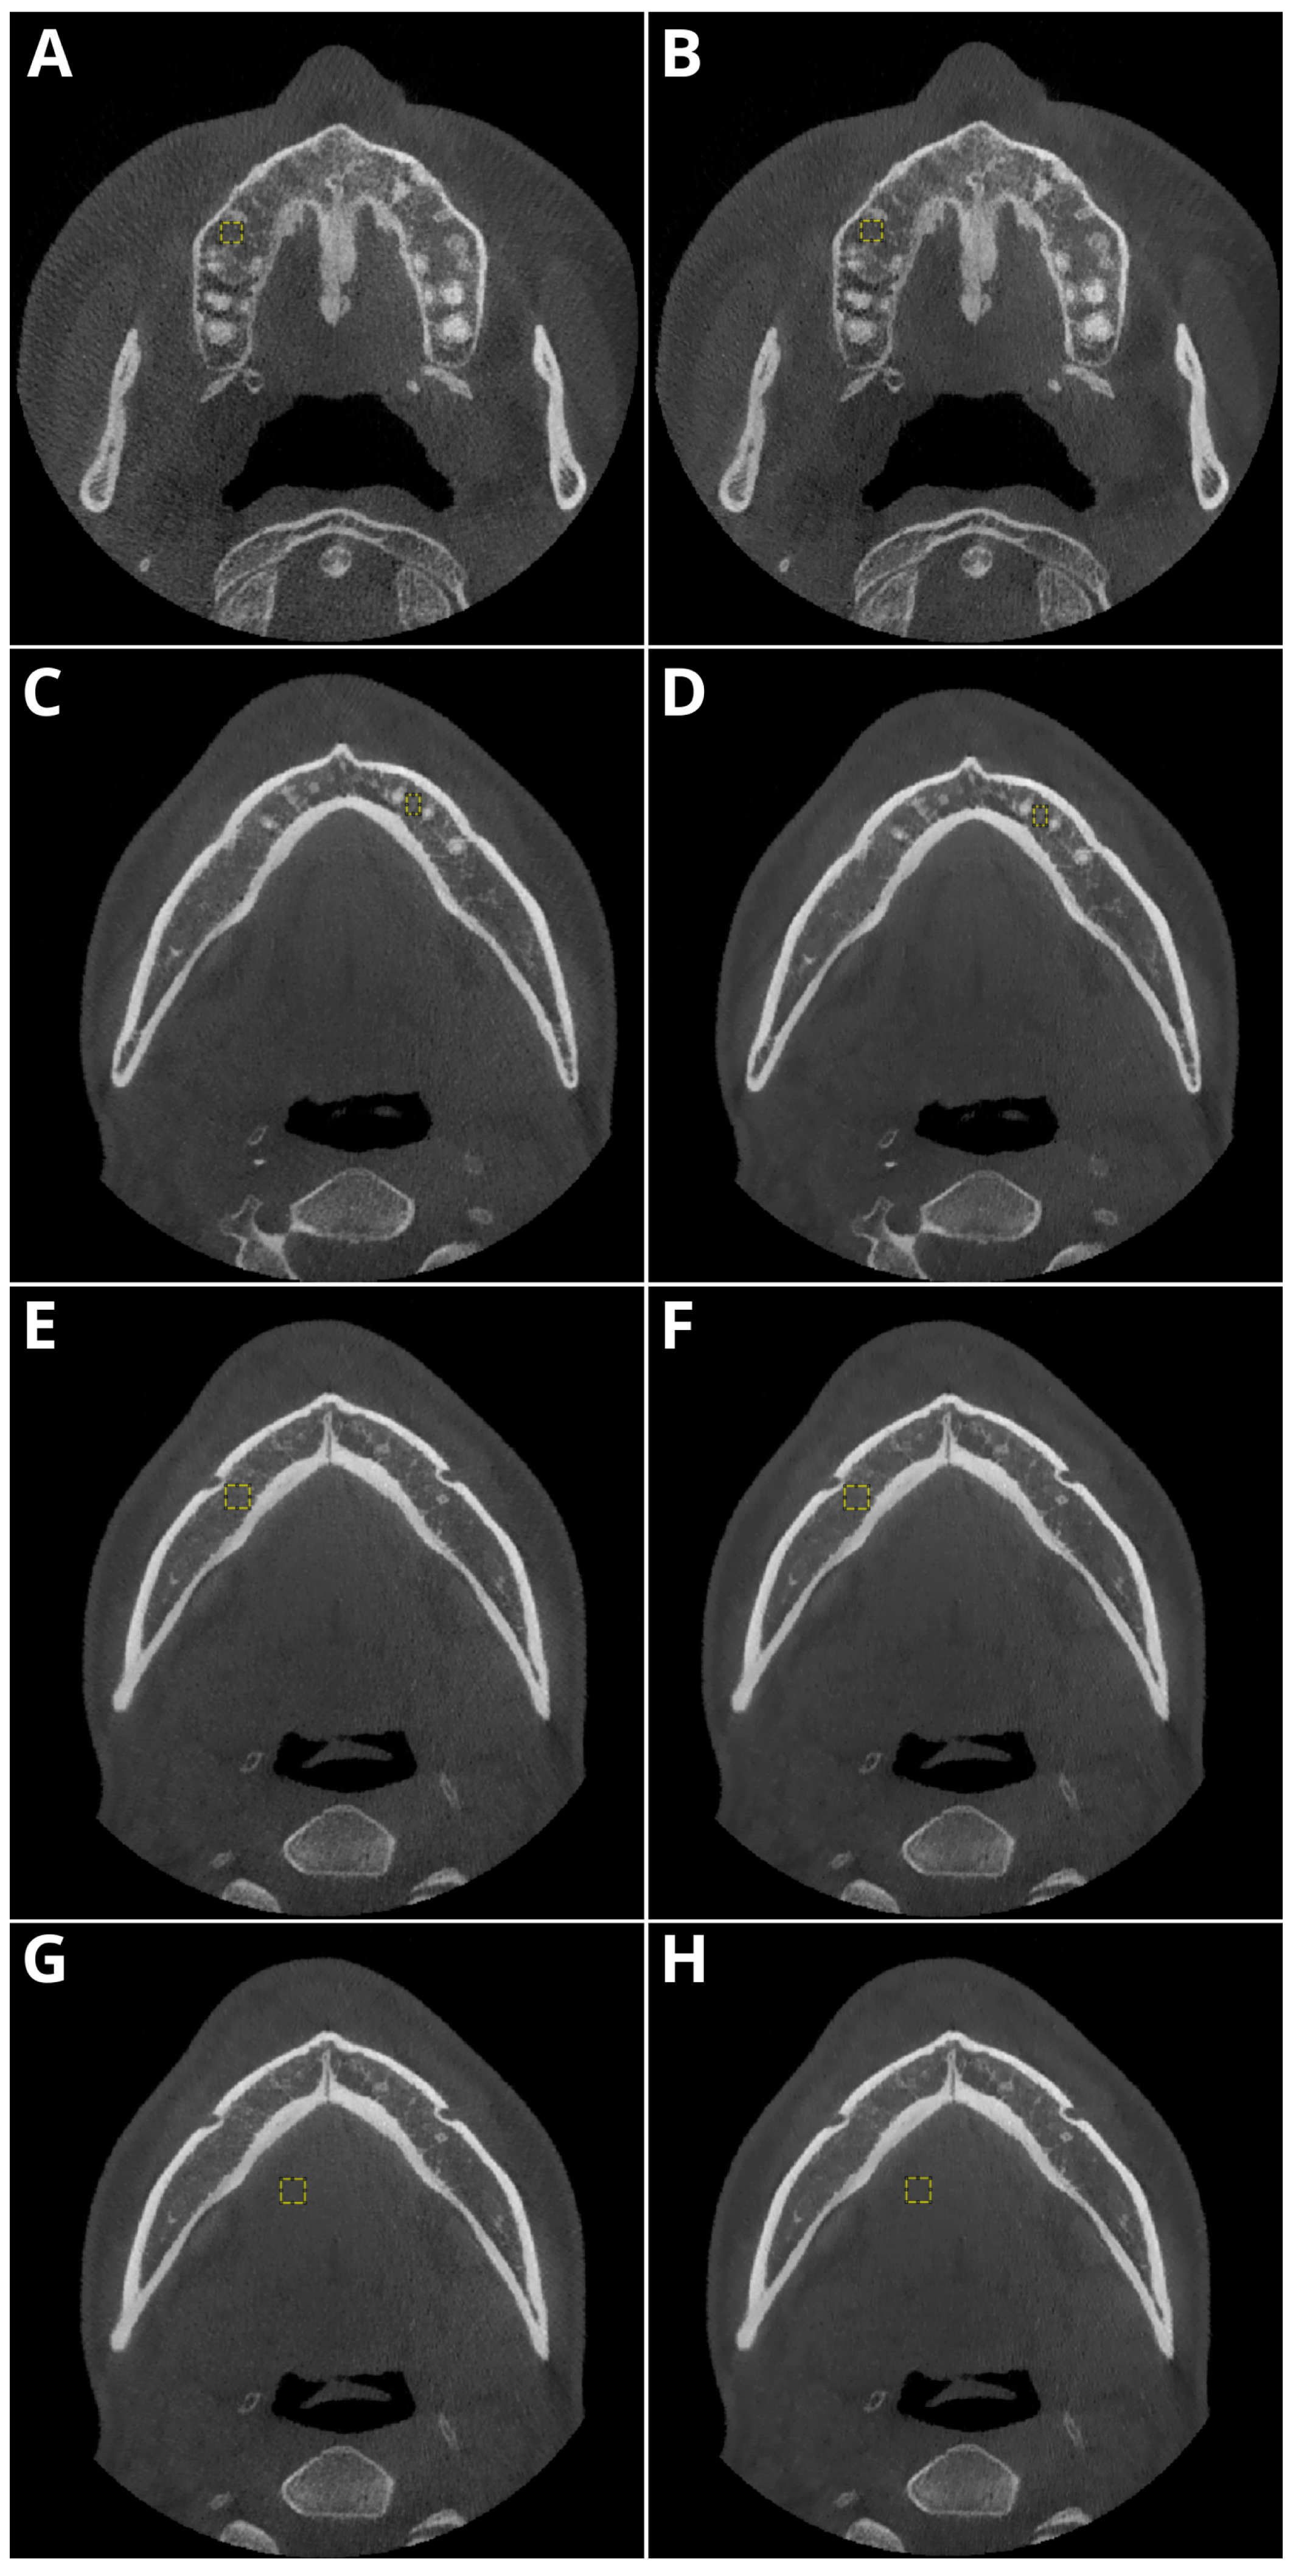
2.3. Objective Image Quality
- Periapical region of tooth 15 within the maxillary bone,
- Periapical region of tooth 33 within the mandible,
- The spongious bone of the mandible in the mental foramen area,
- Muscles of the tongue.
2.4. Subjective Image Quality
2.5. Error Study
2.6. Sample Size Calculation
2.7. Statistical Evaluation
3. Results
3.1. Population
3.2. Objective Image Quality
3.3. Subjective Image Quality
3.4. Error Study
3.5. Sample Size
4. Discussion
5. Conclusions
Author Contributions
Funding
Institutional Review Board Statement
Informed Consent Statement
Data Availability Statement
Conflicts of Interest
References
- Kaasalainen, T.; Ekholm, M.; Siiskonen, T.; Kortesniemi, M. Dental Cone Beam CT: An Updated Review. Phys. Medica 2021, 88, 193–217. [Google Scholar] [CrossRef] [PubMed]
- Fokas, G.; Vaughn, V.M.; Scarfe, W.C.; Bornstein, M.M. Accuracy of Linear Measurements on CBCT Images Related to Presurgical Implant Treatment Planning: A Systematic Review. Clin. Oral Implant. Res. 2018, 29, 393–415. [Google Scholar] [CrossRef] [PubMed]
- Wikner, J.; Hanken, H.; Eulenburg, C.; Heiland, M.; Gröbe, A.; Assaf, A.T.; Riecke, B.; Friedrich, R.E. Linear Accuracy and Reliability of Volume Data Sets Acquired by Two CBCT-Devices and an MSCT Using Virtual Models: A Comparative In-Vitro Study. Acta Odontol. Scand. 2016, 74, 51–59. [Google Scholar] [CrossRef] [PubMed]
- Gaêta-Araujo, H.; Leite, A.F.; de Faria Vasconcelos, K.; Jacobs, R. Two Decades of Research on CBCT Imaging in DMFR—An Appraisal of Scientific Evidence. Dentomaxillofac. Radiol. 2021, 50, 20200367. [Google Scholar] [CrossRef]
- Abesi, F.; Jamali, A.S.; Zamani, M. Accuracy of Artificial Intelligence in the Detection and Segmentation of Oral and Maxillofacial Structures Using Cone-Beam Computed Tomography Images: A Systematic Review and Meta-Analysis. Pol. J. Radiol. 2023, 88, 256–263. [Google Scholar] [CrossRef]
- Oenning, A.C.; Jacobs, R.; Pauwels, R.; Stratis, A.; Hedesiu, M.; Salmon, B. Cone-Beam CT in Paediatric Dentistry: DIMITRA Project Position Statement. Pediatr. Radiol. 2018, 48, 308–316. [Google Scholar] [CrossRef]
- Widmann, G.; Bischel, A.; Stratis, A.; Bosmans, H.; Jacobs, R.; Gassner, E.-M.; Puelacher, W.; Pauwels, R. Spatial and Contrast Resolution of Ultralow Dose Dentomaxillofacial CT Imaging Using Iterative Reconstruction Technology. Dentomaxillofac. Radiol. 2017, 46, 20160452. [Google Scholar] [CrossRef]
- Schulze, R.; Heil, U.; Groß, D.; Bruellmann, D.D.; Dranischnikow, E.; Schwanecke, U.; Schoemer, E. Artefacts in CBCT: A Review. Dentomaxillofac. Radiol. 2011, 40, 265–773. [Google Scholar] [CrossRef]
- Bechara, B.; McMahan, C.A.; Moore, W.S.; Noujeim, M.; Geha, H.; Teixeira, F.B. Contrast-to-Noise Ratio Difference in Small Field of View Cone Beam Computed Tomography Machines. J. Oral Sci. 2012, 54, 227–232. [Google Scholar] [CrossRef]
- Nagarajappa, A.; Dwivedi, N.; Tiwari, R. Artifacts: The Downturn of CBCT Image. J. Int. Soc. Prev. Community Dent. 2015, 5, 440–445. [Google Scholar] [CrossRef]
- Kocasarac, H.D.; Yigit, D.H.; Bechara, B.; Sinanoglu, A.; Noujeim, M. Contrast-to-Noise Ratio with Different Settings in a CBCT Machine in Presence of Different Root-End Filling Materials: An In Vitro Study. Dentomaxillofac. Radiol. 2016, 45, 20160012. [Google Scholar] [CrossRef] [PubMed]
- Geyer, L.L.; Schoepf, U.J.; Meinel, F.G.; Nance, J.W., Jr.; Bastarrika, G.; Leipsic, J.A.; Paul, N.S.; Rengo, M.; Laghi, A.; De Cecco, C.N. State of the Art: Iterative CT Reconstruction Techniques. Radiology 2015, 276, 339–357. [Google Scholar] [CrossRef] [PubMed]
- Van Gompel, G.; Van Slambrouck, K.; Defrise, M.; Batenburg, K.J.; de Mey, J.; Sijbers, J.; Nuyts, J.; Schafer, A.L.; Kazakia, G.J.; Vittinghoff, E.; et al. Iterative Correction of Beam Hardening Artifacts in CT. Med. Phys. 2011, 38, S36–S49. [Google Scholar] [CrossRef] [PubMed]
- Schmidt, A.M.A.; Grunz, J.-P.; Petritsch, B.; Gruschwitz, P.; Knarr, J.; Huflage, H.; Bley, T.A.; Kosmala, A. Combination of Iterative Metal Artifact Reduction and Virtual Monoenergetic Reconstruction Using Split-Filter Dual-Energy CT in Patients with Dental Artifact on Head and Neck CT. Am. J. Roentgenol. 2022, 218, 716–727. [Google Scholar] [CrossRef]
- Gardner, S.J.; Mao, W.; Liu, C.; Aref, I.; Elshaikh, M.; Lee, J.K.; Pradhan, D.; Movsas, B.; Chetty, I.J.; Siddiqui, F. Improvements in CBCT Image Quality Using a Novel Iterative Reconstruction Algorithm: A Clinical Evaluation. Adv. Radiat. Oncol. 2019, 4, 390–400. [Google Scholar] [CrossRef]
- Chen, B.; Xiang, K.; Gong, Z.; Wang, J.; Tan, S. Statistical Iterative CBCT Reconstruction Based on Neural Network. IEEE Trans. Med. Imaging 2018, 37, 1511–1521. [Google Scholar] [CrossRef]
- Washio, H.; Ohira, S.; Funama, Y.; Morimoto, M.; Wada, K.; Yagi, M.; Shimamoto, H.; Koike, Y.; Ueda, Y.; Karino, T.; et al. Metal Artifact Reduction Using Iterative CBCT Reconstruction Algorithm for Head and Neck Radiation Therapy: A Phantom and Clinical Study. Eur. J. Radiol. 2020, 132, 109293. [Google Scholar] [CrossRef]
- Ramage, A.; Lopez Gutierrez, B.; Fischer, K.; Sekula, M.; Santaella, G.M.; Scarfe, W.; Brasil, D.M.; de Oliveira-Santos, C. Filtered Back Projection vs. Iterative Reconstruction for CBCT: Effects on Image Noise and Processing Time. Dentomaxillofac. Radiol. 2023, 52, 20230109. [Google Scholar] [CrossRef]
- Kim, J.H.; Yoon, H.J.; Lee, E.; Kim, I.; Cha, Y.K.; Bak, S.H. Validation of Deep-Learning Image Reconstruction for Low-Dose Chest Computed Tomography Scan: Emphasis on Image Quality and Noise. Korean J. Radiol. 2021, 22, 131–138. [Google Scholar] [CrossRef]
- Tatsugami, F.; Higaki, T.; Nakamura, Y.; Yu, Z.; Zhou, J.; Lu, Y.; Fujioka, C.; Kitagawa, T.; Kihara, Y.; Iida, M.; et al. Deep Learning–Based Image Restoration Algorithm for Coronary CT Angiography. Eur. Radiol. 2019, 29, 5322–5329. [Google Scholar] [CrossRef]
- Greffier, J.; Hamard, A.; Pereira, F.; Barrau, C.; Pasquier, H.; Beregi, J.P.; Frandon, J. Image Quality and Dose Reduction Opportunity of Deep Learning Image Reconstruction Algorithm for CT: A Phantom Study. Eur. Radiol. 2020, 30, 3951–3959. [Google Scholar] [CrossRef] [PubMed]
- Nam, J.G.; Ahn, C.; Choi, H.; Hong, W.; Park, J.; Kim, J.H.; Goo, J.M. Image Quality of Ultralow-Dose Chest CT Using Deep Learning Techniques: Potential Superiority of Vendor-Agnostic Post-Processing over Vendor-Specific Techniques. Eur Radiol 2021, 31. [Google Scholar] [CrossRef] [PubMed]
- Lim, W.H.; Choi, Y.H.; Park, J.E.; Cho, Y.J.; Lee, S.; Cheon, J.-E.; Kim, W.S.; Kim, I.-O.; Kim, J.H. Application of Vendor-Neutral Iterative Reconstruction Technique to Pediatric Abdominal Computed Tomography. Korean J. Radiol. 2019, 20, 1358–1367. [Google Scholar] [CrossRef] [PubMed]
- Choi, H.; Chang, W.; Kim, J.H.; Ahn, C.; Lee, H.; Kim, H.Y.; Cho, J.; Lee, Y.J.; Kim, Y.H. Dose Reduction Potential of Vendor-Agnostic Deep Learning Model in Comparison with Deep Learning–Based Image Reconstruction Algorithm on CT: A Phantom Study. Eur. Radiol. 2022, 32, 1247–1255. [Google Scholar] [CrossRef]
- Hong, J.H.; Park, E.-A.; Lee, W.; Ahn, C.; Kim, J.-H. Incremental Image Noise Reduction in Coronary CT Angiography Using a Deep Learning-Based Technique with Iterative Reconstruction. Korean J. Radiol. 2020, 21, 1165–1177. [Google Scholar] [CrossRef]
- Shin, Y.J.; Chang, W.; Ye, J.C.; Kang, E.; Oh, D.Y.; Lee, Y.J.; Park, J.H.; Kim, Y.H. Low-Dose Abdominal CT Using a Deep Learning-Based Denoising Algorithm: A Comparison with CT Reconstructed with Filtered Back Projection or Iterative Reconstruction Algorithm. Korean J. Radiol. 2020, 21, 356–364. [Google Scholar] [CrossRef]
- Koivisto, J.; van Eijnatten, M.; Ärnstedt, J.J.; Holli-Helenius, K.; Dastidar, P.; Wolff, J. Impact of Prone, Supine and Oblique Patient Positioning on CBCT Image Quality, Contrast-to-Noise Ratio and Figure of Merit Value in the Maxillofacial Region. Dentomaxillofac. Radiol. 2017, 46, 20160418. [Google Scholar] [CrossRef]
- Zou, G.Y. Sample Size Formulas for Estimating Intraclass Correlation Coefficients with Precision and Assurance. Stat. Med. 2012, 31, 3972–3981. [Google Scholar] [CrossRef] [PubMed]
- R Core Team. R: A Language and Environment for Statistical Computing; R Core Team: Vienna, Austria, 2021. [Google Scholar]
- Martins, J.N.R.; Versiani, M.A. CBCT and Micro-CT on the Study of Root Canal Anatomy. In The Root Canal Anatomy in Permanent Dentition; Springer: Berlin/Heidelberg, Germany, 2018. [Google Scholar]
- Brady, S.L.; Trout, A.T.; Somasundaram, E.; Anton, C.G.; Li, Y.; Dillman, J.R. Improving Image Quality and Reducing Radiation Dose for Pediatric CT by Using Deep Learning Reconstruction. Radiology 2021, 298, 180–188. [Google Scholar] [CrossRef]
- AlJehani, Y.A. Diagnostic Applications of Cone-Beam CT for Periodontal Diseases. Int. J. Dent. 2014, 2014, 865079. [Google Scholar] [CrossRef]
- Ylisiurua, S.; Sipola, A.; Nieminen, M.T.; Brix, M.A.K. Deep Learning Enables Time-Efficient Soft Tissue Enhancement in CBCT: Proof-of-Concept Study for Dentomaxillofacial Applications. Phys. Medica 2024, 117, 103184. [Google Scholar] [CrossRef] [PubMed]
- Kazimierczak, W.; Kędziora, K.; Janiszewska-Olszowska, J.; Kazimierczak, N.; Serafin, Z. Noise-Optimized CBCT Imaging of Temporomandibular Joints—The Impact of AI on Image Quality. J. Clin. Med. 2024, 13, 1502. [Google Scholar] [CrossRef] [PubMed]
- Nam, J.G.; Hong, J.H.; Kim, D.S.; Oh, J.; Goo, J.M. Deep Learning Reconstruction for Contrast-Enhanced CT of the Upper Abdomen: Similar Image Quality with Lower Radiation Dose in Direct Comparison with Iterative Reconstruction. Eur. Radiol. 2021, 31, 5533–5543. [Google Scholar] [CrossRef] [PubMed]
- Cheng, Y.; Han, Y.; Li, J.; Fan, G.; Cao, L.; Li, J.; Jia, X.; Yang, J.; Guo, J. Low-Dose CT Urography Using Deep Learning Image Reconstruction: A Prospective Study for Comparison with Conventional CT Urography. Br. J. Radiol. 2021, 94, 20201291. [Google Scholar] [CrossRef]
- Benz, D.C.; Ersözlü, S.; Mojon, F.L.A.; Messerli, M.; Mitulla, A.K.; Ciancone, D.; Kenkel, D.; Schaab, J.A.; Gebhard, C.; Pazhenkottil, A.P.; et al. Radiation Dose Reduction with Deep-Learning Image Reconstruction for Coronary Computed Tomography Angiography. Eur. Radiol. 2022, 32, 2620–2628. [Google Scholar] [CrossRef]
- Racine, D.; Brat, H.G.; Dufour, B.; Steity, J.M.; Hussenot, M.; Rizk, B.; Fournier, D.; Zanca, F. Image Texture, Low Contrast Liver Lesion Detectability and Impact on Dose: Deep Learning Algorithm Compared to Partial Model-Based Iterative Reconstruction. Eur. J. Radiol. 2021, 141, 109808. [Google Scholar] [CrossRef]
- Hata, A.; Yanagawa, M.; Yoshida, Y.; Miyata, T.; Tsubamoto, M.; Honda, O.; Tomiyama, N. Combination of Deep Learning-Based Denoising and Iterative Reconstruction for Ultra-Low-Dose CT of the Chest: Image Quality and Lung-RADS Evaluation. Am. J. Roentgenol. 2020, 215, 1321–1328. [Google Scholar] [CrossRef]
- Koetzier, L.R.; Mastrodicasa, D.; Szczykutowicz, T.P.; van der Werf, N.R.; Wang, A.S.; Sandfort, V.; van der Molen, A.J.; Fleischmann, D.; Willemink, M.J. Deep Learning Image Reconstruction for CT: Technical Principles and Clinical Prospects. Radiology 2023, 306, e221257. [Google Scholar] [CrossRef]
- Hegazy, M.A.A.; Cho, M.H.; Lee, S.Y. Image Denoising by Transfer Learning of Generative Adversarial Network for Dental CT. Biomed. Phys. Eng. Express 2020, 6, 055024. [Google Scholar] [CrossRef]
- Hu, Z.; Jiang, C.; Sun, F.; Zhang, Q.; Ge, Y.; Yang, Y.; Liu, X.; Zheng, H.; Liang, D. Artifact Correction in Low-Dose Dental CT Imaging Using Wasserstein Generative Adversarial Networks. Med. Phys. 2019, 46, 1686–1696. [Google Scholar] [CrossRef]
- Hegazy, M.A.A.; Cho, M.H.; Lee, S.Y. Half-Scan Artifact Correction Using Generative Adversarial Network for Dental CT. Comput. Biol. Med. 2021, 132, 104313. [Google Scholar] [CrossRef] [PubMed]
- Choi, K.; Kim, S.H.; Kim, S. Self-Supervised Denoising of Projection Data for Low-Dose Cone-Beam CT. Med. Phys. 2023, 50, 6319–6333. [Google Scholar] [CrossRef] [PubMed]
- Han, Y.-J.; Yu, H.-J. Self-Supervised Noise Reduction in Low-Dose Cone Beam Computed Tomography (CBCT) Using the Randomly Dropped Projection Strategy. Appl. Sci. 2022, 12, 1714. [Google Scholar] [CrossRef]
- Brendlin, A.S.; Dehdab, R.; Stenzl, B.; Mueck, J.; Ghibes, P.; Groezinger, G.; Kim, J.; Afat, S.; Artzner, C. Novel Deep Learning Denoising Enhances Image Quality and Lowers Radiation Exposure in Interventional Bronchial Artery Embolization Cone Beam CT. Acad. Radiol. 2024, 31, 2144–2155. [Google Scholar] [CrossRef]
- Kim, K.; Lim, C.Y.; Shin, J.; Chung, M.J.; Jung, Y.G. Enhanced Artificial Intelligence-Based Diagnosis Using CBCT with Internal Denoising: Clinical Validation for Discrimination of Fungal Ball, Sinusitis, and Normal Cases in the Maxillary Sinus. Comput. Methods Programs Biomed. 2023, 240, 107708. [Google Scholar] [CrossRef]
- Kim, C.; Kwack, T.; Kim, W.; Cha, J.; Yang, Z.; Yong, H.S. Accuracy of Two Deep Learning–Based Reconstruction Methods Compared with an Adaptive Statistical Iterative Reconstruction Method for Solid and Ground-Glass Nodule Volumetry on Low-Dose and Ultra–Low-Dose Chest Computed Tomography: A Phantom Study. PLoS ONE 2022, 17, e0270122. [Google Scholar] [CrossRef]


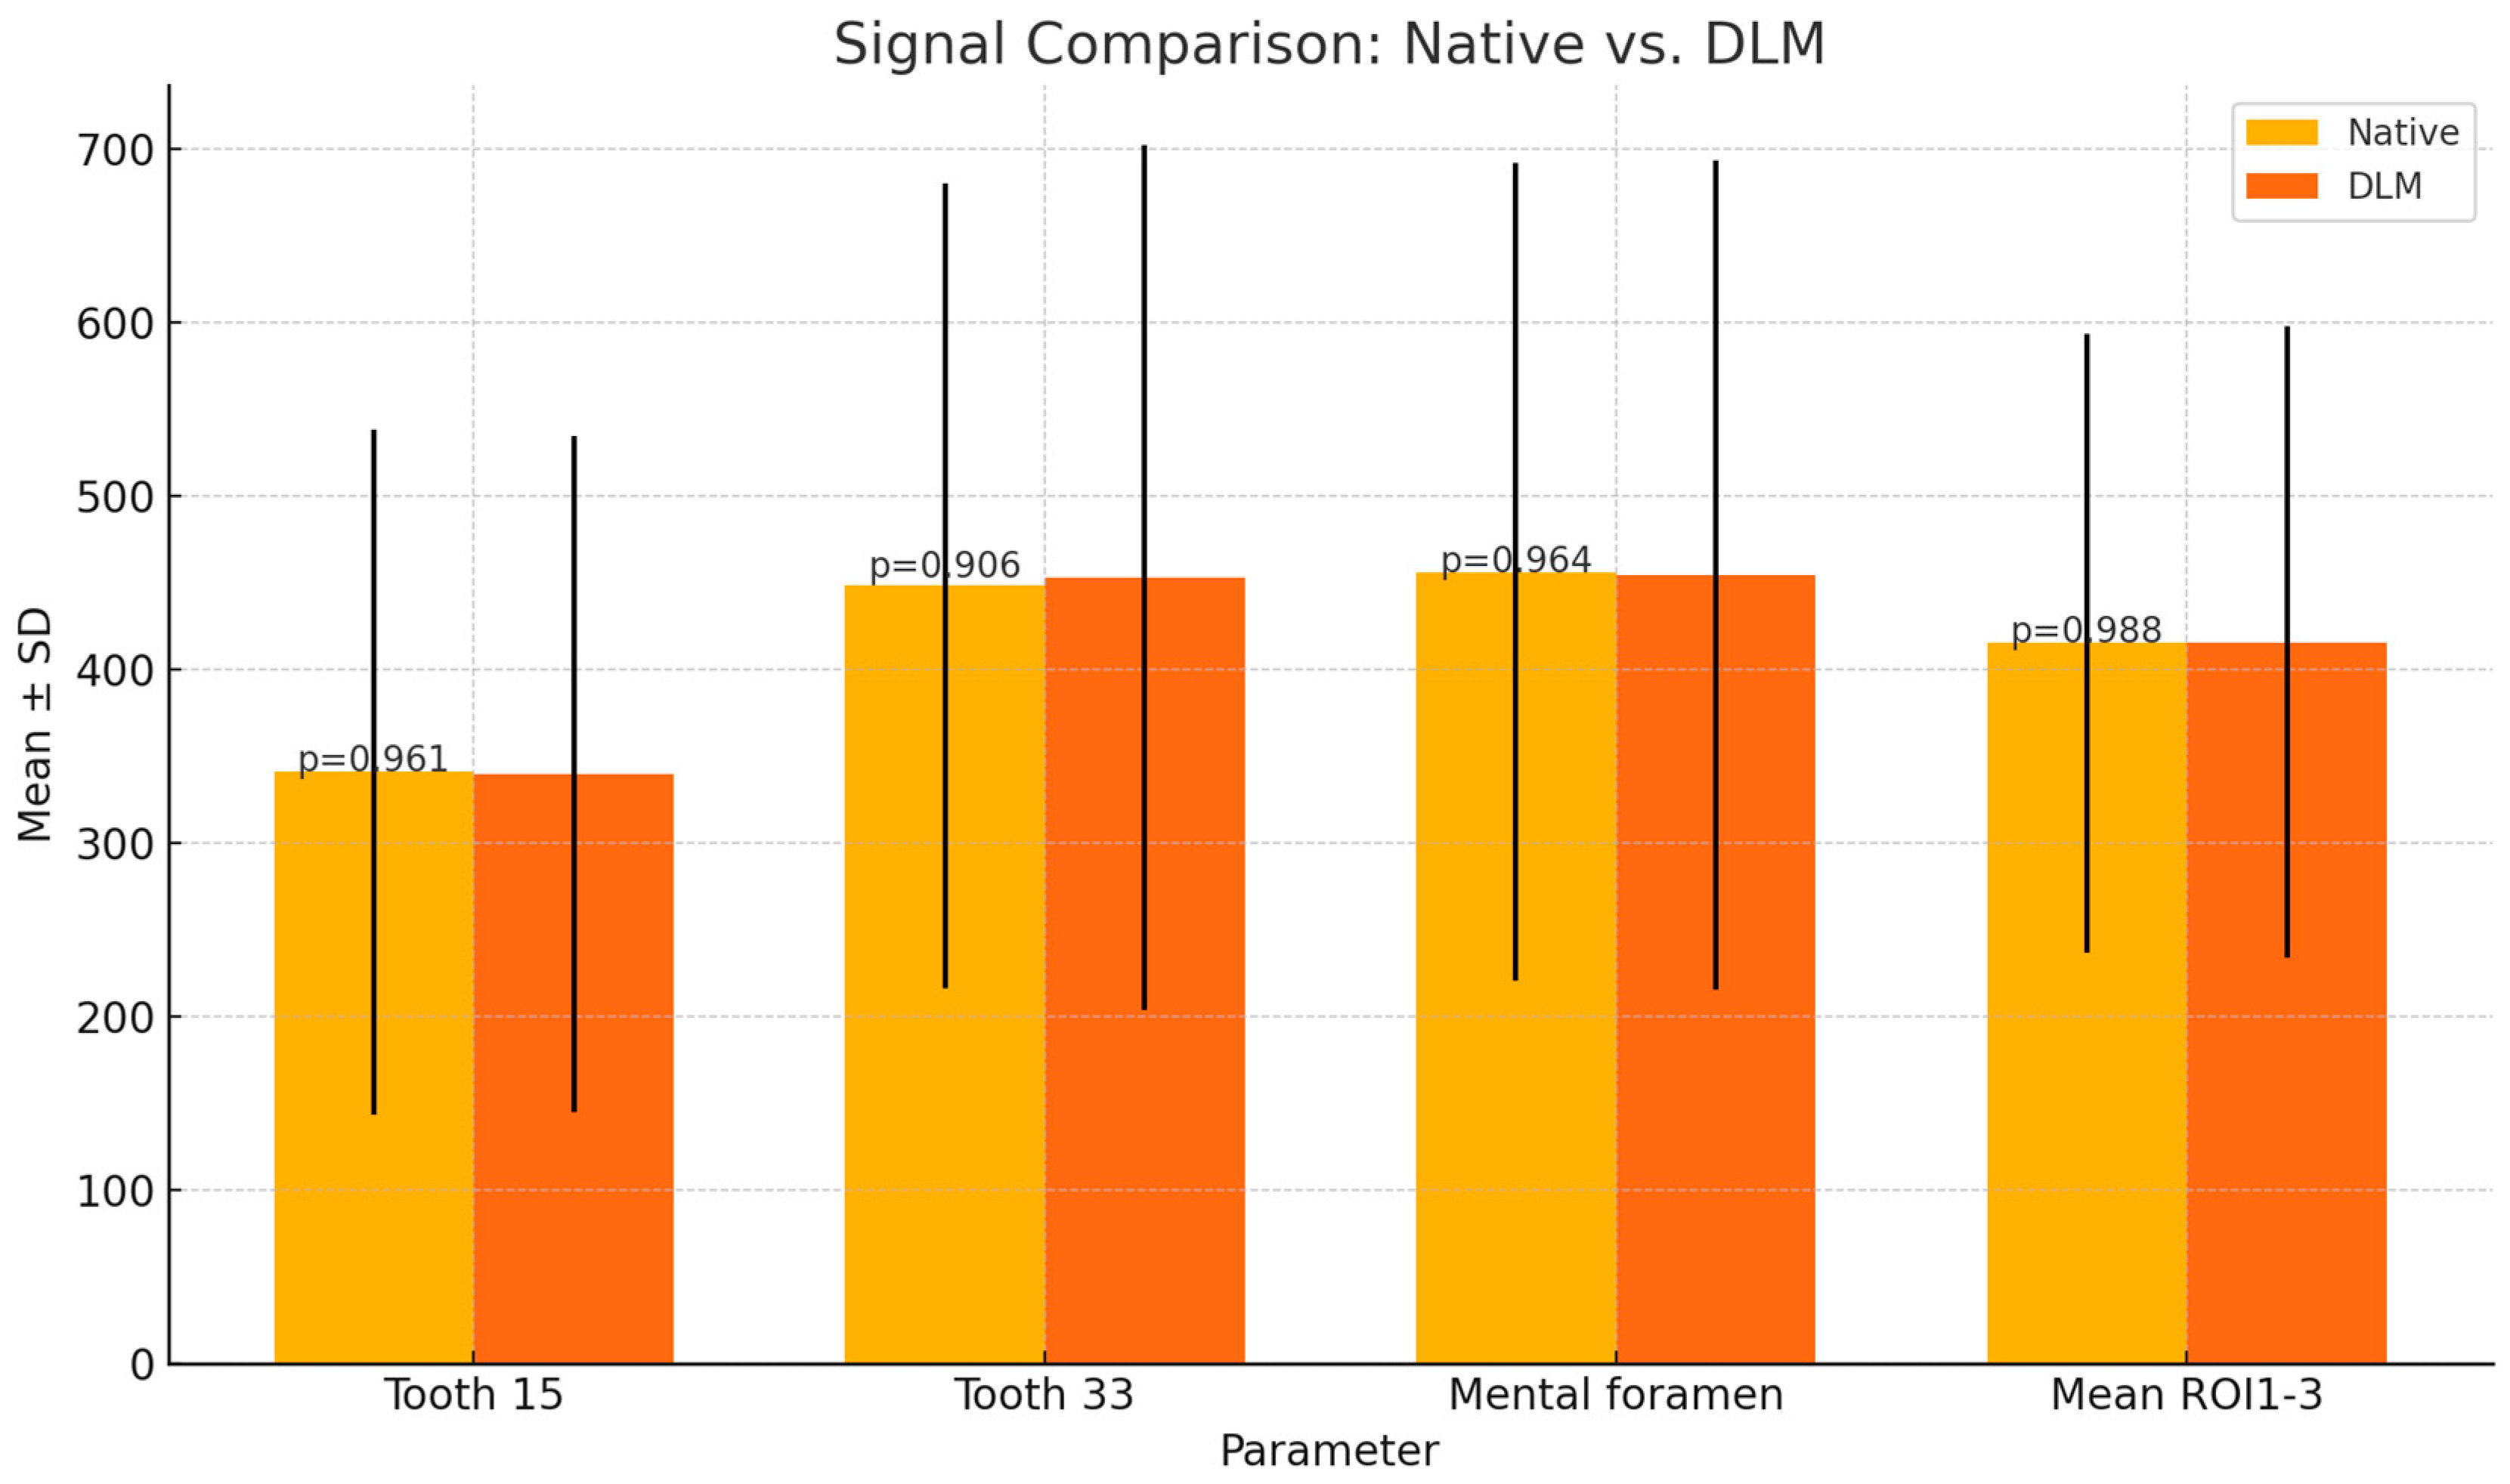
| Parameter | Native | DLM | p | |
|---|---|---|---|---|
| Signal | Tooth 15 | 341 ± 197.60 | 339.91 ± 194.93 | p = 0.961 |
| Tooth 33 | 448.33 ± 232.01 | 452.84 ± 249.1 | p = 0.906 | |
| Mental foramen | 456.15 ± 235.78 | 454.46 ± 238.97 | p = 0.964 | |
| Mean ROI1-3 | 415.3 ± 178.11 | 415.74 ± 181.75 | p = 0.988 | |
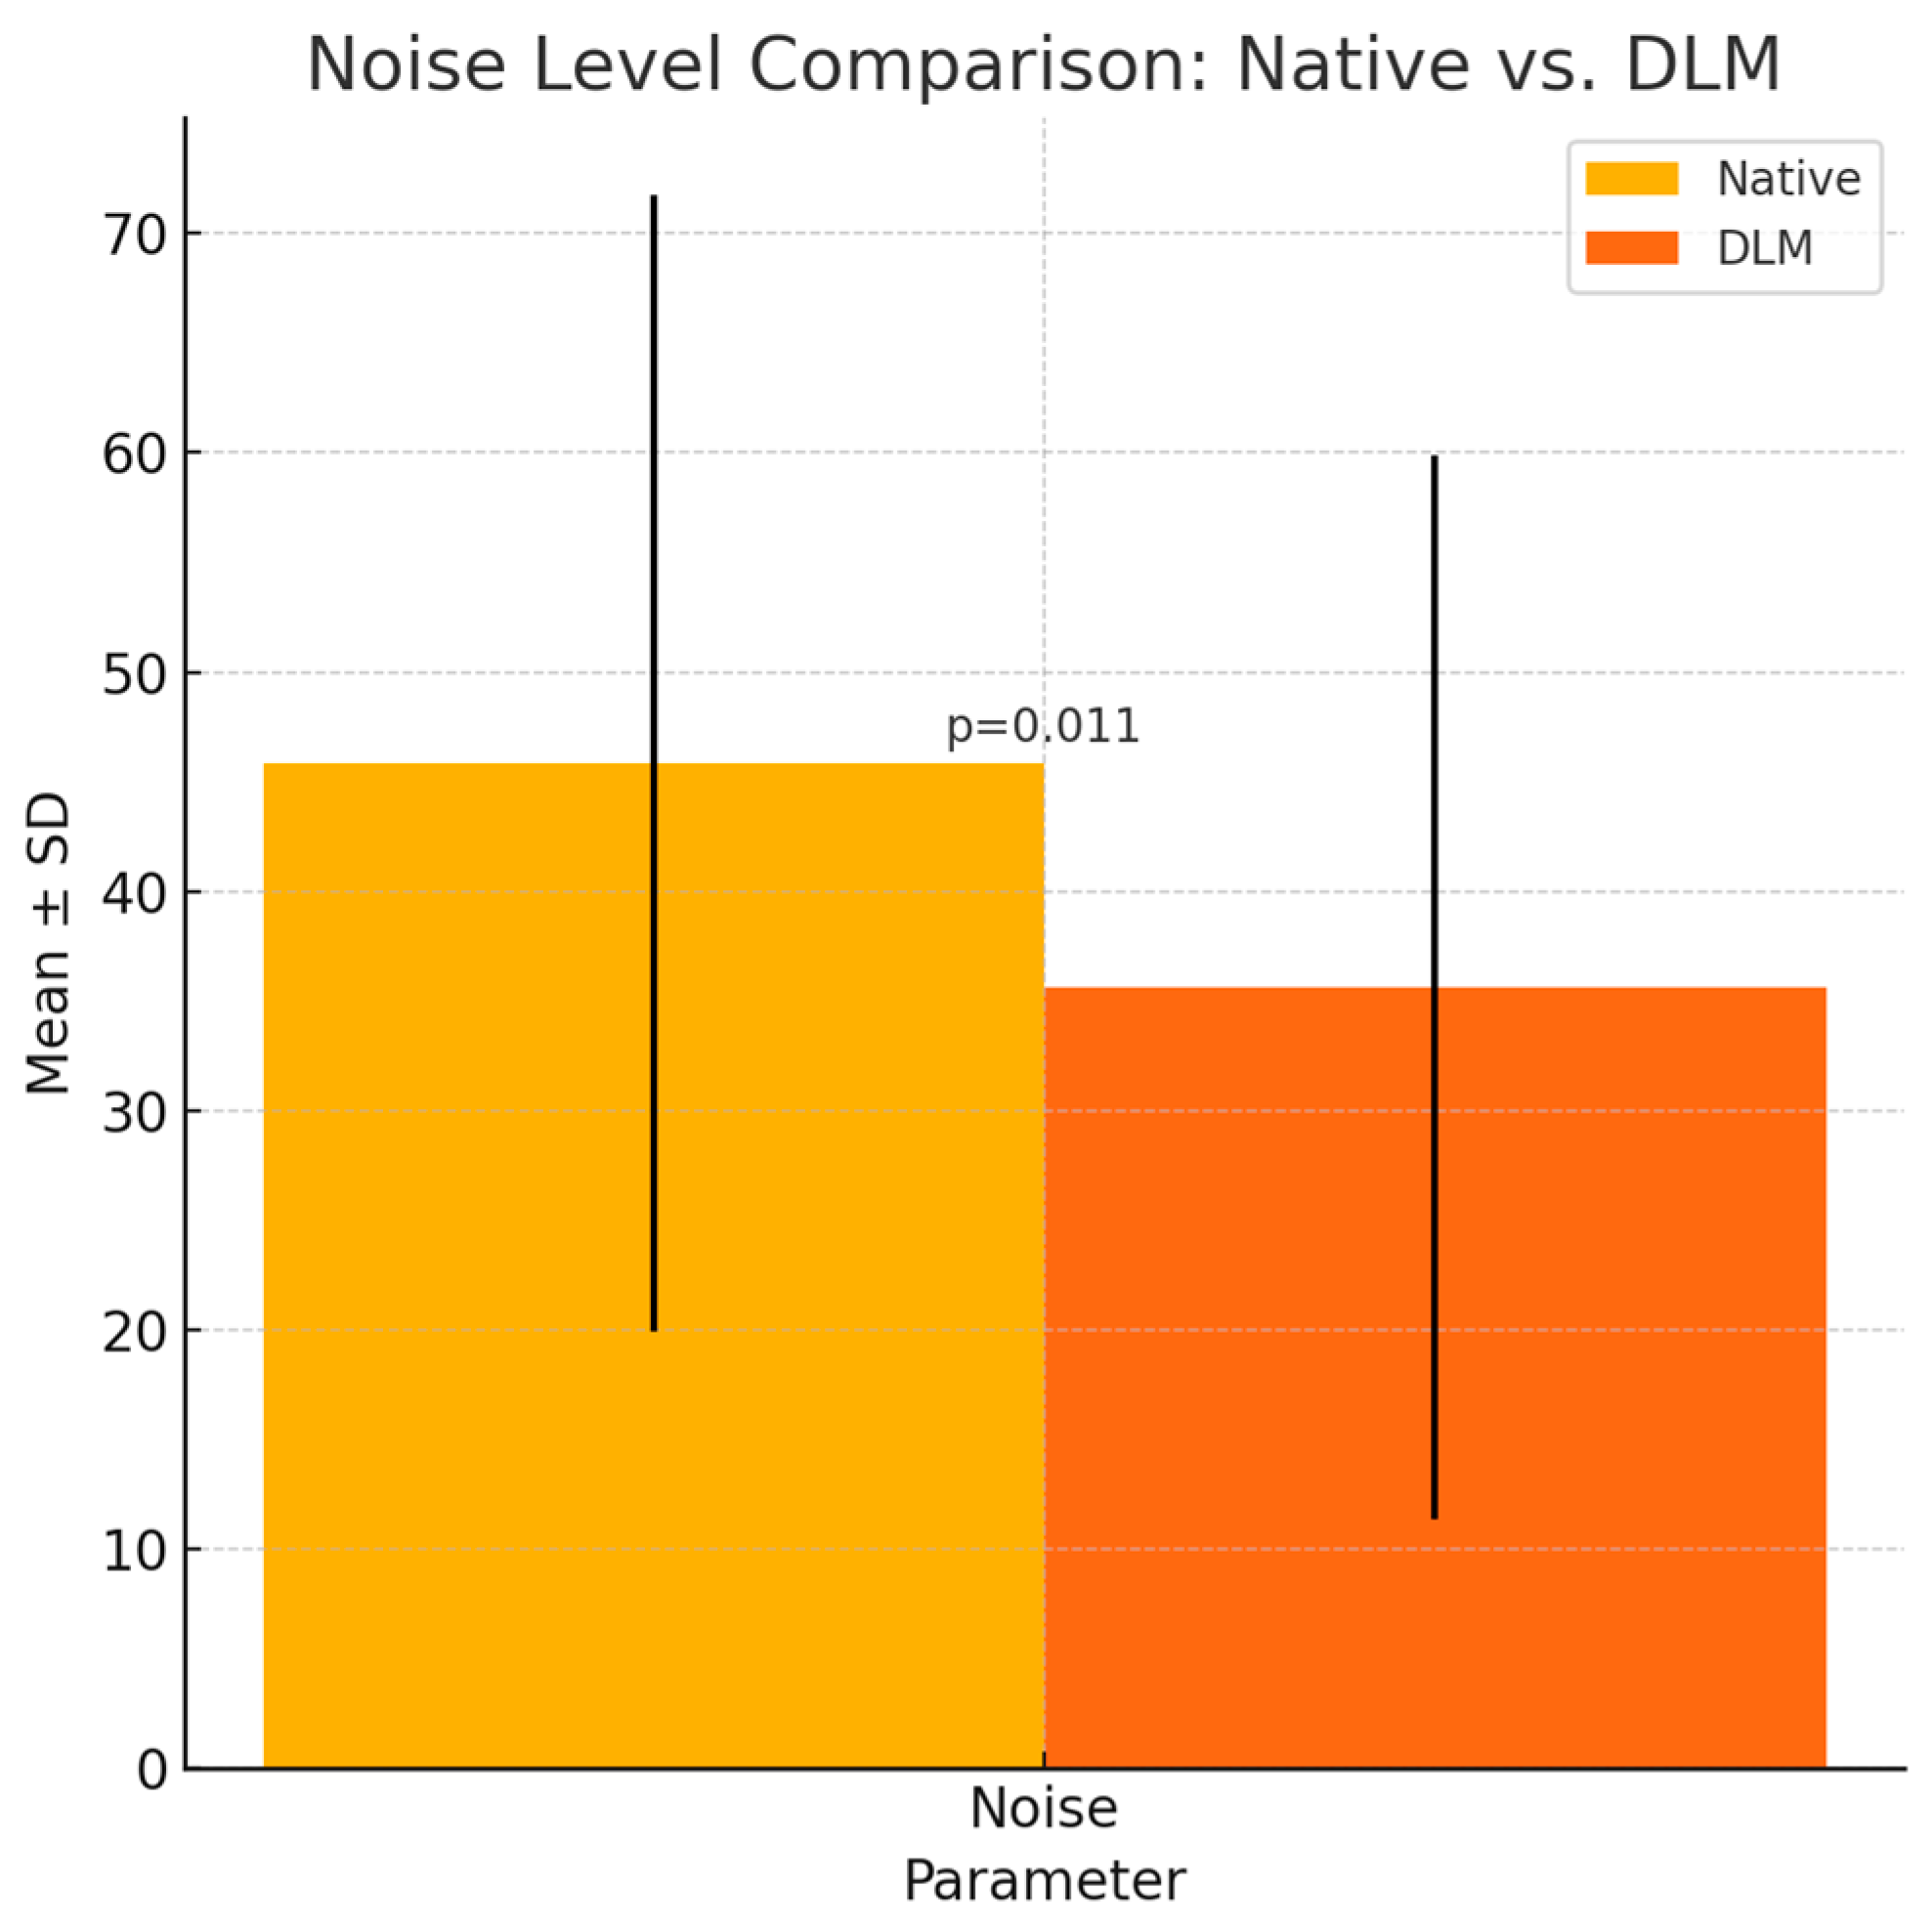
| Noise | 45.83 ± 25.89 | 35.61 ± 24.28 | p = 0.011 * | |
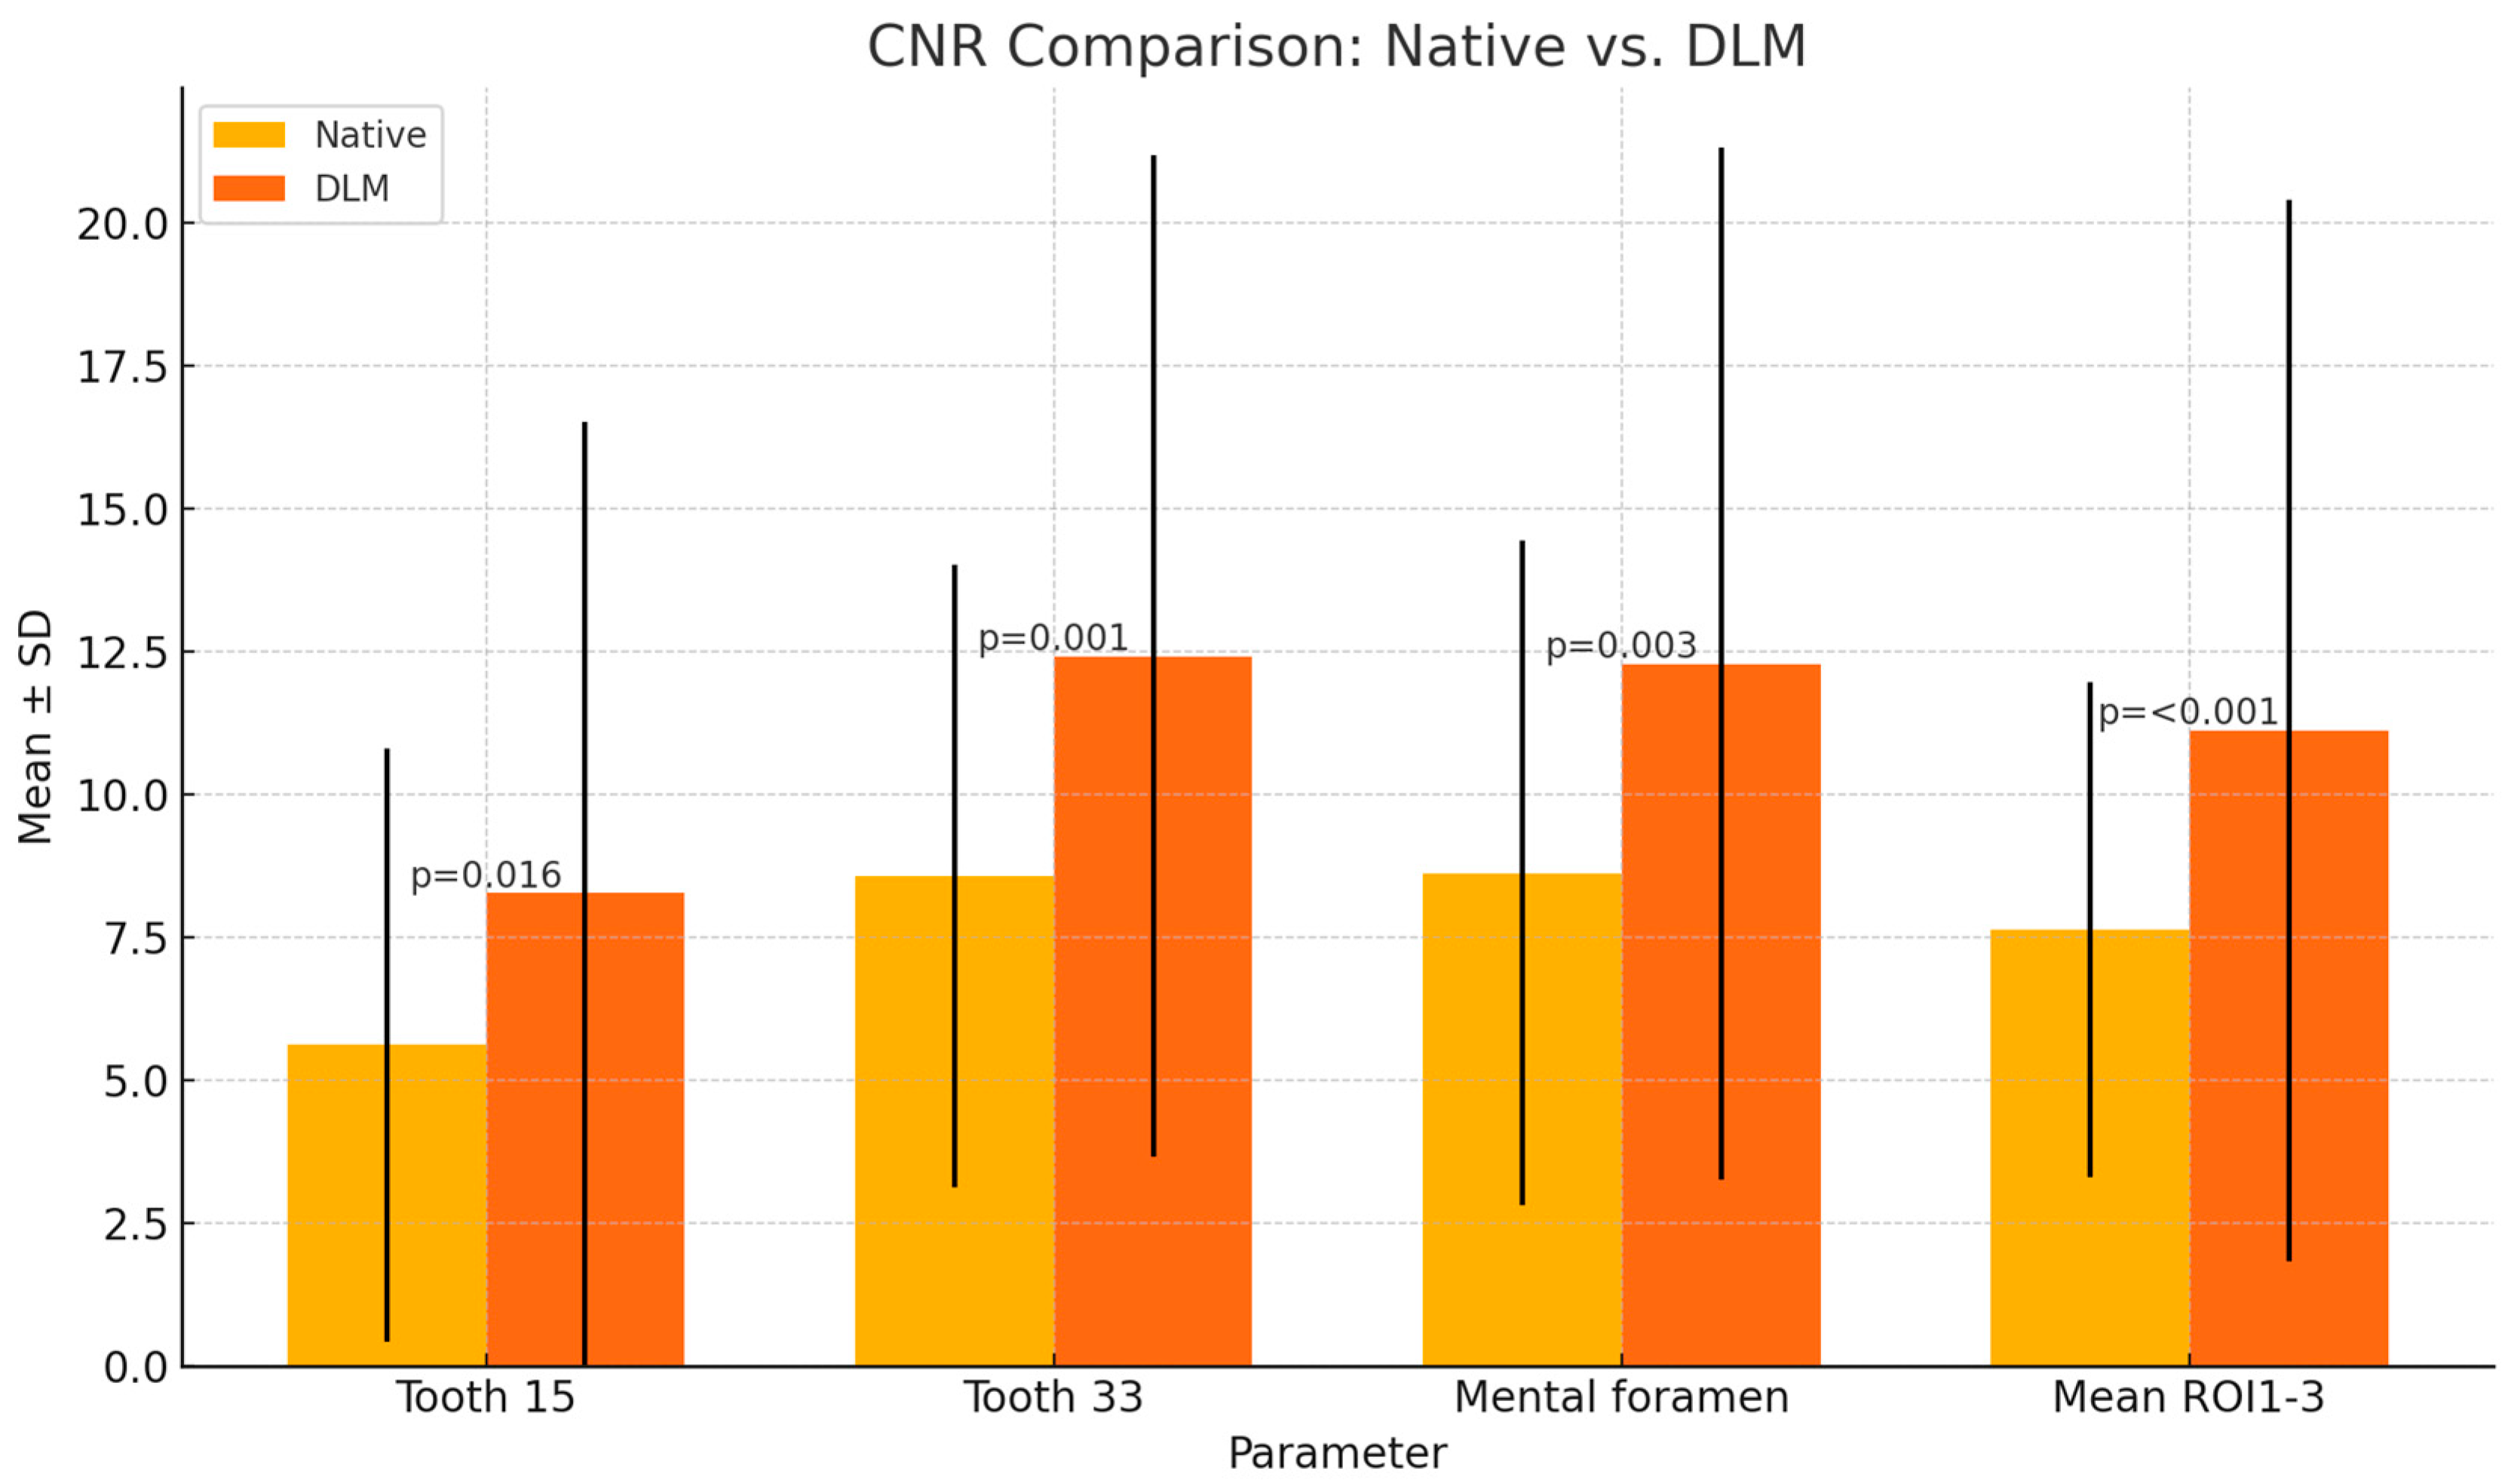
| CNR | Tooth 15 | 5.62 ± 5.19 | 8.28 ± 8.25 | p = 0.016 * |
| Tooth 33 | 8.58 ± 5.45 | 12.42 ± 8.76 | p = 0.001 * | |
| Mental foramen | 8.63 ± 5.81 | 12.29 ± 9.02 | p = 0.003 * | |
| Mean ROI1-3 | 7.64 ± 4.33 | 11.12 ± 9.29 | p < 0.001 * | |
| Region | Native | DLM | p | ||||
|---|---|---|---|---|---|---|---|
| Reader 1 | Reader 2 | Reader 3 | Reader 1 | Reader 2 | Reader 3 | ||
| Maxillary Sinus | 3.25 | 3.26 | 3.36 | 3.34 | 3.25 | 3.55 | 0.350 |
| Apex 15 | 3.23 | 3.25 | 3.48 | 3.18 | 3.25 | 3.40 | 0.674 |
| Apex 33 | 3.49 | 3.46 | 3.52 | 3.55 | 3.45 | 3.66 | 0.529 |
| Region | Reconstruction | ICC | Interpretation |
|---|---|---|---|
| Alveolar recess of maxillary sinus | Native | 0.536 | Moderate Agreement |
| DLM | 0.552 | Moderate Agreement | |
| Apex 15 | Native | 0.628 | Substantial Agreement |
| DLM | 0.628 | Moderate Agreement | |
| Apex 33 | Native | 0.541 | Moderate Agreement |
| DLM | 0.540 | Moderate Agreement |
Disclaimer/Publisher’s Note: The statements, opinions and data contained in all publications are solely those of the individual author(s) and contributor(s) and not of MDPI and/or the editor(s). MDPI and/or the editor(s) disclaim responsibility for any injury to people or property resulting from any ideas, methods, instructions or products referred to in the content. |
© 2024 by the authors. Licensee MDPI, Basel, Switzerland. This article is an open access article distributed under the terms and conditions of the Creative Commons Attribution (CC BY) license (https://creativecommons.org/licenses/by/4.0/).
Share and Cite
Kazimierczak, W.; Wajer, R.; Komisarek, O.; Dyszkiewicz-Konwińska, M.; Wajer, A.; Kazimierczak, N.; Janiszewska-Olszowska, J.; Serafin, Z. Evaluation of a Vendor-Agnostic Deep Learning Model for Noise Reduction and Image Quality Improvement in Dental CBCT. Diagnostics 2024, 14, 2410. https://doi.org/10.3390/diagnostics14212410
Kazimierczak W, Wajer R, Komisarek O, Dyszkiewicz-Konwińska M, Wajer A, Kazimierczak N, Janiszewska-Olszowska J, Serafin Z. Evaluation of a Vendor-Agnostic Deep Learning Model for Noise Reduction and Image Quality Improvement in Dental CBCT. Diagnostics. 2024; 14(21):2410. https://doi.org/10.3390/diagnostics14212410
Chicago/Turabian StyleKazimierczak, Wojciech, Róża Wajer, Oskar Komisarek, Marta Dyszkiewicz-Konwińska, Adrian Wajer, Natalia Kazimierczak, Joanna Janiszewska-Olszowska, and Zbigniew Serafin. 2024. "Evaluation of a Vendor-Agnostic Deep Learning Model for Noise Reduction and Image Quality Improvement in Dental CBCT" Diagnostics 14, no. 21: 2410. https://doi.org/10.3390/diagnostics14212410
APA StyleKazimierczak, W., Wajer, R., Komisarek, O., Dyszkiewicz-Konwińska, M., Wajer, A., Kazimierczak, N., Janiszewska-Olszowska, J., & Serafin, Z. (2024). Evaluation of a Vendor-Agnostic Deep Learning Model for Noise Reduction and Image Quality Improvement in Dental CBCT. Diagnostics, 14(21), 2410. https://doi.org/10.3390/diagnostics14212410