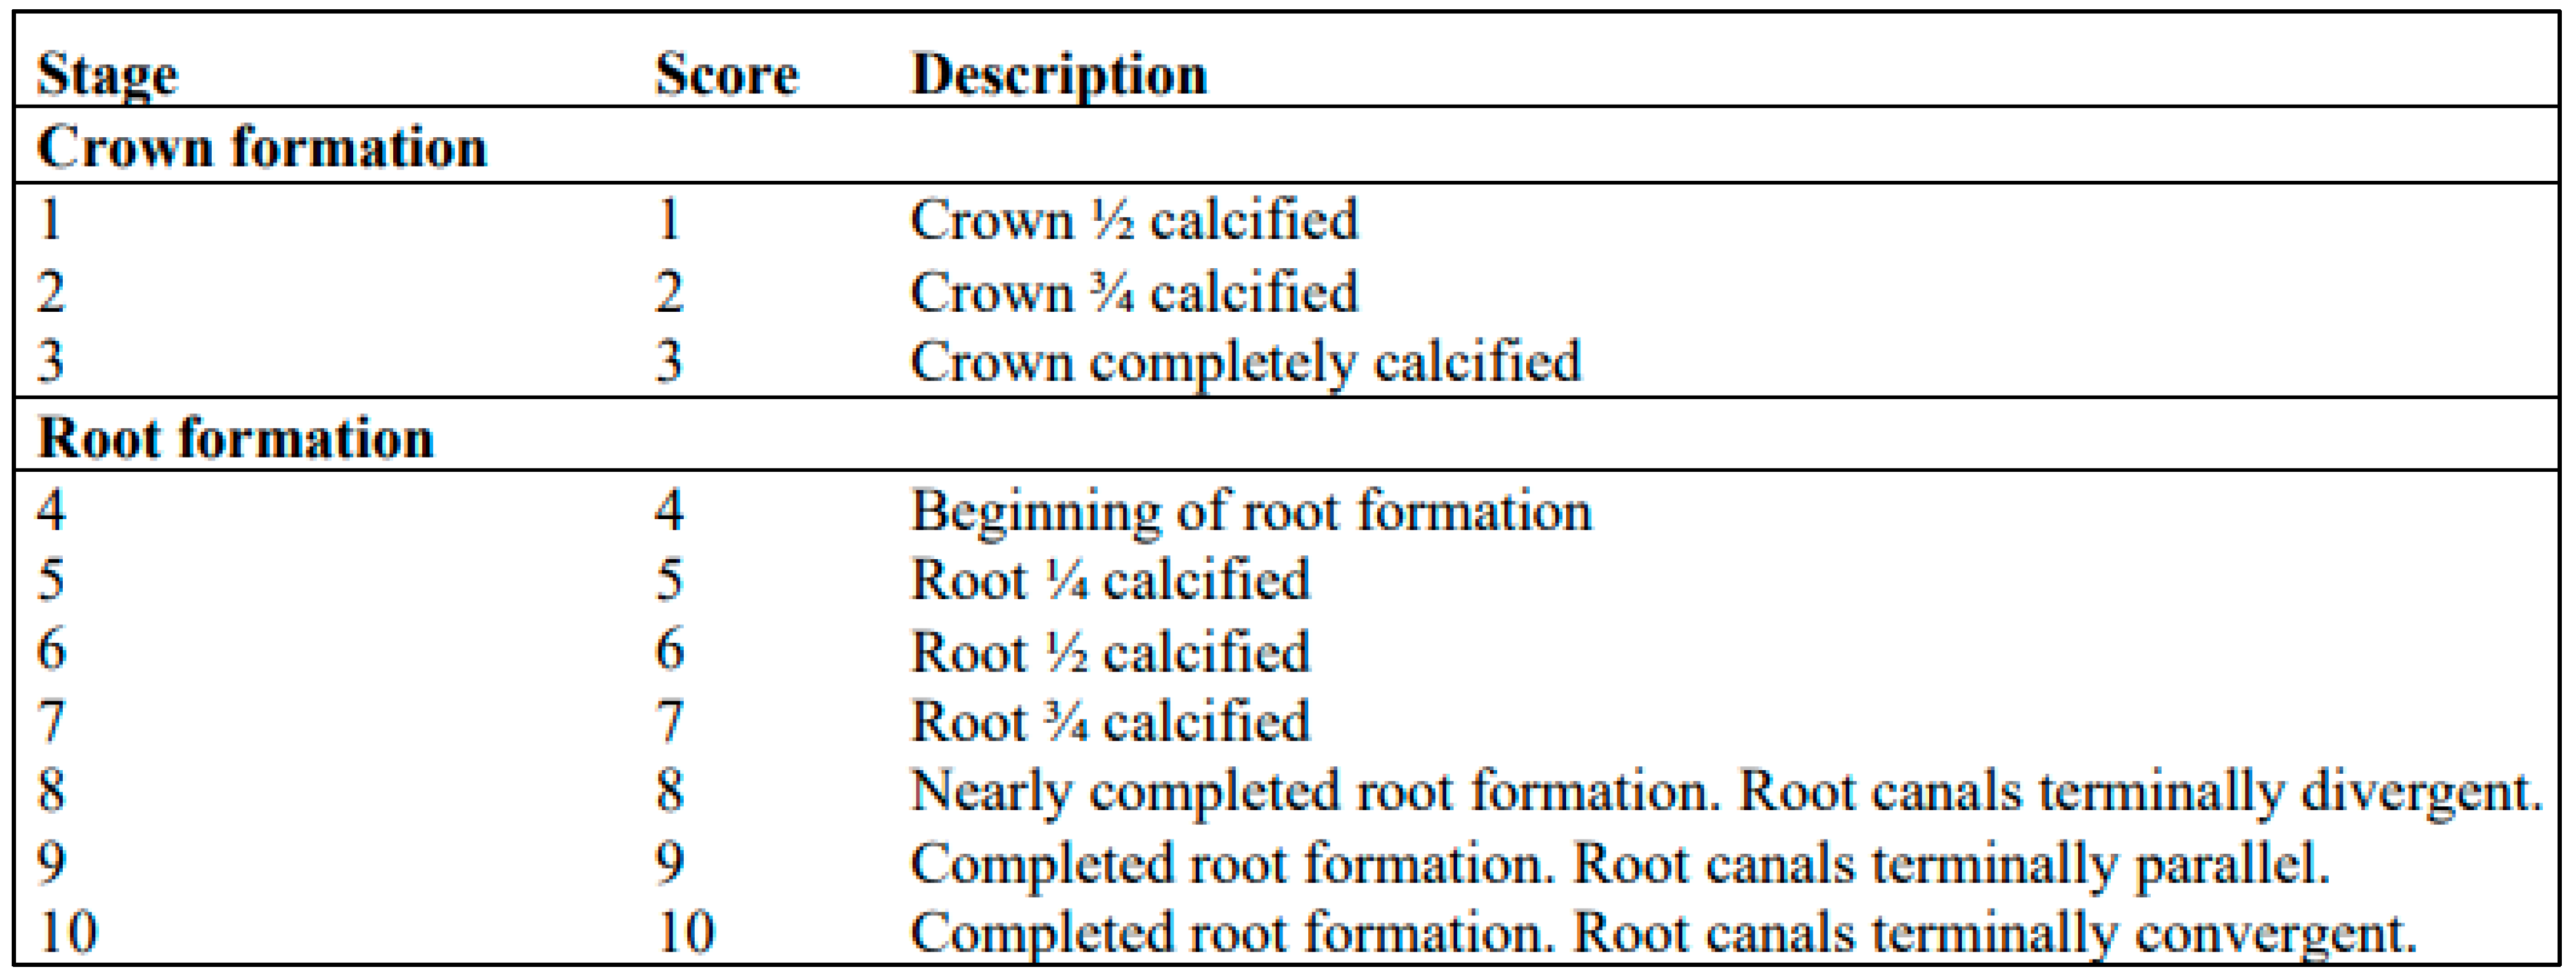
3.1. Analysis of the Developmental Stages of the Third Molars
The intrapersonal agreement was of very good agreement with a 95% CI. The kappa values ranged from 0.91 for the right maxillary third molar to 0.98 for the left mandibular third molar.
Among males aged 18 years and older, a significant majority were in stage nine, which is particularly evident in
Figure 3. Approximately 97.16% of males with a stage nine left third molar were 18 years or older, with similar results for the right mandibular third molar, where 97.08% of those in stage nine were in the same age group. In addition, all males with either the left or right mandibular third molar at stage ten were 18 years or older. Remarkably, differences were observed between mandibular and maxillary third molars at stage eight, as depicted in
Figure 3. For maxillary third molars, the eighth stage occurs in both males aged 18 years and younger and males older than 18 years, whereas for mandibular third molars, it occurs only in males aged 18 years or older. The seventh stage is typically present when most individuals are 18 or older. Stage nine is most common in females aged 18 years and older (
Figure 4). About 95.65% of females with a left third molar in stage nine were 18 years or older. Similarly, about 94.19% of females with the mandibular right third molar in stage nine were in the same age group. Females with either the right or left third molar at stage ten were all 18 years or older. It is noteworthy that there are differences between mandibular and maxillary third molars, especially in the seventh and eighth stages. In the study by Mesotten et al. [
20], 17 males and 24 females under the age of 18 had at least one third molar in the tenth stage. In our study, one male and two females fell into this category, with an average age of 17.69 years, suggesting that third molar development may already be complete.
Statistically significant differences were found between the developmental stages of third molars in females and males (
p < 0.05), meaning that third molar development tends to be more advanced in males than in females, which is consistent with the results of studies by Balla et al. [
32], Scendoni et al. [
33], Mesotten et al. [
20], and Liversidge [
34]. In contrast, Trakinienė et al. [
35] argue that females experience an earlier maturation of the third molars compared to males. In addition, the present study found that the third molars in the maxilla develop significantly faster than the third molars in the mandible (
p < 0.05). Additionally, there were no statistically significant disparities observed between the right and left mandibular or maxillary third molars (
p > 0.05). Consequently, the developmental stages identified were used to estimate age using the equations proposed by Mesotten et al. [
20] (
Table 3). In males, the most accurate estimate was obtained by considering the developmental stage of the mandibular left third molar, which is reflected in the equation y = 13.0664 + 0.8006 × LL, giving an average age of 18.92 years, slightly underestimated by 0.08 years. For females, both equations gave comparable results. By substituting the developmental stage of either the maxillary or mandibular left third molar into the respective equations, we obtained an estimate for females with the equation y = 15.3523 + 0.5452 × LL, resulting in an average age of 19.15 years, with a slight underestimation of 0.23 years. These equations, which take into account the developmental stage of the left third molar, showed the best accuracy in age estimation for both sexes.
Due to the superior accuracy of the equations of Mesotten et al. [
20], especially with respect to the developmental stage of the left mandibular third molar, linear regression equations were then calculated, tailored to this tooth (38M), separately for males and females. Subsequently, both the newly calculated linear regression equations and the equations of Mesotten et al. [
20] were tested on a validation sample (
Table 4). In the case of the Mesotten et al. [
20] equations, the mean difference between the estimated and chronological age was −0.01 years for males and 0.11 years for females. In the equations developed by the authors of the present study, the difference between the mean values was 0.05 years for males and 0.35 years for females. The equation by Mesotten et al. [
20] underestimated the age of males and overestimated the age of females. When using the authors’ equation, the age was slightly overestimated for both males and females.
Subsequently, the validation sample was divided into a group of minors (<18 years) and adults (>18 years) to determine the correct classification into adults or minors based on age calculated from above equations (
Table 5). The results show that the classification of individuals was identical in both cases. The probability of being 18 years and older was 95.24% for females and 14 out of 14 males were correctly classified as adults. In the minor male group, the probability of being 18 years and older was 37.50% and in minor female group it was 40%. Although an error in which adult subjects are incorrectly assigned to the group of minors is not as serious as the assignment of minors to the adult group, some authors (Garamendi et al. [
36]) have discussed the consequences of ethically and technically unacceptable errors. Technically unacceptable errors are associated with false negative results. In this way, subjects over the age of 18 are classified as minors and given preferential treatment by the judicial system. Ethically unacceptable errors are caused by false positives, which means that minors are treated as adults in terms of legal liability. As also stated in the study by Švábová et al. [
37], ethically unacceptable errors should be eliminated and technically unacceptable errors should be reduced. The average age of boys who were misclassified as adults was 17.11 years, relatively close to the age limit of 18 years. Using the equation by the authors, the age in this group was overestimated by 1.08 years, which is lower than Mesotten et al.’s [
20] equation, where the age was overestimated by 1.22 years. For females, the average age of misclassified girls was 15.01 years, which is not as close to the threshold for adulthood (18 years), but the average of the differences between estimated and chronological age is high in the group of minor girls. Using the authors’ equation, the age was overestimated by 3.53 years, which is less than using the equation of Mesotten et al. [
20], where the age was overestimated by 3.62 years. Thus, the combination of the high average age of those misclassified as minors and the high average difference between the estimated and chronological ages may have caused the misclassification of minors into the adult group.
In the classification of females and males into the adult groups, i.e., 18 years of age, a borderline stage of development was identified. The estimated age of 18 years was when using developmental stage seven in the prediction equation for the males, but for the females it was developmental stage five. This suggests that teeth develop faster in males than in females, as also found in studies by Balla et al. [
32], Scendoni et al. [
33], Mesotten et al. [
20] and Liversidge [
34], but in contrast to the results of Trakinienė et al. [
35]. The linear regression equations by both Mesotten et al. [
20] and the authors classified the individuals equally into minor and adult groups. However, when looking at the mean values of the differences between the estimated and chronological ages for the entire group of males or females, regardless of the subdivision into minors and adults, the mean age of the differences is lower when using the Mesotten et al. [
20] equation. When further dividing each group by sex into the minor and adult groups, the mean difference between the estimated and chronological ages using the authors’ equation is lower or closer to zero than the mean age differences using the Mesotten et al. [
20] equations.
The above results of the analysis of the developmental stages of the third molar are presented in a clear flow chart (
Figure 5).
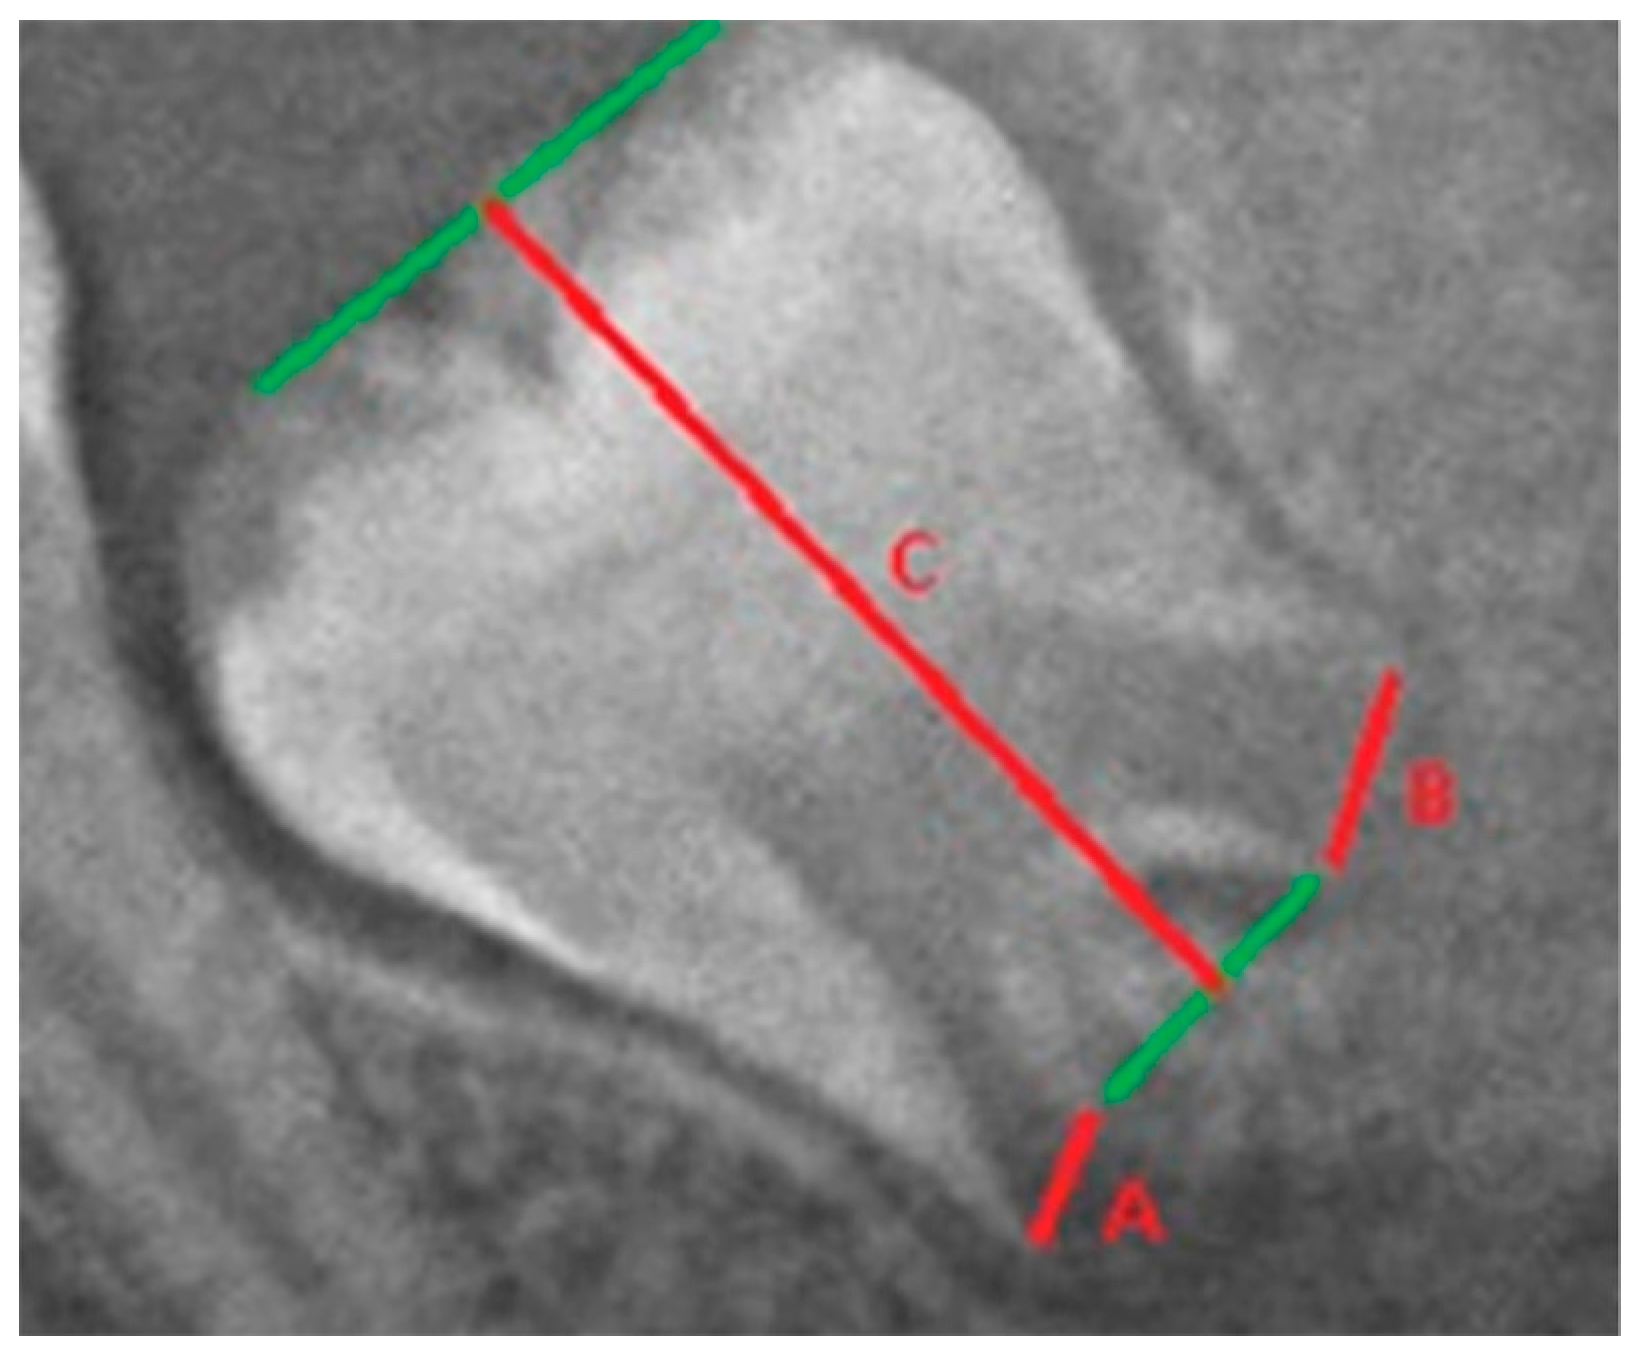
3.2. Analysis of I3M Method
In the case of intrapersonal measurement error, the agreement between the two measurements is almost perfect. The lowest, but still highly significant, agreement was found for the dimension of the root width of the left mandibular third molar (R = 0.96). All the other dimensions showed a high degree of agreement (R = 0.99).
No statistically significant differences were found between the measurements of the right and left mandibular third molars (
p > 0.05), except for the B width and the length of the third molar in males (
Table 6) and in the case of the I
3M the bilateral differences were not statistically significant. The present results showed statistically significant differences between the sexes in the developmental progression of the third molars (
p < 0.05) (
Table 6). However, Cameriere et al. [
18] established a cut-off value regardless of the sex of the individuals. The individuals were then stratified into two groups (minors and adults) based on the third molar index, with a cut-off value of 0.08 (
Figure 6). With this cut-off value for the left mandibular third molar index, 82.92% of the males were correctly classified. Classification errors occurred mainly in minors, with up to 29.65% of minor boys being misclassified as adults. Among females, 72.82% were correctly classified based on the left mandibular third molar index threshold (I
3M = 0.08). However, of the minor girls, 53.01% were misclassified as adult females.
The individuals were then stratified according to the index of the third right mandibular molar (
Figure 7). In males, 82.92% of the individuals were correctly classified, but 27.81% of the minor males were incorrectly classified as adults. For females, correct classification was achieved in 70.84% of cases. However, 55.23% of minor females were misclassified as adults.
The present results indicate that if the left molar is not available for assessment, the values of the right third molar can be used for age estimation, which is consistent with the results of Cameriere et al. [
38] and De Luca et al. [
39].
Table 7 depicts the results of the correct classification together with the population for which the threshold I
3M = 0.08 was tested. Cameriere et al. [
18] determined an 83% correct classification rate for the third molar index (I
3M) using individuals of the Caucasoid variety. Cavrić et al. [
40] applied the I
3M to Black African population from Botswana and found no significant sex differences in the maturation of the left third molar. They achieved 94% correct classification for adolescent boys and 88% for adult males, with 88% for adult females and 96% for minor girls. Chu et al. [
26] tested I
3M on a Chinese population and achieved 90.7% correct classification for males and 87.6% for females and found no differences in dental maturation between the sexes. Kalinowska et al. [
41] tested I
3M on Polish individuals and obtained a correct classification of 87.6% for males and 85.3% for females. Moreover, a threshold of I
3M = 0.07 was also tested by Kalinowska et al. [
41] and resulted in a correct classification of 86.5% for males and 84.4% for females. Cameriere et al. [
42] classified females from 15 countries (Albania, Australia, China, Colombia, Dominican Republic, Egypt, France, Italy, India, Japan, Poland, Chile, Serbia, Turkey, South Africa) with I
3M = 0.08 and achieved classification rates of 91–98%. Spinas et al. [
43] tested I
3M in an isolated Sardinian population and achieved an accuracy of 87% for males and 84% for females. Based on the above, it can be concluded that the I
3M method with a cut-off value of 0.08 is applicable in A various populations.
Based on the above results, the third molar index with a cut-off value of 0.08 is not very reliable, as a relatively large number of minors are classified in the adult group (especially among females). This could therefore mean that, with the Caucasian population at hand, it would make more sense to move the threshold down in a further analysis, as the correct classification of minors could then increase. As mentioned above and outlined by Garamedni et al. [
36], these ethical errors caused by false positives should be eliminated so that minors are not treated as adults in terms of legal liability. As third molars are anatomically highly variable teeth whose roots do not lie on their longitudinal axis (the overall length of the tooth changes), they may affect the sensitivity of the method, which may have led to poor classification of individuals into age groups [
51].
The step-by-step results of the above analysis of the third molar maturity index method are presented in a flow chart (
Figure 8).
Although the study makes an important contribution to dental age assessment, there are some other limitations, including those mentioned above, that need to be emphasized, such as further analysis of a larger sample of OPGs of different age groups, including other regions of Slovakia or other countries and ethnic groups. Moreover, further research is needed, primarily concerned with comparing different methods to find one method or a combination of methods that most accurately correlate and predict chronological age and secondly, most importantly, eliminate the misclassification of minors as adults.


 ,
, 


