
Recent Advances in Biosensor Technology for Early-Stage Detection of Hepatocellular Carcinoma-Specific Biomarkers: An Overview

 ,
,  , , , , , and
Abstract
1. Introduction

| Diagnostic Methods | Advantages | Limitations | References |
|---|---|---|---|
| Positron Emission Tomography (PET) | Indicates both functional and anatomical information; To identify cancerous lesions; More accurate analysis of metastasis via lymph nodes. | Limited spatial resolution and cancerous and lesion detectability; Possible radiation exposure via intravenous administration. | [23,24,25] |
| Computed Tomography (CT) | Fast scan-reduced motion artifacts; Accurate spatial information. | Suboptimal soft tissue imaging; Risk of radiation exposure; Limited functional information. | [24,26] |
| Magnetic Resonance Imaging (MRI) | Soft tissue imaging reveals more information; Reduces the ionizing radiation exposure; The gadolinium contrast agent used in MRI causes fewer allergic reactions than iodine contract agents in X-rays and CTs. | Internal and external metal objects due to interference with the magnetic fields; High cost; Time-consuming;. | [24,27] |
| Magnetic Resonance Spectroscopy (MRS) | Detailed soft tissue imaging; Limited radiation exposure; One can obtain biological, anatomical, physiological, and metabolic information. | Time-consuming; Highly expensive; No detailed anatomical information. | [28,29] |
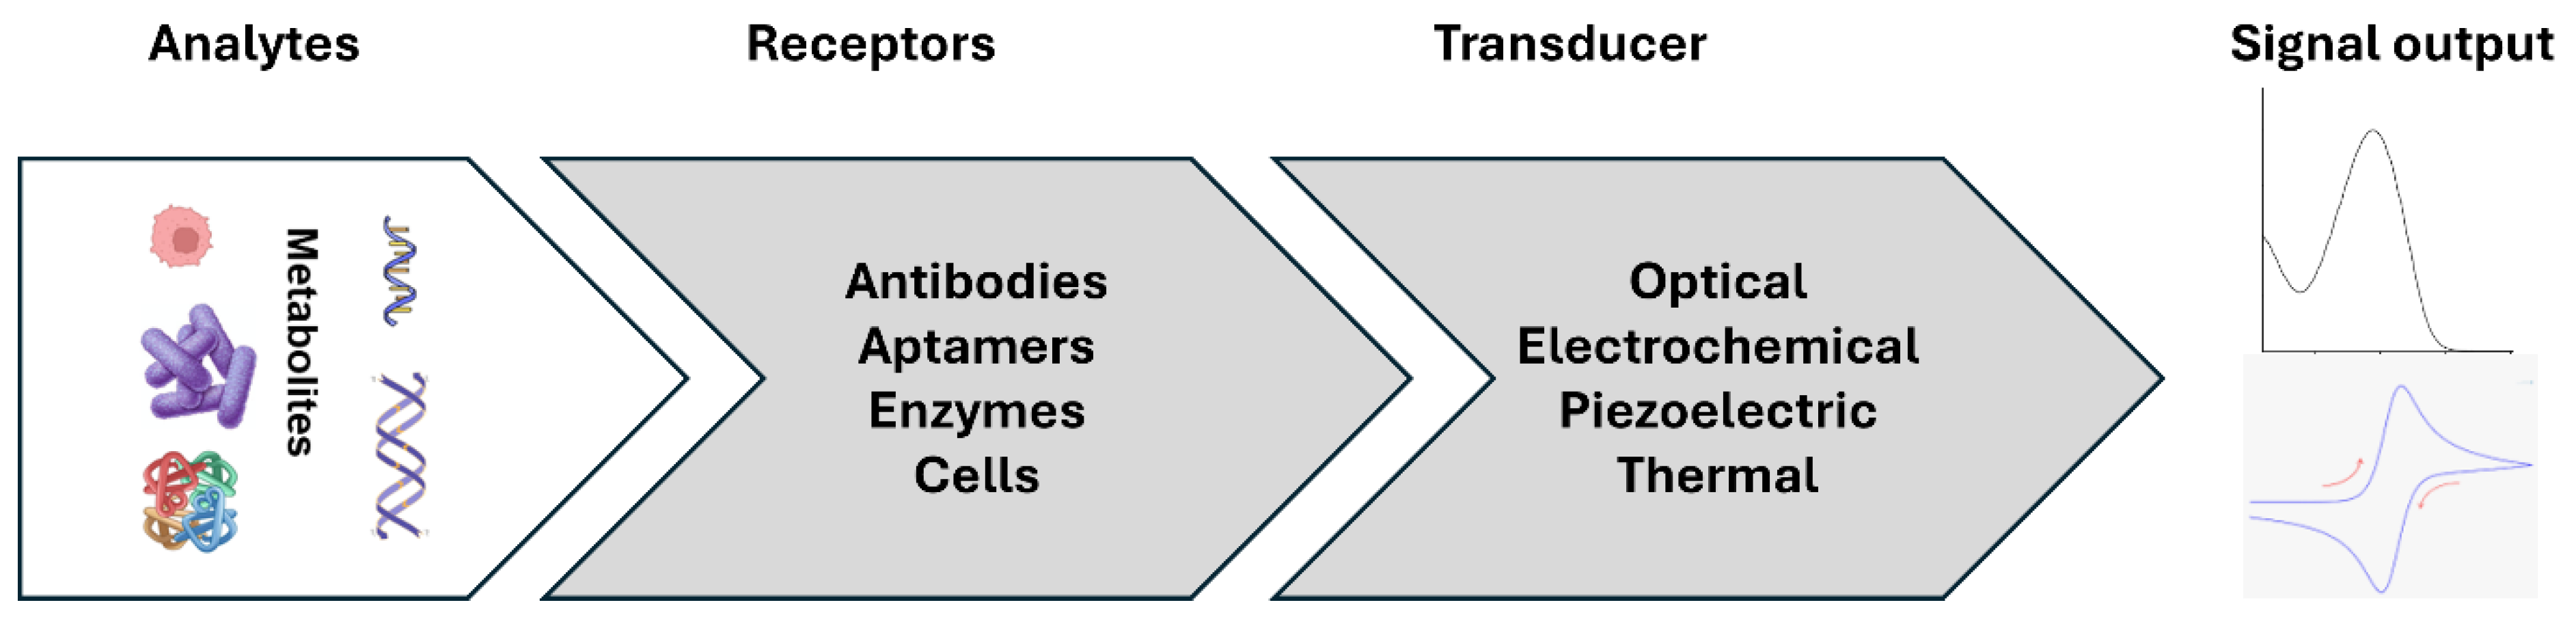
2. Biomarker and Biosensors
3. Nucleic Acid Biomarkers
3.1. Tumor Protein (TP53) Gene
3.2. Catenin Beta-1 (CTNNB1)
3.3. Telomerase Reverse Transcriptase (TERT)
3.4. Ataxia Telangiectasia Mutated (ATM)
3.5. Methylated DNA
3.6. MicroRNA/Long Noncoding RNA
3.7. Circulating Tumor Nucleic Acid Biomarkers
4. Protein Biomarkers
4.1. Alpha-L-Fucosidase (AFU)
4.2. Glypican-3 (GPC-3)
4.3. Alpha-Fetoprotein (AFP)
4.4. Golgi Protein 73 (GP73)
4.5. Osteopontin (OPN)
4.6. Squamous Cell Carcinoma Antigen (SCCA)
4.7. Hedgehog (Hh) Ligands
4.8. β-Catenin
4.9. Lipocalin-2 (LCN2)
4.10. Pentraxin-3 (PTX-3)
5. Other Biomarkers
| Target Biomarker | Materials Used for Detection | Recognition Element | Readout | Linear Range | LOD | References |
|---|---|---|---|---|---|---|
| Nucleic Acid Biomarkers | ||||||
| Tumor Protein (TP53) gene | Sulfhydryl-ended hairpin DNA probes tagged with methylene blue, gold electrodes | Complementary ssDNA probe | DPV | 10–1000 nM | 10 nM | [43] |
| Electrochemical growth of AuNps on aligned multi-walled carbon nanotubes (A-MWCNTs) | Complementary ssDNA probe | EIS | 10−7–10−15 M | 1.0 × 10⁻¹⁷ M | [48] | |
| miR let-7a | Silver nanoparticles (AgNPs), AgNPs-extracted propolis (bee glue)-modified carbon paste electrode (APCPE) | Complementary ssDNA probe | SWV and EIS | 10−3 fM–1 µM | 10−3 fM | [80] |
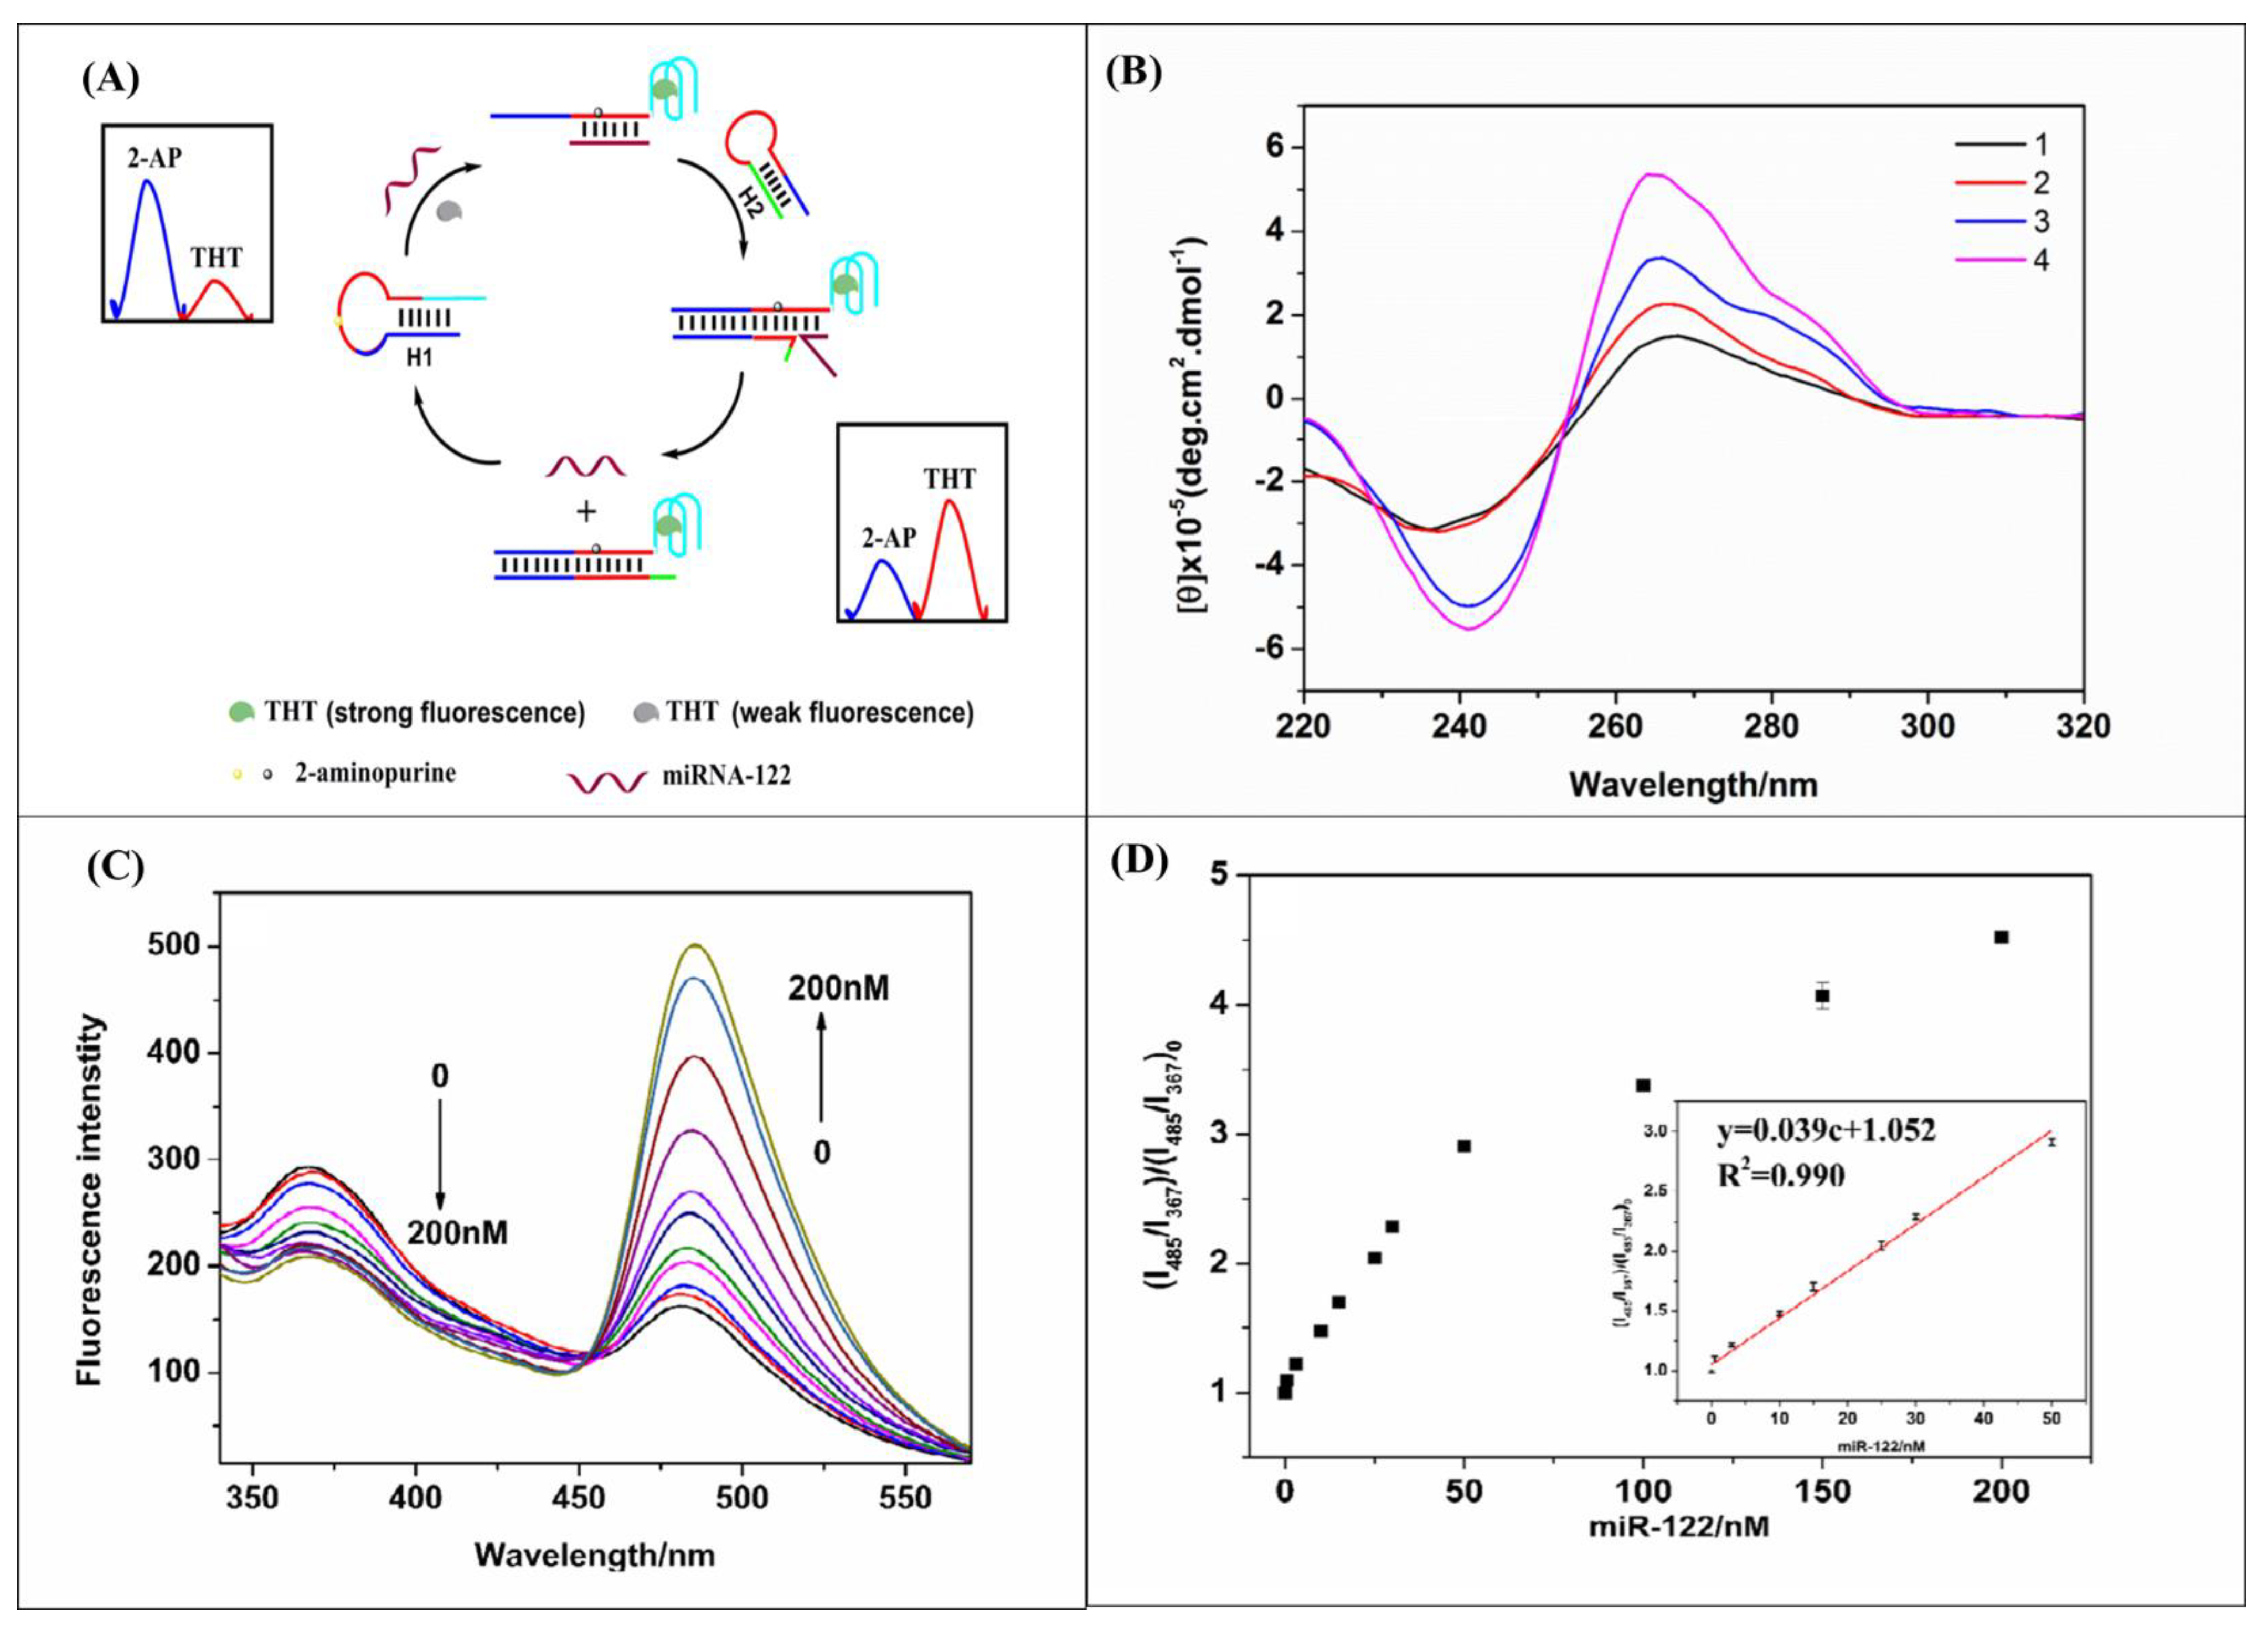
| miR-122 | 2-aminopurine (2-AP)-labeled stem-loop and thioflavin T (ThT)-induced G-quadruplex-forming sequence | 2-AP-labeled target complementary stem-loop hairpin DNA | Ratiometric fluorescence | 0.5–50 nM | 72 pM | [81] |
| miR-122 and AFP | dsDNA duplex generated from miRNA complementary and AFP aptamer and methyl violet intercalated in dsDNA duplex | AFP aptamer and miRNA Complementary DNA | RLS | 5–100 μg/L (mir122) 200 pM–10 nM (AFP) | 98 pM (mir) 0.94 μg/L (AFP) | [187] |
| miR-122 | dsDNA duplex generated from miRNA complementary and G-quadruplex-forming sequences | miRNA Complementary DNA | Resonance light scattering (RLS) | 50 pM to 300 nM | 6.1 pM | [188] |
| miR122 | Electroactive Prussian Blue (PB) nanoparticles grown on graphene oxide (GO), which is anchored by Au-linked target complementary DNA | miRNA Complementary DNA | DPV | 10 fM to 10 nM | 1.5 fM | [86] |
| miR-122, miR-223, and miR-21 | DNA-conjugated gold nanoparticles, F-AuNPs (probe), and DNA-conjugated Ag-coated magnetic nanoparticles, AgMNPs (capture) | Complementary DNA | SERS | 1 fM to 100 nM | 349 aM (miRNA-122), 374 aM (miRNA-223) 311 aM (miRNA-21) | [87] |
| miR-16 | Dual-aptamer hairpin DNA oligonucleotide to bind to miRNA | Complementary DNA | DPV | 50 and 2000 nM | 0.14 nM | [88] |
| miR-21 and miR-141 | Multifunctional Fe3O4magnetic nanoparticles modified cDNA probe | Complementary DNA | DPV | 1 fM to 1 nM | 0.36 fM (miR-21) 0.28 fM (miR141) | [89] |
| miR-21 | Target-linked silicon magnetic beads | Complementary DNA | SERS | - | 0.3 fM | [90] |
| miR-34a | Zip nucleic acid-immobilized streptavidin-coated magnetic beads (MBs)/pencil graphite electrode to capture the target miRNA/miRNA-DNA duplex | Zip nucleic acid | DPV | 10 to 30 µg/mL | 0.87 µg/mL | [91] |
| miR-133a | U-shaped biosensors utilizing wavelength shift and transmission loss | Complementary DNA | SPR combined with immunoassay | 0.286 to 0.0133 ng/mL | 0.0133 ng/mL | [92] |
| miR-222 | AuNps self-assembled cDNA probe of target miRNA on rGO-modified glassy carbon electrode (GCE) | Complementary DNA | DPV | (0.5 fM to 70 nM | 0.03 fM | [95] |
| HULC | Au@Ag core–shell nanoparticles/graphene quantum dots (Au@Ag/GQDs) | Complementary DNA | ECL | 1 fM to 5 nM | 0.3 fM | [96] |
| miRNA | Fe3O4 NPs, indium tin oxide cathode, and a graphene oxide/gold nanoparticle/glucose oxidase anode | Complementary DNA | Biofuel cell method | 10 aM to 10 fM | 1.4 aM | [97] |
| miR-141 | (dsDNA)-templated copper nanoparticles (CuNPs) immobilized on gold surface electrode-T7 exonuclease (exo)-assisted cascade digestion method | Complementary DNA-probes | DPV | 10−11 to 10−16 M | 4.5 × 10 −17 M | [98] |
| miR-21 | Circle capture probe anchored at the top of the tetrahedron DNA nanostructure (TDN) | Complementary DNA-probes | SWV | 0.1 fM to 10 nM | 18.9 aM | [99] |
| miR-155 | Electrochemical genosensor for the detection of miRNA-21 and miRNA-155 using a tetrahedron DNA nanostructure (TDN | Complementary DNA-probes | SWV | 0.1 fM to 10 nM | 39.6 aM | [99] |
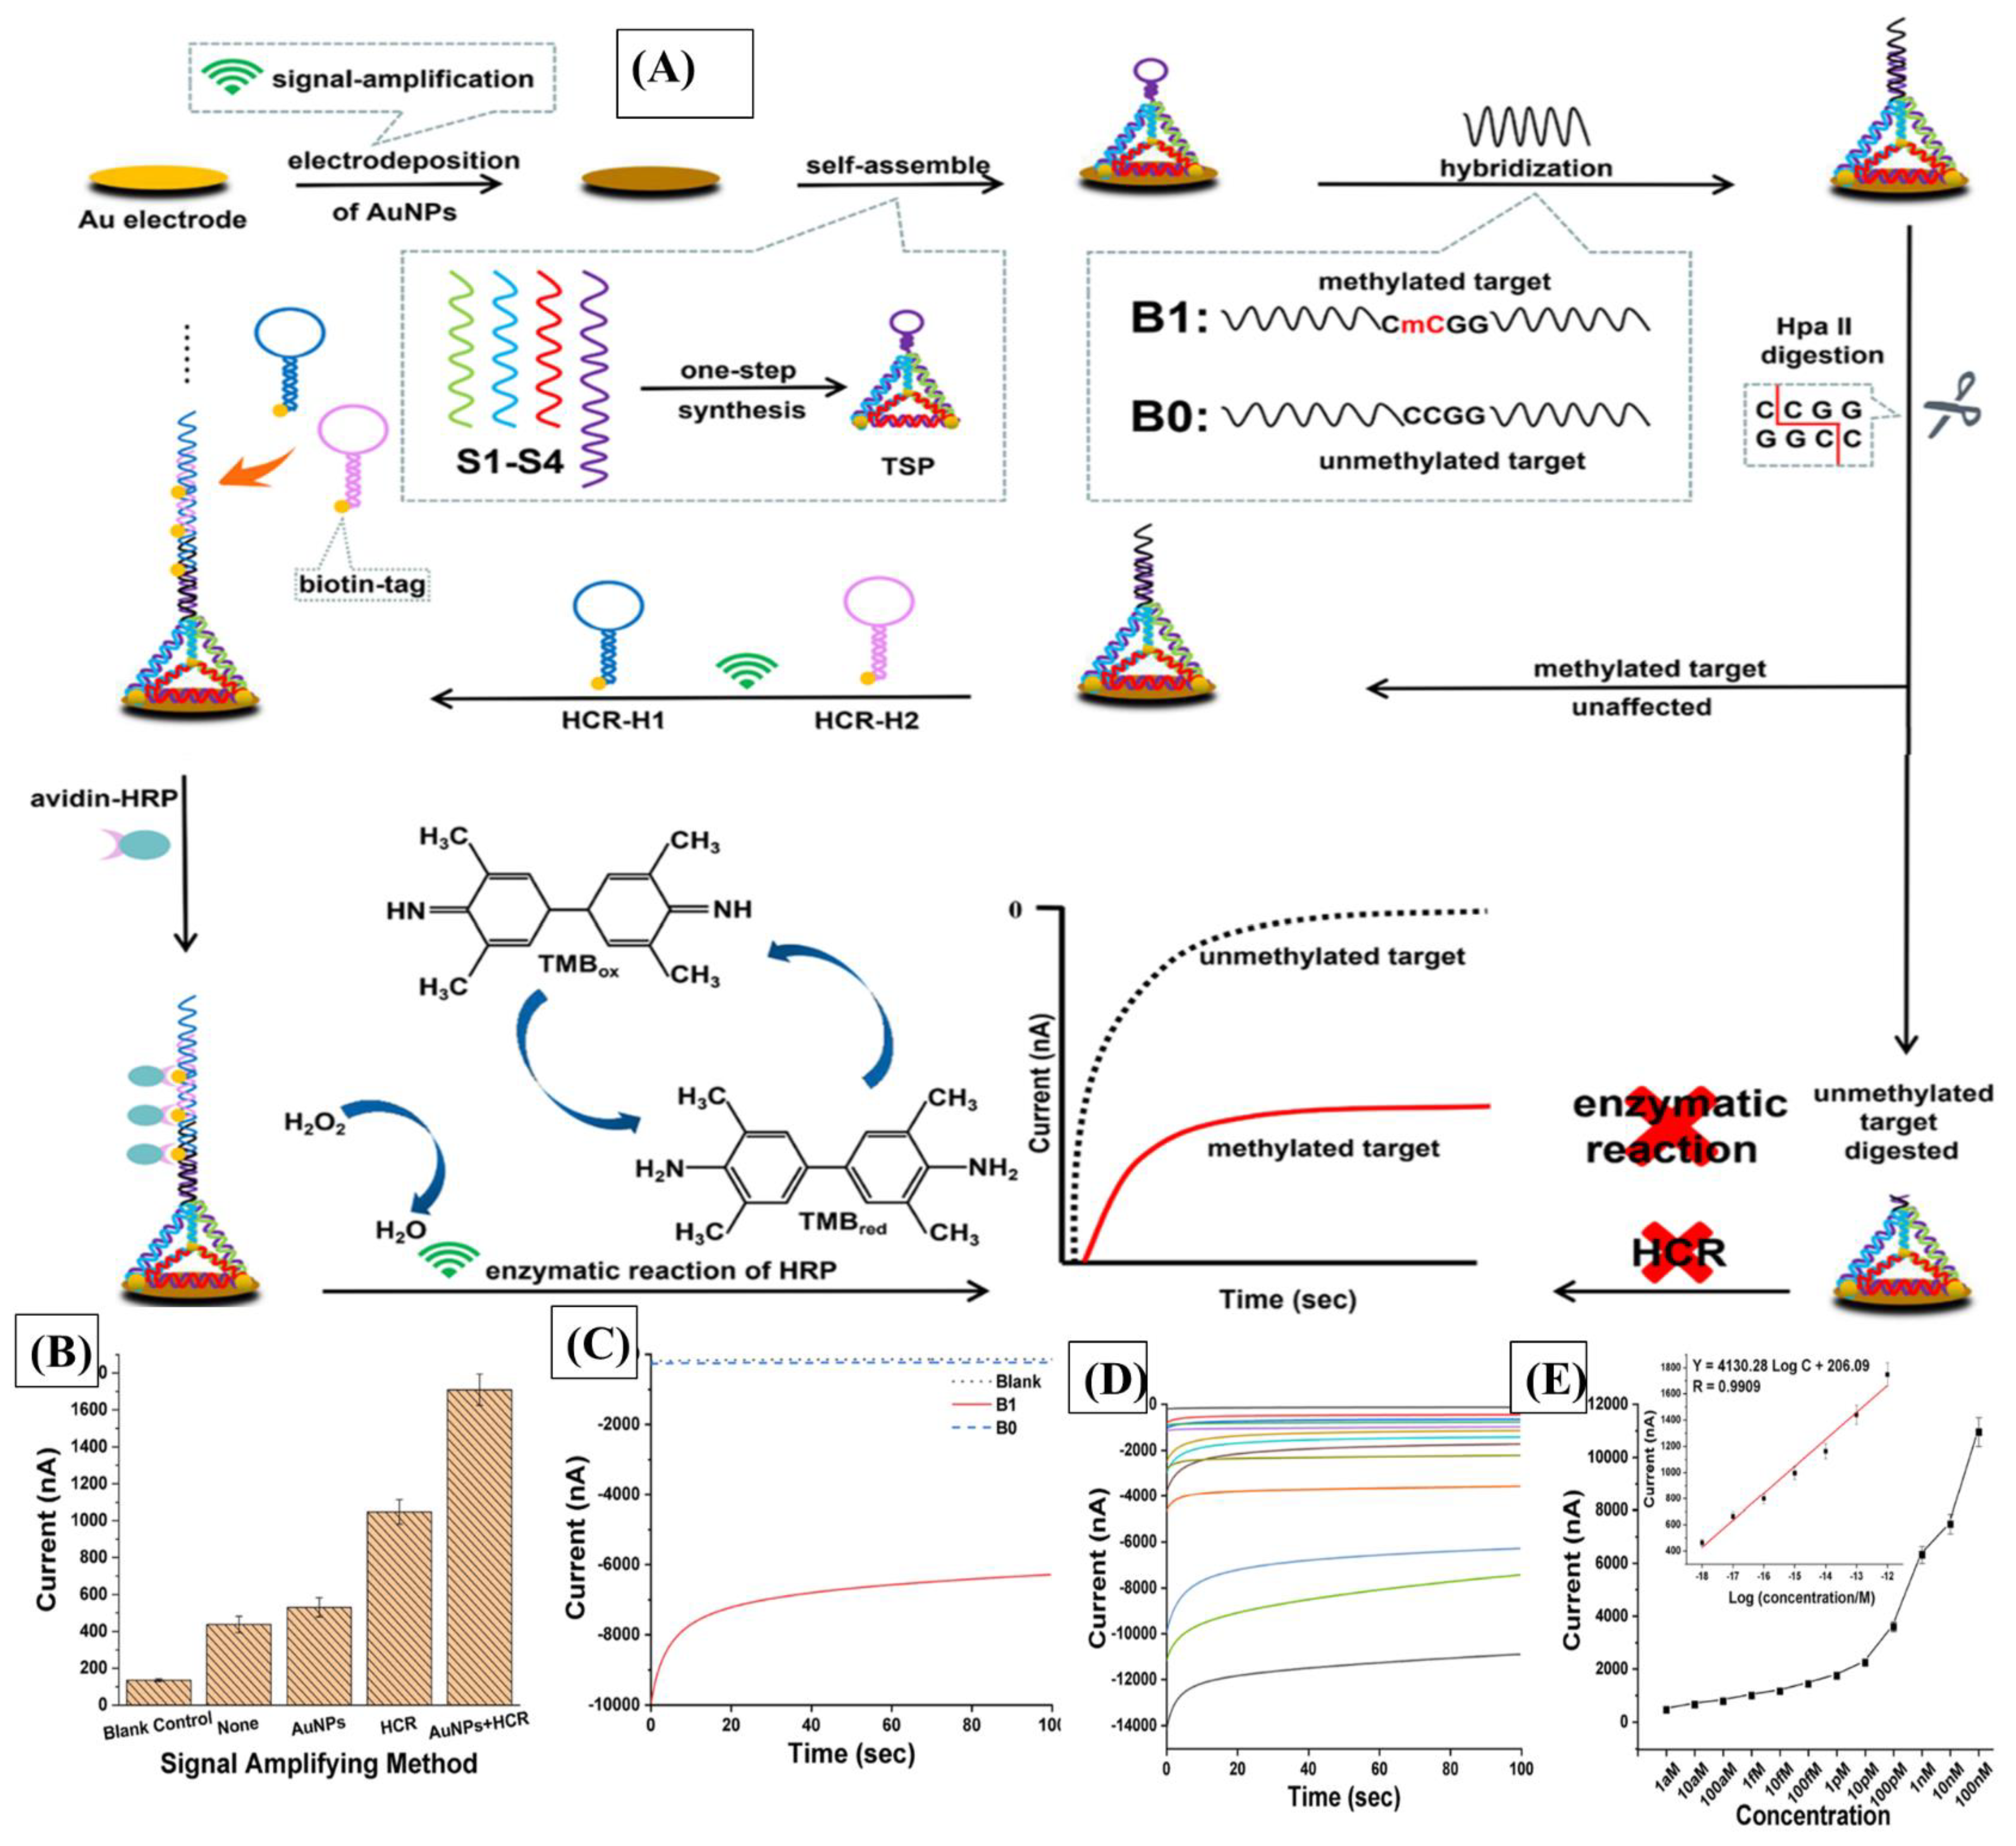
| miR-122 | Hybridization chain reaction (HCR) and hairpin DNA (hpDNA) | Complementary DNA-probes | DPV | 0.1 fM to 0.1 μM | 53 aM | [100] |
| Strand displacement amplification (SDA) reaction and analogical catalytic hairpin assembly (ACHA) reaction | Complementary DNA-probes | DPV | 0.1 fM to 10 fM | 0.012 fM | [101] | |
| miR-21 | Strand displacement amplification (SDA) reaction and analogical catalytic hairpin assembly (ACHA) reaction | Complementary DNA-probes | DPV | 0.1 fM to 10 fM | 0.075 fM | [101] |
| Hybridization chain reaction (HCR) amplification strategy | Complementary DNA-probe | EIS | 10 fM to 50 pM | 4.63 fM | [102] | |
| Ratiometric electrochemical DNA biosensor is based on a locked nucleic acid (LNA)-modified “Y” shape-like structure | DNA-probe | DPV | 10 fM to 70 fM | 2.3 fM | [103] | |
| DNA nanospheres, nicking endonuclease-assisted primer exchange reaction (PER) cascade amplification | DNA-probe | DPV | 1 aM to 0.1 nM | 0.58 aM | [104] | |
| QCM sensor surface immobilized with pyrene DNA intercalators | Gold-nanoparticle-conjugated DNA | QCM | 2.5 pM to 2.5 μM | 3.6 pM | [105] | |
| Gold nanoparticles (AuNps), a surface-immobilized capture oligonucleotide | DNA-probe | QCM and SPRi microarray | (0.1–50 pM) | QCM: 28 fM SPRi: 47 fM | [106] | |
| Methylated DNA | Restriction endonuclease (DPnI)/hairpin DNA (HP) | CRISPR/Cas12a trans-cleavage activity | ECL | 5–70 U/mL | 23.4 mU/mL | [70] |
| Stem-loop–tetrahedron composite DNA/Au-nanoparticle-coated gold electrode | Stem-loop–tetrahedron composite DNA probe | Chronoamperometry | 1 aM to 1 pM | 0.075 pM | [71] | |
| Protein Biomarkers | ||||||
| Alpha-L-Fucosidase (AFU) | Target activity on 2-chloro-4-nitrophenol (2-chloro-4-NP) | PVC membrane sensor | Potentiometry | 10−2–10−5 M | 1.0 × 10⁻⁶ M | [115] |
| Carbon dots (C-dots) and gold nanoparticles (AuNPs) | Antibody | FRET | 11.3 to 200 nM | 3.4 nM | [117] | |
| Glypican-3 (GPC-3) | Glassy carbon electrode-modified NP-conjugated antibody magnetite (Fe3O4) nanoparticles (NPs) decorated with hyperbranched amino-functionalized dendrimers | Antibody | CV and EIS | 0.02 to 10 ng/mL | 70 pg/mL | [121] |
| GPC3-aptamer-labeled gold carbon dots (AuCDs-GPC3Apt) and magnetic graphene oxide (Fe3O4/GO) nanosheets | Aptamer | FRET | 5–100 ng/mL | 3.01 ng/mL, | [122] | |
| Combining hemin-reduced graphene oxide-platinum nanoparticles with reduced graphene oxide–gold nanoparticles | Aptamer | EIS | 0.001 μg/mL to 10 μg/mL | 0.001 μg/mL | [123] | |
| Platinum@palladium nanoparticles decorated with hemin-reduced graphene oxide (H-rGO-Pt@Pd NPs) | Aptamer | DPV | 0.001 μg/mL to 10 μg/mL | 0.181 ng/mL | [124] | |
| Reduced graphene oxide-hemin nanocomposites (RGO-hemin) modified on the screen-printed electrode surface | Aptamer | DPV | 0.00 1–10.0 µg/mL | 2.86 ng/mL | [125] | |
| Hemin/graphene nanohybrid (HGN)-aptamer: catalytic silver deposition | Aptamer | DPV | 10.0–100.0 μg/mL | 3.16 μg/mL | [126] | |
| Alpha-fetoprotein (AFP) | AFP-aptamer-labeled luminescent CdTe quantum dots (QDs) and anti-AFP antibody functional gold nanoparticles (AuNPs) | Aptamer | FRET | 0.5–45 ng/mL | 400 pg/mL | [94] |
| Gold nanoparticles-dextran-reduced graphene oxide (AuNPs-Dex-RGO)-AuNps | Antibody | DPV | 0.01–20 ng/mL | 0.05 pg/mL | [95] | |
| Polyethylene glycols (PEG)/gold nanoparticles (AuNPs)/polyaniline (PANI): PEG/AuNPs/PANI composite | Antibody | DPV | 0.01 pg/mL –1.0 ng/mL | 0.007 pg/mL | [133] | |
| AgNPs-Ab probes | Antibody | (NIE) | N/A | 5 pg/mL | [189] | |
| Au/CsxWO3 heterogeneous films | Antibody | photoelectrochemical biosensor | 0.01 ng/mL to 500 ng/mL | 7 pg/mL | [138] | |
| Golgi protein 73 (GP73) | CdSe quantum dots, modified by aleuria aurantia lectin (AAL) and PEG, as a substrate. A glassy carbon electrode, modified with electrochemically reduced graphene oxide | Antibody | EIS | m 20 to 5000 pM | 12 pM | [140] |
| Nitrogen-doped graphene quantum dots (NGQDs) labeled with GP73 aptamer (GP73Apt) and molybdenum disulfide @ reduced graphene oxide (MoS2@RGO) nanosheets | Aptamer | FRET | 5 ng/mL–100 ng/mL | 4.54 ng/mL | [144] | |
| Manganese-modified CdTe/CdS quantum dots | Antibody | Fluorescence spectroscopy | 20–150 ng/mL | 10 ng/mL | [145] | |
| Reduced graphene oxide-carboxymethyl chitosan-hemin/platinum@palladium nanoparticles (RGO-CMCS-hemin/Pt@Pd NPs) | Aptamer | Colorimetric aptasensor | 10.0–110.0 ng/mL | 4.7 ng/mL | [146] | |
| DNA tetrahedron nanostructure (DTN)-modified electrode and (Ru(dcbpy)3Cl2) used for ECL | Antibody | ECL | 15 pg/mL–0.7 ng/mL | 15 pg/mL | [147] | |
| nitrogen-doped graphene quantum dots (N-GQDS) and molybdenum disulfide (MoS2) nanosheets | Aptamer | FRET | 2.5 ng/mL∼100 ng/mL | 4.54 ng/mL | [148] | |
| Hemin-reduced graphene oxide–manganese oxide (H-rGO-Mn3O4) nanozymes/Gold@poly(o-phenylenediamine) (Au@POPD) nanohybrids | Aptamer | CV | 0.01–100.0 ng/mL | 0.0071 ng/mL | [148] | |
| Streptavidin magnesphere paramagnetic particles (PMPs)-methylene blue (MB)-labeled DNA probe/nafion-modified indium tin oxide electrode | Antibodies | PLA and enzyme-powered recycling amplification Electrochemical immunosensor | 0.3 pg/mLto 6.0 ng/mL | 0.10 pg/mL | [149] | |
| streptavidin-labeled MNPs/biotin-labeled monoclonal antibody, (AE)-labeled reporter monoclonal antibody | Antibodies | Chemiluminescence | 1.34 ng/mL to 684.38 ng/mL. | 1.19 ng/mL | [150] | |
| Osteopontin (OPN) | Lateral-flow-pad-immobilized OPN antibody/aptamer complementary/AuNPs-SA conjugates | Antibody and aptamer | Lateral flow aptasensor | 10–500 ng/mL | 0.1 ng/mL | [147] |
| RNA-aptamer-modified gold electrode surface of a strip containing a silver pseudo-reference electrode and a gold counter-electrode | Aptamer | CV | 25 nM and 2402 nM | 520 ng/mL | [155] | |
| DNA-aptamer-modified electrode | Aptamer | CV/SWV | 12 to 1540 nM | 1.3 ± 0.1 nM. | [156] | |
| ZrO2@GNF nanohybrids with different morphologies/nanostructures derived from zirconium-based metal–organic frameworks (UiO-66) entrapped within the electric spun polyacrylonitrile (PAN) | Aptamer | EIS | 0.01 pg/mL to 2.0 ng/mL | 4.76 ng/mL | [160] | |
| Nanohybrid composed of Ti3C2Tx MXene and phosphomolybdic acid (PMo12) embedded with polypyrrole (referred to as PPy@ Ti3C2Tx/PMo12) | Aptamer | EIS | 0.05–10,000 pg/mL | 0.98 fg/mL | [159] | |
| Squamous cell carcinoma antigen (SCCA) | β-cyclodextrin-functionalized graphene nanosheet (CD-GN)/ternary hollow Pt/PdCu nanocube anchored on three-dimensional graphene framework (Pt/PdCu-3DGF) | Antibody | CV | 0.0001 to 30 ng/mL | 25 fg/mL. | [162] |
| Au-NPs@Zn-MOF functionalized with 1H-imidazolium1,3-bis(2-aminoethyl)bromide ionic liquid (IBABr), IBABr-Au@Zn-MOF nanocomposites | Antibody | PEC | 5.0 pg/mL to 15.0 ng/mL | 2.34 pg/mL | [163] | |
| Triangle-shaped silver nanoparticle array was fabricated using nanosphere lithography modified with MUA and antibody | Antibody | LSPR | 0.1–1000 pM | 0.125 pM | [164] | |
| Carboxyl-functionalized CdS nanoparticles (CdS NPs) bonded onto Fe-TiO2 modified with antibody | Antibody | PEC | 0.001 ng/mL to 75 ng/mL | 0.22 pg/mL | [165] | |
| BiOBr/Bi2S3/ascorbic acid (AA)/antibody-modified ITO electrode | Antibody | PEC | 0.001–75 ng/mL | 0.3 pg/mL | [166] | |
| Hedgehog (Hh) ligands | Texas-Red-labeled AP32 to microbead | Aptamer | Fluorescence spectroscopy | 0.07 to 62.5 nM | 69 pM | [168] |
| Aptamer specific to SHh and the combination of primer exchange reaction (PER) and catalytic hairpin assembly (CHA) | Aptamer | CV | N/A | 4.1 pM | [169] | |
| Beta-catenin | Peptide-based probes | SWV | 32 pM to 10 nM | <10 pM | [172] | |
| Aflatoxin B1 (AFB1) | MWCNTs/RTIL composite films | Antibody | EIS | 0.1–10 ng/mL | 0.03 ng/mL | [157] |
| Lipocalin-2 (LCN2) | Single-stranded DNA aptamer pairs | Aptamer | SPR | 2.5–500 ng/mL | 0.6 ng/mL | [176] |
| Pentraxin-3 (PTX-3) | Functionalized multi-walled carbon nanotubes (MWCNTs) and gold nanowire (AuNW) nanocomposites | Antibody | DPV | 0.001–1000 ng/mL | 0.16 pg/mL | [178] |
| Amyloid-beta protein | Gold nanoparticles-functionalized graphitic carbon nitride nanosheets (g-C3N4@Au NPs) and palladium nanoparticles-coated metal–organic framework (Pd NPs@NH2-MIL-53)-modified glassy carbon electrode (GCE) | Antibody | ECL | 0.01 pg/mL to 50 ng/mL | 3.4 fg/mL | [181] |
6. Conclusions and Future Perspectives
Author Contributions
Funding
Conflicts of Interest
Abbreviations
| HCC | Hepatocellular carcinoma |
| AFP | Alpha-fetoprotein |
| CTSs | Circulating tumor cells |
| MiRNA | microRNAs |
| PET | Positron Emission Tomography |
| CT | Computed Tomography |
| MRI | Magnetic Resonance Imaging |
| MRS | Magnetic Resonance Spectroscopy |
| ctDNA | Circulating tumor DNA |
| ddPCR | Digital droplet polymerase chain reaction |
| TP53 | Tumor Protein 53 |
| CTNNB1 | Catenin beta-1 |
| BiFC | Bimolecular fluorescence complementation |
| TCF3 | Transcription factor 3 |
| TCF3ΔNLS | TCF3 lacking the nuclear localization signal |
| TERT | Telomerase Reverse Transcriptase |
| HBV | Hepatitis B virus |
| HCV | Hepatitis C virus |
| NGS | Next-generation sequencing |
| WGS | Whole-genome sequencing |
| Cap-Seq | Capture sequencing (Cap-seq) |
| cfDNA | Cell-free deoxyribonucleic acid |
| ccfDNA | Circulating cell-free DNA |
| WTB-PCR | Wild-type blocking polymerase chain reaction |
| CHIP | Clonal hyperplasia with indeterminate potential |
| ATM | Ataxia telangiectasia mutated |
| FRET | Fluorescence resonance energy transfer |
| CpGs | Carbon-5 cytosine–guanine dinucleotide |
| MS-HRM | Methylation-sensitive high-resolution analysis |
| LDHB | Lactate Dehydrogenase B |
| qRT-PCR | Quantitative real-time polymerase chain reaction |
| AuNps | Gold nanoparticles |
| ECL | Electrochemiluminescence |
| Dam MTase | DNA adenine methylation methyltransferase |
| PNA | Peptide nucleic acid |
| PB | Prussian Blue |
| GO | Graphene oxide |
| RGO | Reduced graphene oxide |
| SERS | Surface-enhanced Raman scattering |
| CHA | Chain hybridization amplification |
| HCR | Hybridization chain reaction |
| CuNPs | Copper nanoparticles |
| MB | Methylene blue |
| DPV | Differential pulse voltammetry |
| CV | Cyclic voltammetry |
| SWV | Square wave voltammetry |
| EIS | Electrochemical impedance spectroscopy |
| TDN | Tetrahedron DNA nanostructure |
| SDA | Strand displacement amplification |
| ACHA | Analogical catalytic hairpin assembly |
| LNA | Locked nucleic acid |
| DNA | DNA nanosphere |
| QCM | Quartz crystal microbalance |
| LOD | Limit of detection |
| GPC-3 | Glypican-3 |
| GMR | Giant magnetoresistive effect |
| GP73 | Golgi protein 73 |
| PEG | Polyethylene glycol |
| AAL | Aleuria aurantia lectin |
| TMB | 3,3′,5,5′-Tetramethylbendzidine |
| DTN | Tetrahedron nanostructure |
| SA | Streptavidin |
| NGQDs | Nitrogen-doped graphene quantum dots |
| PLA | Proximity ligation assay |
| GPC-3 | Glypican-3 |
| OPN | Osteopontin |
| SELEX | Systematic evolution of ligands by exponential enrichment |
| PAN | Polyacrylonitrile |
| SWCNTs | Single-walled carbon nanotubes |
| MWCNTs | Multi-walled carbon nanotubes |
| PMol2 | Phosphomolybdic acid |
| SCCA | Squamous cell carcinoma antigen |
| SPR | Surface Plasmon Resonance |
| LSPR | Localized Surface Plasmon Resonance |
| SPRi | Surface Plasmon Resonance Imaging |
| PEC | Photoelectrochemical |
| Hg | Hedgehog |
| SHh | Sonic hedgehog |
| PER | Primer exchange reaction |
| CHA | Catalytic hairpin assembly |
| KLK6 | Kallikrein 6 |
| LCN2 | Lipocalin-2 |
| PTX-3 | Pentraxin-3 |
| ATRP | Atom transfer radical polymerization |
| GCE | Glassy carbon electrode |
| QCM-D | Quartz crystal microbalance with dissipation monitoring |
| 2-AP | 2-Aminopurine |
| RLS | Resonance light scattering |
| NIE | Nanoimpact electrochemistry |
References
- Lumbreras, B.; Donat, L.; Hernández-Aguado, I. Incidental Findings in Imaging Diagnostic Tests: A Systematic Review. Br. J. Radiol. 2010, 83, 276–289. [Google Scholar] [CrossRef] [PubMed]
- Sung, H.; Ferlay, J.; Siegel, R.L.; Laversanne, M.; Soerjomataram, I.; Jemal, A.; Bray, F. Global Cancer Statistics 2020: GLOBOCAN Estimates of Incidence and Mortality Worldwide for 36 Cancers in 185 Countries. CA A Cancer J. Clin. 2021, 71, 209–249. [Google Scholar] [CrossRef] [PubMed]
- Jabri, A.; Khan, J.; Taftafa, B.; Alsharif, M.; Mhannayeh, A.; Chinnappan, R.; Alzhrani, A.; Kazmi, S.; Mir, M.S.; Alsaud, A.W.; et al. Bioengineered Organoids Offer New Possibilities for Liver Cancer Studies: A Review of Key Milestones and Challenges. Bioengineering 2024, 11, 346. [Google Scholar] [CrossRef] [PubMed]
- Asafo-Agyei, K.O.; Samant, H. Hepatocellular Carcinoma. In StatPearls; StatPearls Publishing: Treasure Island, FL, USA, 2023. [Google Scholar]
- Tang, Z.Y. Hepatocellular Carcinoma-Cause, Treatment and Metastasis. World J. Gastroenterol. 2001, 7, 445–454. [Google Scholar] [CrossRef] [PubMed]
- Calderon-Martinez, E.; Landazuri-Navas, S.; Vilchez, E.; Cantu-Hernandez, R.; Mosquera-Moscoso, J.; Encalada, S.; Al Lami, Z.; Zevallos-Delgado, C.; Cinicola, J. Prognostic Scores and Survival Rates by Etiology of Hepatocellular Carcinoma: A Review. J. Clin. Med. Res. 2023, 15, 200–207. [Google Scholar] [CrossRef] [PubMed]
- Di Bisceglie, A.M. Epidemiology and Clinical Presentation of Hepatocellular Carcinoma. J. Vasc. Interv. Radiol. 2002, 13, S169–S171. [Google Scholar] [CrossRef] [PubMed]
- Chinnappan, R.; Mir, T.A.; Alsalameh, S.; Makhzoum, T.; Alzhrani, A.; Alnajjar, K.; Adeeb, S.; Al Eman, N.; Ahmed, Z.; Shakir, I.; et al. Emerging Biosensing Methods to Monitor Lung Cancer Biomarkers in Biological Samples: A Comprehensive Review. Cancers 2023, 15, 3414. [Google Scholar] [CrossRef]
- Alsalameh, S.; Alnajjar, K.; Makhzoum, T.; Al Eman, N.; Shakir, I.; Mir, T.A.; Alkattan, K.; Chinnappan, R.; Yaqinuddin, A. Advances in Biosensing Technologies for Diagnosis of COVID-19. Biosensors 2022, 12, 898. [Google Scholar] [CrossRef]
- Chen, X.-H.; Huang, S.; Kerr, D. Biomarkers in Clinical Medicine. IARC Sci. Publ. 2011, 163, 303–322. [Google Scholar]
- Ramachandran, L.; Abul Rub, F.; Hajja, A.; Alodhaibi, I.; Arai, M.; Alfuwais, M.; Makhzoum, T.; Yaqinuddin, A.; Al-Kattan, K.; Assiri, A.M.; et al. Biosensing of Alpha-Fetoprotein: A Key Direction toward the Early Detection and Management of Hepatocellular Carcinoma. Biosensors 2024, 14, 235. [Google Scholar] [CrossRef]
- Bialecki, E.S.; Di Bisceglie, A.M. Diagnosis of Hepatocellular Carcinoma. HPB 2005, 7, 26–34. [Google Scholar] [CrossRef]
- Lapitan, L.D.S.; Pietrzak, M.; Krawczyk, M.; Malinowska, E. Serum Biomarkers and Ultrasensitive Biosensors for Diagnosis of Early-Stage Hepatocellular Carcinoma. Sens. Actuators B Chem. 2023, 393, 134209. [Google Scholar] [CrossRef]
- Eissa, S.; Chinnappan, R.; Zourob, M. Ultrasensitive Label-free Electrochemical Immunosensors for Multiple Cell Surface Biomarkers on Liver Cancer Stem Cells. Electroanalysis 2017, 29, 1994–2000. [Google Scholar] [CrossRef]
- El Hayek, T.; Alnaser-Almusa, O.A.; Alsalameh, S.M.; Alhalabi, M.T.; Sabbah, A.N.; Alshehri, E.A.; Mir, T.A.; Mani, N.K.; Al-Kattan, K.; Chinnappan, R.; et al. Emerging Role of Exosomal microRNA in Liver Cancer in the Era of Precision Medicine; Potential and Challenges. Front. Mol. Biosci. 2024, 11, 1381789. [Google Scholar] [CrossRef]
- Wu, L.; Qu, X. Cancer Biomarker Detection: Recent Achievements and Challenges. Chem. Soc. Rev. 2015, 44, 2963–2997. [Google Scholar] [CrossRef]
- Zacharakis, G.; Aleid, A.; Aldossari, K.K. New and Old Biomarkers of Hepatocellular Carcinoma. Hepatoma Res. 2018, 4, 65. [Google Scholar] [CrossRef]
- Casadei-Gardini, A.; Giulia, O.; Francesco, C.; Giorgio, E. Developments in Predictive Biomarkers for Hepatocellular Carcinoma Therapy. Expert Rev. Anticancer Ther. 2020, 20, 63–74. [Google Scholar] [CrossRef] [PubMed]
- Li, D.; Satomura, S. Biomarkers for Hepatocellular Carcinoma (HCC): An Update. In Advances in Cancer Biomarkers: From Biochemistry to Clinic for a Critical Revision; Scatena, R., Ed.; Springer: Dordrecht, The Netherlands, 2015; pp. 179–193. ISBN 978-94-017-7215-0. [Google Scholar]
- Chinnappan, R.; Al Faraj, A.; Abdel Rahman, A.M.; Abu-Salah, K.M.; Mouffouk, F.; Zourob, M. Anti-VCAM-1 and Anti-IL4Rα Aptamer-Conjugated Super Paramagnetic Iron Oxide Nanoparticles for Enhanced Breast Cancer Diagnosis and Therapy. Molecules 2020, 25, 3437. [Google Scholar] [CrossRef] [PubMed]
- Roointan, A.; Ahmad Mir, T.; Ibrahim Wani, S.; Hussain, K.K.; Ahmed, B.; Abrahim, S.; Savardashtaki, A.; Gandomani, G.; Gandomani, M.; Chinnappan, R.; et al. Early Detection of Lung Cancer Biomarkers through Biosensor Technology: A Review. J. Pharm. Biomed. Anal. 2019, 164, 93–103. [Google Scholar] [CrossRef]
- Chinnappan, R.; Mir, T.A.; Alsalameh, S.; Makhzoum, T.; Adeeb, S.; Al-Kattan, K.; Yaqinuddin, A. Aptasensors Are Conjectured as Promising ALT and AST Diagnostic Tools for the Early Diagnosis of Acute Liver Injury. Life 2023, 13, 1273. [Google Scholar] [CrossRef]
- Chinnappan, R.; Mir, T.A.; Alsalameh, S.; Makhzoum, T.; Alzhrani, A.; Al-Kattan, K.; Yaqinuddin, A. Low-Cost Point-of-Care Monitoring of ALT and AST Is Promising for Faster Decision Making and Diagnosis of Acute Liver Injury. Diagnostics 2023, 13, 2967. [Google Scholar] [CrossRef] [PubMed]
- Pulumati, A.; Pulumati, A.; Dwarakanath, B.S.; Verma, A.; Papineni, R.V. Technological Advancements in Cancer Diagnostics: Improvements and Limitations. Cancer Rep. 2023, 6, e1764. [Google Scholar] [CrossRef] [PubMed]
- Fass, L. Imaging and Cancer: A Review. Mol. Oncol. 2008, 2, 115–152. [Google Scholar] [CrossRef] [PubMed]
- Patel, V.; Papineni, R.V.; Gupta, S.; Stoyanova, R.; Ahmed, M.M. A Realistic Utilization of Nanotechnology in Molecular Imaging and Targeted Radiotherapy of Solid Tumors. Radiat. Res. 2012, 177, 483–495. [Google Scholar] [CrossRef] [PubMed]
- Gambhir, S.S. Molecular Imaging of Cancer with Positron Emission Tomography. Nat. Rev. Cancer 2002, 2, 683–693. [Google Scholar] [CrossRef]
- Haris, M.; Yadav, S.K.; Rizwan, A.; Singh, A.; Wang, E.; Hariharan, H.; Reddy, R.; Marincola, F.M. Molecular Magnetic Resonance Imaging in Cancer. J. Transl. Med. 2015, 13, 313. [Google Scholar] [CrossRef] [PubMed]
- Bockisch, A.; Freudenberg, L.S.; Schmidt, D.; Kuwert, T. Hybrid Imaging by SPECT/CT and PET/CT: Proven Outcomes in Cancer Imaging; Elsevier: Amsterdam, The Netherlands, 2009; Volume 39, pp. 276–289. [Google Scholar]
- Verma, A.; Kumar, I.; Verma, N.; Aggarwal, P.; Ojha, R. Magnetic Resonance Spectroscopy—Revisiting the Biochemical and Molecular Milieu of Brain Tumors. BBA Clin. 2016, 5, 170–178. [Google Scholar] [CrossRef] [PubMed]
- Parikh, N.D.; Mehta, A.S.; Singal, A.G.; Block, T.; Marrero, J.A.; Lok, A.S. Biomarkers for the Early Detection of Hepatocellular Carcinoma. Cancer Epidemiol. Biomark. Prev. 2020, 29, 2495–2503. [Google Scholar] [CrossRef] [PubMed]
- Tsuchiya, N.; Sawada, Y.; Endo, I.; Saito, K.; Uemura, Y.; Nakatsura, T. Biomarkers for the Early Diagnosis of Hepatocellular Carcinoma. World J. Gastroenterol. 2015, 21, 10573. [Google Scholar] [CrossRef] [PubMed]
- Attallah, K.A.; Albannan, M.S.; Farid, K.; Rizk, S.M.; Fathy, N. HCC-Check: A Novel Diagnostic Tool for Early Detection of Hepatocellular Carcinoma Based on Cytokeratin-1 and Epithelial Membrane Antigen: A Cross-Sectional Study. Technol. Cancer Res. Treat. 2024, 23, 15330338241234790. [Google Scholar] [CrossRef]
- Ma, J.; Xu, Y.; Kong, X.; Wei, Y.; Meng, D.; Zhang, Z. A Coumarin-Based Biosensor for Human Hepatocellular Carcinoma Diagnosis with Enhanced Brightness and Water Solubility. Mater. Chem. Front. 2021, 5, 7548–7557. [Google Scholar] [CrossRef]
- Attia, M.S.; Mohamed, A.A.; El-Saady, M.M.; Abou-Omar, M.N.; Afify, H.G.; Amin, T.A.; Hosny, A.H.; Youssef, A.O.; Mohy-Eldin, M.S. A New Method for Early Diagnosis of Liver Cancer Using a Biosensor Embedded in an Alginate Polymer Thin Film. J. Mater. Chem. C 2022, 10, 6464–6472. [Google Scholar] [CrossRef]
- Peng, X.; Zhu, J.; Liu, S.; Luo, C.; Wu, X.; Liu, Z.; Li, Y.; Yuan, R. Signature Construction and Molecular Subtype Identification Based on Cuproptosis-Related Genes to Predict the Prognosis and Immune Activity of Patients with Hepatocellular Carcinoma. Front. Immunol. 2022, 13, 990790. [Google Scholar] [CrossRef] [PubMed]
- Zhou, Y.; Li, X.; Long, G.; Tao, Y.; Zhou, L.; Tang, J. Identification and Validation of a Tyrosine Metabolism-Related Prognostic Prediction Model and Characterization of the Tumor Microenvironment Infiltration in Hepatocellular Carcinoma. Front. Immunol. 2022, 13, 994259. [Google Scholar] [CrossRef]
- Lee, S.-M.; Kim-Ha, J.; Choi, W.-Y.; Lee, J.; Kim, D.; Lee, J.; Choi, E.; Kim, Y.-J. Interplay of Genetic and Epigenetic Alterations in Hepatocellular Carcinoma. Epigenomics 2016, 8, 993–1005. [Google Scholar] [CrossRef]
- Liu, M.; Kisiel, J.; Tapper, E.; Parikh, N.; Yang, J.; Mannalithara, A.; Piscitello, A.; Tzartzeva, K.; Obi, J.; Rich, N. Circulating Tumor DNA and Hepatocellular Carcinoma; Thieme Medical Publishers: New York, NY, USA, 2019; Volume 39, pp. 452–462. [Google Scholar]
- Fujii, Y.; Ono, A.; Hayes, C.N.; Aikata, H.; Yamauchi, M.; Uchikawa, S.; Kodama, K.; Teraoka, Y.; Fujino, H.; Nakahara, T. Identification and Monitoring of Mutations in Circulating Cell-Free Tumor DNA in Hepatocellular Carcinoma Treated with Lenvatinib. J. Exp. Clin. Cancer Res. 2021, 40, 215. [Google Scholar] [CrossRef]
- Russano, M.; Napolitano, A.; Ribelli, G.; Iuliani, M.; Simonetti, S.; Citarella, F.; Pantano, F.; Dell’Aquila, E.; Anesi, C.; Silvestris, N. Liquid Biopsy and Tumor Heterogeneity in Metastatic Solid Tumors: The Potentiality of Blood Samples. J. Exp. Clin. Cancer Res. 2020, 39, 1–13. [Google Scholar] [CrossRef]
- Xu, R.; Wei, W.; Krawczyk, M.; Wang, W.; Luo, H.; Flagg, K.; Yi, S.; Shi, W.; Quan, Q.; Li, K. Circulating Tumour DNA Methylation Markers for Diagnosis and Prognosis of Hepatocellular Carcinoma. Nat. Mater. 2017, 16, 1155–1161. [Google Scholar] [CrossRef] [PubMed]
- Zucman-Rossi, J.; Villanueva, A.; Nault, J.-C.; Llovet, J.M. Genetic Landscape and Biomarkers of Hepatocellular Carcinoma. Gastroenterology 2015, 149, 1226–1239. [Google Scholar] [CrossRef]
- Sun, P.; Niu, K.; Du, H.; Li, R.; Chen, J.; Lu, X. Sensitive Electrochemical Biosensor for Rapid Screening of Tumor Biomarker TP53 Gene Mutation Hotspot. Biosensors 2022, 12, 658. [Google Scholar] [CrossRef]
- Giacomelli, A.O.; Yang, X.; Lintner, R.E.; McFarland, J.M.; Duby, M.; Kim, J.; Howard, T.P.; Takeda, D.Y.; Ly, S.H.; Kim, E.; et al. Mutational Processes Shape the Landscape of TP53 Mutations in Human Cancer. Nat. Genet. 2018, 50, 1381–1387. [Google Scholar] [CrossRef] [PubMed]
- Long, J.; Wang, A.; Bai, Y.; Lin, J.; Yang, X.; Wang, D.; Yang, X.; Jiang, Y.; Zhao, H. Development and Validation of a TP53-Associated Immune Prognostic Model for Hepatocellular Carcinoma. EBioMedicine 2019, 42, 363–374. [Google Scholar] [CrossRef] [PubMed]
- Lam, Y.K.; Yu, J.; Huang, H.; Ding, X.; Wong, A.M.; Leung, H.H.; Chan, A.W.; Ng, K.K.; Xu, M.; Wang, X. TP53 R249S Mutation in Hepatic Organoids Captures the Predisposing Cancer Risk. Hepatology 2022, 78, 727–740. [Google Scholar] [CrossRef] [PubMed]
- Wilson, P.K.; Jiang, T.; Minunni, M.E.; Turner, A.P.F.; Mascini, M. A Novel Optical Biosensor Format for the Detection of Clinically Relevant TP53 Mutations. Biosens. Bioelectron. 2005, 20, 2310–2313. [Google Scholar] [CrossRef] [PubMed]
- Fayazfar, H.; Afshar, A.; Dolati, M.; Dolati, A. DNA Impedance Biosensor for Detection of Cancer, TP53 Gene Mutation, Based on Gold Nanoparticles/Aligned Carbon Nanotubes Modified Electrode. Anal. Chim. Acta 2014, 836, 34–44. [Google Scholar] [CrossRef] [PubMed]
- Jiang, T.; Minunni, M.; Wilson, P.; Zhang, J.; Turner, A.P.F.; Mascini, M. Detection of TP53 Mutation Using a Portable Surface Plasmon Resonance DNA-Based Biosensor. Biosens. Bioelectron. 2005, 20, 1939–1945. [Google Scholar] [CrossRef] [PubMed]
- Clevers, H.; Nusse, R. Wnt/β-Catenin Signaling and Disease. Cell 2012, 149, 1192–1205. [Google Scholar] [CrossRef] [PubMed]
- Lee, J.-S. The Mutational Landscape of Hepatocellular Carcinoma. Clin. Mol. Hepatol. 2015, 21, 220. [Google Scholar] [CrossRef] [PubMed]
- Oversoe, S.K.; Clement, M.S.; Weber, B.; Grønbæk, H.; Hamilton-Dutoit, S.J.; Sorensen, B.S.; Kelsen, J. Combining Tissue and Circulating Tumor DNA Increases the Detection Rate of a CTNNB1 Mutation in Hepatocellular Carcinoma. BMC Cancer 2021, 21, 376. [Google Scholar] [CrossRef]
- Kumar, S.; Nadda, N.; Quadri, A.; Kumar, R.; Paul, S.; Tanwar, P.; Gamanagatti, S.; Dash, N.R.; Saraya, A.; Nayak, B. Assessments of TP53 and CTNNB1 Gene Hotspot Mutations in Circulating Tumour DNA of Hepatitis B Virus-Induced Hepatocellular Carcinoma. Front. Genet. 2023, 14, 1235260. [Google Scholar] [CrossRef]
- Ding, Y.; Su, S.; Tang, W.; Zhang, X.; Chen, S.; Zhu, G.; Liang, J.; Wei, W.; Guo, Y.; Liu, L. Enrichment of the β-Catenin–TCF Complex at the S and G2 Phases Ensures Cell Survival and Cell Cycle Progression. J. Cell Sci. 2014, 127, 4833–4845. [Google Scholar] [PubMed]
- Hernandez-Meza, G.; von Felden, J.; Gonzalez-Kozlova, E.E.; Garcia-Lezana, T.; Peix, J.; Portela, A.; Craig, A.J.; Sayols, S.; Schwartz, M.; Losic, B. DNA Methylation Profiling of Human Hepatocarcinogenesis. Hepatology 2021, 74, 183–199. [Google Scholar] [CrossRef] [PubMed]
- Yeh, S.-H.; Li, C.-L.; Lin, Y.-Y.; Ho, M.-C.; Wang, Y.-C.; Tseng, S.-T.; Chen, P.-J. Hepatitis B Virus DNA Integration Drives Carcinogenesis and Provides a New Biomarker for HBV-Related HCC. Cell. Mol. Gastroenterol. Hepatol. 2023, 15, 921–929. [Google Scholar] [CrossRef] [PubMed]
- Akuta, N.; Suzuki, F.; Kobayashi, M.; Fujiyama, S.; Kawamura, Y.; Sezaki, H.; Hosaka, T.; Kobayashi, M.; Saitoh, S.; Arase, Y. Detection of TERT Promoter Mutation in Serum Cell-free DNA Using Wild-type Blocking PCR Combined with Sanger Sequencing in Hepatocellular Carcinoma. J. Med. Virol. 2020, 92, 3604–3608. [Google Scholar] [CrossRef]
- Huang, C.; Filippone, N.R.; Reiner, T.; Roberts, S. Sensors and Inhibitors for the Detection of Ataxia Telangiectasia Mutated (ATM) Protein Kinase. Mol. Pharm. 2021, 18, 2470–2481. [Google Scholar] [CrossRef] [PubMed]
- Han, R.; Feng, P.; Pang, J.; Zou, D.; Li, X.; Geng, C.; Li, L.; Min, J.; Shi, J. A Novel HCC Prognosis Predictor EEF1E1 Is Related to Immune Infiltration and May Be Involved in EEF1E1/ATM/P53 Signaling. Front. Oncol. 2021, 11, 700972. [Google Scholar] [CrossRef] [PubMed]
- Nyati, S.; Young, G.; Ross, B.D.; Rehemtulla, A. Quantitative and Dynamic Imaging of ATM Kinase Activity. In Synthetic Protein Switches. Methods in Molecular Biology; Humana Press: New York, NY, USA, 2017; pp. 131–145. [Google Scholar]
- Placzek, E.A.; Plebanek, M.P.; Lipchik, A.M.; Kidd, S.R.; Parker, L.L. A Peptide Biosensor for Detecting Intracellular Abl Kinase Activity Using Matrix-Assisted Laser Desorption/Ionization Time-of-Flight Mass Spectrometry. Anal. Biochem. 2010, 397, 73–78. [Google Scholar] [CrossRef]
- Tang, J.; Wang, J.Y.; Parker, L.L. Detection of Early Abl Kinase Activation after Ionizing Radiation by Using a Peptide Biosensor. Chembiochem 2012, 13, 665–673. [Google Scholar] [CrossRef] [PubMed]
- Chun, H.H.; Sun, X.; Nahas, S.A.; Teraoka, S.; Lai, C.-H.; Concannon, P.; Gatti, R.A. Improved Diagnostic Testing for Ataxia–Telangiectasia by Immunoblotting of Nuclear Lysates for ATM Protein Expression. Mol. Genet. Metab. 2003, 80, 437–443. [Google Scholar] [CrossRef]
- Fu, S.; Debes, J.D.; Boonstra, A. DNA Methylation Markers in the Detection of Hepatocellular Carcinoma. Eur. J. Cancer 2023, 191, 112960. [Google Scholar] [CrossRef]
- Luo, H.; Wei, W.; Ye, Z.; Zheng, J.; Xu, R. Liquid Biopsy of Methylation Biomarkers in Cell-Free DNA. Trends Mol. Med. 2021, 27, 482–500. [Google Scholar] [CrossRef] [PubMed]
- Luo, B.; Ma, F.; Liu, H.; Hu, J.; Rao, L.; Liu, C.; Jiang, Y.; Kuangzeng, S.; Lin, X.; Wang, C. Cell-Free DNA Methylation Markers for Differential Diagnosis of Hepatocellular Carcinoma. BMC Med. 2022, 20, 8. [Google Scholar] [CrossRef] [PubMed]
- Martisova, A.; Holcakova, J.; Izadi, N.; Sebuyoya, R.; Hrstka, R.; Bartosik, M. DNA Methylation in Solid Tumors: Functions and Methods of Detection. Int. J. Mol. Sci. 2021, 22, 4247. [Google Scholar] [CrossRef] [PubMed]
- Gouil, Q.; Keniry, A. Latest Techniques to Study DNA Methylation. Essays Biochem. 2019, 63, 639–648. [Google Scholar] [PubMed]
- Zhang, S.; Yan, J.; Yang, Y.; Mo, F.; Li, Y.; Huang, H.; Fang, L.; Huang, J.; Zheng, J. DNA Methylation Detection and Site Analysis by Using an Electrochemical Biosensor Constructed Based on Toehold-Mediated Strand Displacement Reaction. Talanta 2022, 249, 123603. [Google Scholar] [CrossRef] [PubMed]
- Lin, C.; Huang, Q.; Tian, M.; Luo, F.; Wang, J.; Qiu, B.; Yang, S.; Lin, Z. Electrochemiluminescence Biosensor for DNA Adenine Methylation Methyltransferase Based on CRISPR/Cas12a Trans-Cleavage-Induced Dual Signal Enhancement. Talanta 2023, 251, 123748. [Google Scholar] [CrossRef] [PubMed]
- Chen, X.; Huang, J.; Zhang, S.; Mo, F.; Su, S.; Li, Y.; Fang, L.; Deng, J.; Huang, H.; Luo, Z.; et al. Electrochemical Biosensor for DNA Methylation Detection through Hybridization Chain-Amplified Reaction Coupled with a Tetrahedral DNA Nanostructure. ACS Appl. Mater. Interfaces 2019, 11, 3745–3752. [Google Scholar] [CrossRef] [PubMed]
- de Sousa, M.C.; Gjorgjieva, M.; Dolicka, D.; Sobolewski, C.; Foti, M. Deciphering miRNAs’ Action through miRNA Editing. Int. J. Mol. Sci. 2019, 20, 6249. [Google Scholar] [CrossRef] [PubMed]
- Roderburg, C.; Luedde, T. Circulating microRNAs as Markers of Liver Inflammation, Fibrosis and Cancer. J. Hepatol. 2014, 61, 1434–1437. [Google Scholar] [CrossRef]
- Zhou, Y.; Liu, F.; Ma, C.; Cheng, Q. Involvement of microRNAs and Their Potential Diagnostic, Therapeutic, and Prognostic Role in Hepatocellular Carcinoma. J. Clin. Lab. Anal. 2022, 36, e24673. [Google Scholar] [CrossRef]
- Esquela-Kerscher, A.; Slack, F.J. Oncomirs-microRNAs with a Role in Cancer. Nat. Rev. Cancer 2006, 6, 259–269. [Google Scholar] [CrossRef]
- Świtlik, W.Z.; Bielecka-Kowalska, A.; Karbownik, M.S.; Kordek, R.; Jabłkowski, M.; Szemraj, J. Forms of Diagnostic Material as Sources of miRNA Biomarkers in Hepatocellular Carcinoma: A Preliminary Study. Biomark. Med. 2019, 13, 523–534. [Google Scholar] [CrossRef] [PubMed]
- Sayed, G.I.; Solyman, M.; El Gedawy, G.; Moemen, Y.S.; Aboul-Ella, H.; Hassanien, A.E. Circulating miRNA’s Biomarkers for Early Detection of Hepatocellular Carcinoma in Egyptian Patients Based on Machine Learning Algorithms. Sci. Rep. 2024, 14, 4989. [Google Scholar] [CrossRef]
- Tian, T.; Wang, J.; Zhou, X. A Review: microRNA Detection Methods. Org. Biomol. Chem. 2015, 13, 2226–2238. [Google Scholar] [CrossRef]
- Chinnappan, R.; Mohammed, R.; Yaqinuddin, A.; Abu-Salah, K.; Zourob, M. Highly Sensitive Multiplex Detection of microRNA by Competitive DNA Strand Displacement Fluorescence Assay. Talanta 2019, 200, 487–493. [Google Scholar] [CrossRef] [PubMed]
- Elhakim, H.K.; Azab, S.M.; Fekry, A.M. A Novel Simple Biosensor Containing Silver Nanoparticles/Propolis (Bee Glue) for microRNA Let-7a Determination. Mater. Sci. Eng. C 2018, 92, 489–495. [Google Scholar] [CrossRef] [PubMed]
- Liu, Y.; Shen, T.; Li, J.; Gong, H.; Chen, C.; Chen, X.; Cai, C. Ratiometric Fluorescence Sensor for the MicroRNA Determination by Catalyzed Hairpin Assembly. ACS Sens. 2017, 2, 1430–1434. [Google Scholar] [CrossRef]
- Liu, A.M.; Yao, T.J.; Wang, W.; Wong, K.F.; Lee, N.P.; Fan, S.T.; Poon, R.T.P.; Gao, C.; Luk, J.M. Circulating miR-15b and miR-130b in Serum as Potential Markers for Detecting Hepatocellular Carcinoma: A Retrospective Cohort Study. BMJ Open 2012, 2, e000825. [Google Scholar] [CrossRef]
- Fang, Y.; Yan, D.; Wang, L.; Zhang, J.; He, Q. Circulating microRNAs (miR-16, miR-22, miR-122) Expression and Early Diagnosis of Hepatocellular Carcinoma. J. Clin. Lab. Anal. 2022, 36, e24541. [Google Scholar] [CrossRef]
- Wu, S.; Liang, Y.; Xu, Y.; Tong, Y.; Chen, Y.; Chen, X. Graphene-Based Electrochemical Sensor for Detection of Hepatocellular Carcinoma Markers. Front. Chem. 2022, 10, 883627. [Google Scholar] [CrossRef]
- Chen, F.; Zhang, F.; Liu, Y.; Cai, C. Simply and Sensitively Simultaneous Detection Hepatocellular Carcinoma Markers AFP and miRNA-122 by a Label-Free Resonance Light Scattering Sensor. Talanta 2018, 186, 473–480. [Google Scholar] [CrossRef] [PubMed]
- Zou, R.; Zhang, F.; Chen, C.; Cai, C. An Ultrasensitive Guanine Wire-Based Resonance Light Scattering Method Using G-Quadruplex Self-Assembly for Determination of microRNA-122. Mikrochim. Acta 2019, 186, 599. [Google Scholar] [CrossRef] [PubMed]
- Wang, F.; Chu, Y.; Ai, Y.; Chen, L.; Gao, F. Graphene Oxide with in-Situ Grown Prussian Blue as an Electrochemical Probe for microRNA-122. Mikrochim. Acta 2019, 186, 116. [Google Scholar] [CrossRef] [PubMed]
- Wu, J.; Zhou, X.; Li, P.; Lin, X.; Wang, J.; Hu, Z.; Zhang, P.; Chen, D.; Cai, H.; Niessner, R.; et al. Ultrasensitive and Simultaneous SERS Detection of Multiplex MicroRNA Using Fractal Gold Nanotags for Early Diagnosis and Prognosis of Hepatocellular Carcinoma. Anal. Chem. 2021, 93, 8799–8809. [Google Scholar] [CrossRef]
- Gao, T.; Zhi, J.; Mu, C.; Gu, S.; Xiao, J.; Yang, J.; Wang, Z.; Xiang, Y. One-Step Detection for Two Serological Biomarker Species to Improve the Diagnostic Accuracy of Hepatocellular Carcinoma. Talanta 2018, 178, 89–93. [Google Scholar] [CrossRef] [PubMed]
- Yuan, Y.H.; Wu, Y.D.; Chi, B.Z.; Wen, S.H.; Liang, R.P.; Qiu, J.D. Simultaneously Electrochemical Detection of microRNAs Based on Multifunctional Magnetic Nanoparticles Probe Coupling with Hybridization Chain Reaction. Biosens. Bioelectron. 2017, 97, 325–331. [Google Scholar] [CrossRef] [PubMed]
- Zheng, J.; Ma, D.; Shi, M.; Bai, J.; Li, Y.; Yang, J.; Yang, R. A New Enzyme-Free Quadratic SERS Signal Amplification Approach for Circulating microRNA Detection in Human Serum. Chem. Commun. 2015, 51, 16271–16274. [Google Scholar] [CrossRef] [PubMed]
- Deng, H.; Liu, Q.; Wang, X.; Huang, R.; Liu, H.; Lin, Q.; Zhou, X.; Xing, D. Quantum Dots-Labeled Strip Biosensor for Rapid and Sensitive Detection of microRNA Based on Target-Recycled Nonenzymatic Amplification Strategy. Biosens. Bioelectron. 2017, 87, 931–940. [Google Scholar] [CrossRef] [PubMed]
- Erdem, A.; Eksin, E. Zip Nucleic Acid-Based Genomagnetic Assay for Electrochemical Detection of microRNA-34a. Biosensors 2023, 13, 144. [Google Scholar] [CrossRef]
- Wen, H.Y.; Huang, C.W.; Li, Y.L.; Chen, J.L.; Yeh, Y.T.; Chiang, C.C. A Lamping U-Shaped Fiber Biosensor Detector for MicroRNA. Sensors 2020, 20, 1509. [Google Scholar] [CrossRef]
- Wang, Y.; Meng, W.; Chen, X.; Zhang, Y. DNA-Templated Copper Nanoparticles as Signalling Probe for Electrochemical Determination of microRNA-222. Microchim. Acta 2020, 187, 4. [Google Scholar] [CrossRef] [PubMed]
- Li, J.; Shang, L.; Jia, L.-P.; Ma, R.-N.; Zhang, W.; Jia, W.-L.; Wang, H.-S.; Xu, K.-H. An Ultrasensitive Electrochemiluminescence Sensor for the Detection of HULC Based on Au@ Ag/GQDs as a Signal Indicator. J. Electroanal. Chem. 2018, 824, 114–120. [Google Scholar] [CrossRef]
- Zhang, T.; Chai, H.; Meng, F.; Guo, Z.; Jiang, Y.; Miao, P. DNA-Functionalized Porous Fe3O4 Nanoparticles for the Construction of Self-Powered miRNA Biosensor with Target Recycling Amplification. ACS Appl. Mater. Interfaces 2018, 10, 36796–36804. [Google Scholar] [CrossRef] [PubMed]
- Miao, P.; Zhang, T.; Xu, J.; Tang, Y. Electrochemical Detection of miRNA Combining T7 Exonuclease-Assisted Cascade Signal Amplification and DNA-Templated Copper Nanoparticles. Anal. Chem. 2018, 90, 11154–11160. [Google Scholar] [CrossRef] [PubMed]
- Xu, S.; Chang, Y.; Wu, Z.; Li, Y.; Yuan, R.; Chai, Y. One DNA Circle Capture Probe with Multiple Target Recognition Domains for Simultaneous Electrochemical Detection of miRNA-21 and miRNA-155. Biosens. Bioelectron. 2020, 149, 111848. [Google Scholar] [CrossRef]
- Guo, Q.; Yu, Y.; Zhang, H.; Cai, C.; Shen, Q. Electrochemical Sensing of Exosomal microRNA Based on Hybridization Chain Reaction Signal Amplification with Reduced False-Positive Signals. Anal. Chem. 2020, 92, 5302–5310. [Google Scholar] [CrossRef] [PubMed]
- Xu, E.; Feng, Y.; Yang, H.; Li, P.; Kong, L.; Wei, W.; Liu, S. Ultrasensitive and Specific Multi-miRNA Detection Based on Dual Signal Amplification. Sens. Actuators B Chem. 2021, 337, 129745. [Google Scholar] [CrossRef]
- Meng, T.; Zhao, D.; Ye, H.; Feng, Y.; Wang, H.; Zhang, Y. Construction of an Ultrasensitive Electrochemical Sensing Platform for microRNA-21 Based on Interface Impedance Spectroscopy. J. Colloid. Interface Sci. 2020, 578, 164–170. [Google Scholar] [CrossRef]
- Luo, L.; Wang, L.; Zeng, L.; Wang, Y.; Weng, Y.; Liao, Y.; Chen, T.; Xia, Y.; Zhang, J.; Chen, J. A Ratiometric Electrochemical DNA Biosensor for Detection of Exosomal MicroRNA. Talanta 2020, 207, 120298. [Google Scholar] [CrossRef]
- Yu, S.; Chen, S.; Dang, Y.; Zhou, Y.; Zhu, J.-J. An Ultrasensitive Electrochemical Biosensor Integrated by Nicking Endonuclease-Assisted Primer Exchange Reaction Cascade Amplification and DNA Nanosphere-Mediated Electrochemical Signal-Enhanced System for microRNA Detection. Anal. Chem. 2022, 94, 14349–14357. [Google Scholar] [CrossRef]
- Park, H.J.; Lee, S.S. QCM Sensing of miR-21 by Formation of microRNA–DNA Hybrid Duplexes and Intercalation on Surface-Functionalized Pyrene. Analyst 2019, 144, 6936–6943. [Google Scholar] [CrossRef]
- Premaratne, G.; Al Mubarak, Z.H.; Senavirathna, L.; Liu, L.; Krishnan, S. Measuring Ultra-Low Levels of Nucleotide Biomarkers Using Quartz Crystal Microbalance and SPR Microarray Imaging Methods: A Comparative Analysis. Sens. Actuators B Chem. 2017, 253, 368–375. [Google Scholar] [CrossRef]
- Su, Y.H.; Lin, S.Y.; Song, W.; Jain, S. DNA Markers in Molecular Diagnostics for Hepatocellular Carcinoma. Expert Rev. Mol. Diagn. 2014, 14, 803–817. [Google Scholar] [CrossRef]
- Cai, Z.; Chen, G.; Zeng, Y.; Dong, X.; Li, Z.; Huang, Y.; Xin, F.; Qiu, L.; Xu, H.; Zhang, W.; et al. Comprehensive Liquid Profiling of Circulating Tumor DNA and Protein Biomarkers in Long-Term Follow-Up Patients with Hepatocellular Carcinoma. Clin. Cancer Res. Off. J. Am. Assoc. Cancer Res. 2019, 25, 5284–5294. [Google Scholar] [CrossRef]
- Mezzalira, S.; De Mattia, E.; Guardascione, M.; Fratte, C.D.; Cecchin, E.; Toffoli, G. Circulating-Free DNA Analysis in Hepatocellular Carcinoma: A Promising Strategy to Improve Patients’ Management and Therapy Outcomes. Int. J. Mol. Sci. 2019, 20, 5498. [Google Scholar] [CrossRef]
- Johnson, S.W.; Alhadeff, J.A. Mammalian α-L-Fucosidases. Comp. Biochem. Physiol. Part. B Comp. Biochem. 1991, 99, 479–488. [Google Scholar] [CrossRef]
- Montaser, M.F.; Sakr, M.A.; Khalifa, M.O. Alpha-L-Fucosidase as a Tumour Marker of Hepatocellular Carcinoma. Arab. J. Gastroenterol. 2012, 13, 9–13. [Google Scholar] [CrossRef]
- Zhao, Y.-J.; Ju, Q.; Li, G.-C. Tumor Markers for Hepatocellular Carcinoma. Mol. Clin. Oncol. 2013, 1, 593–598. [Google Scholar] [CrossRef]
- Han, X.; Shokri Kojori, H.; Leblanc, R.M.; Kim, S.J. Ultrasensitive Plasmonic Biosensors for Real-Time Parallel Detection of Alpha-L-Fucosidase and Cardiac-Troponin-I in Whole Human Blood. Anal. Chem. 2018, 90, 7795–7799. [Google Scholar] [CrossRef]
- Niu, Y.; Kang, T.; Jin, G. Joint Detection of Tumor Markers with Imaging Ellipsometry Biosensor. Thin Solid Films 2014, 571, 453–462. [Google Scholar] [CrossRef]
- Othman, A.M.; El-Houseini, M.; El-Sofy, M.S.; Aboul-Enein, H.Y. Potentiometric Determination of α-L-Fucosidase Enzyme by Using 2-Chloro-4-Nitrophenol-Rhodamine B Ion Pair Chemical Recognition in PVC Membrane Sensor. Anal. Bioanal. Chem. 2011, 400, 787–795. [Google Scholar] [CrossRef]
- Chen, Z.; Ren, X.; Meng, X.; Zhang, Y.; Chen, D.; Tang, F. Novel Fluorescence Method for Detection of α-L-Fucosidase Based on CdTe Quantum Dots. Anal. Chem. 2012, 84, 4077–4082. [Google Scholar] [CrossRef]
- Mintz, K.; Waidely, E.; Zhou, Y.; Peng, Z.; Al-Youbi, A.O.; Bashammakh, A.S.; El-Shahawi, M.S.; Leblanc, R.M. Carbon Dots and Gold Nanoparticles Based Immunoassay for Detection of Alpha-L-Fucosidase. Anal. Chim. Acta 2018, 1041, 114–121. [Google Scholar] [CrossRef]
- Zhou, F.; Shang, W.; Yu, X.; Tian, J. Glypican-3: A Promising Biomarker for Hepatocellular Carcinoma Diagnosis and Treatment. Med. Res. Rev. 2018, 38, 741–767. [Google Scholar] [CrossRef]
- Wang, L.; Yao, M.; Pan, L.-H.; Qian, Q.; Yao, D.-F. Glypican-3 Is a Biomarker and a Therapeutic Target of Hepatocellular Carcinoma. Hepatobiliary Pancreat. Dis. Int. 2015, 14, 361–366. [Google Scholar] [CrossRef]
- Yang, S.-L.; Fang, X.; Huang, Z.-Z.; Liu, X.-J.; Xiong, Z.-F.; Liu, P.; Yao, H.-Y.; Li, C.-H. Can Serum Glypican-3 Be a Biomarker for Effective Diagnosis of Hepatocellular Carcinoma? A Meta-Analysis of the Literature. Dis. Markers 2014, 2014, 127831. [Google Scholar] [CrossRef]
- Chikhaliwala, P.; Rai, R.; Chandra, S. Simultaneous Voltammetric Immunodetection of Alpha-Fetoprotein and Glypican-3 Using a Glassy Carbon Electrode Modified with Magnetite-Conjugated Dendrimers. Microchim. Acta 2019, 186, 255. [Google Scholar] [CrossRef]
- Li, G.; Chen, W.; Mi, D.; Wang, B.; Li, H.; Wu, G.; Ding, P.; Liang, J.; Zhou, Z. A Highly Sensitive Strategy for Glypican-3 Detection Based on Aptamer/Gold Carbon Dots/Magnetic Graphene Oxide Nanosheets as Fluorescent Biosensor. Anal. Bioanal. Chem. 2022, 414, 6441–6453. [Google Scholar] [CrossRef]
- Li, G.; Li, H.; Chen, W.; Chen, H.; Wu, G.; Tan, M.; Liang, J.; Zhou, Z. Highly Sensitive Electrochemical Aptasensor for Detection of Glypican-3 Using Hemin-Reduced Graphene Oxide-Platinum Nanoparticles Coupled with Conductive Reduced Graphene Oxide-Gold Nanoparticles. J. Biomed. Nanotechnol. 2021, 17, 2444–2454. [Google Scholar] [CrossRef]
- Li, G.; Li, W.; Li, S.; Li, X.; Yao, X.; Xue, W.; Liang, J.; Chen, J.; Zhou, Z. A Label-Free Electrochemical Aptasensor Based on Platinum@ Palladium Nanoparticles Decorated with Hemin-Reduced Graphene Oxide as a Signal Amplifier for Glypican-3 Determination. Biomater. Sci. 2022, 10, 6804–6817. [Google Scholar] [CrossRef]
- Li, G.; Feng, H.; Shi, X.; Chen, M.; Liang, J.; Zhou, Z. Highly Sensitive Electrochemical Aptasensor for Glypican-3 Based on Reduced Graphene Oxide-Hemin Nanocomposites Modified on Screen-Printed Electrode Surface. Bioelectrochemistry 2021, 138, 107696. [Google Scholar] [CrossRef] [PubMed]
- Zhou, Z.; Zhao, L.; Li, W.; Chen, M.; Feng, H.; Shi, X.; Liang, J.; Li, G. Glypican-3 Electrochemical Aptamer Nanobiosensor Based on Hemin/Graphene Nanohybrids Peroxidase-like Catalytic Silver Deposition. Microchim. Acta 2020, 187, 305. [Google Scholar] [CrossRef] [PubMed]
- Li, S.; Li, X.; Cao, L.; Wang, C.; Liang, J.; Zhou, Z.; Li, G. An Ultrasensitive Glypican-3 Electrochemical Aptasensor Based on Reduced Graphene Oxide-Carboxymethylchitosan-Hemin/Palladium Nanoparticles. J. Electrochem. Soc. 2022, 169, 087517. [Google Scholar] [CrossRef]
- Chen, M.; Li, H.; Su, X.; Wu, R.; Feng, H.; Shi, X.; Liang, J.; Chen, J.; Li, G. Label-Free Electrochemical Aptasensor Based on Reduced Graphene Oxide–Hemin–Chitosan Nanocomposite for the Determination of Glypican-3. New J. Chem. 2021, 45, 8608–8618. [Google Scholar] [CrossRef]
- Shi, X.; Chen, M.; Feng, H.; Zhou, Z.; Wu, R.; Li, W.; Liang, J.; Chen, J.; Li, G. Glypican-3 Electrochemical Aptasensor Based on Reduced Graphene Oxide-chitosan-ferrocene Deposition of Platinum–Palladium Bimetallic Nanoparticles. J. Appl. Electrochem. 2021, 51, 781–794. [Google Scholar] [CrossRef]
- Hu, X.; Chen, R.; Wei, Q.; Xu, X. The Landscape Of Alpha Fetoprotein In Hepatocellular Carcinoma: Where Are We? Int. J. Biol. Sci. 2022, 18, 536. [Google Scholar] [CrossRef]
- Galle, P.R.; Foerster, F.; Kudo, M.; Chan, S.L.; Llovet, J.M.; Qin, S.; Schelman, W.R.; Chintharlapalli, S.; Abada, P.B.; Sherman, M.; et al. Biology and Significance of Alpha-Fetoprotein in Hepatocellular Carcinoma. Liver Int. Off. J. Int. Assoc. Study Liver 2019, 39, 2214–2229. [Google Scholar] [CrossRef]
- Zhou, L.; Ji, F.; Zhang, T.; Wang, F.; Li, Y.; Yu, Z.; Jin, X.; Ruan, B. An Fluorescent Aptasensor for Sensitive Detection of Tumor Marker Based on the FRET of a Sandwich Structured QDs-AFP-AuNPs. Talanta 2019, 197, 444–450. [Google Scholar] [CrossRef]
- Li, S.; Liu, X.; Liu, S.; Guo, M.; Liu, C.; Pei, M. Fluorescence Sensing Strategy Based on Aptamer Recognition and Mismatched Catalytic Hairpin Assembly for Highly Sensitive Detection of Alpha-Fetoprotein. Anal. Chim. Acta 2021, 1141, 21–27. [Google Scholar] [CrossRef]
- Zhou, J.; Zhang, C.; Chen, Y.; Wang, Z.; Lan, L.; Wang, Y.; Han, B.; Pan, M.; Jiao, J.; Chen, Q. A Simple Immunosensor for Alpha-Fetoprotein Determination Based on Gold Nanoparticles-Dextran-Reduced Graphene Oxide. J. Electroanal. Chem. 2019, 833, 126–132. [Google Scholar] [CrossRef]
- Hui, N.; Sun, X.; Song, Z.; Niu, S.; Luo, X. Gold Nanoparticles and Polyethylene Glycols Functionalized Conducting Polyaniline Nanowires for Ultrasensitive and Low Fouling Immunosensing of Alpha-Fetoprotein. Biosens. Bioelectron. 2016, 86, 143–149. [Google Scholar] [CrossRef]
- Shan, J.; Wang, L.; Ma, Z. Novel Metal-Organic Nanocomposites: Poly(Methylene Blue)-Au and Its Application for an Ultrasensitive Electrochemical Immunosensing Platform. Sens. Actuators B Chem. 2016, 237, 666–671. [Google Scholar] [CrossRef]
- Zhang, J.H.; Liu, M.; Zhou, F.; Yan, H.L.; Zhou, Y.G. Homogeneous Electrochemical Immunoassay Using an Aggregation-Collision Strategy for Alpha-Fetoprotein Detection. Anal. Chem. 2023, 95, 3045–3053. [Google Scholar] [CrossRef]
- Sun, Z.H.; Zhang, X.X.; Xu, D.; Liu, J.; Yu, R.J.; Jing, C.; Han, H.X.; Ma, W. Silver-Amplified Fluorescence Immunoassay via Aggregation-Induced Emission for Detection of Disease Biomarker. Talanta 2021, 225, 121963. [Google Scholar] [CrossRef]
- Li, J.; Liu, D.; Zhou, D.; Shao, L.; Chen, X.; Song, H. Label-Free Photoelectrochemical Biosensor for Alpha-Fetoprotein Detection Based on Au/CsxWO3 Heterogeneous Films. Talanta 2021, 225, 122074. [Google Scholar] [CrossRef]
- Yao, C.; Ng, E.; Wang, S.X. An Automated and Mobile Magnetoresistive Biosensor System for Early Hepatocellular Carcinoma Diagnosis. Biosens. Bioelectron. 2022, 202, 113982. [Google Scholar] [CrossRef]
- Mao, Y.; Yang, H.; Xu, H.; Lu, X.; Sang, X.; Du, S.; Zhao, H.; Chen, W.; Xu, Y.; Chi, T.; et al. Golgi Protein 73 (GOLPH2) Is a Valuable Serum Marker for Hepatocellular Carcinoma. Gut 2010, 59, 1687–1693. [Google Scholar] [CrossRef]
- Yao, M.; Wang, L.; Leung, P.S.C.; Li, Y.; Liu, S.; Wang, L.; Guo, X.; Zhou, G.; Yan, Y.; Guan, G.; et al. The Clinical Significance of GP73 in Immunologically Mediated Chronic Liver Diseases: Experimental Data and Literature Review. Clin. Rev. Allergy Immunol. 2018, 54, 282–294. [Google Scholar] [CrossRef]
- Yu, Y.; Gao, T.; Li, H.; Ye, Z.; Chen, Z.; Li, G. A Novel Electrochemical Immunosensor for Golgi Protein 73 Assay. Electrochem. Commun. 2014, 42, 6–8. [Google Scholar] [CrossRef]
- Liang, J.; Yan, R.; Chen, C.; Yao, X.; Guo, F.; Wu, R.; Zhou, Z.; Chen, J.; Li, G. A Novel Fluorescent Strategy for Golgi Protein 73 Determination Based on Aptamer/Nitrogen-Doped Graphene Quantum Dots/Molybdenum Disulfide @ Reduced Graphene Oxide Nanosheets. Spectrochim. Acta Part A Mol. Biomol. Spectrosc. 2023, 294, 122538. [Google Scholar] [CrossRef] [PubMed]
- Liu, W.; Zhang, A.; Xu, G.; Wei, F.; Yang, J.; Hu, Q. Manganese Modified CdTe/CdS Quantum Dots as an Immunoassay Biosensor for the Detection of Golgi Protein-73. J. Pharm. Biomed. Anal. 2016, 117, 18–25. [Google Scholar] [CrossRef]
- Li, X.; Li, S.; Lv, Q.; Wang, C.; Liang, J.; Zhou, Z.; Li, G. Colorimetric Biosensor for Visual Determination of Golgi Protein 73 Based on Reduced Graphene Oxide-Carboxymethyl Chitosan-Hemin/Platinum@palladium Nanozyme with Peroxidase-like Activity. Mikrochim. Acta 2022, 189, 392. [Google Scholar] [CrossRef]
- Lin, Y.; Jia, J.; Yang, R.; Chen, D.; Wang, J.; Luo, F.; Guo, L.; Qiu, B.; Lin, Z. Ratiometric Immunosensor for GP73 Detection Based on the Ratios of Electrochemiluminescence and Electrochemical Signal Using DNA Tetrahedral Nanostructure as the Carrier of Stable Reference Signal. Anal. Chem. 2019, 91, 3717–3724. [Google Scholar] [CrossRef]
- Sun, X.; Fang, F.; Na, J.; Yan, R.; Huang, Y.; Zhou, Z.; Zhao, Y.; Li, G. Fluorescent “Turn-on” Aptamer Sensor for Sensitive and Reliable Detection of Golgi Glycoprotein 73 Based on Nitrogen-Doped Graphene Quantum Dots and Molybdenum Disulfide Nanosheets. J. Pharm. Biomed. Anal. 2023, 225, 115215. [Google Scholar] [CrossRef]
- Li, G.; Chen, M.; Wang, B.; Wang, C.; Wu, G.; Liang, J.; Zhou, Z. Dual-Signal Sandwich-Type Aptasensor Based on H-rGO-Mn3O4 Nanozymes for Ultrasensitive Golgi Protein 73 Determination. Anal. Chim. Acta 2022, 1221, 340102. [Google Scholar] [CrossRef]
- Zhang, Y.; Huang, X.; Luo, F.; Lei, Y.; Chen, L.; Weng, Z.; Guo, L.; Lin, Z. Highly Sensitive Electrochemical Immunosensor for Golgi Protein 73 Based on Proximity Ligation Assay and Enzyme-Powered Recycling Amplification. Anal. Chim. Acta 2018, 1040, 150–157. [Google Scholar] [CrossRef]
- Wei, X.; Xia, Y.; Shen, M.; Yang, Y.; Jin, J.; Xu, H.; Li, Z. Magnetic Nanoparticle-Based Automatic Chemiluminescent Enzyme Immunoassay for Golgi Protein 73 and the Clinical Assessment. J. Nanosci. Nanotechnol. 2019, 19, 1971–1977. [Google Scholar] [CrossRef]
- Shevde, L.A.; Das, S.; Clark, D.W.; Samant, R.S. Osteopontin: An Effector and an Effect of Tumor Metastasis. Curr. Mol. Med. 2010, 10, 71. [Google Scholar] [CrossRef]
- Shang, S.; Plymoth, A.; Ge, S.; Feng, Z.; Rosen, H.R.; Sangrajrang, S.; Hainaut, P.; Marrero, J.A.; Beretta, L. Identification of Osteopontin as a Novel Marker for Early Hepatocellular Carcinoma. Hepatology 2012, 55, 483. [Google Scholar] [CrossRef] [PubMed]
- Mukama, O.; Wu, W.; Wu, J.; Lu, X.; Liu, Y.; Liu, Y.; Liu, J.; Zeng, L. A Highly Sensitive and Specific Lateral Flow Aptasensor for the Detection of Human Osteopontin. Talanta 2020, 210, 120624. [Google Scholar] [CrossRef] [PubMed]
- Meirinho, S.G.; Dias, L.G.; Peres, A.M.; Rodrigues, L.R. Development of an Electrochemical RNA-Aptasensor to Detect Human Osteopontin. Biosens. Bioelectron. 2015, 71, 332–341. [Google Scholar] [CrossRef] [PubMed]
- Meirinho, S.G.; Dias, L.G.; Peres, A.M.; Rodrigues, L.R. Electrochemical Aptasensor for Human Osteopontin Detection Using a DNA Aptamer Selected by SELEX. Anal. Chim. Acta 2017, 987, 25–37. [Google Scholar] [CrossRef]
- Zhou, S.; Hu, M.; Huang, X.; Zhou, N.; Zhang, Z.; Wang, M.; Liu, Y.; He, L. Electrospun Zirconium Oxide Embedded in Graphene-like Nanofiber for Aptamer-Based Impedimetric Bioassay toward Osteopontin Determination. Mikrochim. Acta 2020, 187, 219. [Google Scholar] [CrossRef] [PubMed]
- Chen, H.; Yang, F.; Yin, G.; Song, P. Nanomaterial-Assisted Determination of Osteosarcoma by Antibody-Osteopontin-Aptamer Sandwich ELISA. Biotechnol. Appl. Biochem. 2022, 69, 1646–1652. [Google Scholar] [CrossRef] [PubMed]
- Sharma, A.; Hong, S.; Singh, R.; Jang, J. Single-Walled Carbon Nanotube Based Transparent Immunosensor for Detection of a Prostate Cancer Biomarker Osteopontin. Anal. Chim. Acta 2015, 869, 68–73. [Google Scholar] [CrossRef] [PubMed]
- Zhou, S.; Gu, C.; Li, Z.; Yang, L.; He, L.; Wang, M.; Huang, X.; Zhou, N.; Zhang, Z. Ti3C2Tx MXene and Polyoxometalate Nanohybrid Embedded with Polypyrrole: Ultra-Sensitive Platform for the Detection of Osteopontin. Appl. Surf. Sci. 2019, 498, 143889. [Google Scholar] [CrossRef]
- Giannelli, G.; Marinosci, F.; Sgarra, C.; Lupo, L.; Dentico, P.; Antonaci, S. Clinical Role of Tissue and Serum Levels of SCCA Antigen in Hepatocellular Carcinoma. Int. J. Cancer 2005, 116, 579–583. [Google Scholar] [CrossRef] [PubMed]
- Guido, M.; Roskams, T.; Pontisso, P.; Fassan, M.; Thung, S.N.; Giacomelli, L.; Sergio, A.; Farinati, F.; Cillo, U.; Rugge, M. Squamous Cell Carcinoma Antigen in Human Liver Carcinogenesis. J. Clin. Pathol. 2008, 61, 445–447. [Google Scholar] [CrossRef] [PubMed]
- Liu, Y.; Ma, H.; Gao, J.; Wu, D.; Ren, X.; Yan, T.; Pang, X.; Wei, Q. Ultrasensitive Electrochemical Immunosensor for SCCA Detection Based on Ternary Pt/PdCu Nanocube Anchored on Three-Dimensional Graphene Framework for Signal Amplification. Biosens. Bioelectron. 2016, 79, 71–78. [Google Scholar] [CrossRef]
- Wei, Q.; Wang, C.; Zhou, X.; Wu, T.; Wang, Y.; Li, C.; Yang, N. Ionic Liquid and Spatially Confined Gold Nanoparticles Enhanced Photoelectrochemical Response of Zinc-Metal Organic Frameworks and Immunosensing Squamous Cell Carcinoma Antigen. Biosens. Bioelectron. 2019, 142, 111540. [Google Scholar] [CrossRef]
- Zhao, Q.; Duan, R.; Yuan, J.; Quan, Y.; Yang, H.; Xi, M. A Reusable Localized Surface Plasmon Resonance Biosensor for Quantitative Detection of Serum Squamous Cell Carcinoma Antigen in Cervical Cancer Patients Based on Silver Nanoparticles Array. Int. J. Nanomed. 2014, 9, 1097. [Google Scholar]
- Fan, D.; Wu, D.; Cui, J.; Chen, Y.; Ma, H.; Liu, Y.; Wei, Q.; Du, B. An Ultrasensitive Label-Free Immunosensor Based on CdS Sensitized Fe–TiO2 with High Visible-Light Photoelectrochemical Activity. Biosens. Bioelectron. 2015, 74, 843–848. [Google Scholar] [CrossRef] [PubMed]
- Fan, D.; Bao, C.; Liu, X.; Feng, J.; Wu, D.; Ma, H.; Wang, H.; Wei, Q.; Du, B. Facile Fabrication of Visible Light Photoelectrochemical Immunosensor for SCCA Detection Based on BiOBr/Bi2S3 Heterostructures via Self-Sacrificial Synthesis Method. Talanta 2019, 198, 417–423. [Google Scholar] [CrossRef] [PubMed]
- Jeng, K.; Jeng, C.; Jeng, W.; Sheen, I.; Li, S.; Leu, C.; Tsay, Y.; Chang, C. Sonic Hedgehog Signaling Pathway as a Potential Target to Inhibit the Progression of Hepatocellular Carcinoma. Oncol. Lett. 2019, 18, 4377–4384. [Google Scholar] [CrossRef]
- Li, H.-Y.; Yin, F.-F.; Li, X.-Y.; Jia, W.-N.; Ding, J.; Zhang, L.; Wang, Z.-H.; Hu, Q.-Q.; Zuo, J.-L.; Jia, H.-L. Novel Aptasensor-Based Assay of Sonic Hedgehog Ligand for Detection of Portal Vein Invasion of Hepatocellular Carcinoma. Biosens. Bioelectron. 2021, 174, 112738. [Google Scholar] [CrossRef]
- Cao, J.; Song, X.; Chen, Q.; Yuan, R.; Xiang, Y. A Highly Sensitive Electrochemical Aptasensor for Sonic Hedgehog Biomarker Based on Primer Exchange Reaction and Catalytic Hairpin Assembly Amplifications. Sens. Actuators B Chem. 2023, 385, 133698. [Google Scholar] [CrossRef]
- Yu, Y.; Li, H.; Zhang, B.; Pan, X.; Zhu, X.; Ding, Y.; Li, G. Peptide Network for Detection of Tissue-Remodeling Enzyme in the Prognosis of Hepatocellular Carcinoma. ACS Appl. Mater. Interfaces 2015, 7, 4401–4405. [Google Scholar] [CrossRef]
- Krutsenko, Y.; Singhi, A.D.; Monga, S.P. β-Catenin Activation in Hepatocellular Cancer: Implications in Biology and Therapy. Cancers 2021, 13, 1830. [Google Scholar] [CrossRef]
- Yu, Y.; Li, H.; Wei, L.; Li, L.; Ding, Y.; Li, G. Electrochemical Detection and Distribution Analysis of β-Catenin for the Evaluation of Invasion and Metastasis in Hepatocellular Carcinoma. Anal. Chem. 2016, 88, 3879–3884. [Google Scholar] [CrossRef] [PubMed]
- Kjeldsen, L.; Johnsen, A.H.; Sengeløv, H.; Borregaard, N. Isolation and Primary Structure of NGAL, a Novel Protein Associated with Human Neutrophil Gelatinase. J. Biol. Chem. 1993, 268, 10425–10432. [Google Scholar] [CrossRef]
- Yang, J.; Goetz, D.; Li, J.-Y.; Wang, W.; Mori, K.; Setlik, D.; Du, T.; Erdjument-Bromage, H.; Tempst, P.; Strong, R. An Iron Delivery Pathway Mediated by a Lipocalin. Mol. Cell 2002, 10, 1045–1056. [Google Scholar] [CrossRef] [PubMed]
- Wang, Y.-P.; Yu, G.-R.; Lee, M.-J.; Lee, S.-Y.; Chu, I.-S.; Leem, S.-H.; Kim, D.-G. Lipocalin-2 Negatively Modulates the Epithelial-to-Mesenchymal Transition in Hepatocellular Carcinoma through the Epidermal Growth Factor (TGF-Beta1)/Lcn2/Twist1 Pathway. Hepatology 2013, 58, 1349–1361. [Google Scholar] [CrossRef] [PubMed]
- Lee, K.-A.; Ahn, J.-Y.; Lee, S.-H.; Singh Sekhon, S.; Kim, D.-G.; Min, J.; Kim, Y.-H. Aptamer-Based Sandwich Assay and Its Clinical Outlooks for Detecting Lipocalin-2 in Hepatocellular Carcinoma (HCC). Sci. Rep. 2015, 5, 10897. [Google Scholar] [CrossRef] [PubMed]
- Song, T.; Wang, C.; Guo, C.; Liu, Q.; Zheng, X. Pentraxin 3 Overexpression Accelerated Tumor Metastasis and Indicated Poor Prognosis in Hepatocellular Carcinoma via Driving Epithelial-Mesenchymal Transition. J. Cancer 2018, 9, 2650. [Google Scholar] [CrossRef] [PubMed]
- Zhang, Q.; Wu, J.; Niu, W.; Xue, J. Nanocomposites Prepared from Gold Nanowires and Multiwalled Carbon Nanotubes for Non-Enzymatic Sensitive Bioelectrochemical Detection of Pentraxin-3 in Human Serum. Ionics 2021, 27, 1795–1802. [Google Scholar] [CrossRef]
- Uttam, I.; Sudarsan, S.; Ray, R.; Chinnappan, R.; Yaqinuddin, A.; Al-Kattan, K.; Mani, N.K. A Hypothetical Approach to Concentrate Microorganisms from Human Urine Samples Using Paper-Based Adsorbents for Point-of-Care Molecular Assays. Life 2024, 14, 38. [Google Scholar] [CrossRef] [PubMed]
- Hu, Q.; Cao, X.; Li, S.; Liang, Y.; Luo, Y.; Feng, W.; Han, D.; Niu, L. Electrochemically Controlled Atom Transfer Radical Polymerization for Electrochemical Aptasensing of Tumor Biomarkers. Anal. Chem. 2022, 94, 13516–13521. [Google Scholar] [CrossRef] [PubMed]
- Fang, J.; Zhao, G.; Dong, X.; Li, X.; Miao, J.; Wei, Q.; Cao, W. Ultrasensitive Electrochemiluminescence Immunosensor for the Detection of Amyloid-β Proteins Based on Resonance Energy Transfer between g-C3N4 and Pd NPs Coated NH2-MIL-53. Biosens. Bioelectron. 2019, 142, 111517. [Google Scholar] [CrossRef]
- Al-Shami, A.; Oweis, R.J.; Al-Fandi, M.G. Developing an Electrochemical Immunosensor for Early Diagnosis of Hepatocellular Carcinoma. Sens. Rev. 2021, 41, 125–134. [Google Scholar] [CrossRef]
- Asim, M.; Sarma, M.P.; Thayumanavan, L.; Kar, P. Role of Aflatoxin B1 as a Risk for Primary Liver Cancer in North Indian Population. Clin. Biochem. 2011, 44, 1235–1240. [Google Scholar] [CrossRef]
- Cuccioloni, M.; Mozzicafreddo, M.; Barocci, S.; Ciuti, F.; Pecorelli, I.; Eleuteri, A.M.; Spina, M.; Fioretti, E.; Angeletti, M. Biosensor-Based Screening Method for the Detection of Aflatoxins B1−G1. Anal. Chem. 2008, 80, 9250–9256. [Google Scholar] [CrossRef] [PubMed]
- Damiati, S.; Küpcü, S.; Peacock, M.; Eilenberger, C.; Zamzami, M.; Qadri, I.; Choudhry, H.; Sleytr, U.B.; Schuster, B. Acoustic and Hybrid 3D-Printed Electrochemical Biosensors for the Real-Time Immunodetection of Liver Cancer Cells (HepG2). Biosens. Bioelectron. 2017, 94, 500–506. [Google Scholar] [CrossRef] [PubMed]
- Chen, X.; Pan, Y.; Liu, H.; Bai, X.; Wang, N.; Zhang, B. Label-Free Detection of Liver Cancer Cells by Aptamer-Based Microcantilever Biosensor. Biosens. Bioelectron. 2016, 79, 353–358. [Google Scholar] [CrossRef] [PubMed]
- Li, S.-S.; Tan, Y.-Y.; Zhang, Y.; Liu, M.; Liu, A. A Simple Electrochemical Immunosensor Based on Worm-like Platinum for Highly Sensitive Determination of Alpha-Fetoprotein. Bioelectrochemistry 2021, 140, 107804. [Google Scholar] [CrossRef] [PubMed]
- Yu, L.; Zhang, Y.; Hu, C.; Wu, H.; Yang, Y.; Huang, C.; Jia, N. Highly Sensitive Electrochemical Impedance Spectroscopy Immunosensor for the Detection of AFB1 in Olive Oil. Food Chem. 2015, 176, 22–26. [Google Scholar] [CrossRef]
- Asci Erkocyigit, B.; Ozufuklar, O.; Yardim, A.; Guler Celik, E.; Timur, S. Biomarker Detection in Early Diagnosis of Cancer: Recent Achievements in Point-of-Care Devices Based on Paper Microfluidics. Biosensors 2023, 13, 387. [Google Scholar] [CrossRef]


Disclaimer/Publisher’s Note: The statements, opinions and data contained in all publications are solely those of the individual author(s) and contributor(s) and not of MDPI and/or the editor(s). MDPI and/or the editor(s) disclaim responsibility for any injury to people or property resulting from any ideas, methods, instructions or products referred to in the content. |
© 2024 by the authors. Licensee MDPI, Basel, Switzerland. This article is an open access article distributed under the terms and conditions of the Creative Commons Attribution (CC BY) license (https://creativecommons.org/licenses/by/4.0/).
Share and Cite
Chinnappan, R.; Makhzoum, T.; Arai, M.; Hajja, A.; Abul Rub, F.; Alodhaibi, I.; Alfuwais, M.; Elahi, M.A.; Alshehri, E.A.; Ramachandran, L.; et al. Recent Advances in Biosensor Technology for Early-Stage Detection of Hepatocellular Carcinoma-Specific Biomarkers: An Overview. Diagnostics 2024, 14, 1519. https://doi.org/10.3390/diagnostics14141519
Chinnappan R, Makhzoum T, Arai M, Hajja A, Abul Rub F, Alodhaibi I, Alfuwais M, Elahi MA, Alshehri EA, Ramachandran L, et al. Recent Advances in Biosensor Technology for Early-Stage Detection of Hepatocellular Carcinoma-Specific Biomarkers: An Overview. Diagnostics. 2024; 14(14):1519. https://doi.org/10.3390/diagnostics14141519
Chicago/Turabian StyleChinnappan, Raja, Tariq Makhzoum, Momo Arai, Amro Hajja, Farah Abul Rub, Ibrahim Alodhaibi, Mohammed Alfuwais, Muhammad Affan Elahi, Eman Abdullah Alshehri, Lohit Ramachandran, and et al. 2024. "Recent Advances in Biosensor Technology for Early-Stage Detection of Hepatocellular Carcinoma-Specific Biomarkers: An Overview" Diagnostics 14, no. 14: 1519. https://doi.org/10.3390/diagnostics14141519
APA StyleChinnappan, R., Makhzoum, T., Arai, M., Hajja, A., Abul Rub, F., Alodhaibi, I., Alfuwais, M., Elahi, M. A., Alshehri, E. A., Ramachandran, L., Mani, N. K., Abrahim, S., Mir, M. S., Al-Kattan, K., Mir, T. A., & Yaqinuddin, A. (2024). Recent Advances in Biosensor Technology for Early-Stage Detection of Hepatocellular Carcinoma-Specific Biomarkers: An Overview. Diagnostics, 14(14), 1519. https://doi.org/10.3390/diagnostics14141519