
An Enhanced Mask R-CNN Approach for Pulmonary Embolism Detection and Segmentation


Abstract
1. Introduction
2. Materials and Methods
2.1. Materials
2.2. Pre-Processing
2.3. Mask R-CNN Architecture
2.4. Enhanced Mask R-CNN Architecture
2.5. U-Net
2.6. Evaluation Metrics
3. Results and Discussion
4. Conclusions
Author Contributions
Funding
Institutional Review Board Statement
Informed Consent Statement
Data Availability Statement
Conflicts of Interest
References
- Pforte, A. Epidemiology, diagnosis, and therapy of pulmonary embolism. Eur. J. Med. Res. 2004, 9, 171–179. [Google Scholar] [PubMed]
- Goldhaber, S.Z.; Bounameaux, H.J.T.L. Pulmonary embolism and deep vein thrombosis. Lancet 2012, 379, 1835–1846. [Google Scholar] [CrossRef] [PubMed]
- Pena, E.; Dennie, C. Acute and chronic pulmonary embolism: An in-depth review for radiologists through the use of frequently asked questions. In Seminars in Ultrasound, CT and MRI; Elsevier: Amsterdam, The Netherlands, 2012. [Google Scholar]
- Sadigh, G.; Kelly, A.M.; Cronin, P. Challenges, controversies, and hot topics in pulmonary embolism imaging. Am. J. Roentgenol. 2011, 196, 497–515. [Google Scholar] [CrossRef] [PubMed]
- Kumamaru, K.K.; Hunsaker, A.R.; Kumamaru, H.; George, E.; Bedayat, A.; Rybicki, F.J. Correlation between early direct communication of positive CT pulmonary angiography findings and enhanced clinical outcomes. Chest 2013, 144, 1546–1554. [Google Scholar] [CrossRef] [PubMed]
- Leung, A.N.; Bull, T.M.; Jaeschke, R.; Lockwood, C.J.; Boiselle, P.M.; Hurwitz, L.M.; James, A.H.; McCullough, L.B.; Menda, Y.; Paidas, M.J.; et al. An official American Thoracic Society/Society of Thoracic Radiology clinical practice guideline: Evaluation of suspected pulmonary embolism in pregnancy. Am. J. Respir. Crit. Care Med. 2011, 184, 1200–1208. [Google Scholar] [CrossRef]
- Doubeni, C.A.; Corley, D.A.; Quinn, V.P.; Jensen, C.D.; Zauber, A.G.; Goodman, M.; Levin, T.R. Effect of Organized Colorectal Cancer Screening on Mortality in a Large, Community-Based Population. JAMA Netw. Open 2021, 4, e2117067. [Google Scholar]
- Torbicki, A.T.; Van Beek, E.J.R.; Charbonnier, B.; Meyer, G.; Morpurgo, M.; Palla, A.; Perrier, A.; Galie, N.; Gorge, G.; Herold, C.; et al. ESC Guidelines on the diagnosis and management of acute pulmonary embolism. Eur. Heart J. 2014, 283, 1–48. [Google Scholar]
- Hartmann, I.J.C.; Prokop, M. Spiral CT in the diagnosis of acute pulmonary embolism. Kontraste 2002, 46, 2–10. [Google Scholar]
- Stein, P.D.; Fowler, S.E.; Goodman, L.R.; Gottschalk, A.; Hales, C.A.; Hull, R.D.; Leeper, K.V., Jr.; Popovich, J., Jr.; Quinn, D.A.; Sos, T.A.; et al. Multidetector computed tomography for acute pulmonary embolism. N. Engl. J. Med. 2006, 354, 2317–2327. [Google Scholar] [CrossRef]
- Yavas, U.S.; Calisir, C.; Ozkan, I.R. The interobserver agreement between residents and experienced radiologists for detecting pulmonary embolism and DVT with using CT pulmonary angiography and indirect CT venography. Korean J. Radiol. 2008, 9, 498–502. [Google Scholar] [CrossRef]
- Rufener, S.L.; Patel, S.; Kazerooni, E.A.; Schipper, M.; Kelly, A.M. Comparison of on-call radiology resident and faculty interpretation of 4-and 16-row multidetector CT pulmonary angiography with indirect CT venography. Acad. Radiol. 2008, 15, 71–76. [Google Scholar] [CrossRef] [PubMed]
- Joshi, R.; Wu, K.; Kaicker, J.; Choudur, H. Reliability of on-call radiology residents’ interpretation of 64-slice CT pulmonary angiography for the detection of pulmonary embolism. Acta Radiol. 2014, 55, 682–690. [Google Scholar] [CrossRef] [PubMed]
- Kline, T.; Kline, T.J.R. Radiologists, communication, and Resolution 5: A medicolegal issue. Radiology 1992, 184, 131–134. [Google Scholar] [CrossRef] [PubMed]
- Qanadli, S.D.; El Hajjam, M.; Vieillard-Baron, A.; Joseph, T.; Mesurolle, B.; Oliva, V.L.; Barré, O.; Bruckert, F.; Dubourg, O.; Lacombe, P. New CT index to quantify arterial obstruction in pulmonary embolism: Comparison with angiographic index and echocardiography. Am. J. Roentgenol. 2001, 176, 1415–1420. [Google Scholar] [CrossRef] [PubMed]
- Mastora, I.; Remy-Jardin, M.; Masson, P.; Galland, E.; Delannoy, V.; Bauchart, J.-J.; Remy, J. Severity of acute pulmonary embolism: Evaluation of a new spiral CT angiographic score in correlation with echocardiographic data. Eur. Radiol. 2003, 13, 29–35. [Google Scholar] [CrossRef] [PubMed]
- Shiina, Y.; Funabashi, N.; Fujikawa, A.; Lee, K.; Sekine, T.; Uehara, M.; Mikami, Y.; Tanabe, N.; Kuriyama, T.; Komuro, I. Quantitative evaluation of chronic pulmonary thromboemboli by multislice CT compared with pulsed Tissue Doppler Imaging and its relationship with brain natriuretic peptide. Int. J. Cardiol. 2008, 130, 505–512. [Google Scholar] [CrossRef] [PubMed]
- Patil, S.; Henry, J.W.; Rubenfire, M.; Stein, P.D. Neural network in the clinical diagnosis of acute pulmonary embolism. Chest 1993, 104, 1685–1689. [Google Scholar] [CrossRef]
- Tourassi, G.D.; Floyd, C.E.; Sostman, H.D.; Coleman, R.E. Artificial neural network for diagnosis of acute pulmonary embolism: Effect of case and observer selection. Radiology 1995, 194, 889–893. [Google Scholar] [CrossRef] [PubMed]
- Scott, J.; Palmer, E.J.R. Neural network analysis of ventilation-perfusion lung scans. Radiology 1993, 186, 661–664. [Google Scholar] [CrossRef]
- Wittenberg, R.; Berger, F.H.; Peters, J.F.; Weber, M.; van Hoorn, F.; Beenen, L.F.M.; van Doorn, M.M.A.C.; van Schuppen, J.; Zijlstra, I.A.J.; Prokop, M.; et al. Acute pulmonary embolism: Effect of a computer-assisted detection prototype on diagnosis—An observer study. Radiology 2012, 262, 305–313. [Google Scholar] [CrossRef]
- Kligerman, S.J.; Lahiji, K.; Galvin, J.R.; Stokum, C.; White, C.S. Missed pulmonary emboli on CT angiography: Assessment with pulmonary embolism-computer-aided detection. Am. J. Roentgenol. 2014, 202, 65–73. [Google Scholar] [CrossRef] [PubMed]
- Bettmann, M.A.; White, R.D.; Woodard, P.K.; Abbara, S.; Atalay, M.K.; Dorbala, S.; Haramati, L.B.; Hendel, R.C.; Martin, E.T., III; Ryan, T.; et al. ACR Appropriateness Criteria® acute chest pain—Suspected pulmonary embolism. J. Thorac. Imaging 2012, 27, W28–W31. [Google Scholar] [CrossRef] [PubMed]
- Ozkan, H.; Tulum, G.; Osman, O.; Sahin, S. Automatic detection of pulmonary embolism in CTA images using machine learning. Elektron. Ir Elektrotech. 2017, 23, 63–67. [Google Scholar] [CrossRef]
- Hamet, P.; Tremblay, J. Artificial intelligence in medicine. Metabolism 2017, 69, S36–S40. [Google Scholar] [CrossRef] [PubMed]
- Liitjens, G.; Kooi, T.; Bejnordi, B.E.; Setio, A.A.A.; Ciompi, F.; Ghafoorian, M.; van der Laak, J.A.W.M.; van Ginneken, B.; Sánchez, C.I. A survey on deep learning in medical image analysis. Med. Image Anal. 2017, 42, 60–88. [Google Scholar] [CrossRef] [PubMed]
- Tao, Q.; Yan, W.; Wang, Y.; Paiman, E.H.; Shamonin, D.P.; Garg, P.; Plein, S.; Huang, L.; Xia, L.; Sramko, M.; et al. Deep learning–based method for fully automatic quantification of left ventricle function from cine MR images: A multivendor, multicenter study. Radiology 2019, 290, 81–88. [Google Scholar] [CrossRef] [PubMed]
- Tajbakhsh, N.; Gotway, M.B.; Liang, J. Computer-aided pulmonary embolism detection using a novel vessel-aligned multi-planar image representation and convolutional neural networks. In International Conference on Medical Image Computing and Computer-Assisted Intervention, Proceedings of the 18th International Conference, Munich, Germany, 5–9 October 2015, Part II; Springer: Berlin/Heidelberg, Germany, 2015. [Google Scholar]
- Yang, X.; Lin, Y.; Su, J.; Wang, X.; Li, X.; Lin, J.; Cheng, K.-T. A two-stage convolutional neural network for pulmonary embolism detection from CTPA images. IEEE Access 2019, 7, 84849–84857. [Google Scholar] [CrossRef]
- Pham, A.-D.; Névéol, A.; Lavergne, T.; Yasunaga, D.; Clément, O.; Meyer, G.; Morello, R.; Burgun, A. Natural language processing of radiology reports for the detection of thromboembolic diseases and clinically relevant incidental findings. BMC Bioinform. 2014, 15, 266. [Google Scholar] [CrossRef] [PubMed]
- Moore, A.J.E.; Wachsmann, J.; Chamarthy, M.R.; Panjikaran, L.; Tanabe, Y.; Rajiah, P. Imaging of acute pulmonary embolism: An update. Cardiovasc. Diagn. Ther. 2018, 8, 225–243. [Google Scholar] [CrossRef]
- Chen, M.C.; Ball, R.L.; Yang, L.; Moradzadeh, N.; Chapman, B.E.; Larson, D.B.; Langlotz, C.P.; Amrhein, T.J.; Lungren, M.P. Deep learning to classify radiology free-text reports. Radiology 2018, 286, 845–852. [Google Scholar] [CrossRef]
- Grenier, P.A.; Ayobi, A.; Quenet, S.; Tassy, M.; Marx, M.; Chow, D.S.; Weinberg, B.D.; Chang, P.D.; Chaibi, Y. Deep Learning-Based Algorithm for Automatic Detection of Pulmonary Embolism in Chest CT Angiograms. Diagnostics 2023, 13, 1324. [Google Scholar] [CrossRef] [PubMed]
- Wu, M.; Li, C.; Yao, Z. Deep Active Learning for Computer Vision Tasks: Methodologies, Applications, and Challenges. Appl. Sci. 2022, 12, 8103. [Google Scholar] [CrossRef]
- Khan, M.; Shah, P.M.; Khan, I.A.; Islam, S.U.; Ahmad, Z.; Khan, F.; Lee, Y. IoMT EnabledComputer-Aided Diagnosis of Pulmonary Embolism from Computed Tomography Scans Using Deep Learning. Sensors 2023, 23, 1471. [Google Scholar] [CrossRef] [PubMed]
- Vainio, T.; Mäkelä, T.; Arkko, A.; Savolainen, S.; Kangasniemi, M. Leveraging open dataset and transfer learning for accurate recognition of chronic pulmonary embolism from CT angiogram maximum intensity projection images. Eur. Radiol. Exp. 2023, 7, 33. [Google Scholar] [CrossRef]
- Ronneberger, O.; Fischer, P.; Brox, T. U-Net: Convolutional Networks for Biomedical Image Segmentation. In Medical Image Computing and Computer-Assisted Intervention–MICCAI 2015, Proceedings of the 18th International Conference, Munich, Germany, 5–9 October 2015; Springer: Berlin/Heidelberg, Germany, 2015. [Google Scholar]
- Ren, S.; He, K.; Girshick, R.; Sun, J. Faster r-cnn: Towards real-time object detection with region proposal networks. In Proceedings of the Advances in Neural Information Processing Systems 28 (NIPS 2015), Montreal, QC, Canada, 7–12 December 2015; Volume 28, pp. 91–99. [Google Scholar]
- He, K.; Gkioxari, G.; Dollár, P.; Girshick, R. Mask r-cnn. In Proceedings of the IEEE International Conference on Computer Vision, Venice, Italy, 22–29 October 2017; pp. 2961–2969. [Google Scholar]
- He, K.; Zhang, X.; Ren, S.; Sun, J. Deep residual learning for image recognition. In Proceedings of the IEEE Computer Society Conference on Computer Vision and Pattern Recognition (CVPR), Las Vegas, NV, USA, 27–30 June 2016; pp. 770–778. [Google Scholar]


| Hold-Out Val. | 10-Fold CV. | |||
|---|---|---|---|---|
| Dice | Jaccard | Dice | Jaccard | |
| MASK R-CNN | 0.91 | 0.87 | 0.87 | 0.82 |
| ENHANCED MASK R-CNN | 0.95 | 0.89 | 0.94 | 0.84 |
| Hold-Out Val. | 10-Fold CV | |||||
|---|---|---|---|---|---|---|
| Method | Sen. (%) | Spec. (%) | Acc. (%) | Sen. (%) | Spec. (%) | Acc. (%) |
| U-Net | 90.7 | 87.8 | 90.5 | 88.2 | 86.7 | 88.6 |
| Mask R-CNN | 93.1 | 90 | 94.9 | 92 | 87.3 | 91.8 |
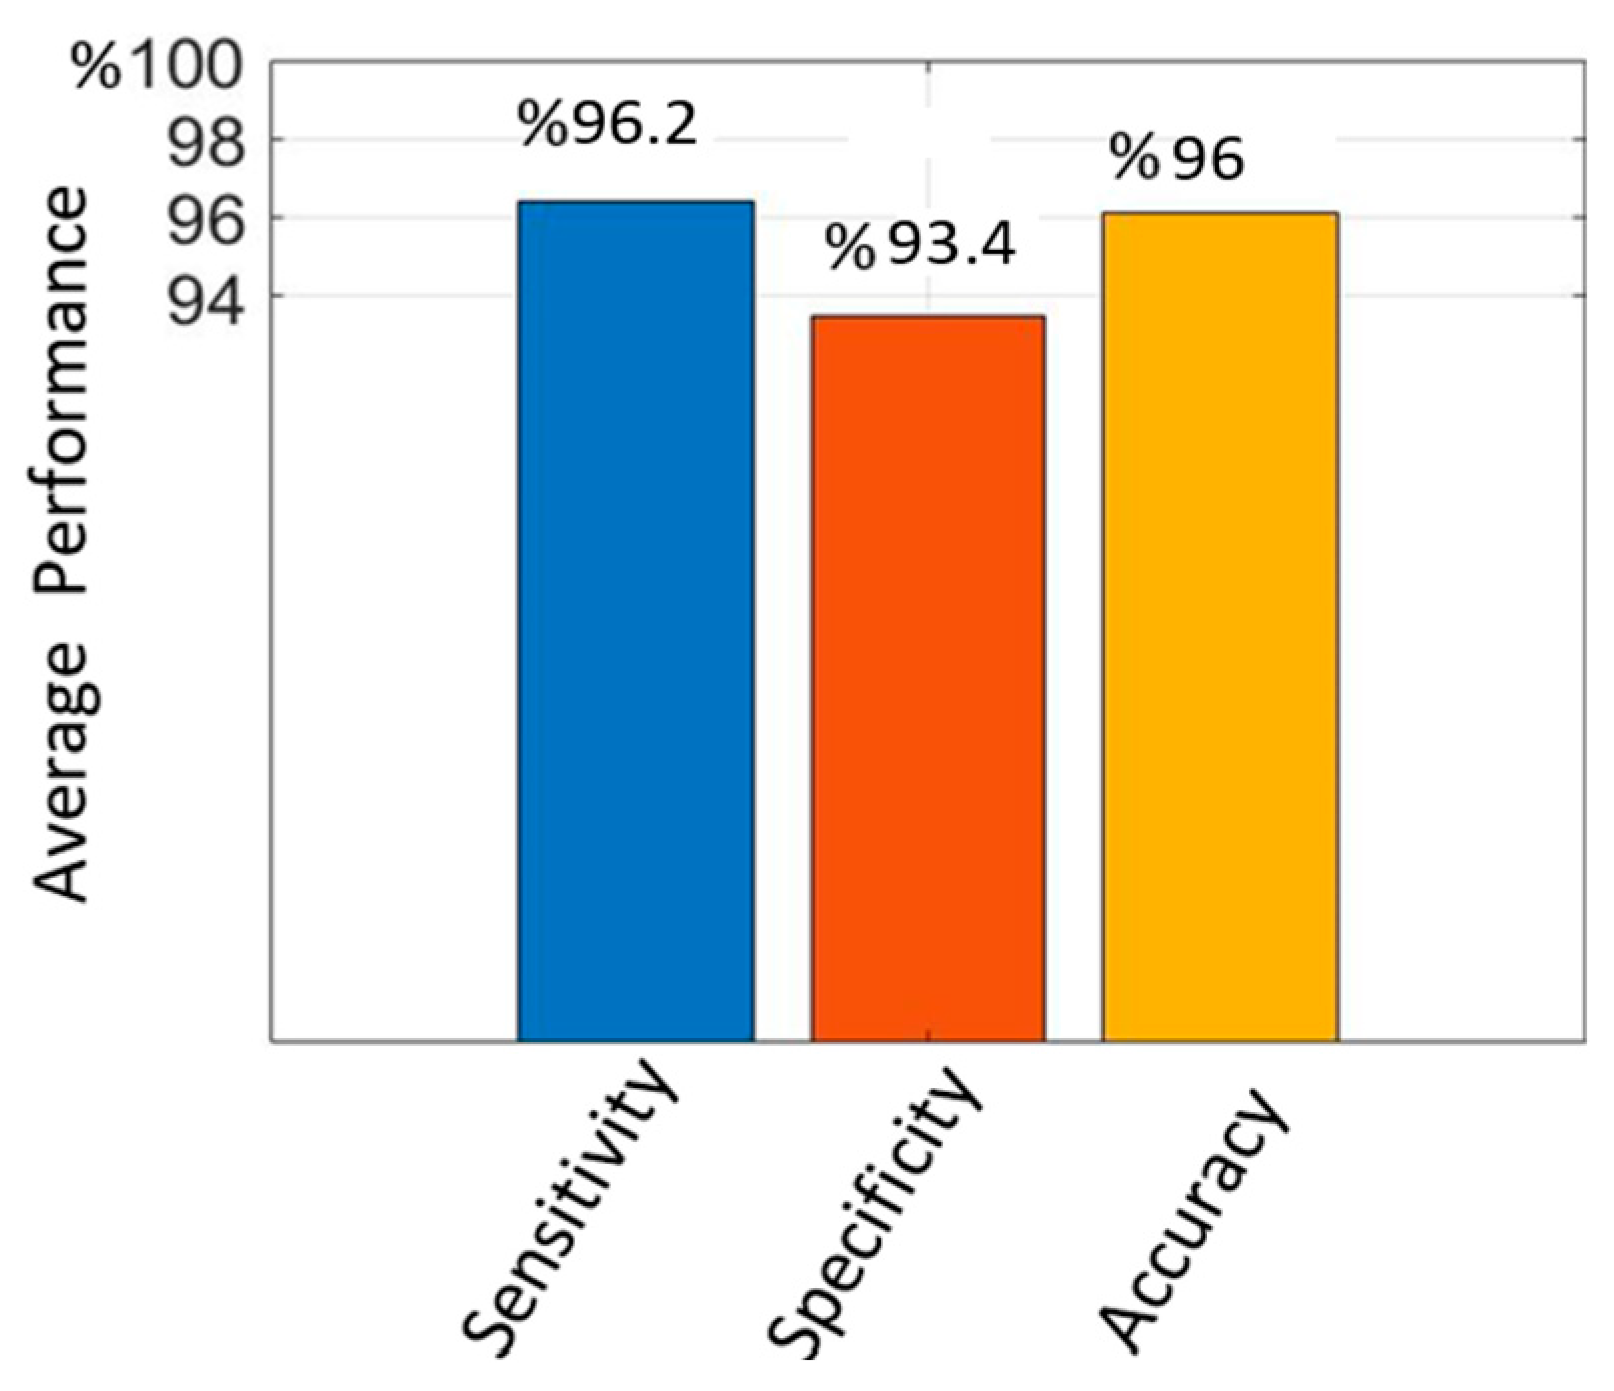
| Enhanced Mask R-CNN | 96.2 | 93.4 | 96 | 95.9 | 90 | 95.4 |
| Hold-Out Accuracy (%) | 10-Fold CV Accuracy (%) | ||
|---|---|---|---|
| 1 | 1 | 94.9 | 91.8 |
| 1 | 0.9 | 95 | 93.7 |
| 1 | 0.8 | 95.1 | 94.2 |
| 1 | 0.7 | 93.4 | 93.5 |
| 0.9 | 0.9 | 95.5 | 94.2 |
| 0.9 | 0.8 | 96 | 95.4 |
| 0.8 | 0.9 | 93.2 | 92.7 |
| 0.8 | 0.8 | 92.8 | 91.1 |
Disclaimer/Publisher’s Note: The statements, opinions and data contained in all publications are solely those of the individual author(s) and contributor(s) and not of MDPI and/or the editor(s). MDPI and/or the editor(s) disclaim responsibility for any injury to people or property resulting from any ideas, methods, instructions or products referred to in the content. |
© 2024 by the authors. Licensee MDPI, Basel, Switzerland. This article is an open access article distributed under the terms and conditions of the Creative Commons Attribution (CC BY) license (https://creativecommons.org/licenses/by/4.0/).
Share and Cite
Doğan, K.; Selçuk, T.; Alkan, A. An Enhanced Mask R-CNN Approach for Pulmonary Embolism Detection and Segmentation. Diagnostics 2024, 14, 1102. https://doi.org/10.3390/diagnostics14111102
Doğan K, Selçuk T, Alkan A. An Enhanced Mask R-CNN Approach for Pulmonary Embolism Detection and Segmentation. Diagnostics. 2024; 14(11):1102. https://doi.org/10.3390/diagnostics14111102
Chicago/Turabian StyleDoğan, Kâmil, Turab Selçuk, and Ahmet Alkan. 2024. "An Enhanced Mask R-CNN Approach for Pulmonary Embolism Detection and Segmentation" Diagnostics 14, no. 11: 1102. https://doi.org/10.3390/diagnostics14111102
APA StyleDoğan, K., Selçuk, T., & Alkan, A. (2024). An Enhanced Mask R-CNN Approach for Pulmonary Embolism Detection and Segmentation. Diagnostics, 14(11), 1102. https://doi.org/10.3390/diagnostics14111102