
Establishing Normative Values for Acromion Anatomy: A Comprehensive MRI-Based Study in a Healthy Population of 996 Participants
 , , ,
, , ,
Abstract
1. Introduction
2. Materials and Methods
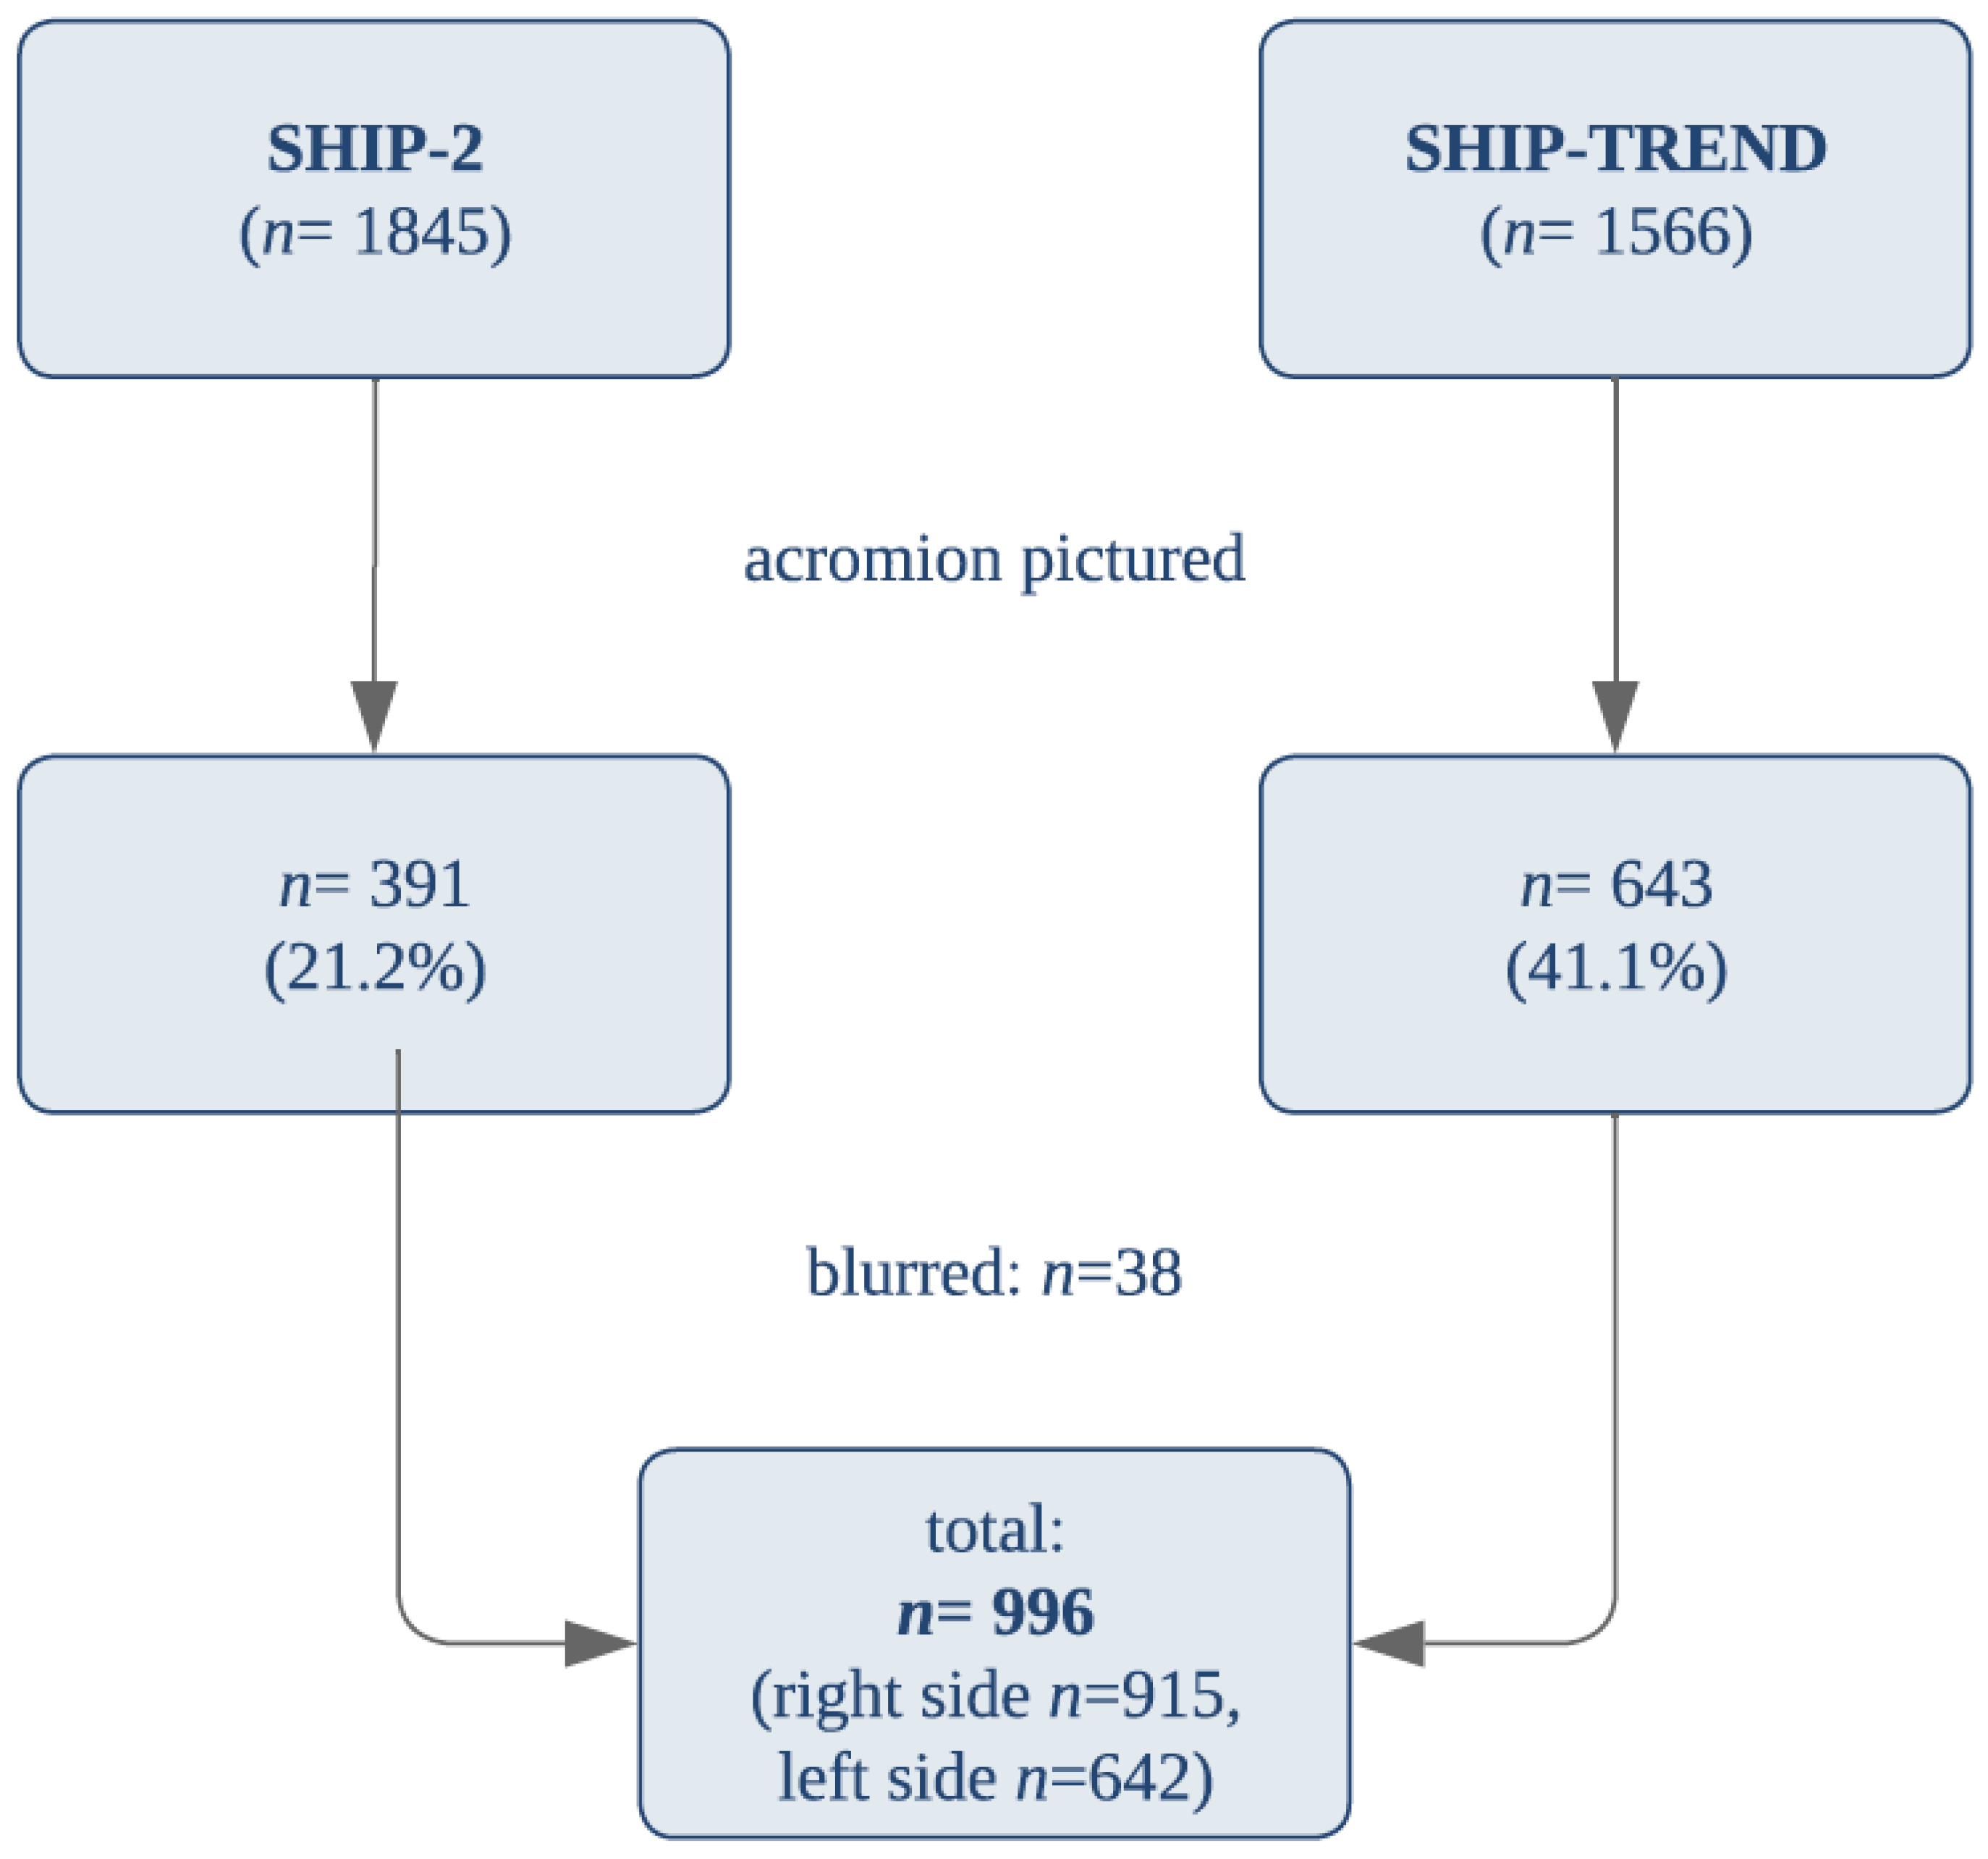
2.1. SHIP Design
2.2. Image Analysis and Measurement
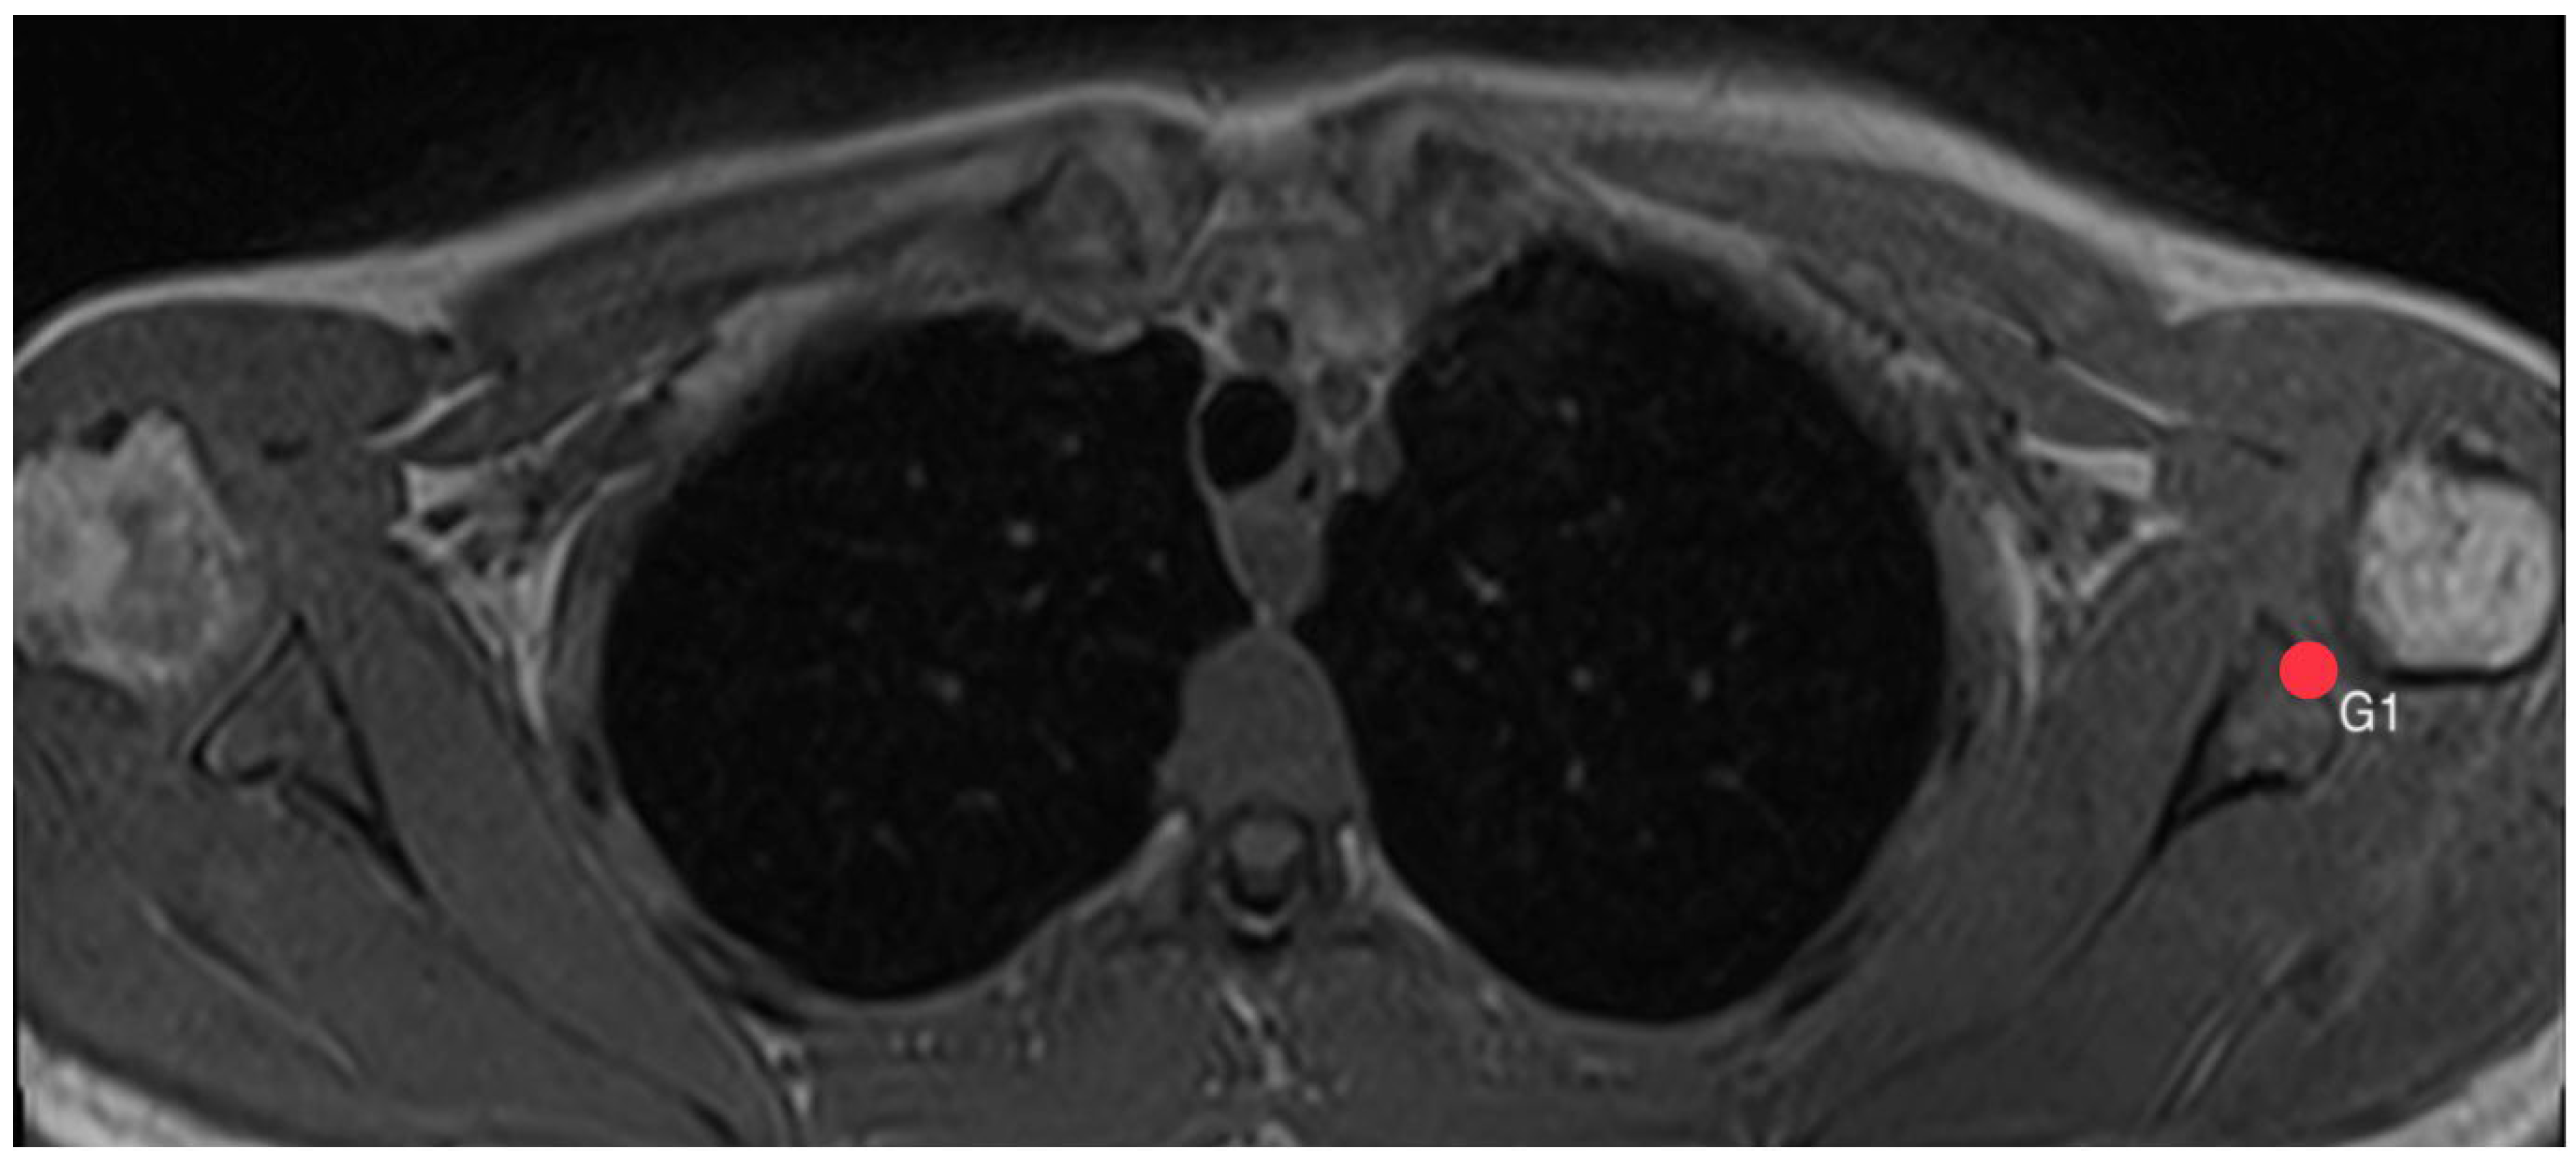
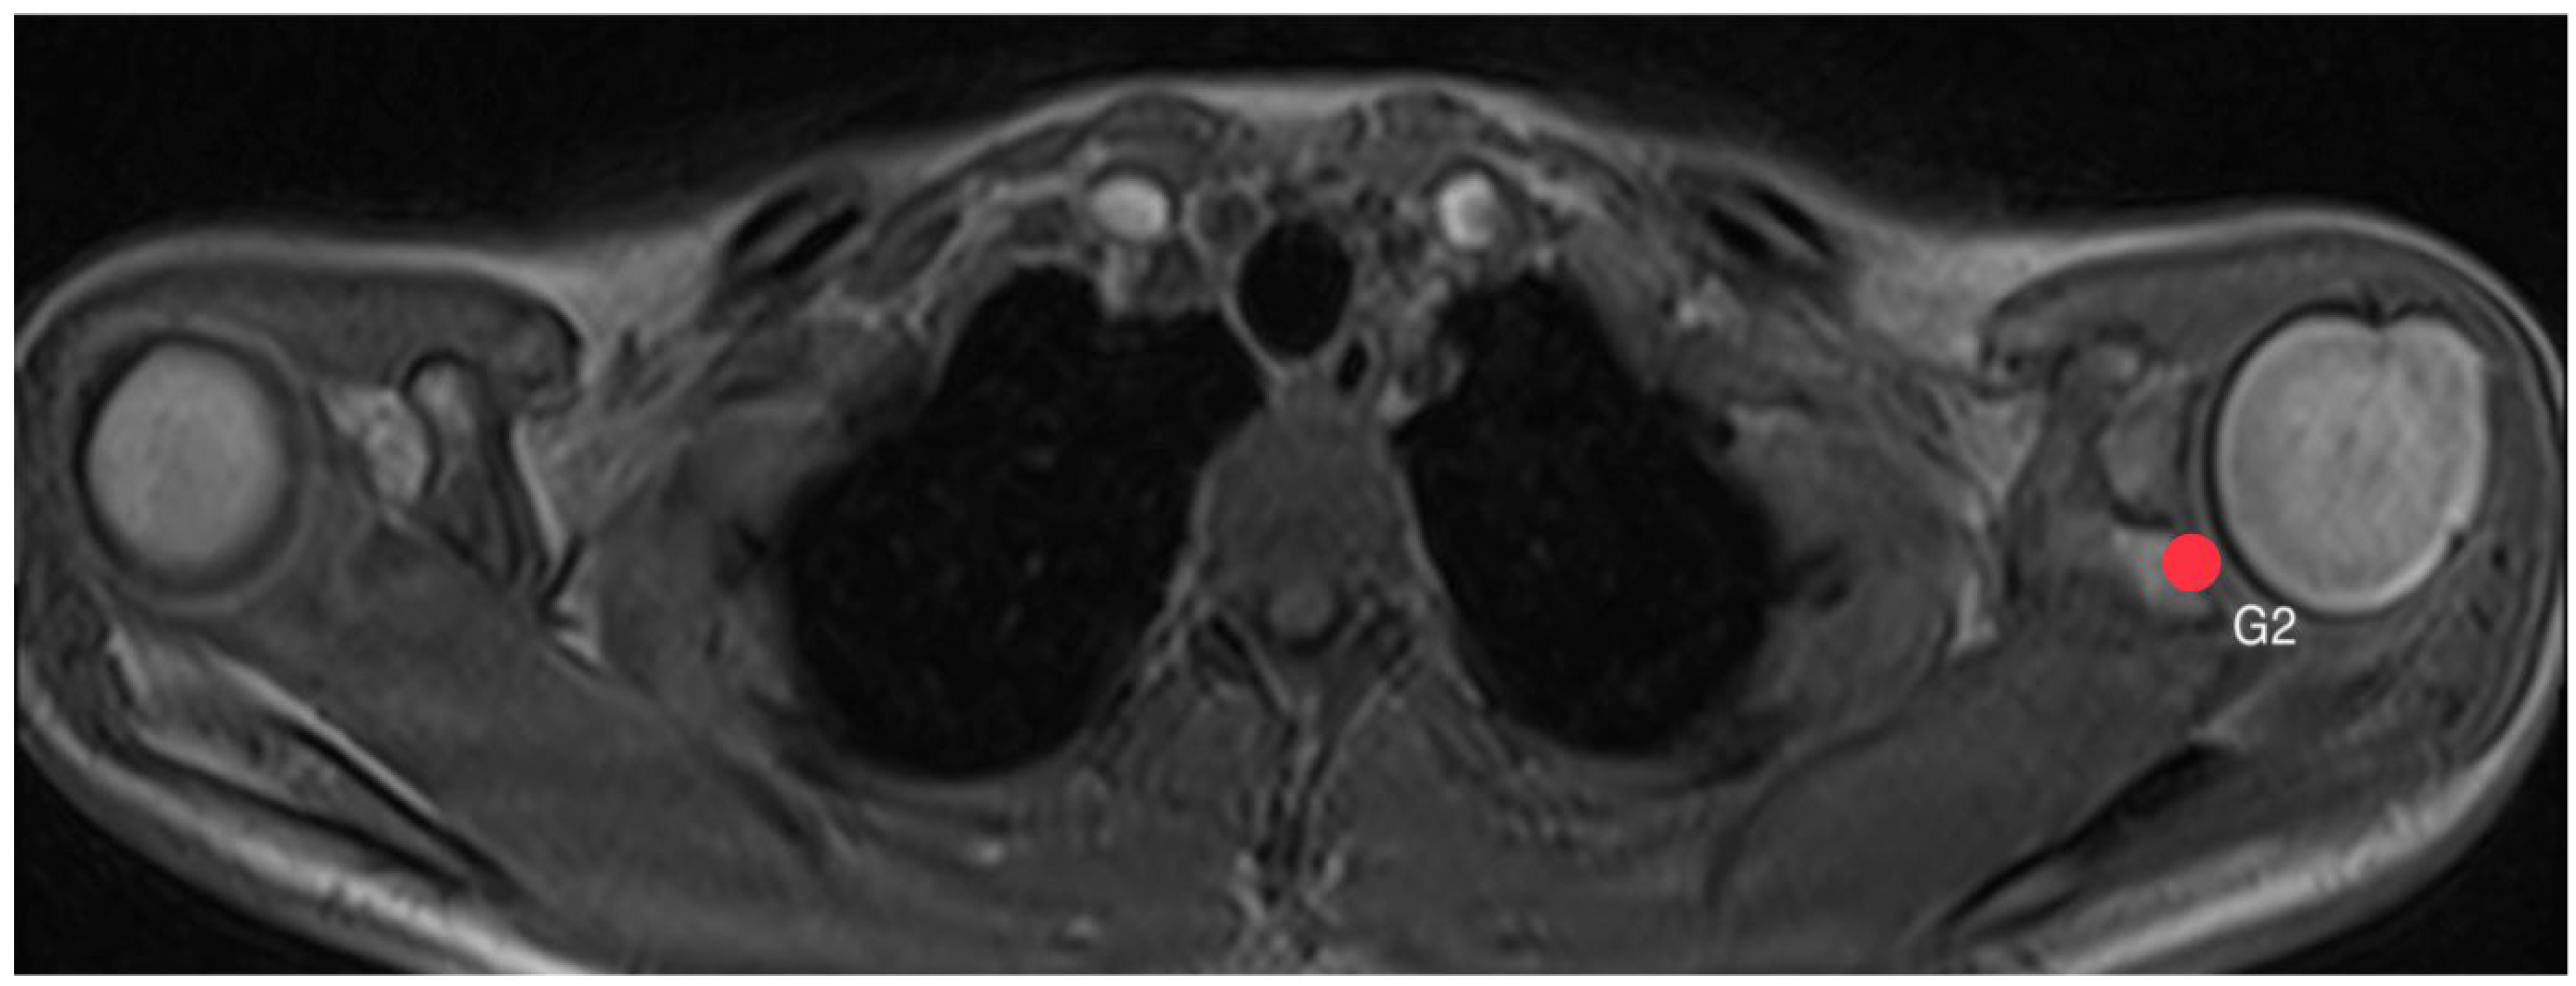
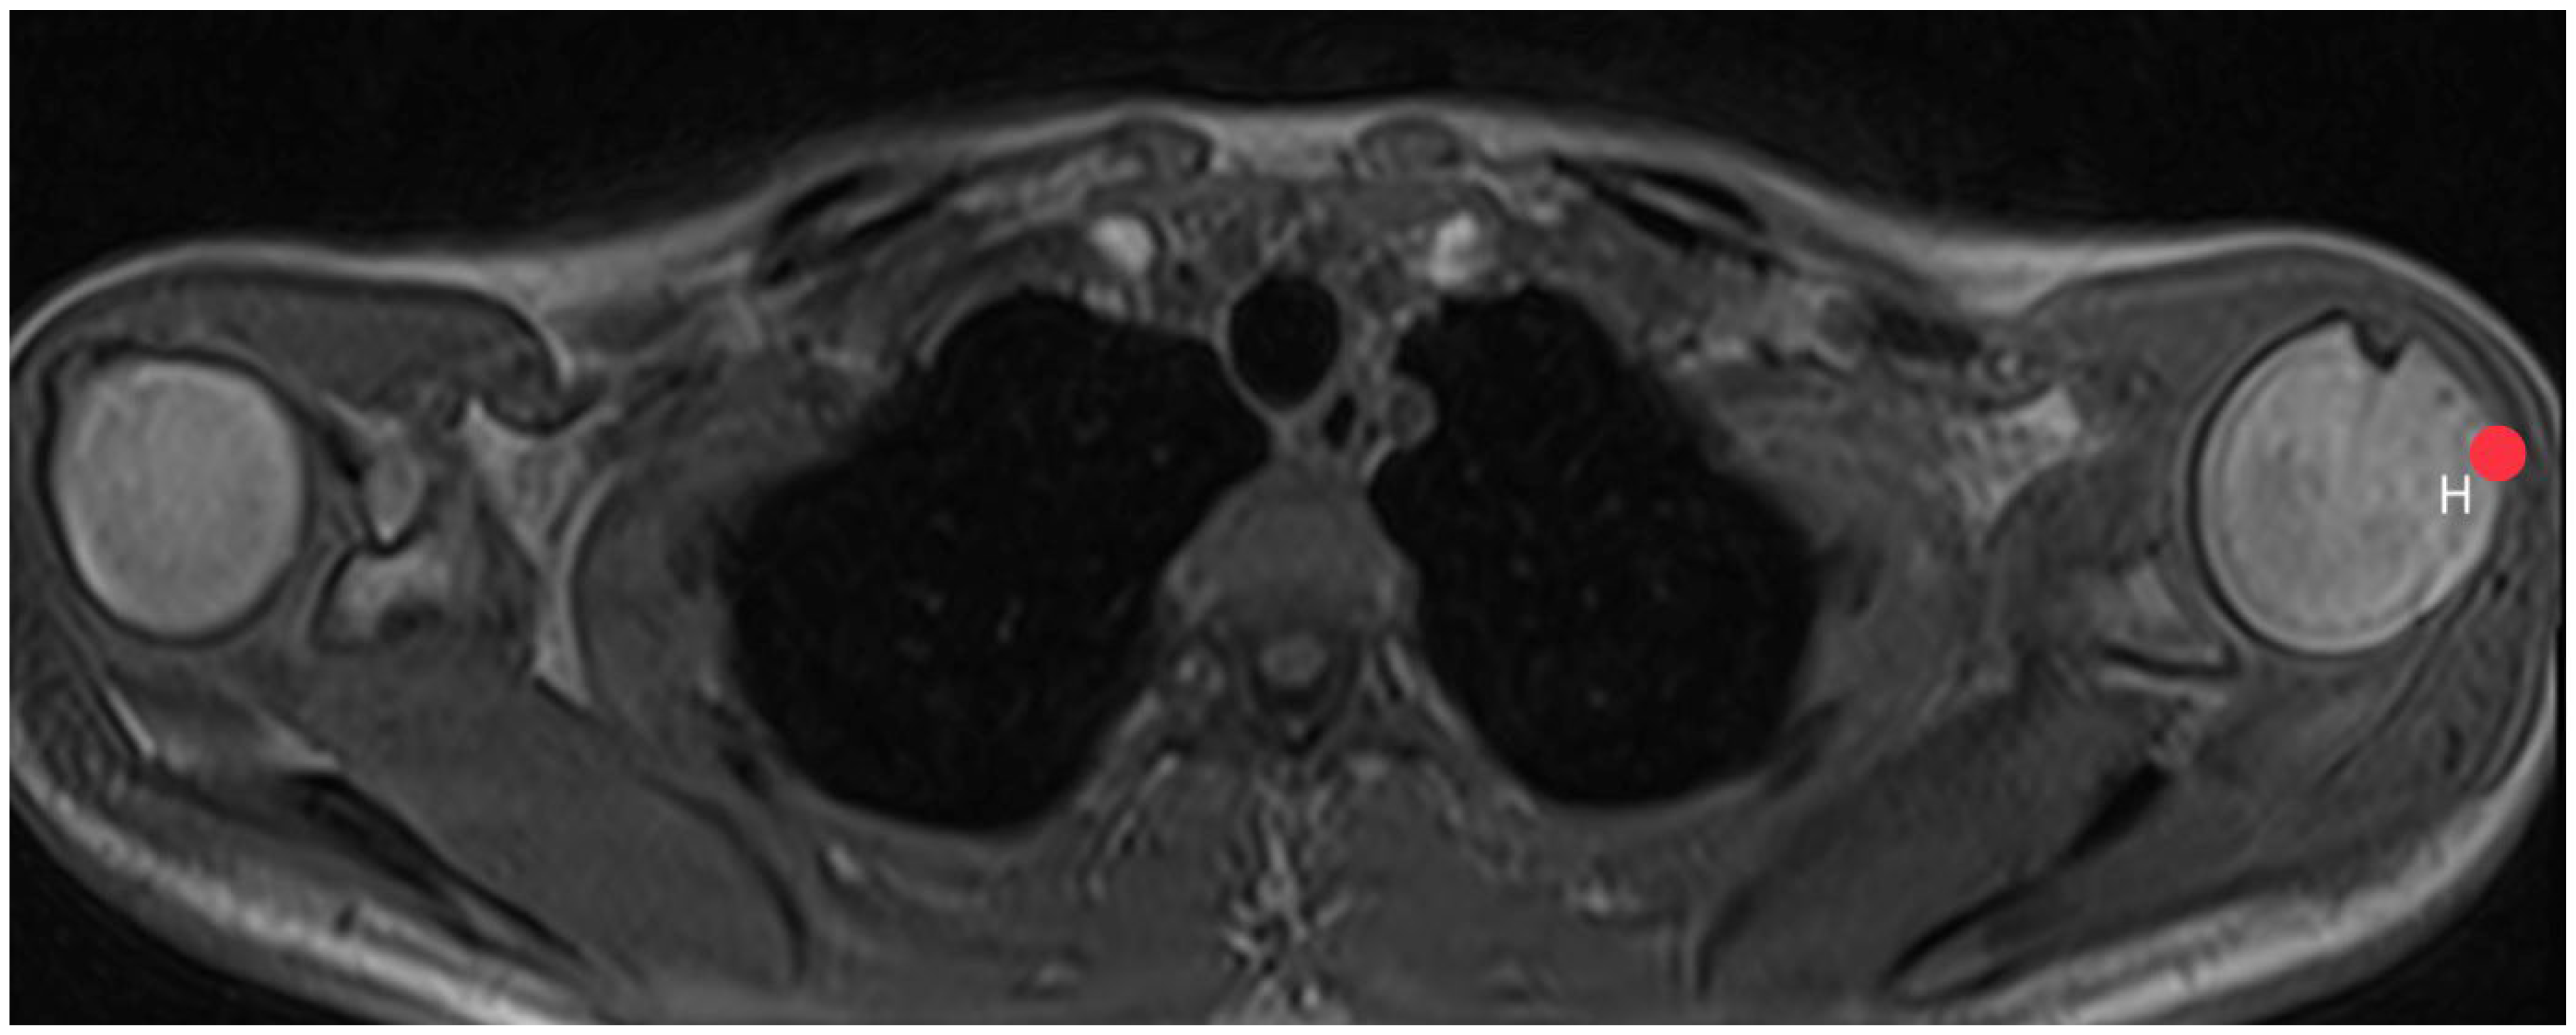
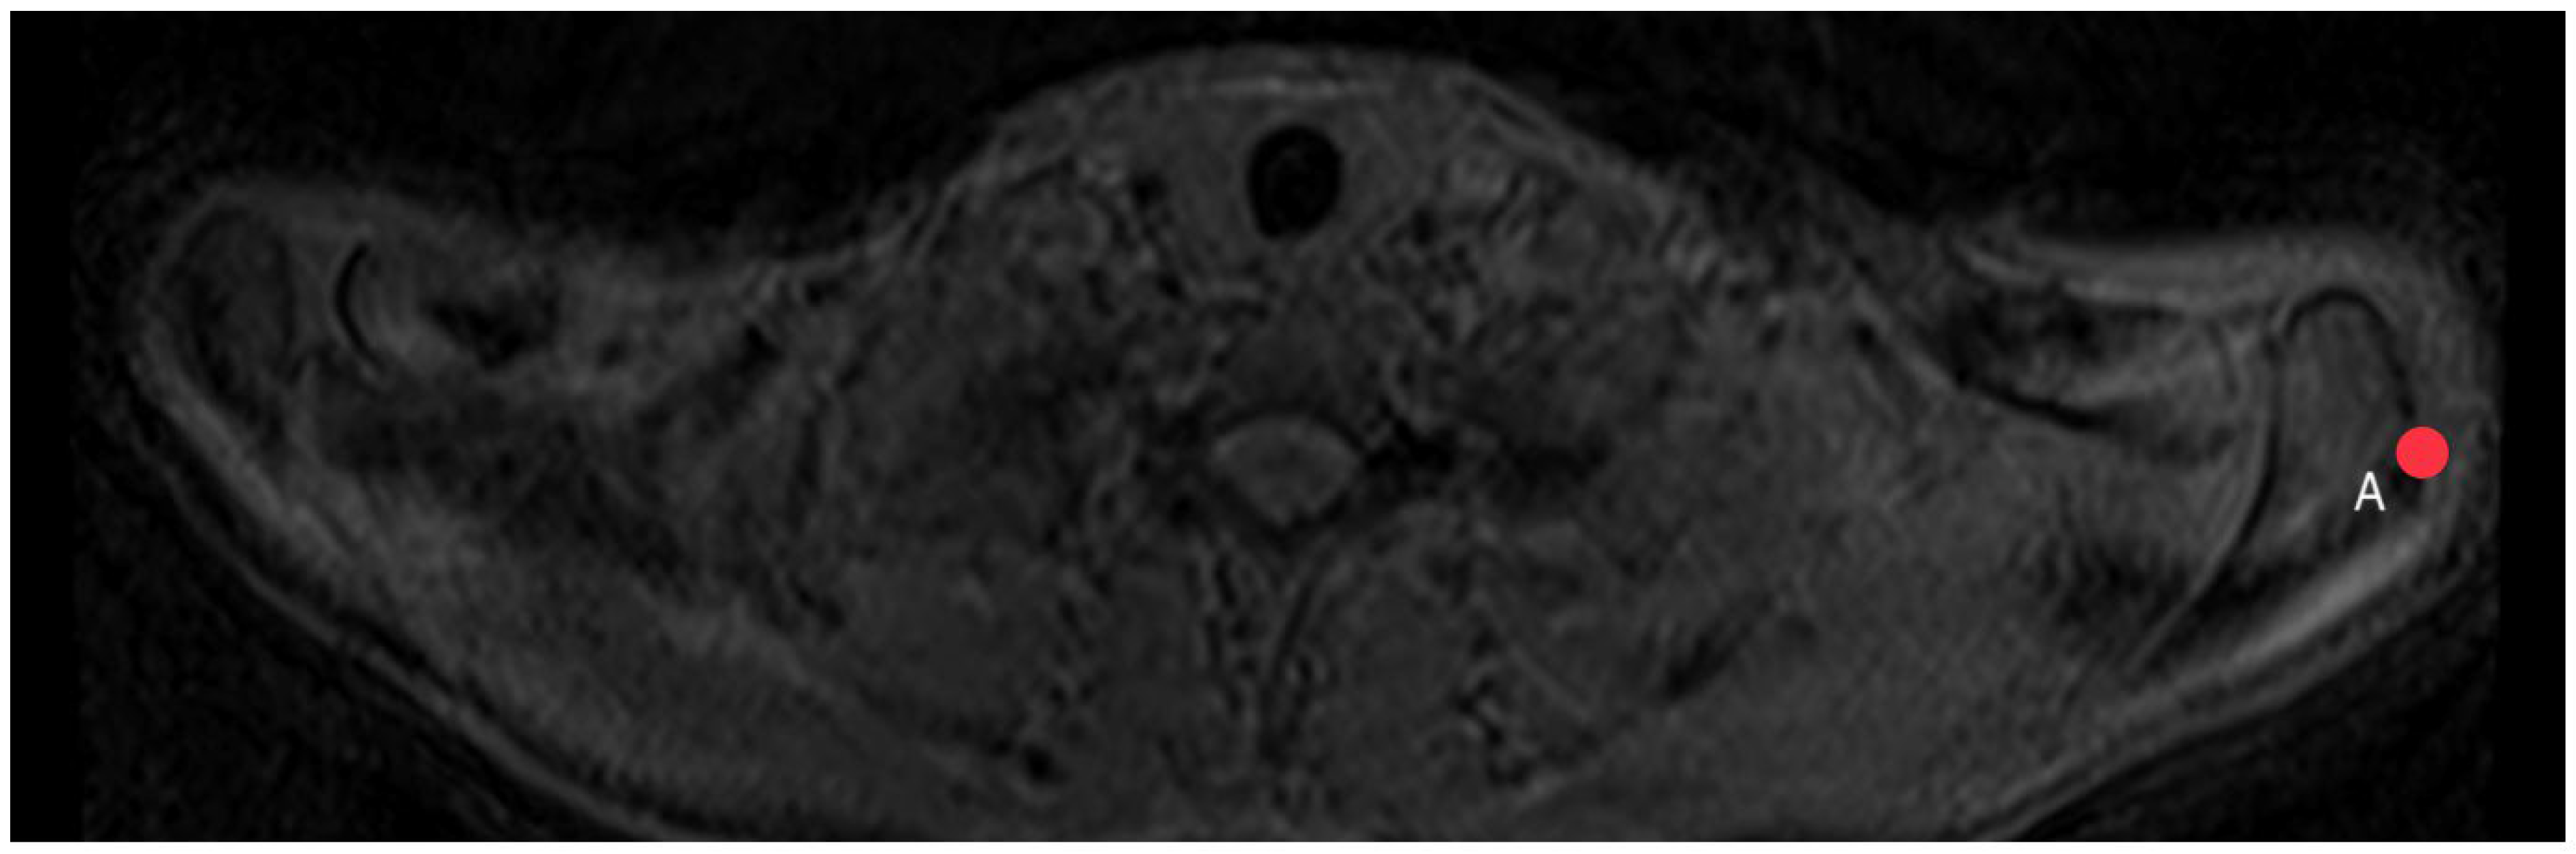
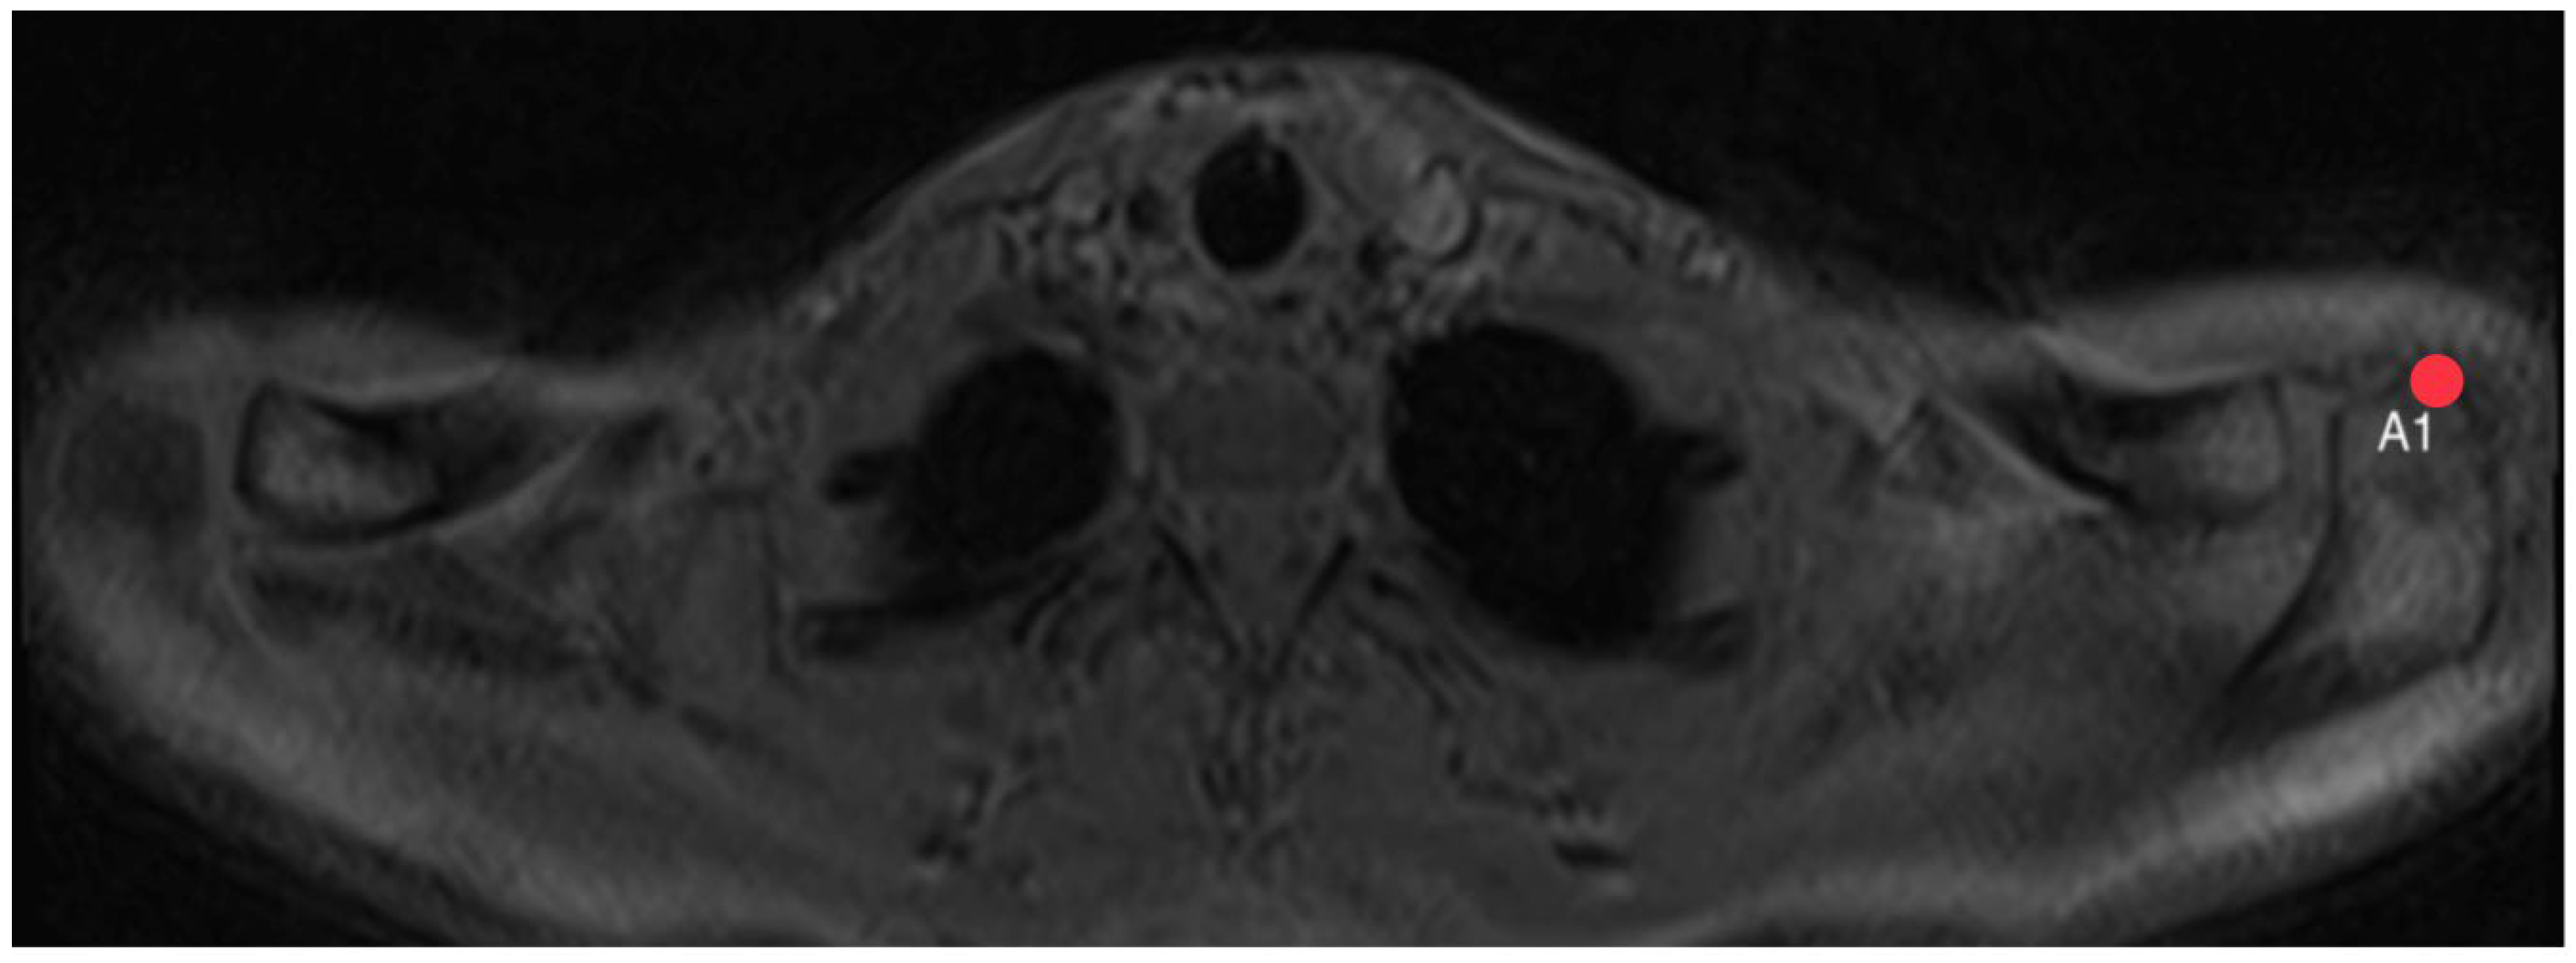
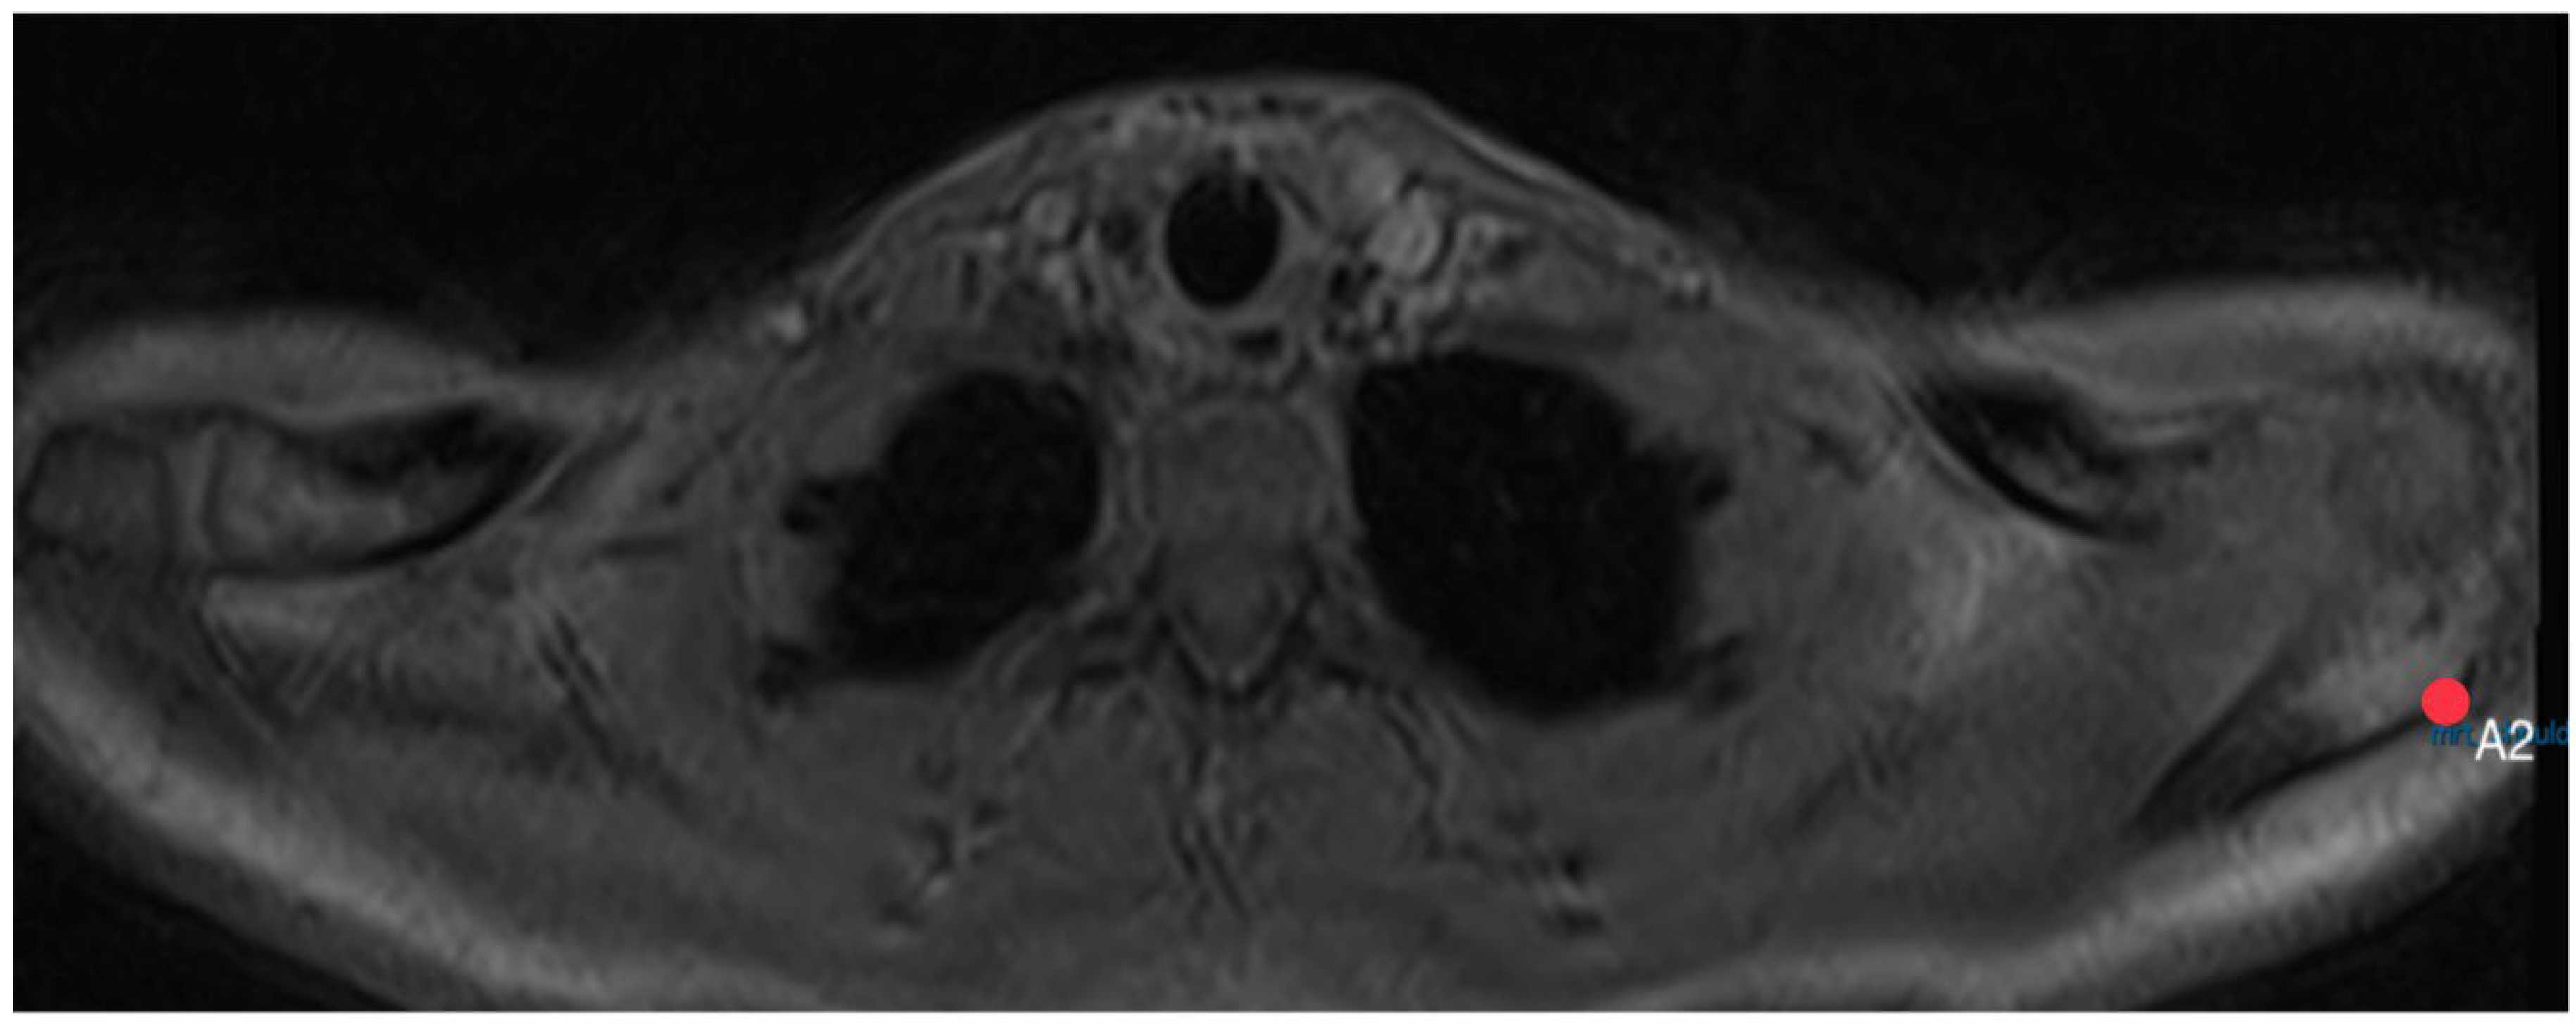
2.3. Acromion Index (Figure 1)

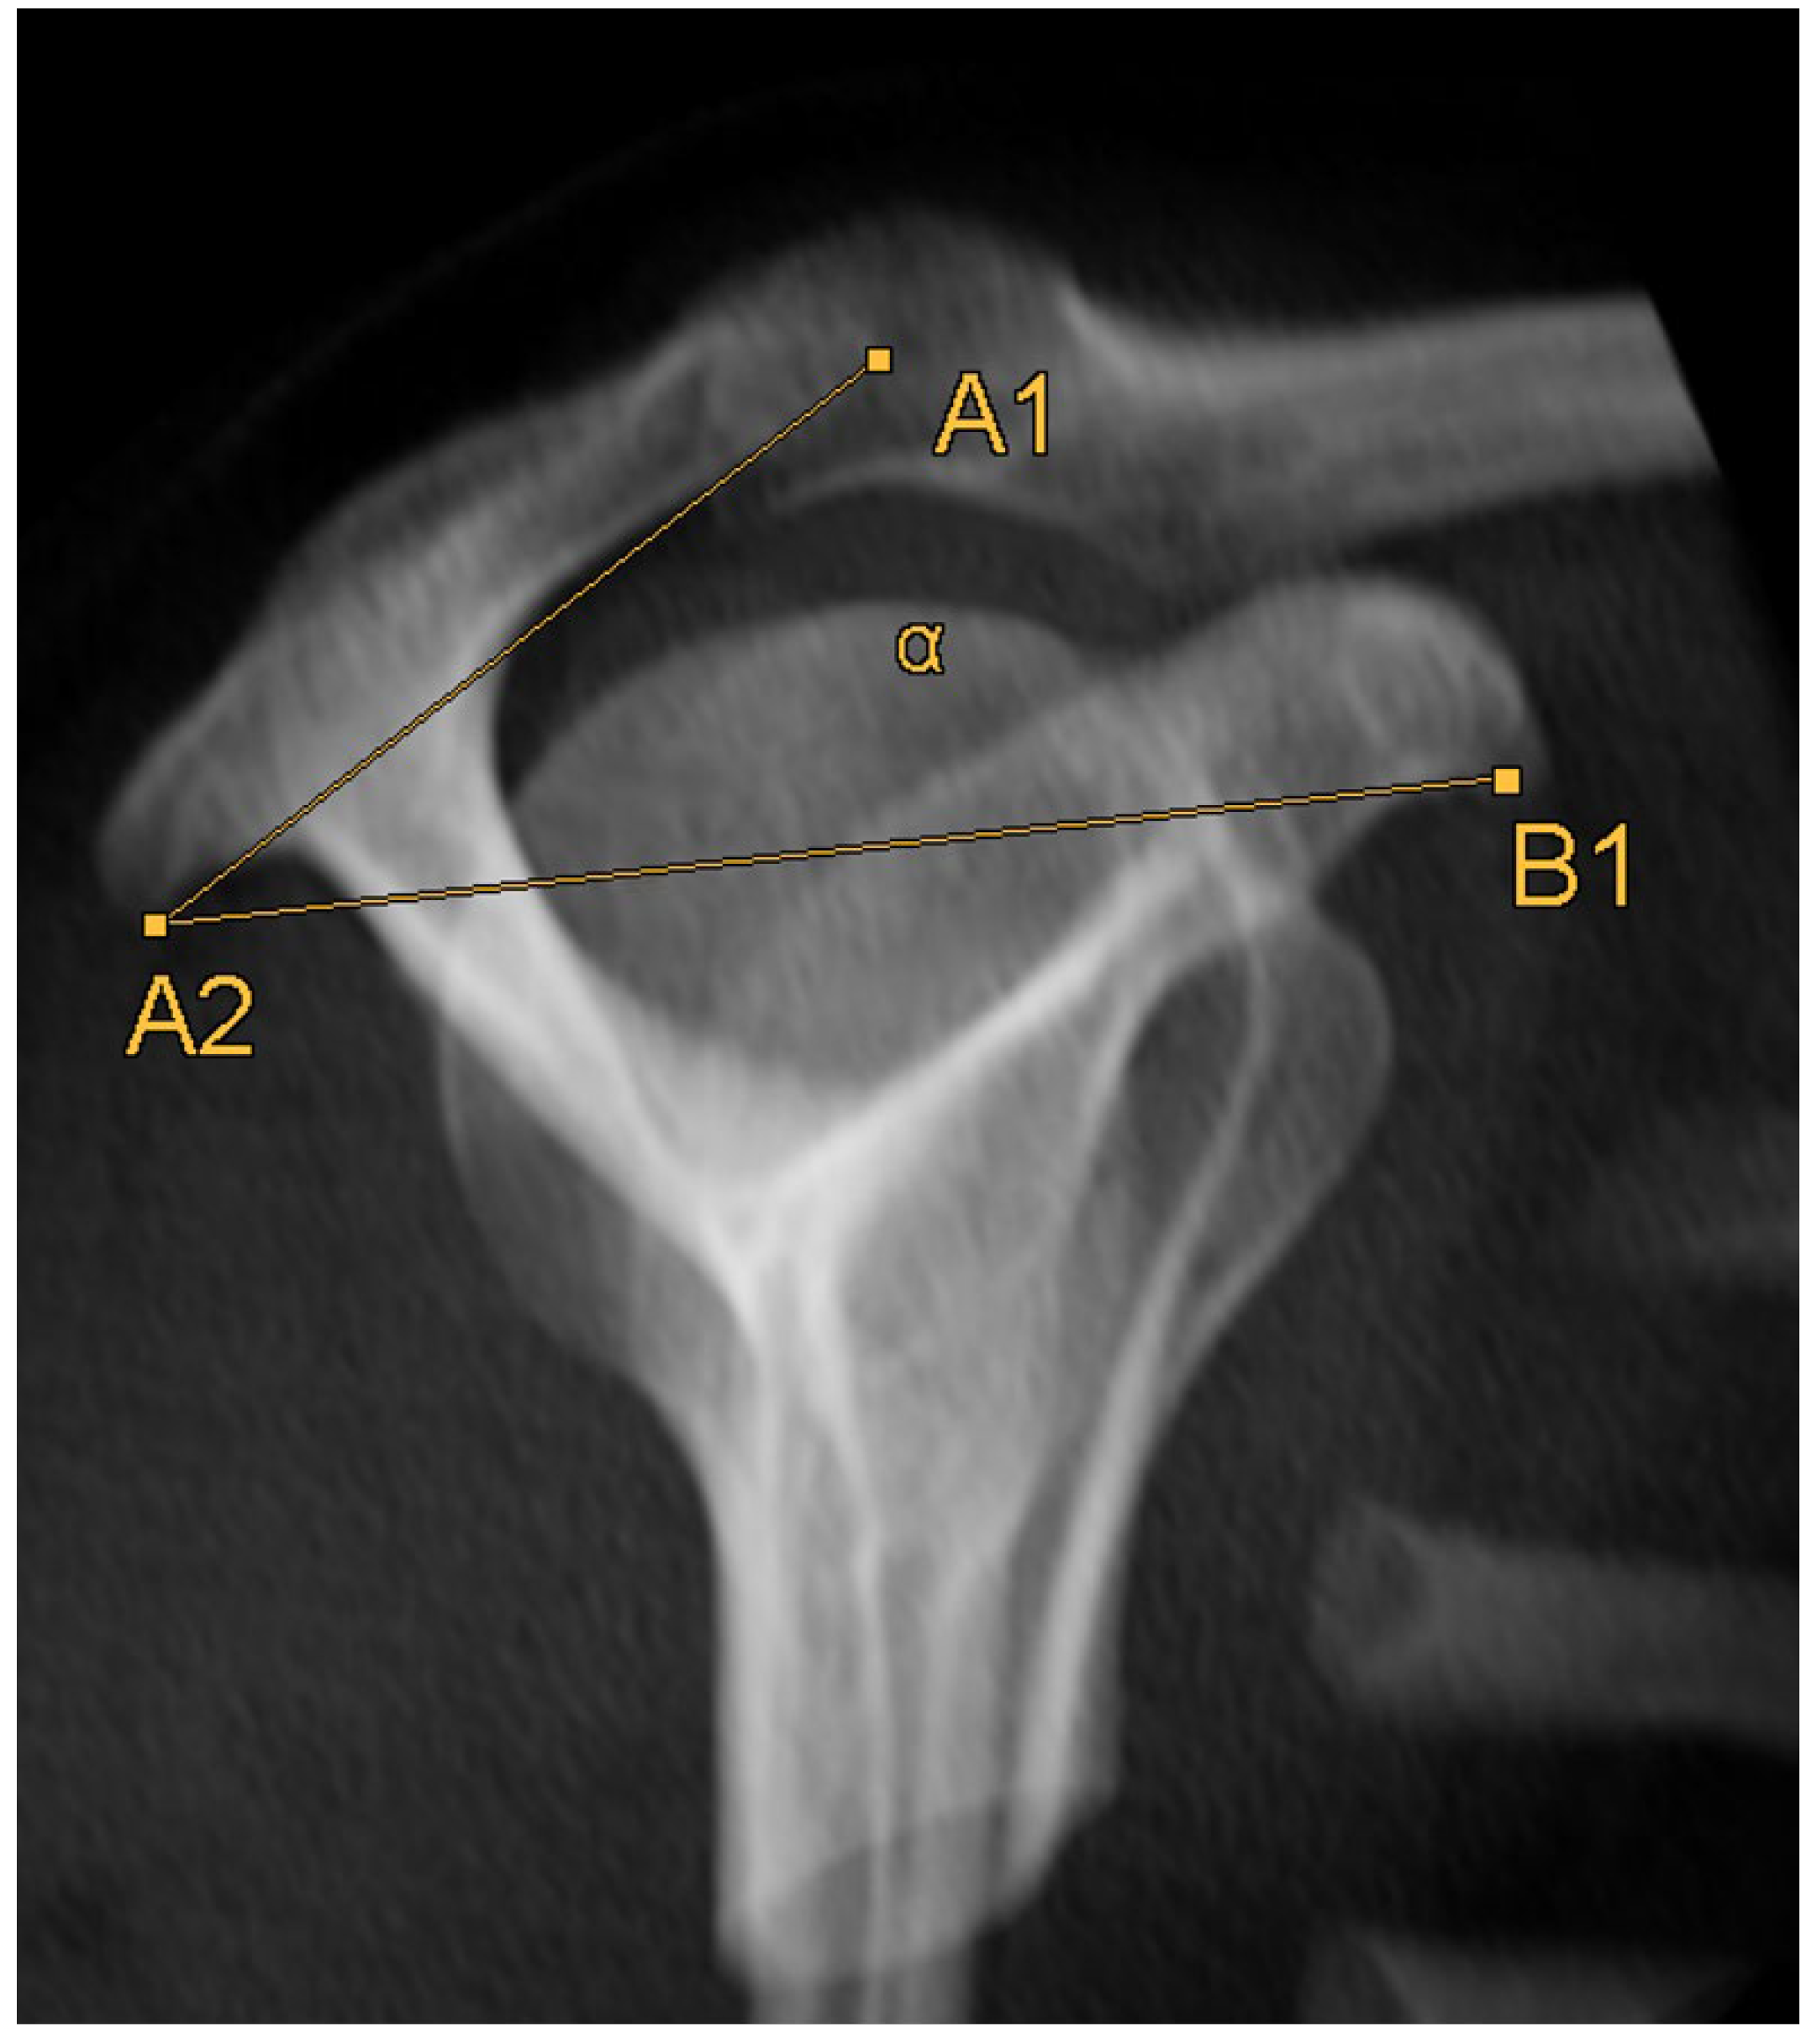
2.4. Acromion Tilt (Figure 6)
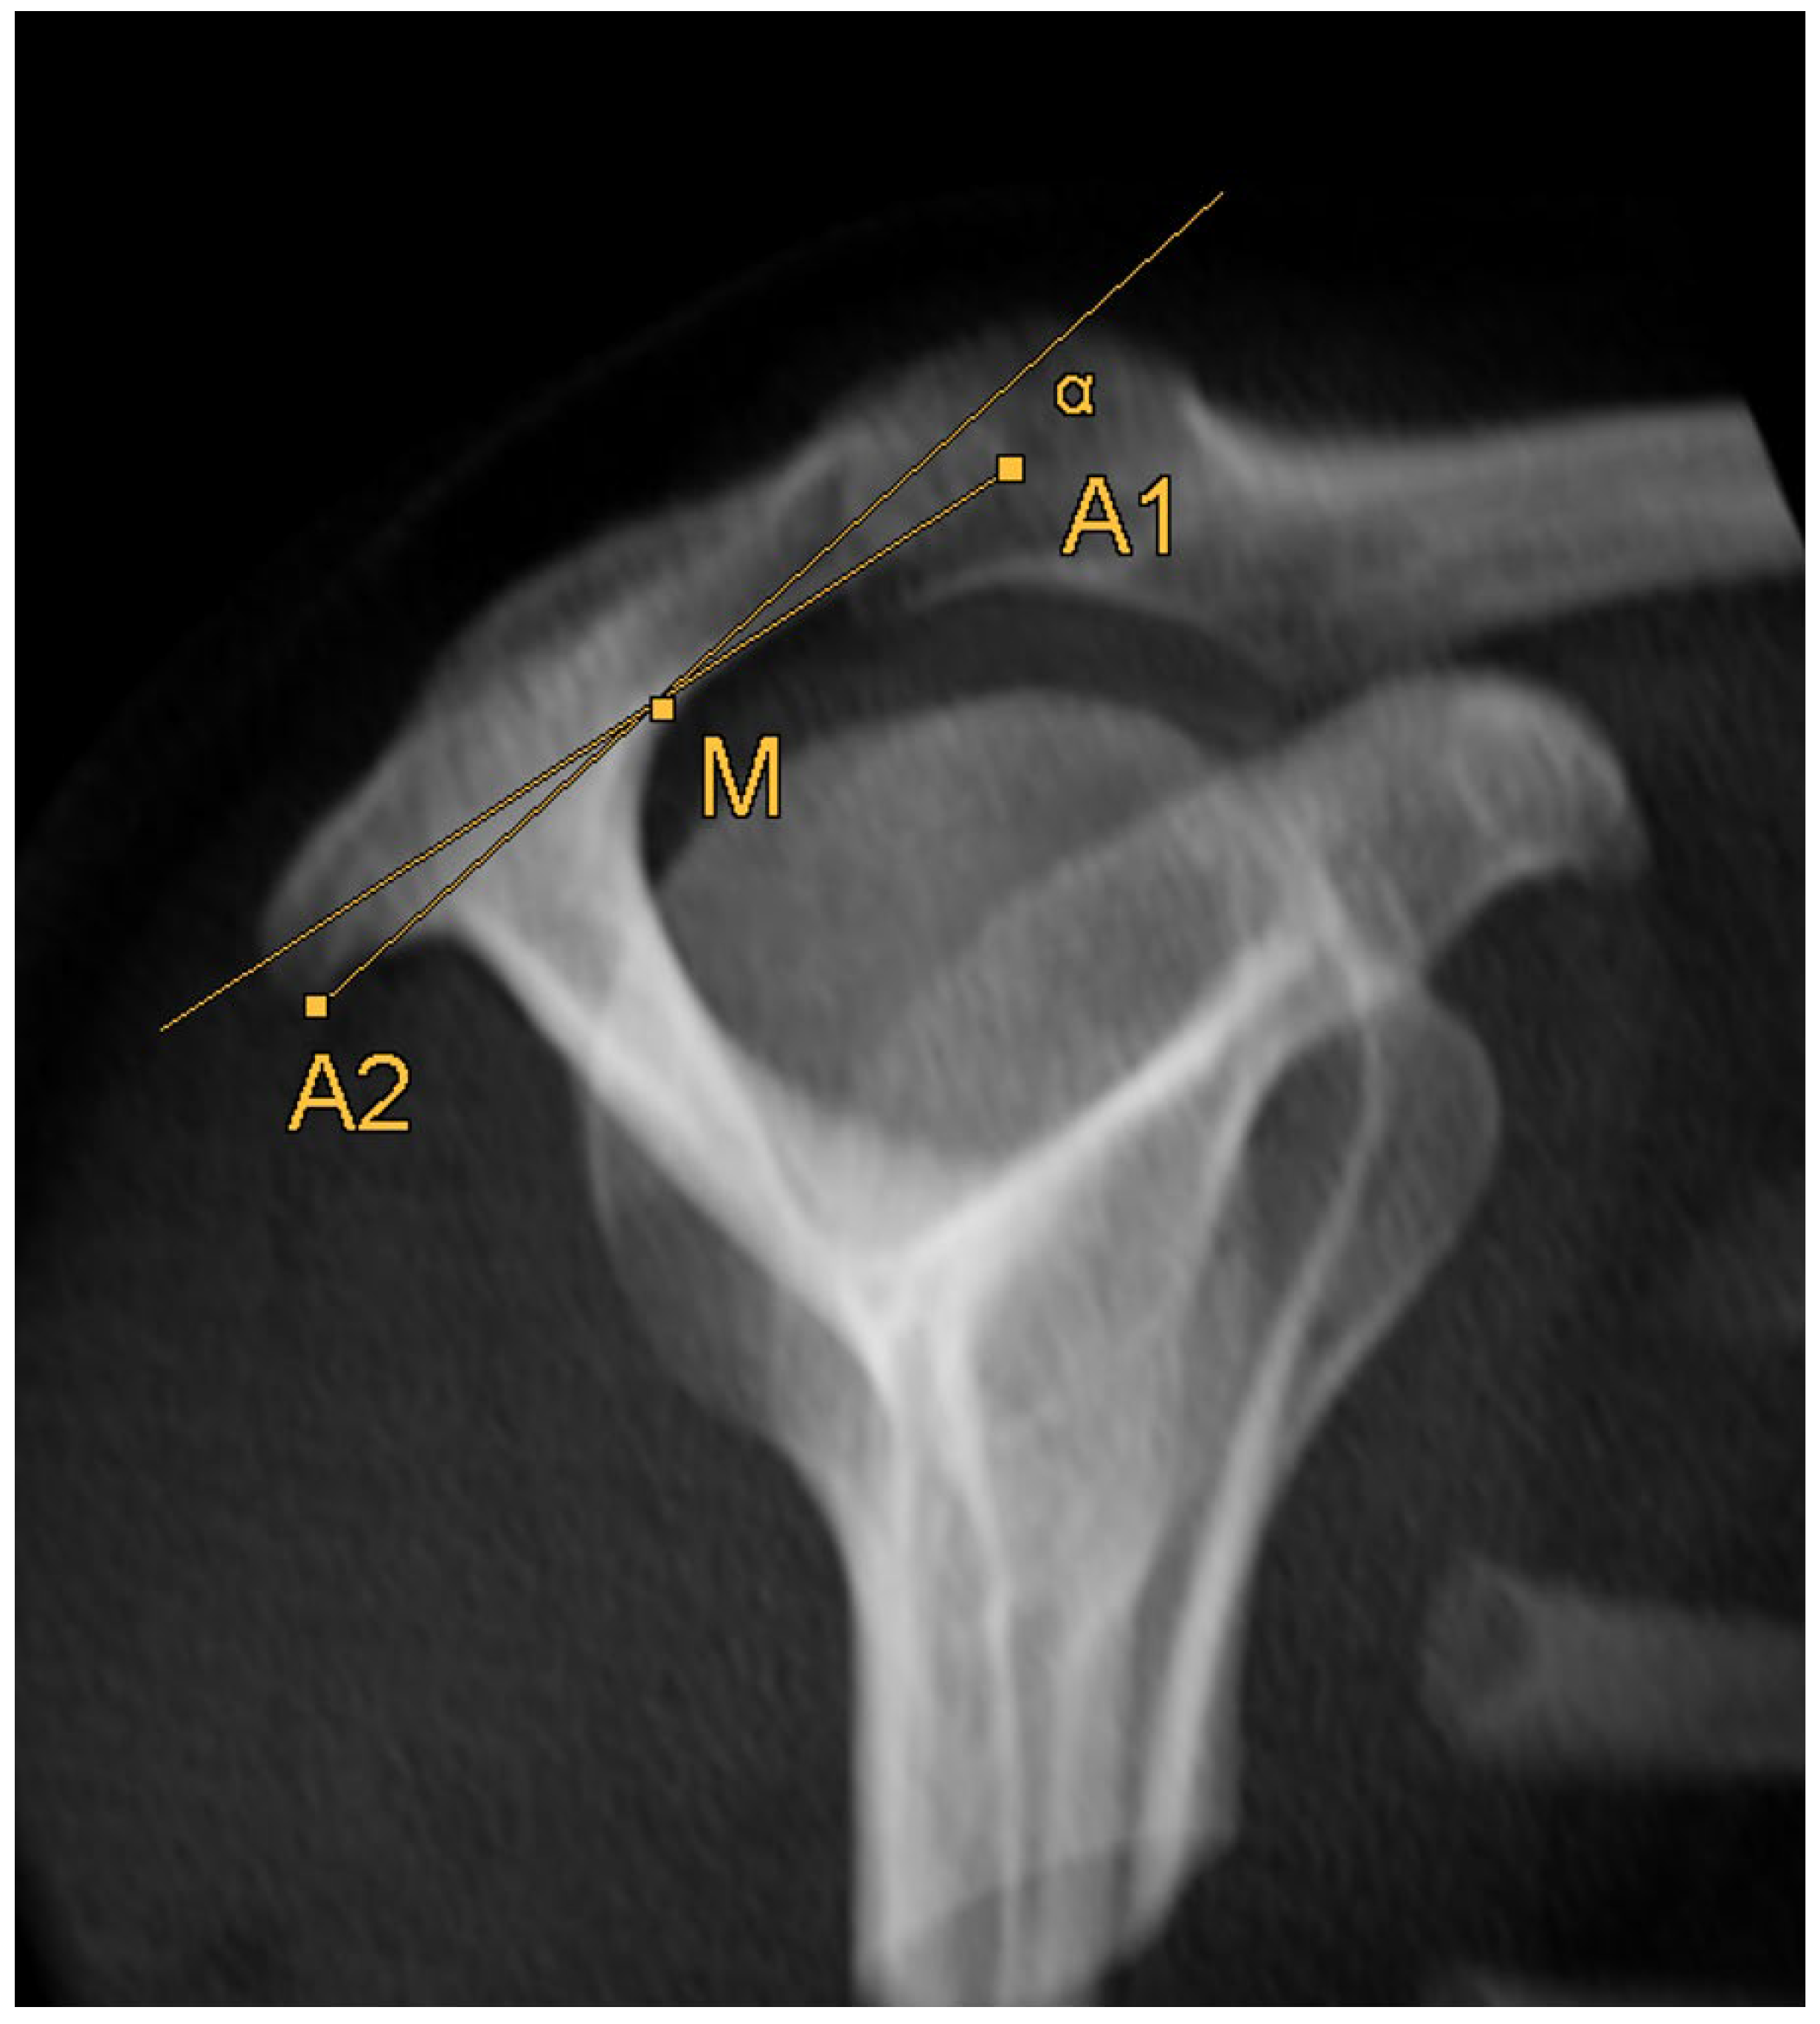
2.5. Acromion Slope (Figure 10)
2.6. Statistical Analysis
3. Results
3.1. Correlation Analysis
3.1.1. Comparison between Left and Right Side
3.1.2. Comparison between Genders
3.1.3. Correlation with Anthropometric Parameters
3.1.4. Hand Dominance and Pain Intensity
3.1.5. Reference Values
4. Discussion
5. Conclusions
Author Contributions
Funding
Institutional Review Board Statement
Informed Consent Statement
Data Availability Statement
Acknowledgments
Conflicts of Interest
References
- Urwin, M.; Symmons, D.; Allison, T.; Bramah, T. Estimating the Burden of Musculoskeletal Disorders in the Community: The Comparative Prevalence of Symptoms at Different Anatomical Sites, and the Relation to Social Deprivation. Ann. Rheum. Dis. 1998, 57, 649–655. [Google Scholar] [CrossRef] [PubMed]
- Garving, C.; Jakob, S.; Bauer, I.; Nadjar, R.; Brunner, U.H. Impingement Syndrome of the Shoulder. Dtsch. Arztebl. Int. 2017, 114, 765–776. [Google Scholar] [CrossRef] [PubMed]
- Ostör, A.J.K.; Richards, C.A.; Prevost, A.T.; Speed, C.A.; Hazleman, B.L. Diagnosis and Relation to General Health of Shoulder Disorders Presenting to Primary Care. Rheumatology 2005, 44, 800–805. [Google Scholar] [CrossRef] [PubMed]
- Bigliani, L.U.; Levine, W.N. Subacromial Impingement Syndrome. J. Bone Jt. Surg. Am. 1997, 79, 1854–1868. [Google Scholar] [CrossRef]
- Tangtrakulwanich, B.; Kapkird, A. Analyses of Possible Risk Factors for Subacromial Impingement Syndrome. World J. Orthop. 2012, 3, 5–9. [Google Scholar] [CrossRef] [PubMed]
- Moor, B.K.; Bouaicha, S.; Rothenfluh, D.A.; Sukthankar, A.; Gerber, C. Is There an Association between the Individual Anatomy of the Scapula and the Development of Rotator Cuff Tears or Osteoarthritis of the Glenohumeral Joint?: A Radiological Study of the Critical Shoulder Angle. Bone Jt. J. 2013, 95–B, 935–941. [Google Scholar] [CrossRef] [PubMed]
- Katthagen, J.C.; Marchetti, D.C.; Tahal, D.S.; Turnbull, T.L.; Millett, P.J. The Effects of Arthroscopic Lateral Acromioplasty on the Critical Shoulder Angle and the Anterolateral Deltoid Origin: An Anatomic Cadaveric Study. Arthroscopy 2016, 32, 569–575. [Google Scholar] [CrossRef]
- Bigliani, L.U.; Morrison, D.S.; April, E.W. The Morphology of the Acromion and Its Relationship to Rotator Cuff Tears. Orthop. Trans. 1986, 10, 228. [Google Scholar]
- Colegate-Stone, T.J.; Tavakkolizadeh, A.; Sinha, J. An Analysis of Acromioclavicular Joint Morphology as a Factor for Shoulder Impingement Syndrome. Shoulder Elb. 2014, 6, 165–170. [Google Scholar] [CrossRef]
- Balke, M.; Schmidt, C.; Dedy, N.; Banerjee, M.; Boillon, B.; Liem, D. Correlation of Acromial Morphology with Impingement Syndrome and Rotator Cuff Tears. Acta Orthop. 2013, 84, 178–183. [Google Scholar] [CrossRef]
- Ludewig, P.M.; Reynolds, J.F. The Association of Scapular Kinematics and Glenohumeral Joint Pathologies. J. Orthop. Sports Phys. Ther. 2009, 39, 90–104. [Google Scholar] [CrossRef] [PubMed]
- Colegate-Stone, T.; Allom, R.; Singh, R.; Elias, D.A.; Standring, S.; Sinha, J. Classification of the Morphology of the Acromioclavicular Joint Using Cadaveric and Radiological Analysis. J. Bone Jt. Surg. Br. 2010, 92, 743–746. [Google Scholar] [CrossRef] [PubMed]
- Chaimongkhol, T.; Benjachaya, S.; Mahakkanukrauh, P. Acromial Morphology and Morphometry Associated with Subacromial Impingement Syndrome. Anat. Cell Biol. 2020, 53, 435–443. [Google Scholar] [CrossRef] [PubMed]
- McLean, A.; Taylor, F. Classifications in Brief: Bigliani Classification of Acromial Morphology. Clin. Orthop. Relat. Res. 2019, 477, 1958–1961. [Google Scholar] [CrossRef] [PubMed]
- Kitay, G.S.; Iannotti, J.P.; Williams, G.R.; Haygood, T.; Kneeland, B.J.; Berlin, J. Roentgenographic Assessment of Acromial Morphologic Condition in Rotator Cuff Impingement Syndrome. J. Shoulder Elb. Surg. 1995, 4, 441–448. [Google Scholar] [CrossRef] [PubMed]
- Nyffeler, R.W.; Werner, C.M.; Sukthankar, A.; Schmid, M.R.; Gerber, C. Association of a Large Lateral Extension of the Acromion with Rotator Cuff Tears. J. Bone Jt. Surg. 2006, 88, 800–805. [Google Scholar] [CrossRef]
- Banas, M.P.; Miller, R.J.; Totterman, S. Relationship between the Lateral Acromion Angle and Rotator Cuff Disease. J. Shoulder Elb. Surg. 1995, 4, 454–461. [Google Scholar] [CrossRef]
- Ellman, H. Arthroscopic Subacromial Decompression: Analysis of One- to Three-Year Results. Arthroscopy 1987, 3, 173–181. [Google Scholar] [CrossRef]
- Chalmers, P.N.; Beck, L.; Miller, M.; Kawakami, J.; Dukas, A.G.; Burks, R.T.; Greis, P.E.; Tashjian, R.Z. Acromial Morphology Is Not Associated with Rotator Cuff Tearing or Repair Healing. J. Shoulder Elb. Surg. 2020, 29, 2229–2239. [Google Scholar] [CrossRef]
- Galvin, J.W.; Parada, S.A.; Li, X.; Eichinger, J.K. Critical Findings on Magnetic Resonance Arthrograms in Posterior Shoulder Instability Compared With an Age-Matched Controlled Cohort. Am. J. Sports Med. 2016, 44, 3222–3229. [Google Scholar] [CrossRef]
- Völzke, H.; Schössow, J.; Schmidt, C.O.; Jürgens, C.; Richter, A.; Werner, A.; Werner, N.; Radke, D.; Teumer, A.; Ittermann, T.; et al. Cohort Profile Update: The Study of Health in Pomerania (SHIP). Int. J. Epidemiol. 2011, 51, e372–e383. [Google Scholar] [CrossRef] [PubMed]
- Kasch, R.; Scheele, J.; Hancock, M.; Hofer, A.; Maher, C.; Bülow, R. Prevalence of Benign Osseous Lesions of the Spine and Association with Spinal Pain in the General Population in Whole Body MRI. PLoS ONE 2018, 13, e0193343. [Google Scholar] [CrossRef] [PubMed]
- Hegenscheid, K.; Kühn, J.P.; Völzke, H.; Biffar, R.; Hosten, N.; Puls, R. Whole-Body Magnetic Resonance Imaging of Healthy Volunteers: Pilot Study Results from the Population-Based SHIP Study. Rofo 2009, 181, 748–759. [Google Scholar] [CrossRef] [PubMed]
- Akoglu, H. User’s Guide to Correlation Coefficients. Turk. J. Emerg. Med. 2018, 18, 91–93. [Google Scholar] [CrossRef] [PubMed]
- Parada, S.A.; Shaw, K.A.; Antosh, I.J.; Eichinger, J.K.; Li, X.; Curry, E.J.; Provencher, M.T. Magnetic Resonance Imaging Correlates With Computed Tomography for Glenoid Version Calculation Despite Lack of Visibility of Medial Scapula. Arthroscopy 2020, 36, 99–105. [Google Scholar] [CrossRef] [PubMed]
- Matsen, F.A.; Whitson, A.; Hsu, J.E.; Stankovic, N.K.; Neradilek, M.B.; Somerson, J.S. Prearthroplasty Glenohumeral Pathoanatomy and Its Relationship to Patient’s Sex, Age, Diagnosis, and Self-Assessed Shoulder Comfort and Function. J. Shoulder Elb. Surg. 2019, 28, 2290–2300. [Google Scholar] [CrossRef] [PubMed]
- Matsuki, K.; Sugaya, H.; Hoshika, S.; Ueda, Y.; Takahashi, N.; Tokai, M.; Banks, S.A. Three-Dimensional Measurement of Glenoid Dimensions and Orientations. J. Orthop. Sci. 2019, 24, 624–630. [Google Scholar] [CrossRef]
- Tackett, J.J.; Ablove, R.H. Magnetic Resonance Imaging Study of Glenohumeral Relationships between Genders. J. Shoulder Elb. Surg. 2011, 20, 1335–1339. [Google Scholar] [CrossRef]
- Hill, L.; Collins, M.; Posthumus, M. Risk Factors for Shoulder Pain and Injury in Swimmers: A Critical Systematic Review. Phys. Sports Med. 2015, 43, 412–420. [Google Scholar] [CrossRef]
- Hoppe, M.W.; Brochhagen, J.; Tischer, T.; Beitzel, K.; Seil, R.; Grim, C. Risk Factors and Prevention Strategies for Shoulder Injuries in Overhead Sports: An Updated Systematic Review. J. Exp. Orthop. 2022, 9, 78. [Google Scholar] [CrossRef]
- Greenberg, D.L. Evaluation and Treatment of Shoulder Pain. Med. Clin. N. Am. 2014, 98, 487–504. [Google Scholar] [CrossRef] [PubMed]
- Linaker, C.H.; Walker-Bone, K. Shoulder Disorders and Occupation. Best Pract. Res. Clin. Rheumatol. 2015, 29, 405–423. [Google Scholar] [CrossRef] [PubMed]
- Lollino, N.; Brunocilla, P.R.; Poglio, F.; Vannini, E.; Lollino, S.; Lancia, M. Non-Orthopaedic Causes of Shoulder Pain: What the Shoulder Expert Must Remember. Musculoskelet. Surg. 2012, 96, 63–68. [Google Scholar] [CrossRef] [PubMed]


| Variable | n | ICC | Mean Value | Inter Absolute | Inter % | |||||
|---|---|---|---|---|---|---|---|---|---|---|
| R1 | R2 | Both | R1 | R2 | Mean | SD | Mean | SD | ||
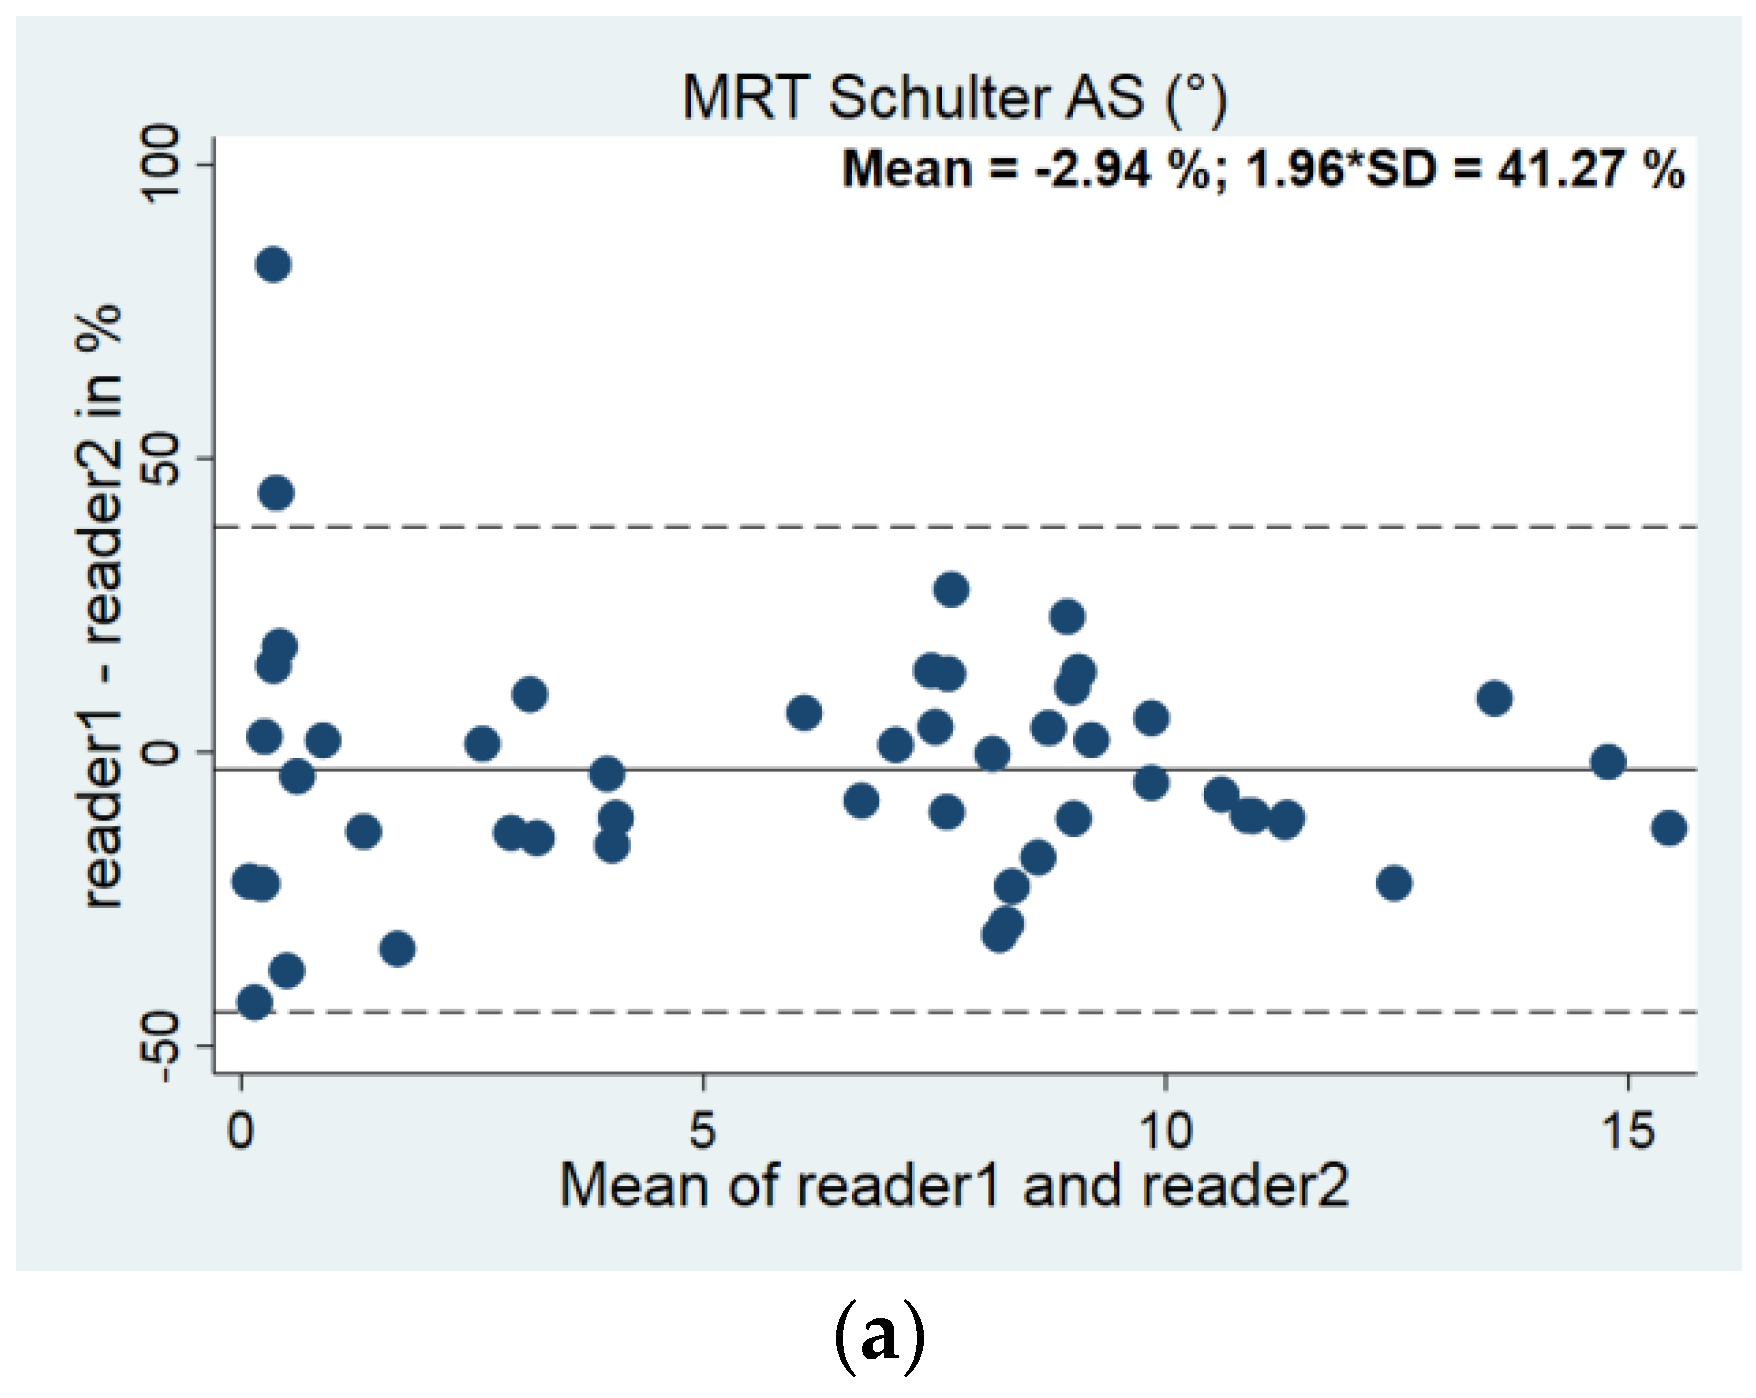
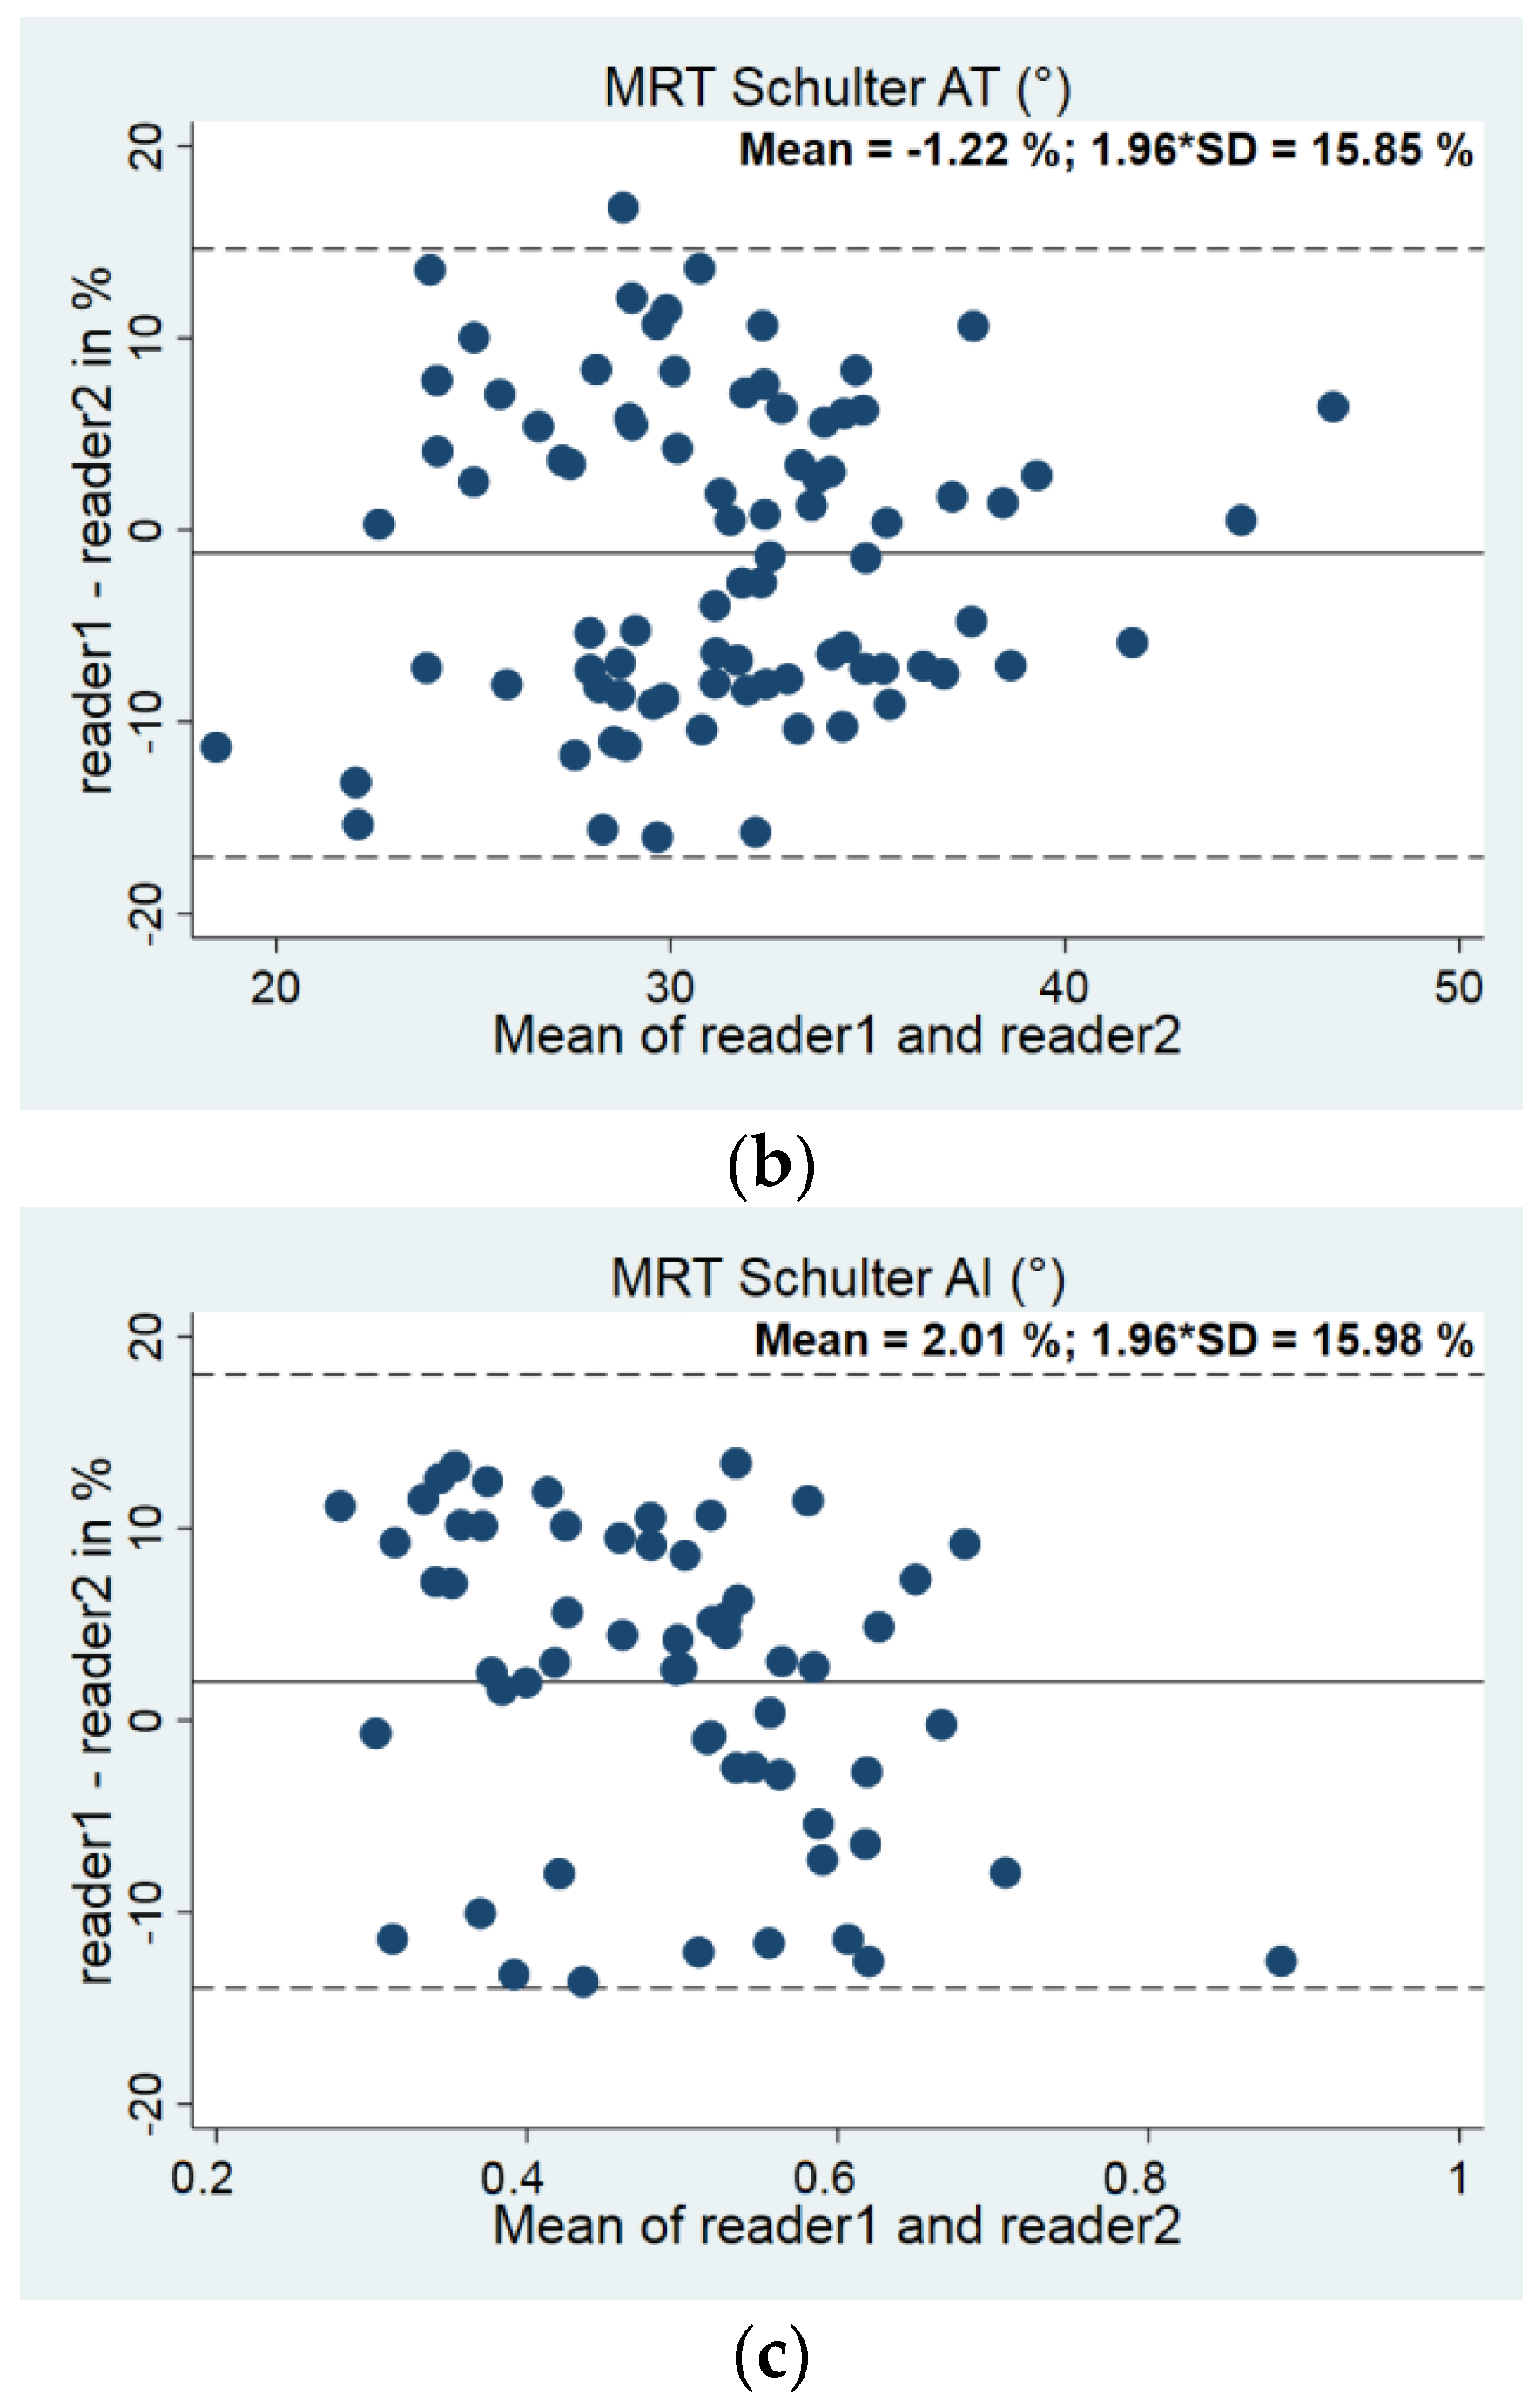
| Acromion slope | 57 | 55 | 50 | <0.001 | 6.18 | 6.43 | −0.25 | 1.04 | −2.94 | 21.05 |
| Acromion tilt | 86 | 85 | 85 | <0.001 | 31.09 | 31.45 | −0.36 | 2.43 | −1.22 | 8.09 |
| Acromion index | 60 | 60 | 60 | <0.001 | 0.494 | 0.487 | 0.0066 | 0.041 | 2.01 | 8.15 |
| Parameter | n Right Side; Left Side | Right: Median [p25; p75] | Left: Median [p25; p75] | Pearson´s Correlation Coefficient |
|---|---|---|---|---|
| Acromion slope (°) | 876; 606 | 5.12 [0.99; 8.40] | 6.52 [1.24; 9.71] | 0.192 |
| Acromion tilt (°) | 875; 608 | 30.96 [27.45; 34.39] | 31.19 [28.29; 34.55] | 0.529 |
| Acromion index | 915; 642 | 0.53 [0.39; 0.64] | 0.48 [0.35; 0.59] | 0.339 |
| Parameter | Female: Median [p25; p75] | Male: Median [p25; p75] | p-Value |
|---|---|---|---|
| Acromion slope r (°) | 4.66 [0.966; 8.772] | 5.47 [1.146; 7.794] | 0.575 |
| Acromion slope l (°) | 7.10 [1.411; 10.057] | 5.88 [1.042; 9.104] | 0.202 |
| Acromion tilt r (°) | 31.01 [27.46; 34.60] | 30.78 [27.42; 34.21] | 0.546 |
| Acromion tilt l (°) | 31.56 [28.37; 34.64] | 30.64 [28.01; 34.39] | 0.126 |
| Acromion index r | 0.53 [0.425; 0.615] | 0.53 [0.437; 0.630] | 0.761 |
| Acromion index l | 0.50 [0.395; 0.597] | 0.52 [0.422; 0.590] | 0.412 |
| Parameter | Pearson’s Correlation Coefficient | 95% Conf. Interval | p-Value |
|---|---|---|---|
| Acromion slope r (°) | |||
| Height | 0.032 | [−0.097; 0.162] | 0.624 |
| Weight | −0.078 | [−0.143; −0.012] | 0.021 |
| BMI | −0.264 | [−0.465; −0.063] | 0.010 |
| Acromion slope l (°) | |||
| Height | −0.026 | [−0.175; 0.123] | 0.729 |
| Weight | −0.020 | [−0.101; 0.061] | 0.624 |
| BMI | −0.035 | [−0.281; 0.210] | 0.778 |
| Acromion tilt r (°) | |||
| Height | −0.013 | [−0.080; 0.055] | 0.714 |
| Weight | 0.030 | [−0.006; 0.066] | 0.104 |
| BMI | 0.101 | [−0.009; 0.210] | 0.071 |
| Acromion tilt l (°) | |||
| Height | −0.030 | [−0.110; 0.050] | 0.458 |
| Weight | 0.013 | [−0.031; 0.056] | 0.573 |
| BMI | 0.071 | [−0.057; 0.199] | 0.276 |
| Acromion index r | |||
| Height | 0.002 | [−0.001; 0.004] | 0.170 |
| Weight | 0.001 | [−0.001; 0.002] | 0.787 |
| BMI | −0.001 | [−0.005; 0.003] | 0.663 |
| Acromion index l | |||
| Height | 0.001 | [−0.003; 0.003] | 0.889 |
| Weight | 0.001 | [−0.002; 0.002] | 0.936 |
| BMI | −0.001 | [−0.005; 0.004] | 0.919 |
| Parameter | Pearson’s Correlation Coefficient | 95% Conf. Interval | p-Value |
|---|---|---|---|
| Acromion slope r (°) | 1.239 | [−2.435; 4.914] | 0.508 |
| Acromion slope l (°) | −1.025 | [−5.510; 3.461] | 0.654 |
| Acromion tilt r (°) | 0.320 | [−1.711; 2.350] | 0.757 |
| Acromion tilt l (°) | −0.083 | [−2.560; 2.393] | 0.947 |
| Acromion index r | 0.023 | [−0.044; 0.091] | 0.501 |
| Acromion index l | 0.023 | [−0.047; 0.093] | 0.516 |
| Parameter | Pearson’s Correlation Coefficient | 95% Conf. Interval | p-Value |
|---|---|---|---|
| Acromion slope r (°) | −1.994 | [−4.167; 0.178] | 0.072 |
| Acromion slope l (°) | 0.287 | [−2.379; 2.952] | 0.833 |
| Acromion tilt r (°) | −0.696 | [−1.871; 0.478] | 0.245 |
| Acromion tilt l (°) | −0.240 | [−1.723; 1.243] | 0.750 |
| Acromion index r | −0.006 | [−0.044; 0.032] | 0.760 |
| Acromion index l | 0.021 | [−0.025; 0.068] | 0.371 |
| Parameter | n | 2.5th Percentile | Median | 97.5th Percentile |
|---|---|---|---|---|
| AS r (°) | 461 | 0 [0; 0] | 5.48 [3.81; 6.46] | 13.15 [12.27; 14.79] |
| AS l (°) | 334 | 0 [0; 0] | 6.48 [5.01; 7.34] | 16.27 [14.03; 20.27] |
| AT r (°) | 461 | 20.26 [18.93; 21.87] | 30.83 [30.25; 31.35] | 41.70 [39.99; 42.79] |
| AT l (°) | 335 | 21.97 [20.09; 23.61] | 31.62 [30.97; 32.41] | 42.01 [40.64; 43.18] |
| AI r | 393 | 0.26 [0.25; 0.29] | 0.52 [0.50; 0.55] | 0.72 [0.71; 0.73] |
| AI l | 294 | 0.25 [0.24; 0.28] | 0.50 [0.48; 0.52] | 0.72 [0.69; 0.73] |
Disclaimer/Publisher’s Note: The statements, opinions and data contained in all publications are solely those of the individual author(s) and contributor(s) and not of MDPI and/or the editor(s). MDPI and/or the editor(s) disclaim responsibility for any injury to people or property resulting from any ideas, methods, instructions or products referred to in the content. |
© 2024 by the authors. Licensee MDPI, Basel, Switzerland. This article is an open access article distributed under the terms and conditions of the Creative Commons Attribution (CC BY) license (https://creativecommons.org/licenses/by/4.0/).
Share and Cite
Prietzel, A.; Languth, T.; Bülow, R.; Ittermann, T.; Laqua, R.; Haralambiev, L.; Wassilew, G.I.; Ekkernkamp, A.; Bakir, M.S. Establishing Normative Values for Acromion Anatomy: A Comprehensive MRI-Based Study in a Healthy Population of 996 Participants. Diagnostics 2024, 14, 107. https://doi.org/10.3390/diagnostics14010107
Prietzel A, Languth T, Bülow R, Ittermann T, Laqua R, Haralambiev L, Wassilew GI, Ekkernkamp A, Bakir MS. Establishing Normative Values for Acromion Anatomy: A Comprehensive MRI-Based Study in a Healthy Population of 996 Participants. Diagnostics. 2024; 14(1):107. https://doi.org/10.3390/diagnostics14010107
Chicago/Turabian StylePrietzel, Anne, Theo Languth, Robin Bülow, Till Ittermann, René Laqua, Lyubomir Haralambiev, Georgi Iwan Wassilew, Axel Ekkernkamp, and Mustafa Sinan Bakir. 2024. "Establishing Normative Values for Acromion Anatomy: A Comprehensive MRI-Based Study in a Healthy Population of 996 Participants" Diagnostics 14, no. 1: 107. https://doi.org/10.3390/diagnostics14010107
APA StylePrietzel, A., Languth, T., Bülow, R., Ittermann, T., Laqua, R., Haralambiev, L., Wassilew, G. I., Ekkernkamp, A., & Bakir, M. S. (2024). Establishing Normative Values for Acromion Anatomy: A Comprehensive MRI-Based Study in a Healthy Population of 996 Participants. Diagnostics, 14(1), 107. https://doi.org/10.3390/diagnostics14010107