
Functional and Morphological Outcomes after Trabeculectomy and Deep Sclerectomy—Results from a Monocentric Registry Study


Abstract
1. Introduction
2. Materials and Methods
3. Results
4. Discussion
5. Conclusions
Author Contributions
Funding
Institutional Review Board Statement
Informed Consent Statement
Data Availability Statement
Conflicts of Interest
References
- Jayaram, H.; Kolko, M.; Friedman, D.S.; Gazzard, G. Glaucoma: Now and beyond. Lancet 2023, 402, 1788–1801. [Google Scholar] [CrossRef] [PubMed]
- The AGIS Investigators. The Advanced Glaucoma Intervention Study (AGIS): 7. The relationship between control of intraocular pressure and visual field deterioration. Am. J. Ophthalmol. 2000, 130, 429–440. [Google Scholar] [CrossRef]
- Heijl, A.; Leske, M.C.; Bengtsson, B.; Hyman, L.; Bengtsson, B.; Hussein, M. Reduction of intraocular pressure and glaucoma progression: Results from the Early Manifest Glaucoma Trial. Arch. Ophthalmol. 2002, 120, 1268–1279. [Google Scholar] [CrossRef] [PubMed]
- Garway-Heath, D.F.; Crabb, D.P.; Bunce, C.; Lascaratos, G.; Amalfitano, F.; Anand, N.; Azuara-Blanco, A.; Bourne, R.R.; Broadway, D.C.; Cunliffe, I.A.; et al. Latanoprost for open-angle glaucoma (UKGTS): A randomised, multicentre, placebo-controlled trial. Lancet 2015, 385, 1295–1304. [Google Scholar] [CrossRef]
- Stein, J.D.; Khawaja, A.P.; Weizer, J.S. Glaucoma in Adults-Screening, Diagnosis, and Management: A Review. Jama 2021, 325, 164–174. [Google Scholar] [CrossRef] [PubMed]
- Cairns, J. Trabeculectomy: Preliminary report of a new method. Am. J. Ophthalmol. 1968, 66, 673–679. [Google Scholar] [CrossRef] [PubMed]
- Rulli, E.; Biagioli, E.; Riva, I.; Gambirasio, G.; De Simone, I.; Floriani, I.; Quaranta, L. Efficacy and safety of trabeculectomy vs. nonpenetrating surgical procedures: A systematic review and meta-analysis. JAMA Ophthalmol. 2013, 131, 1573–1582. [Google Scholar] [CrossRef]
- Tseng, V.L.; Kim, C.H.; Romero, P.T.; Yu, F.; Robertson-Brown, K.W.; Phung, L.; Raygoza, D.; Caprioli, J.; Coleman, A.L. Risk Factors and Long-Term Outcomes in Patients with Low Intraocular Pressure after Trabeculectomy. Ophthalmology 2017, 124, 1457–1465. [Google Scholar] [CrossRef]
- Gedde, S.J.; Feuer, W.J.; Lim, K.S.; Barton, K.; Goyal, S.; Ahmed, I.I.; Brandt, J.D. Postoperative Complications in the Primary Tube Versus Trabeculectomy Study During 5 Years of Follow-up. Ophthalmology 2022, 129, 1357–1367. [Google Scholar] [CrossRef]
- Roy, S.; Mermoud, A. Deep Sclerectomy. Dev. Ophthalmol. 2017, 59, 36–42. [Google Scholar] [CrossRef]
- Bormann, C.; Busch, C.; Rehak, M.; Schmidt, M.; Scharenberg, C.; Ziemssen, F.; Unterlauft, J.D. Two Year Functional and Structural Changes-A Comparison between Trabeculectomy and XEN Microstent Implantation Using Spectral Domain Optical Coherence Tomography. J. Clin. Med. 2022, 11, 5840. [Google Scholar] [CrossRef] [PubMed]
- Khaw, P.T.; Chiang, M.; Shah, P.; Sii, F.; Lockwood, A.; Khalili, A. Enhanced Trabeculectomy: The Moorfields Safer Surgery System. Dev. Ophthalmol. 2017, 59, 15–35. [Google Scholar] [CrossRef] [PubMed]
- Pinchuk, L.; Riss, I.; Batlle, J.F.; Beckers, H.; Stalmans, I. An ab externo minimally invasive aqueous shunt comprised of a novel biomaterial. In Current Developments in Glaucoma Surgery and Migs; Kugler Publications: Amsterdam, The Netherlands, 2020; pp. 181–192. [Google Scholar]
- Chen, T.C.; Wilensky, J.T.; Viana, M.A. Long-term follow-up of initially successful trabeculectomy. Ophthalmology 1997, 104, 1120–1125. [Google Scholar] [CrossRef] [PubMed]
- Edmunds, B.; Thompson, J.R.; Salmon, J.F.; Wormald, R.P. The National Survey of Trabeculectomy. II. Variations in operative technique and outcome. Eye 2001, 15, 441–448. [Google Scholar] [CrossRef] [PubMed]
- Bevin, T.H.; Molteno, A.C.; Herbison, P. Otago Glaucoma Surgery Outcome Study: Long-term results of 841 trabeculectomies. Clin. Exp. Ophthalmol. 2008, 36, 731–737. [Google Scholar] [CrossRef] [PubMed]
- Musch, D.C.; Gillespie, B.W.; Niziol, L.M.; Lichter, P.R.; Varma, R. Intraocular pressure control and long-term visual field loss in the Collaborative Initial Glaucoma Treatment Study. Ophthalmology 2011, 118, 1766–1773. [Google Scholar] [CrossRef] [PubMed]
- Landers, J.; Martin, K.; Sarkies, N.; Bourne, R.; Watson, P. A twenty-year follow-up study of trabeculectomy: Risk factors and outcomes. Ophthalmology 2012, 119, 694–702. [Google Scholar] [CrossRef] [PubMed]
- Kirwan, J.F.; Lockwood, A.J.; Shah, P.; Macleod, A.; Broadway, D.C.; King, A.J.; McNaught, A.I.; Agrawal, P. Trabeculectomy in the 21st century: A multicenter analysis. Ophthalmology 2013, 120, 2532–2539. [Google Scholar] [CrossRef]
- Chua, J.; Kadziauskienė, A.; Wong, D.; Ašoklis, R.; Lesinskas, E.; Quang, N.D.; Chong, R.; Tan, B.; Girard, M.J.A.; Mari, J.M.; et al. One year structural and functional glaucoma progression after trabeculectomy. Sci. Rep. 2020, 10, 2808. [Google Scholar] [CrossRef]
- Demirtaş, A.A.; Karahan, M.; Erdem, S.; Aslan Kaya, A.; Keklikçi, U. Long-term effects of trabeculectomy in primary open-angle glaucoma on segmented macular ganglion cell complex alterations. Int. Ophthalmol. 2021, 41, 2249–2263. [Google Scholar] [CrossRef]
- Mendrinos, E.; Mermoud, A.; Shaarawy, T. Nonpenetrating glaucoma surgery. Surv. Ophthalmol. 2008, 53, 592–630. [Google Scholar] [CrossRef] [PubMed]
- Chiselita, D. Non-penetrating deep sclerectomy versus trabeculectomy in primary open-angle glaucoma surgery. Eye 2001, 15, 197–201. [Google Scholar] [CrossRef] [PubMed]
- Dwivedi, R.; Somerville, T.; Cheeseman, R.; Rogers, C.; Batterbury, M.; Choudhary, A. Deep sclerectomy and trabeculectomy augmented with Mitomycin C: 2-year post-operative outcomes. Graefes Arch. Clin. Exp. Ophthalmol. 2021, 259, 1965–1974. [Google Scholar] [CrossRef] [PubMed]
- Eldaly, M.A.; Bunce, C.; Elsheikha, O.Z.; Wormald, R. Non-penetrating filtration surgery versus trabeculectomy for open-angle glaucoma. Cochrane Database Syst. Rev. 2014, 2014, CD007059. [Google Scholar] [CrossRef]
- El Sayyad, F.; Helal, M.; El-Kholify, H.; Khalil, M.; El-Maghraby, A. Nonpenetrating deep sclerectomy versus trabeculectomy in bilateral primary open-angle glaucoma. Ophthalmology 2000, 107, 1671–1674. [Google Scholar] [CrossRef]
- Shaarawy, T.; Karlen, M.; Schnyder, C.; Achache, F.; Sanchez, E.; Mermoud, A. Five-year results of deep sclerectomy with collagen implant. J. Cataract. Refract. Surg. 2001, 27, 1770–1778. [Google Scholar] [CrossRef]
- Anand, N.; Atherley, C. Deep sclerectomy augmented with mitomycin C. Eye 2005, 19, 442–450. [Google Scholar] [CrossRef]
- Lachkar, Y.; Neverauskiene, J.; Jeanteur-Lunel, M.N.; Gracies, H.; Berkani, M.; Ecoffet, M.; Kopel, J.; Kretz, G.; Lavat, P.; Lehrer, M.; et al. Nonpenetrating deep sclerectomy: A 6-year retrospective study. Eur. J. Ophthalmol. 2004, 14, 26–36. [Google Scholar] [CrossRef]
- Bissig, A.; Rivier, D.; Zaninetti, M.; Shaarawy, T.; Mermoud, A.; Roy, S. Ten years follow-up after deep sclerectomy with collagen implant. J. Glaucoma 2008, 17, 680–686. [Google Scholar] [CrossRef]
- Cillino, S.; Di Pace, F.; Casuccio, A.; Lodato, G. Deep sclerectomy versus punch trabeculectomy: Effect of low-dosage mitomycin C. Ophthalmologica 2005, 219, 281–286. [Google Scholar] [CrossRef]
- Russo, V.; Scott, I.U.; Stella, A.; Balducci, F.; Cosma, A.; Barone, A.; Delle Noci, N. Nonpenetrating deep sclerectomy with reticulated hyaluronic acid implant versus punch trabeculectomy: A prospective clinical trial. Eur. J. Ophthalmol. 2008, 18, 751–757. [Google Scholar] [CrossRef] [PubMed]
- Geevarghese, A.; Wollstein, G.; Ishikawa, H.; Schuman, J.S. Optical Coherence Tomography and Glaucoma. Annu. Rev. Vis. Sci. 2021, 7, 693–726. [Google Scholar] [CrossRef] [PubMed]


| TE | DS | p = * | |
|---|---|---|---|
| Number of eyes, n | 104 | 183 | n.a. |
| Age, years | 63.5 ± 1.6 | 64.9 ± 1.1 | 0.710 |
| Laterality, right/left | 46/58 | 95/88 | 0.126 |
| Gender, female/male | 53/51 | 101/82 | 0.285 |
| Baseline IOP, mmHg | 23.8 ± 1.4 | 23.1 ± 0.4 | 0.889 |
| Number of IOP-lowering medications, n | 3.2 ± 0.2 | 3.3 ± 0.1 | 0.182 |
| Visual acuity, logMAR | 0.30 ± 0.02 | 0.34 ± 0.02 | 0.302 |
| Visual field mean defect, dB | −11.5 ± 0.9 | −10.5 ± 0.9 | 0.377 |
| Mean peripapillary RFNL thickness, μm | 64.4 ± 2.1 | 64.9 ± 1.9 | 0.963 |
| TE | p = * | DS | p = * | p = ** | ||
|---|---|---|---|---|---|---|
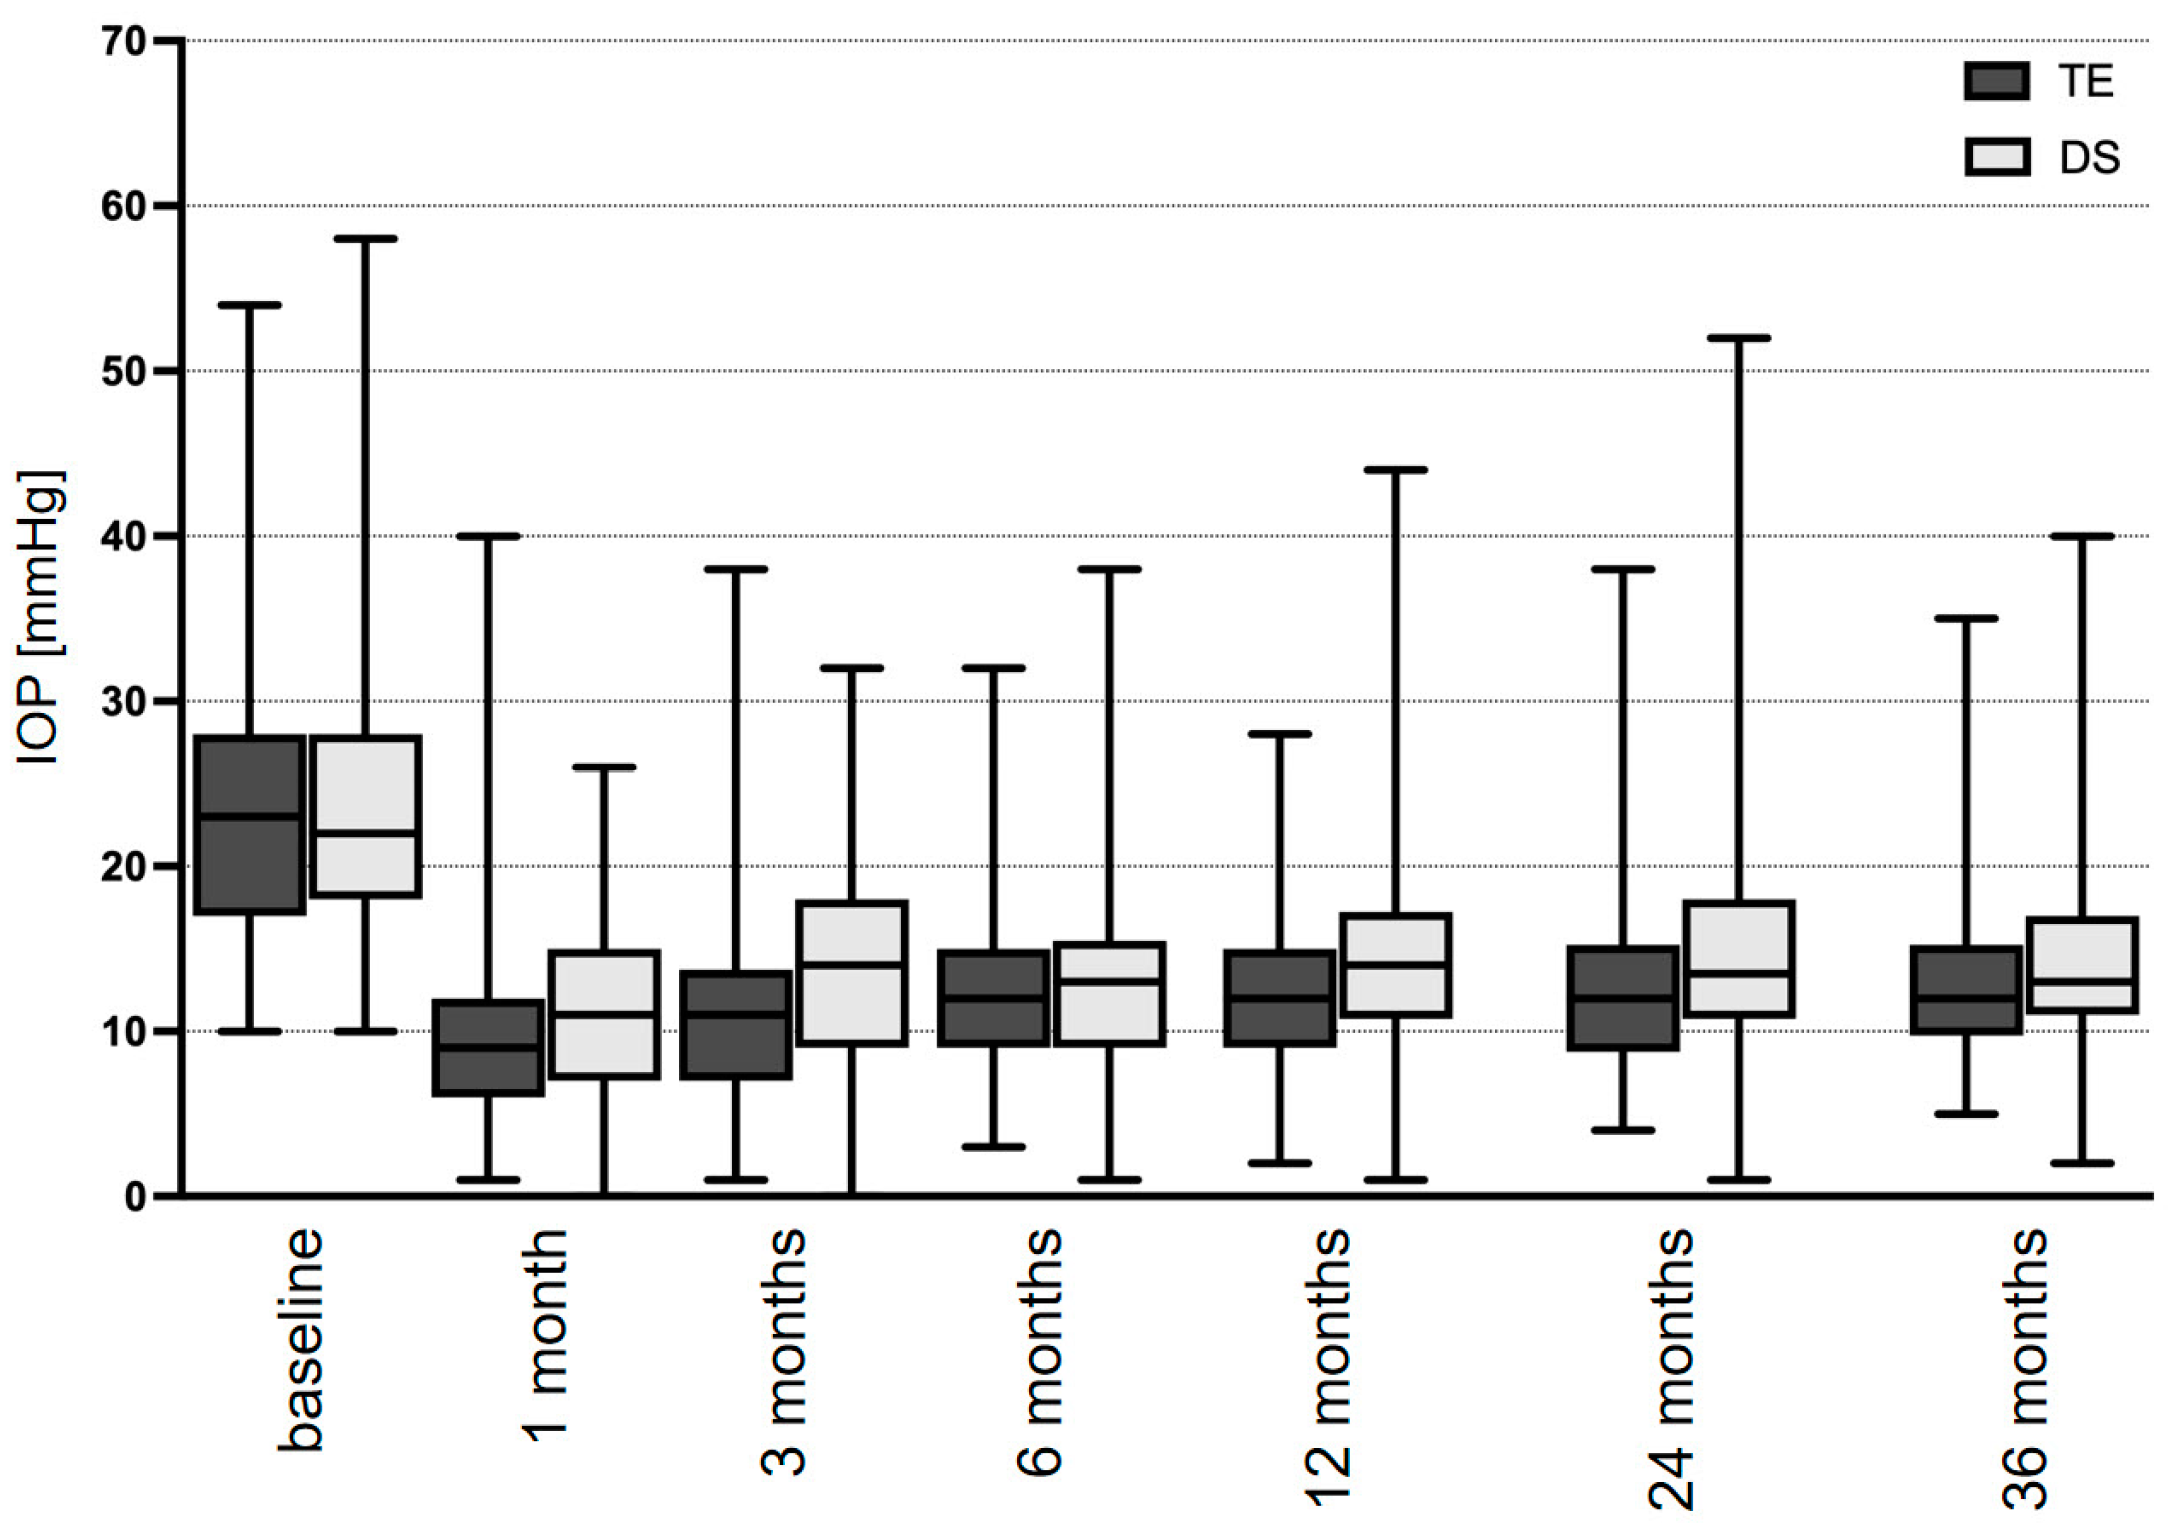
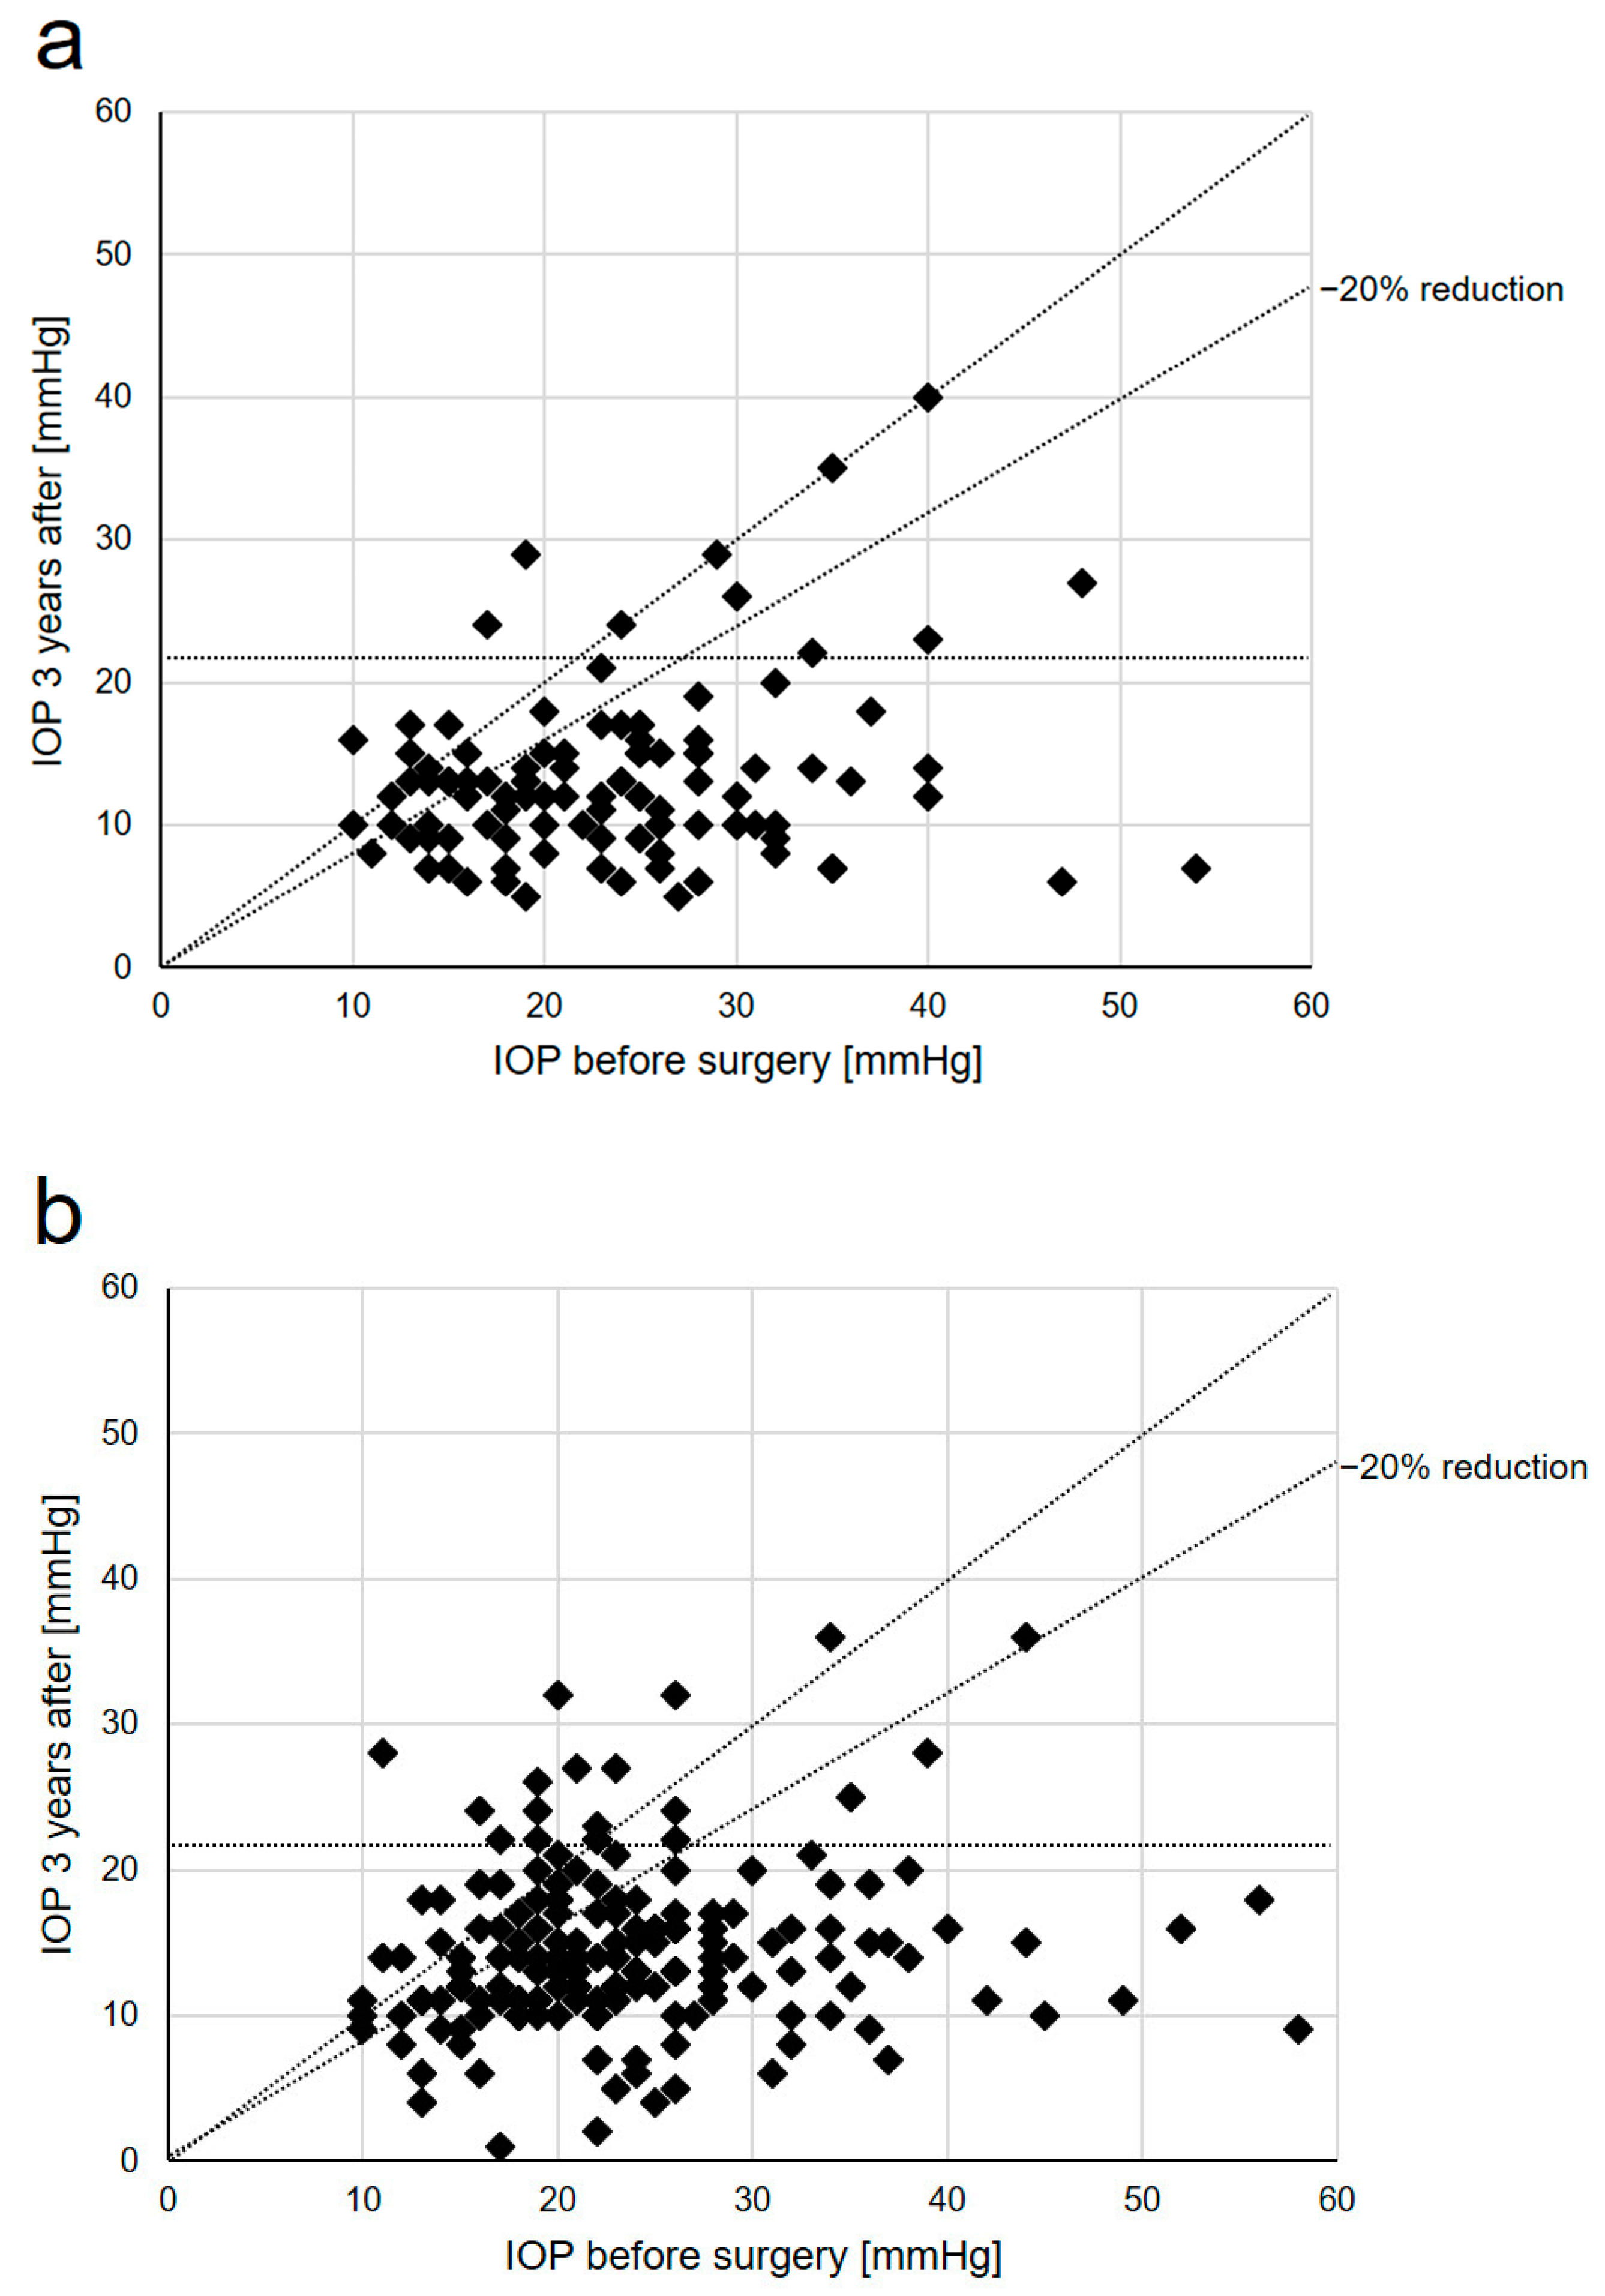
| IOP, mmHg | Baseline | 23.8 ± 1.4 | n.a. | 23.1 ± 0.4 | n.a. | 0.889 |
| 3 months | 10.8 ± 0.4 | <0.001 | 13.7 ± 0.5 | <0.001 | 0.002 | |
| 6 months | 11.9 ± 0.4 | <0.001 | 13.2 ± 0.4 | <0.001 | 0.363 | |
| 12 months | 11.9 ± 1.0 | <0.001 | 14.4 ± 0.5 | <0.001 | 0.009 | |
| 24 months | 12.9 ± 1.2 | <0.001 | 14.6 ± 0.5 | <0.001 | 0.122 | |
| 36 months | 13.4 ± 1.4 | <0.001 | 15.4 ± 0.7 | <0.001 | 0.037 | |
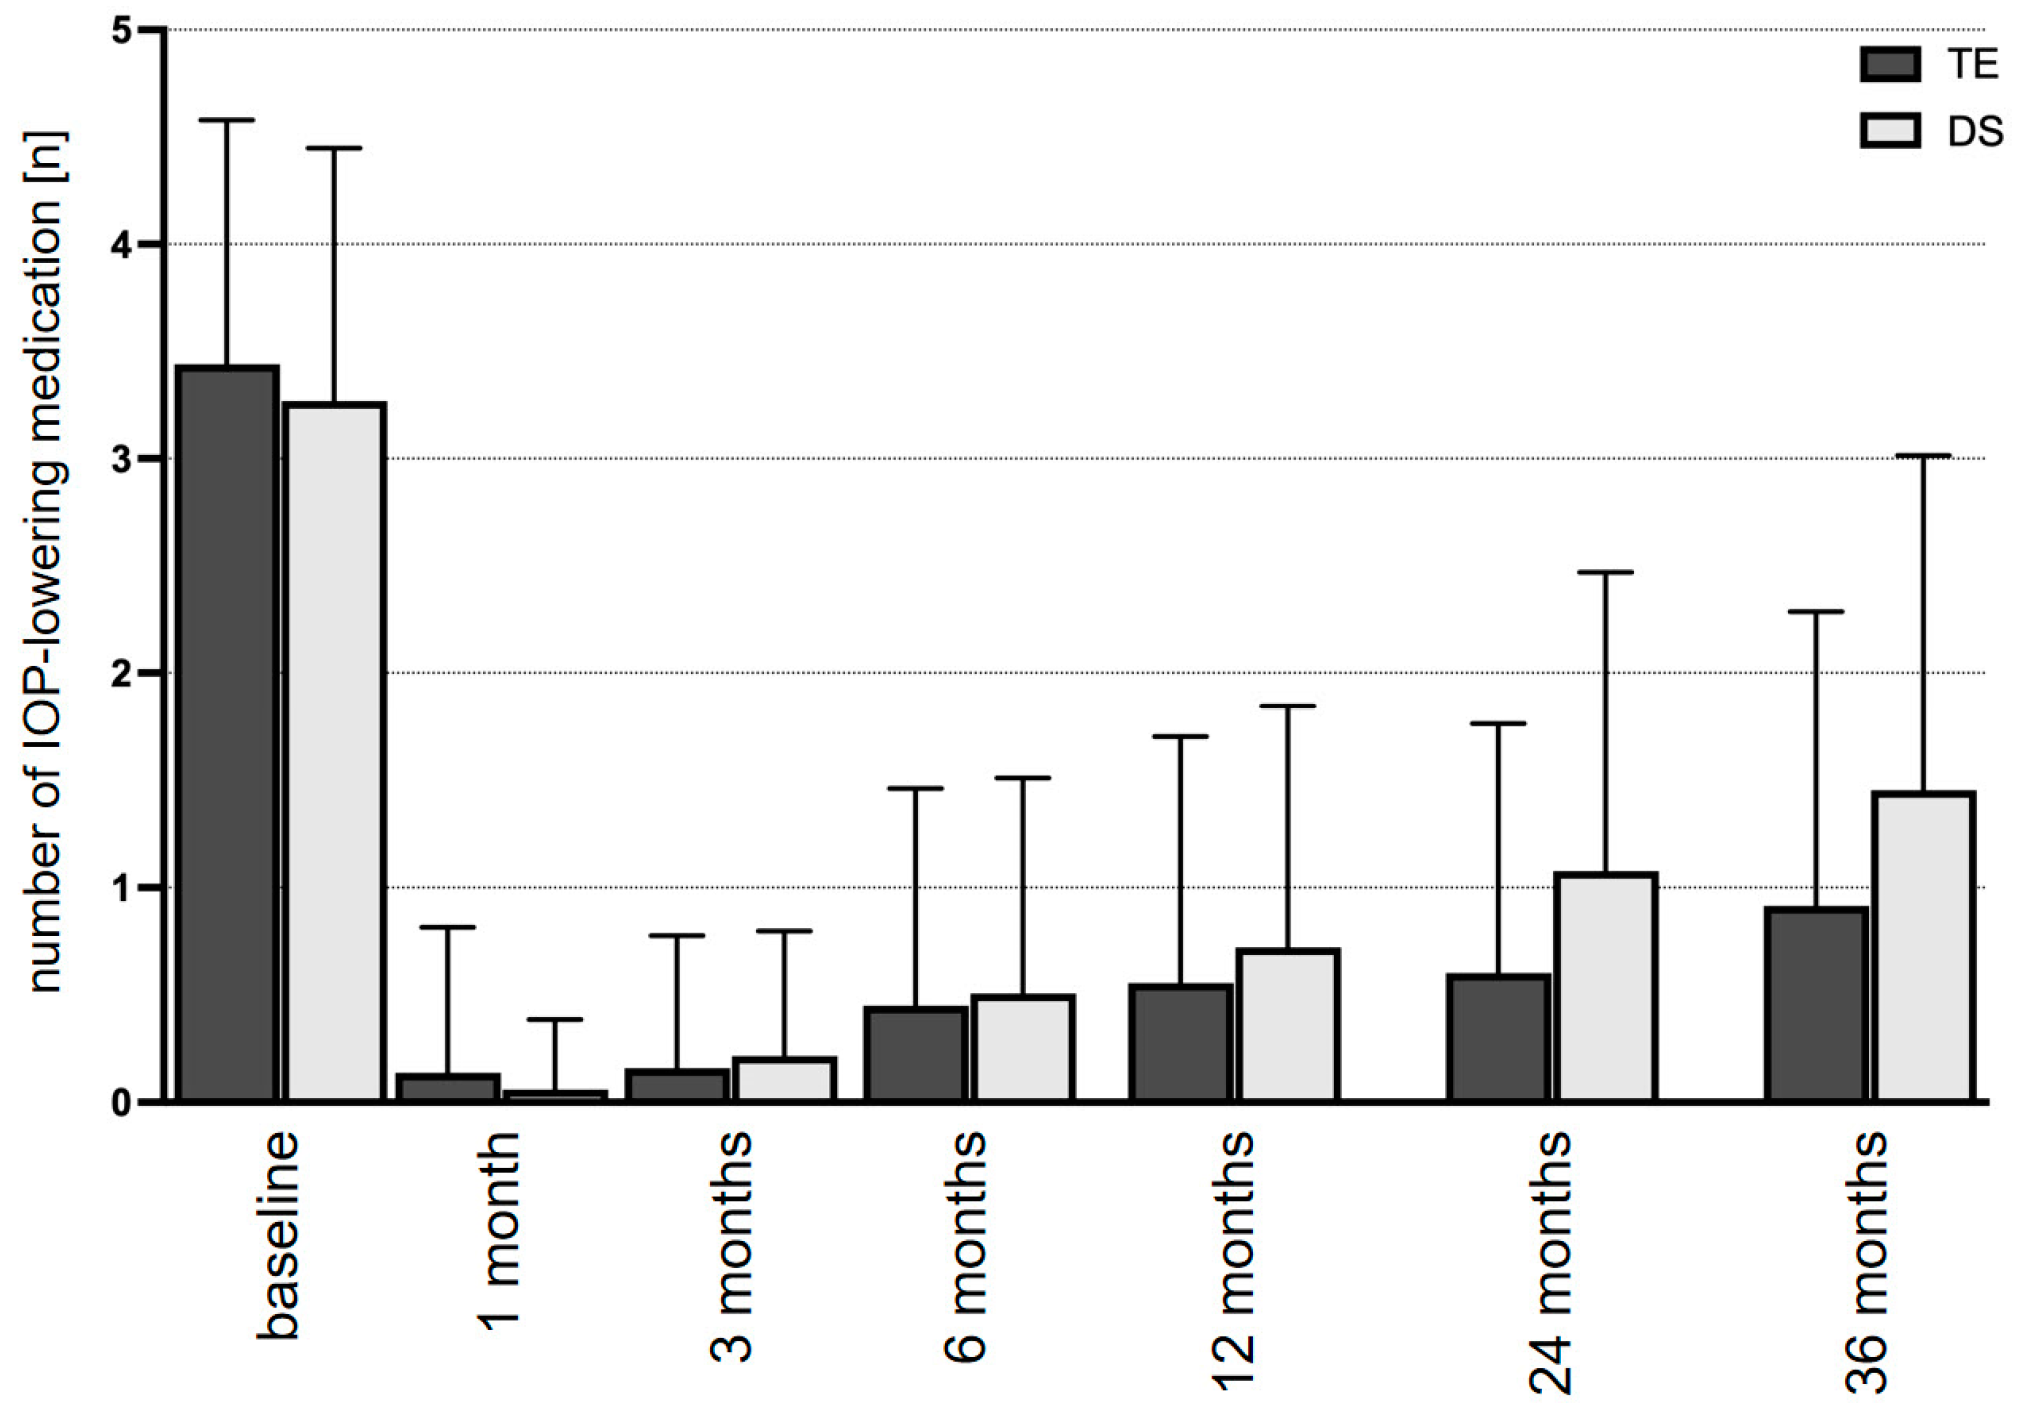
| Medication, n | Baseline | 3.2 ± 0.2 | n.a. | 3.3 ± 0.1 | n.a. | 0.182 |
| 3 months | 0.1 ± 0.1 | <0.001 | 0.6 ± 0.1 | <0.001 | 0.142 | |
| 6 months | 0.4 ± 0.1 | <0.001 | 0.5 ± 0.1 | <0.001 | 0.424 | |
| 12 months | 0.5 ± 0.1 | <0.001 | 0.7 ± 0.1 | <0.001 | 0.158 | |
| 24 months | 0.8 ± 0.1 | <0.001 | 1.1 ± 0.1 | <0.001 | 0.024 | |
| 36 months | 0.9 ± 0.2 | <0.001 | 1.4 ± 0.1 | <0.001 | 0.008 | |
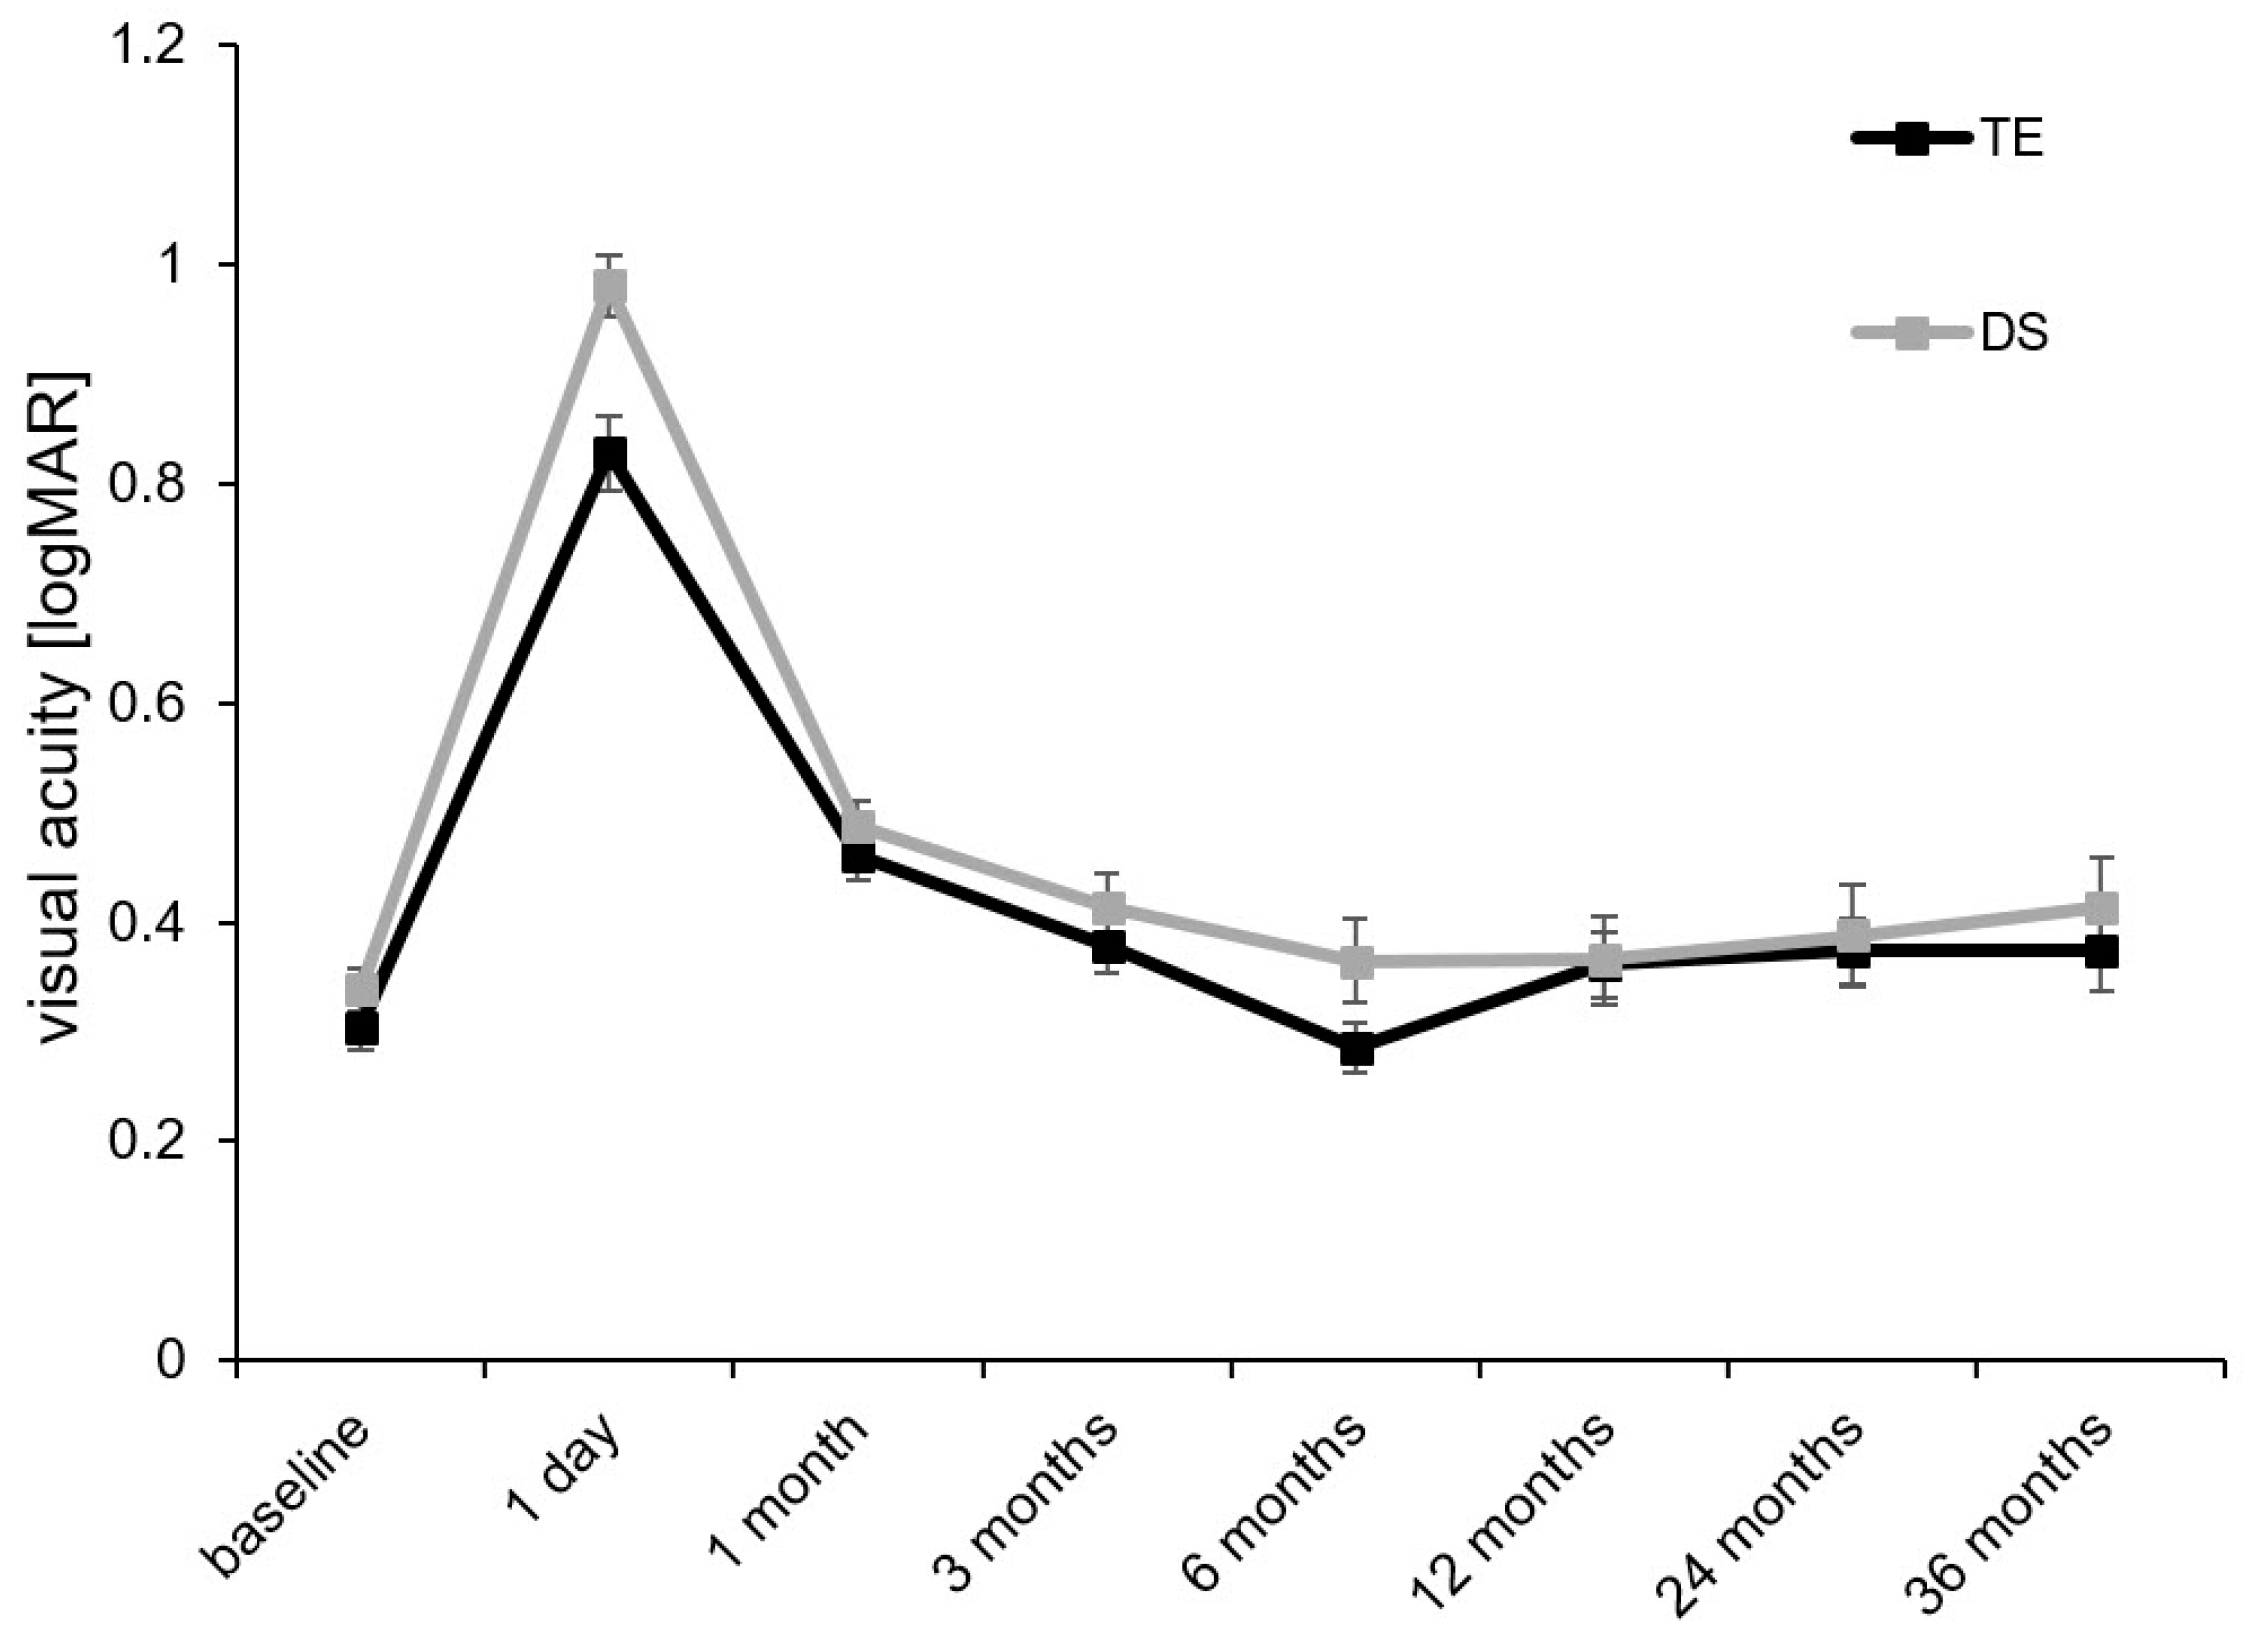
| BCVA, logMAR | Baseline | 0.30 ± 0.02 | n.a. | 0.34 ± 0.02 | n.a. | 0.302 |
| 3 months | 0.38 ± 0.03 | 0.611 | 0.41 ± 0.03 | 0.389 | 0.895 | |
| 6 months | 0.29 ± 0.02 | 0.487 | 0.36 ± 0.04 | 0.708 | 0.705 | |
| 12 months | 0.36 ± 0.03 | 0.250 | 0.37 ± 0.04 | 0.120 | 0.135 | |
| 24 months | 0.37 ± 0.03 | 0.797 | 0.39 ± 0.05 | 0.804 | 0.843 | |
| 36 months | 0.37 ± 0.04 | 0.204 | 0.41 ± 0.05 | 0.653 | 0.234 |
| TE | p = * | DS | p = * | p = ** | ||
|---|---|---|---|---|---|---|
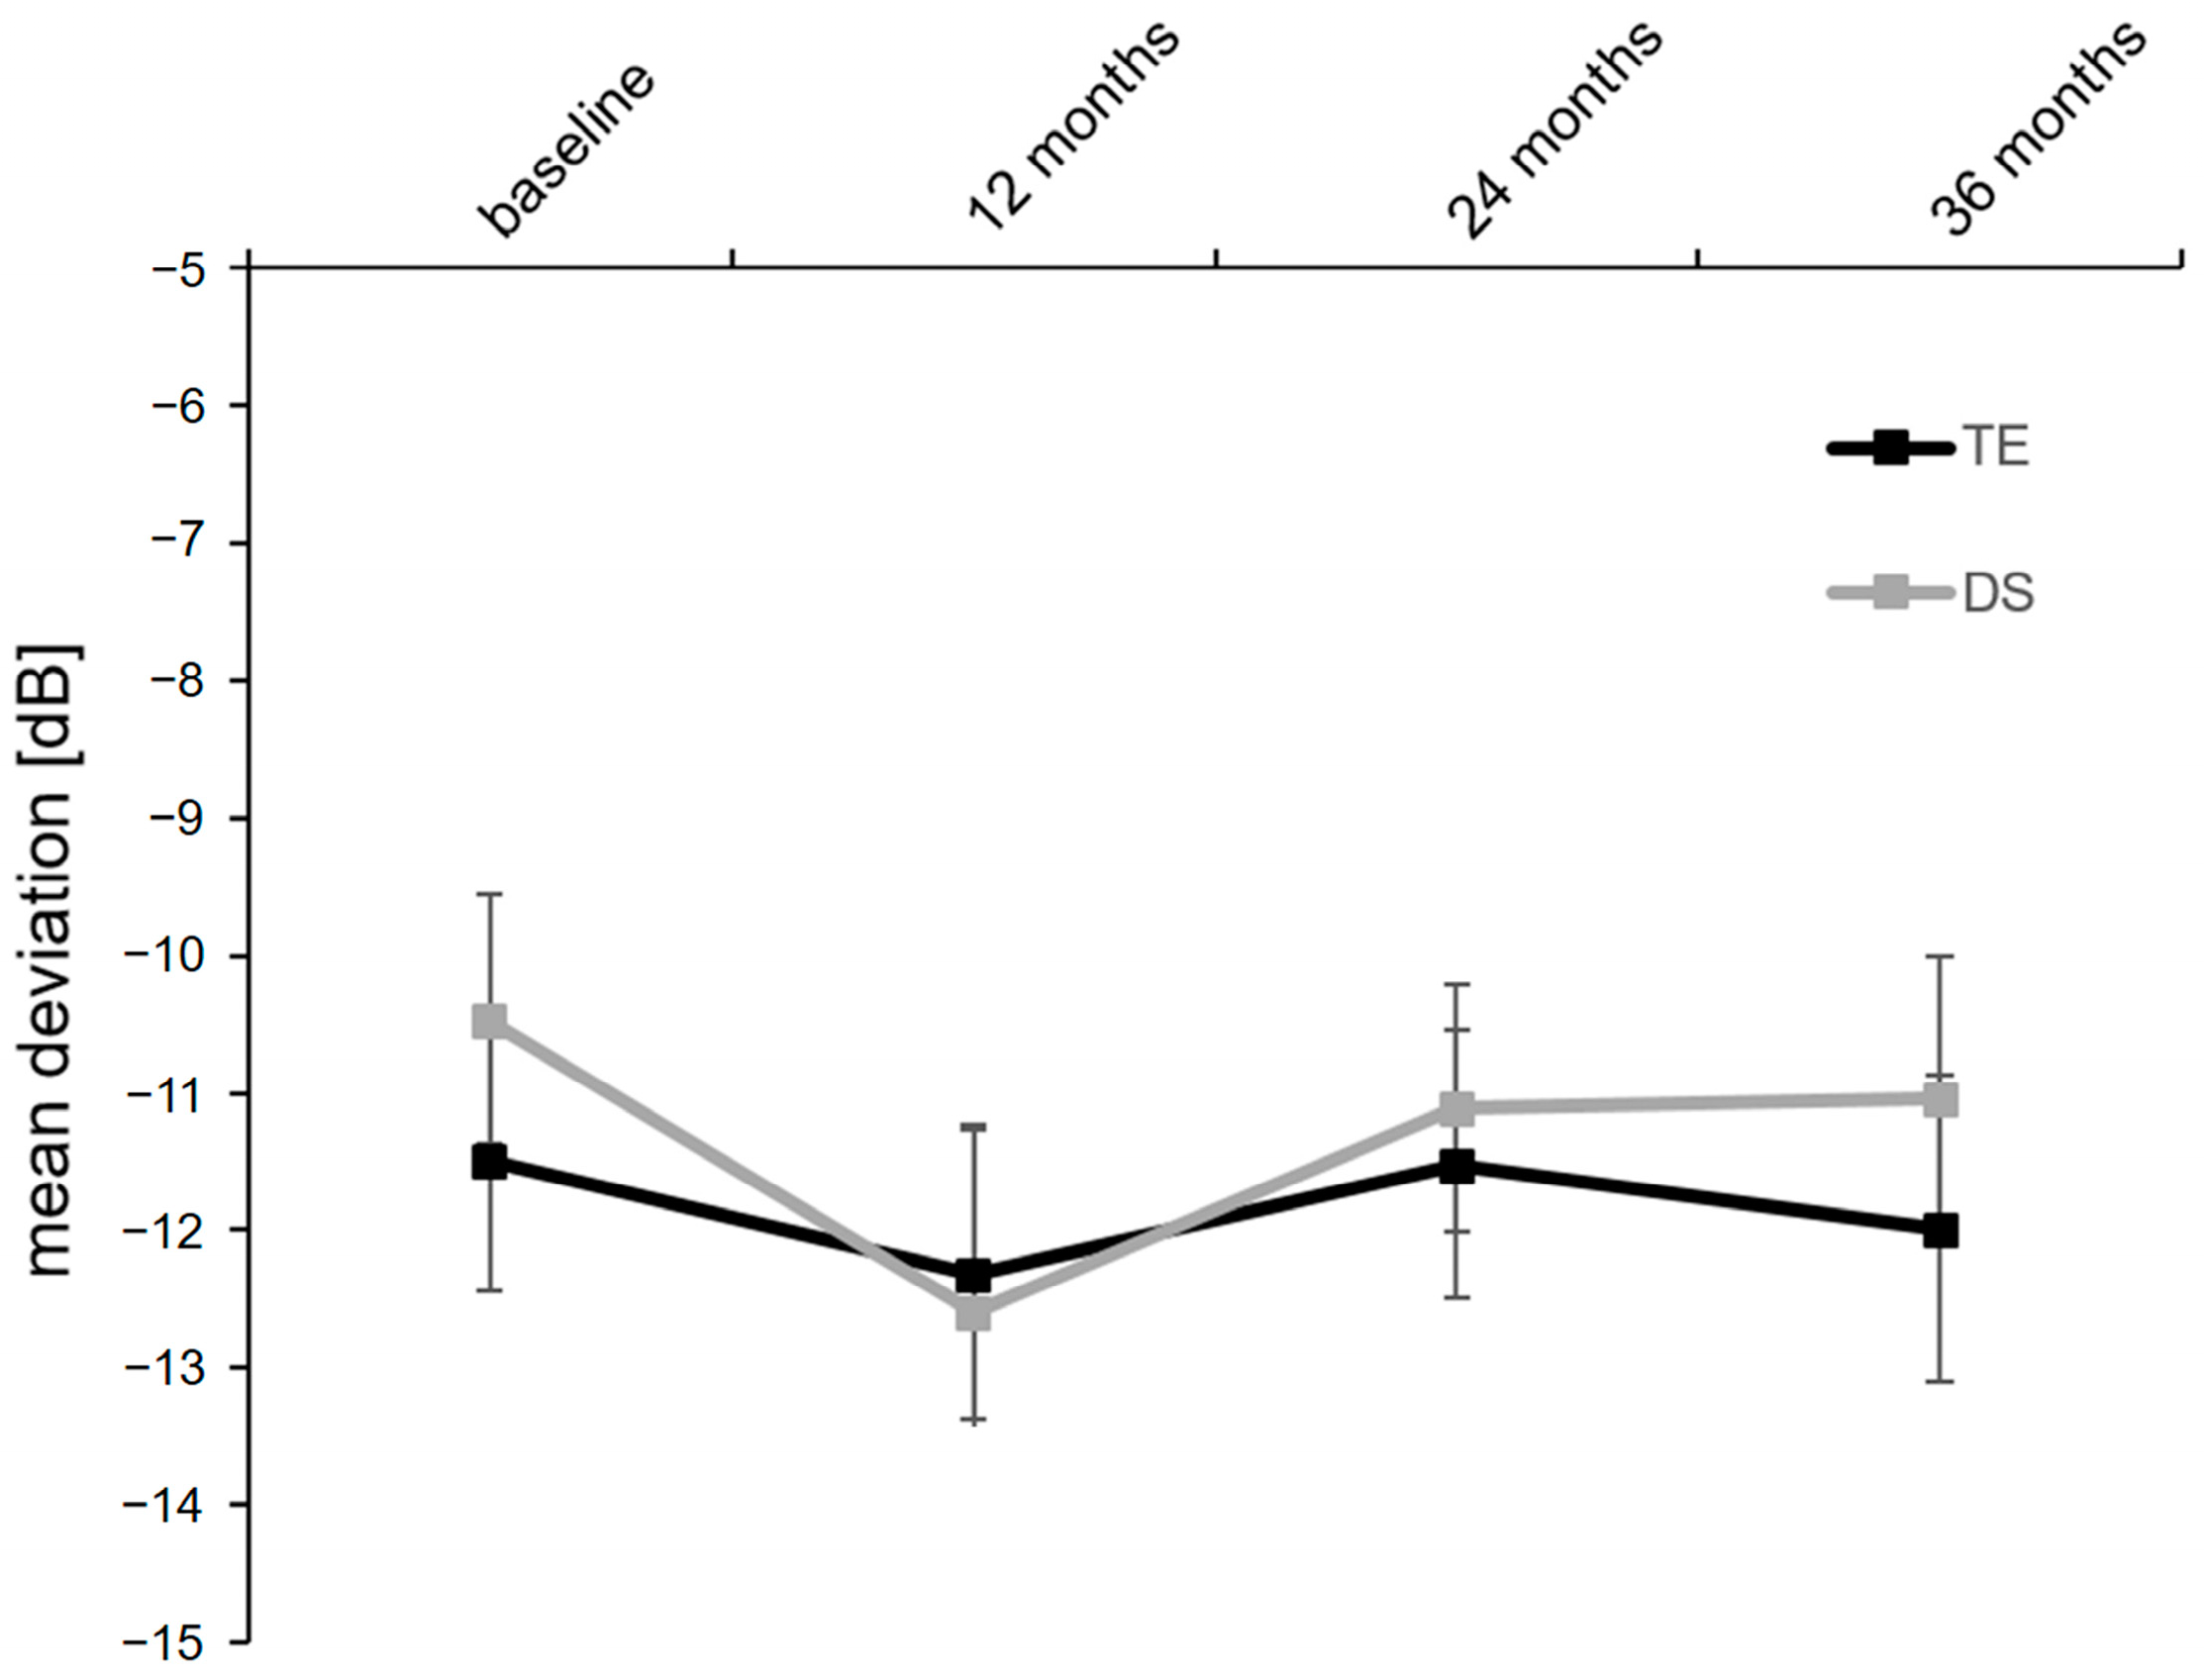
| SAP mean defect, dB | Baseline | −11.5 ± 0.9 | n.a. | −10.5 ± 0.9 | n.a. | 0.377 |
| 3 months | −12.3 ± 1.1 | 0.171 | −12.6 ± 1.4 | 0.068 | 0.884 | |
| 6 months | −11.5 ± 1.0 | 0.255 | −11.1 ± 0.9 | 0.112 | 0.922 | |
| 12 months | −12.0 ± 1.1 | 0.090 | −11.0 ± 1.0 | 0.302 | 0.915 | |
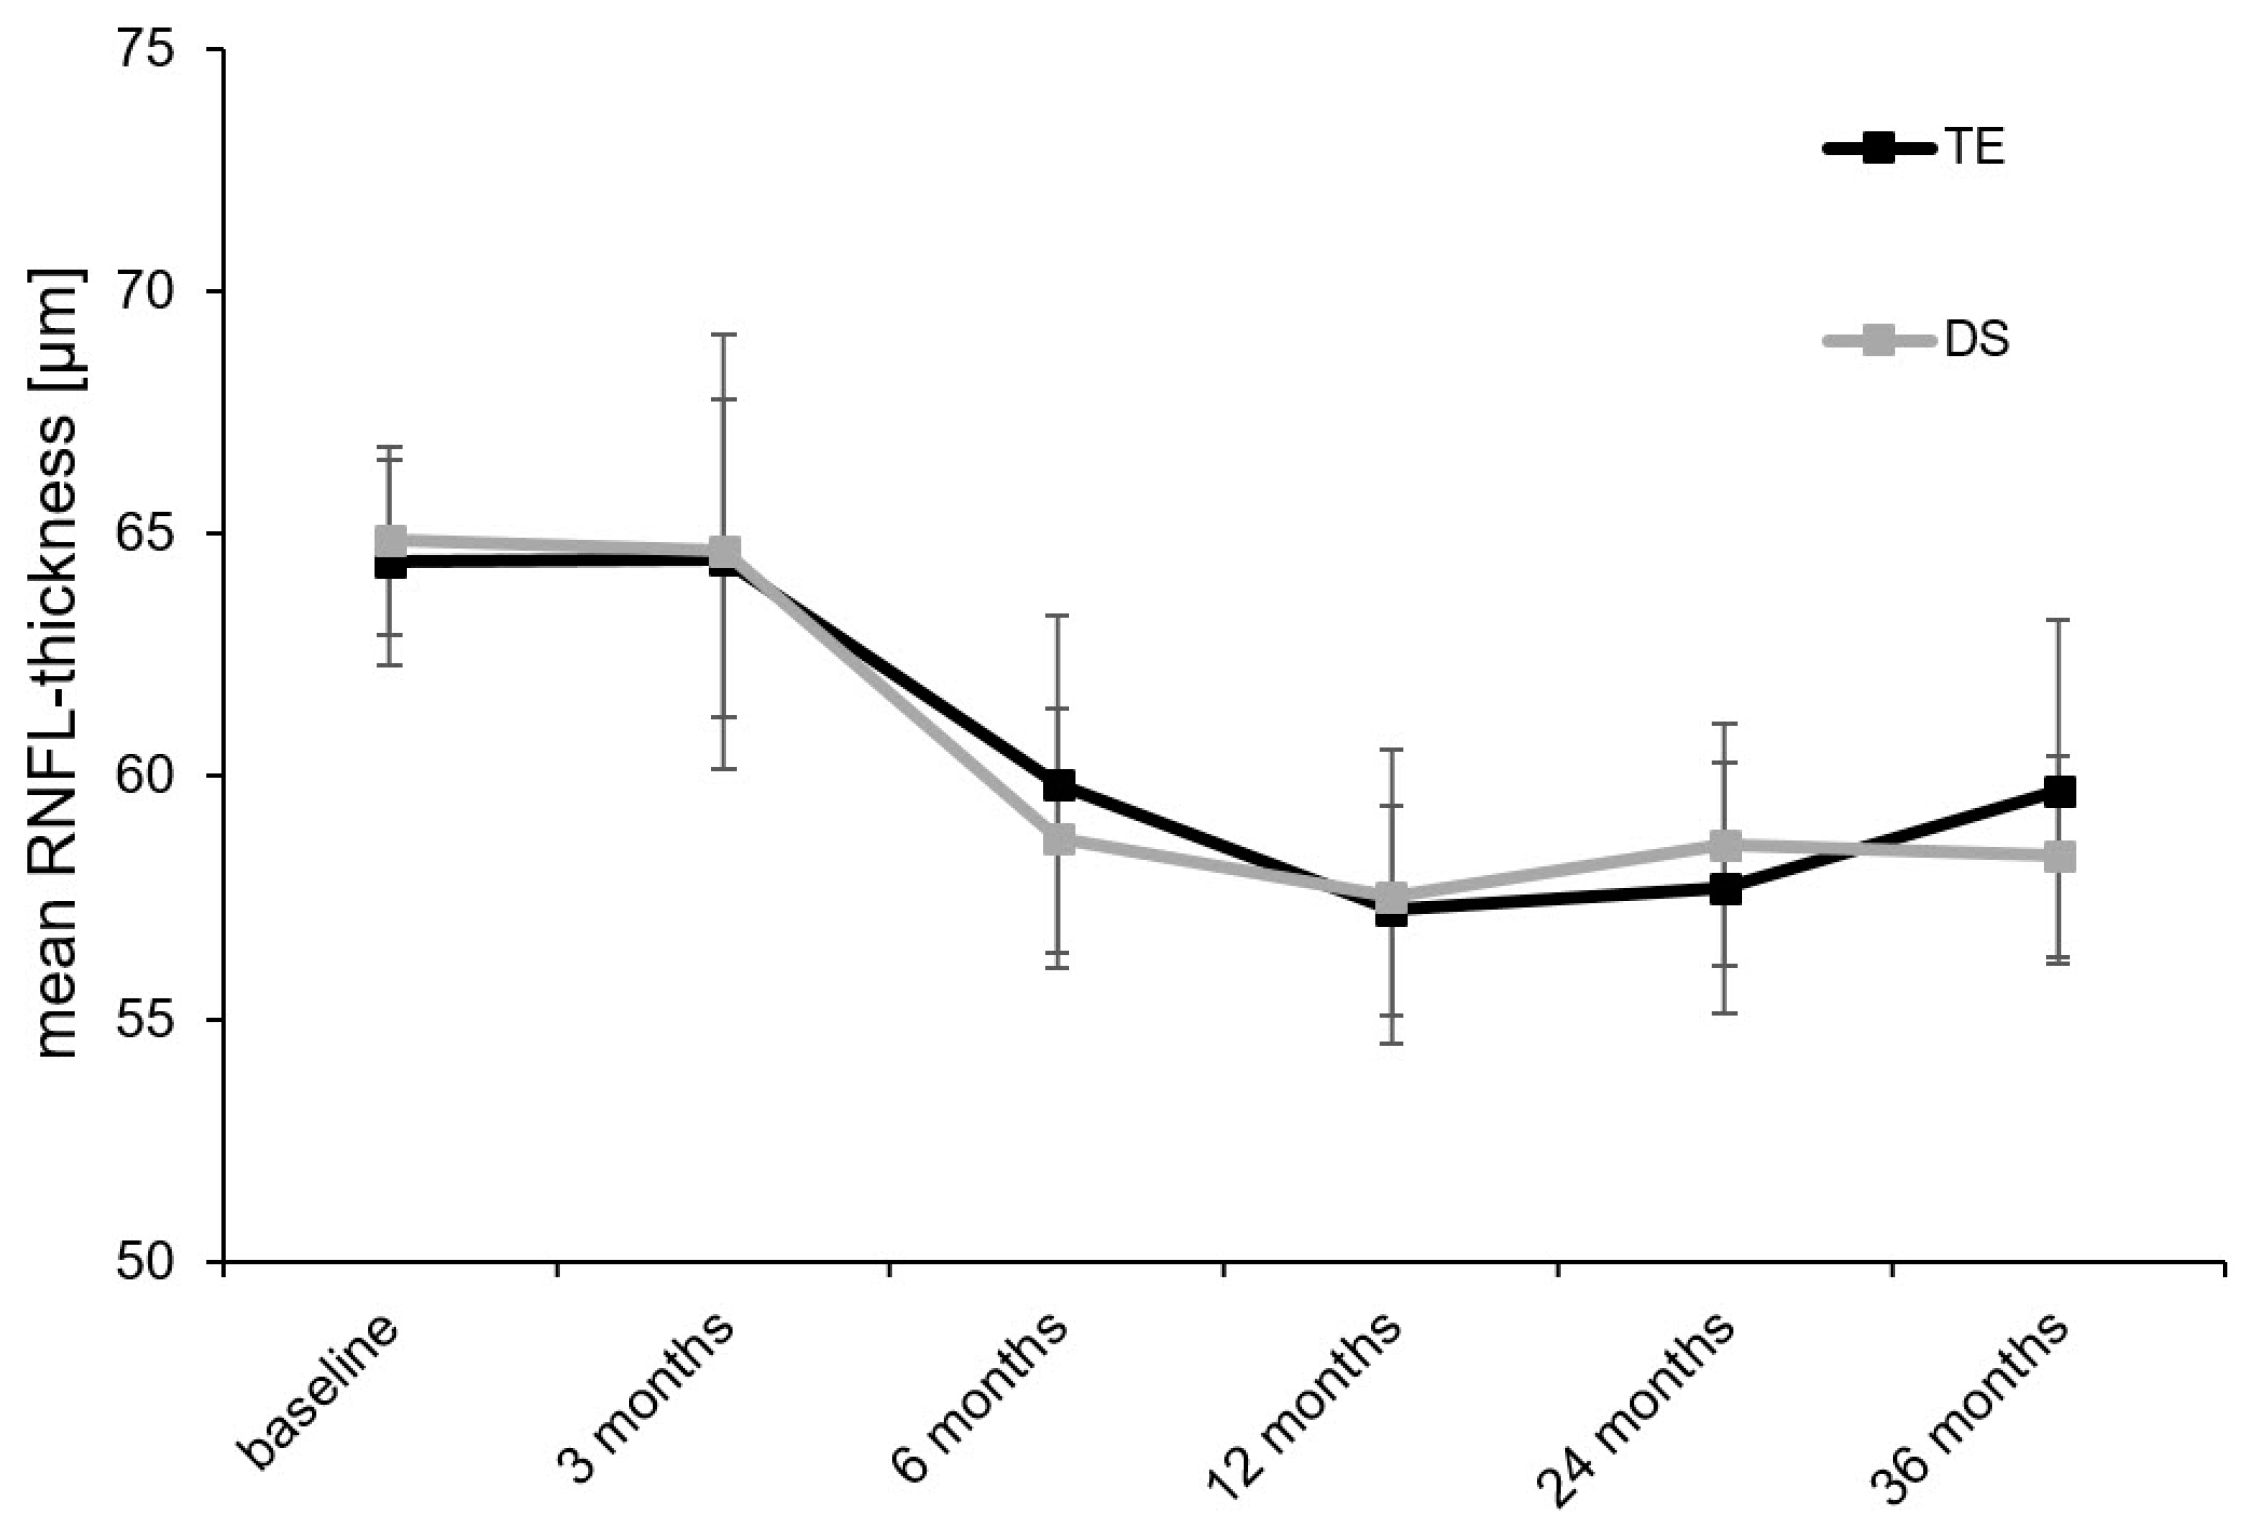
| RNFL thickness, μm | Baseline | 64.4 ± 2.1 | n.a. | 64.9 ± 1.9 | n.a. | 0.963 |
| 3 months | 64.5 ± 3.3 | 0.163 | 64.6 ± 4.3 | 0.637 | 0.819 | |
| 6 months | 59.8 ± 3.5 | 0.003 | 58.7 ± 2.7 | 0.052 | 0.829 | |
| 12 months | 57.2 ± 2.2 | <0.001 | 57.5 ± 3.0 | 0.016 | 0.620 | |
| 24 months | 57.7 ± 2.6 | <0.001 | 58.6 ± 2.5 | 0.005 | 0.408 | |
| 36 months | 59.7 ± 3.5 | <0.001 | 58.4 ± 2.1 | <0.001 | 0.841 |
| TE | DS | p = * | |
|---|---|---|---|
| Hyphema | 4 | 0 | 0.008 |
| Corneal erosion | 6 | 2 | 0.023 |
| Choroidal detachment | 16 | 8 | 0.001 |
| Bleb leakage | 6 | 2 | 0.023 |
| Flat anterior chamber | 5 | 3 | 0.124 |
| Aqueous misdirection syndrome | 2 | 0 | 0.062 |
| Hypotonia maculopathy | 3 | 3 | 0.494 |
| Suture lysis (total) | 18 | 0 | <0.001 |
| Suture lysis (number of eyes) | 15 | 0 | <0.001 |
| Goniopuncture | 0 | 31 | <0.001 |
| 5-FU (total) | 102 | 67 | <0.001 |
| 5-FU (number of eyes) | 32 | 15 | 0.002 |
| Bleb needlings (total) | 14 | 15 | 0.162 |
| Bleb needlings (number of eyes) | 12 | 15 | 0.379 |
| Anterior chamber reformation | 6 | 2 | 0.149 |
| Secondary glaucoma surgery | 14 | 23 | 0.875 |
| TE | DS | p = * | ||
|---|---|---|---|---|
| <21 mmHg | Complete success | 72% | 46% | <0.001 |
| Qualified success | 88% | 75% | 0.009 | |
| <18 mmHg | Complete success | 72% | 45% | <0.001 |
| Qualified success | 86% | 72% | 0.006 | |
| <15 mmHg | Complete success | 70% | 40% | <0.001 |
| Qualified success | 80% | 62% | 0.002 |
Disclaimer/Publisher’s Note: The statements, opinions and data contained in all publications are solely those of the individual author(s) and contributor(s) and not of MDPI and/or the editor(s). MDPI and/or the editor(s) disclaim responsibility for any injury to people or property resulting from any ideas, methods, instructions or products referred to in the content. |
© 2024 by the authors. Licensee MDPI, Basel, Switzerland. This article is an open access article distributed under the terms and conditions of the Creative Commons Attribution (CC BY) license (https://creativecommons.org/licenses/by/4.0/).
Share and Cite
Pfeiffer, V.; Gubser, P.A.; Shang, X.; Lincke, J.-B.; Häner, N.U.; Zinkernagel, M.S.; Unterlauft, J.D. Functional and Morphological Outcomes after Trabeculectomy and Deep Sclerectomy—Results from a Monocentric Registry Study. Diagnostics 2024, 14, 101. https://doi.org/10.3390/diagnostics14010101
Pfeiffer V, Gubser PA, Shang X, Lincke J-B, Häner NU, Zinkernagel MS, Unterlauft JD. Functional and Morphological Outcomes after Trabeculectomy and Deep Sclerectomy—Results from a Monocentric Registry Study. Diagnostics. 2024; 14(1):101. https://doi.org/10.3390/diagnostics14010101
Chicago/Turabian StylePfeiffer, Valentin, Pascal Aurel Gubser, Xiao Shang, Joel-Benjamin Lincke, Nathanael Urs Häner, Martin Sebastian Zinkernagel, and Jan Darius Unterlauft. 2024. "Functional and Morphological Outcomes after Trabeculectomy and Deep Sclerectomy—Results from a Monocentric Registry Study" Diagnostics 14, no. 1: 101. https://doi.org/10.3390/diagnostics14010101
APA StylePfeiffer, V., Gubser, P. A., Shang, X., Lincke, J.-B., Häner, N. U., Zinkernagel, M. S., & Unterlauft, J. D. (2024). Functional and Morphological Outcomes after Trabeculectomy and Deep Sclerectomy—Results from a Monocentric Registry Study. Diagnostics, 14(1), 101. https://doi.org/10.3390/diagnostics14010101