Article

Targeted Genomic Profiling and Chemotherapy Outcomes in Grade 3 Gastro-Entero-Pancreatic Neuroendocrine Tumors (G3 GEP-NET)

1
Department of Medical or Surgical Sciences, University of Bologna, 40126 Bologna, Italy
2
Medical Oncology Department, IRCCS Azienda Ospedaliero-Universitaria Sant’Orsola-Malpighi di Bologna, 40138 Bologna, Italy
3
Medical Oncology, Foundation IRCCS National Cancer Institute, 20133 Milano, Italy
4
Osteoncology and Rare Tumor Center (CDO-TR), IRCCS Istituto Romagnolo per lo Studio dei Tumori (IRST) “Dino Amadori”, 47014 Meldola, Italy
5
Department of Oncology, Università Politecnica delle Marche-AOU delle Marche, 60126 Ancona, Italy
6
Department of Pharmacy and Biotechnology, University of Bologna, 40126 Bologna, Italy
7
Solid Tumor Molecular Pathology Laboratory, IRCCS Azienda Ospedaliero-Universitaria di Bologna, 40138 Bologna, Italy
8
Pathology Unit, IRCCS Azienda-Ospedaliero Universitaria di Bologna, 40138 Bologna, Italy
*
Author to whom correspondence should be addressed.
Diagnostics 2023, 13(9), 1595; https://doi.org/10.3390/diagnostics13091595
Submission received: 3 April 2023 / Revised: 23 April 2023 / Accepted: 28 April 2023 / Published: 29 April 2023

Abstract

:
Background: Grade 3 gastro-entero-pancreatic neuroendocrine tumors (G3 GEP-NET) are poorly characterized in terms of molecular features and response to treatments. Methods: Patients with G3 GEP-NET were included if they received capecitabine and temozolomide (CAPTEM) or oxaliplatin with either 5-fluorouracile (FOLFOX) or capecitabine (XELOX) as first-line treatment (chemotherapy cohort). G3 NET which successfully undergone next-generation sequencing (NGS) were included in the NGS cohort. Results: In total, 49 patients were included in the chemotherapy cohort: 15 received CAPTEM and 34 received FOLFOX/XELOX. Objective response rate (ORR), progression-free survival (PFS), and overall survival (OS) were 42.9%, 9.0 months, and 33.6 months, respectively. Calculating a Ki67 cutoff using ROC curve analysis, tumors with Ki67 ≥ 40% had lower ORR (51.2% vs. 0%; p = 0.007) and shorter PFS (10.6 months vs. 4.4 months; p < 0.001) and OS (49.4 months vs. 10.0 months; p = 0.023). In patients who received FOLFOX/XELOX as a first-line treatment, ORR, PFS, and OS were 38.2%, 7.9 months, and 30.0 months, respectively. In the NGS cohort (N = 13), the most mutated genes were DAXX/ATRX (N = 5, 38%), MEN1 (N = 4, 31%), TP53 (N = 4, 31%), AKT1 (N = 2, 15%), and PIK3CA (N = 1, 8%). Conclusions: FOLFOX/XELOX chemotherapy is active as the first-line treatment of patients with G3 GEP-NET. The mutational landscape of G3 NET is more similar to well-differentiated NETs than NECs.

1. Introduction

Neuroendocrine neoplasms (NENs) are rare tumors whose incidence is, however, rising [1]. NEN is a comprehensive term used to indicate both well-differentiated neuroendocrine tumors (NET), the most common being of gastro-entero-pancreatic (GEP-NET) origin, and poorly differentiated neuroendocrine carcinomas (NECs) [2]. NETs are characterized by well-differentiated neuroendocrine morphology (“organoid” cell arrangement and finely granular cytoplasm), uniform nuclei with “salt and pepper” chromatin, and express neuroendocrine biomarkers such as chromogranin A, synaptophysin, CD56/NCAM, and INSM-1. On the other hand, NECs have poorly differentiated morphology resembling small-cell or large-cell carcinomas, with sheet-like architecture, abundant necrosis, irregular nuclei, and less cytoplasmic granularity, which is reflected by decreased proportion and intensity of neuroendocrine biomarkers staining. Before 2017, the classification of a NEN in the NET or NEC group was primarily based on the proliferation index as assessed by Ki67: NET included grade 1 (G1) tumors with Ki67 < 3% and G2 tumors with Ki67 between 3 and 20%, whereas all NEN with Ki67 > 20% were G3 and classified as NEC.
NET and NEC have profoundly different clinical behavior and treatment susceptibility. Indeed, capecitabine and temozolomide (CAPTEM) or oxaliplatin and either 5-fluorouracil (FOLFOX) or capecitabine (XELOX) are the most frequently used chemotherapy in the treatment of NET, although only in select cases or after the failure of other treatments [3], whereas chemotherapy with platinum and etoposide is the standard treatment for NEC [4]. Nevertheless, the NORDIC NEC study demonstrated that response to platinum-based chemotherapy was different among NECs of GEP origin, depending on Ki67: those tumors with a Ki67 < 55% had lower response rate but longer survival outcomes than tumors with a Ki67 ≥ 55% [5]. Since 2017 for pancreatic NEN and 2019 for NEN of other sites, the G3 NET subgroup has been introduced by World Health Organization (WHO) classification, which indicates NEN with a well-differentiated morphology (NET) but with a Ki67 > 20%, which is, however, usually at <50–70% [2].
To date, this newly defined G3 NET category has been poorly characterized in terms of clinicopathological and genomic features and response to treatment. We sought to characterize the outcomes of patients with G3 GEP-NET to first-line chemotherapy and to describe their mutational landscape.

2. Materials and Methods

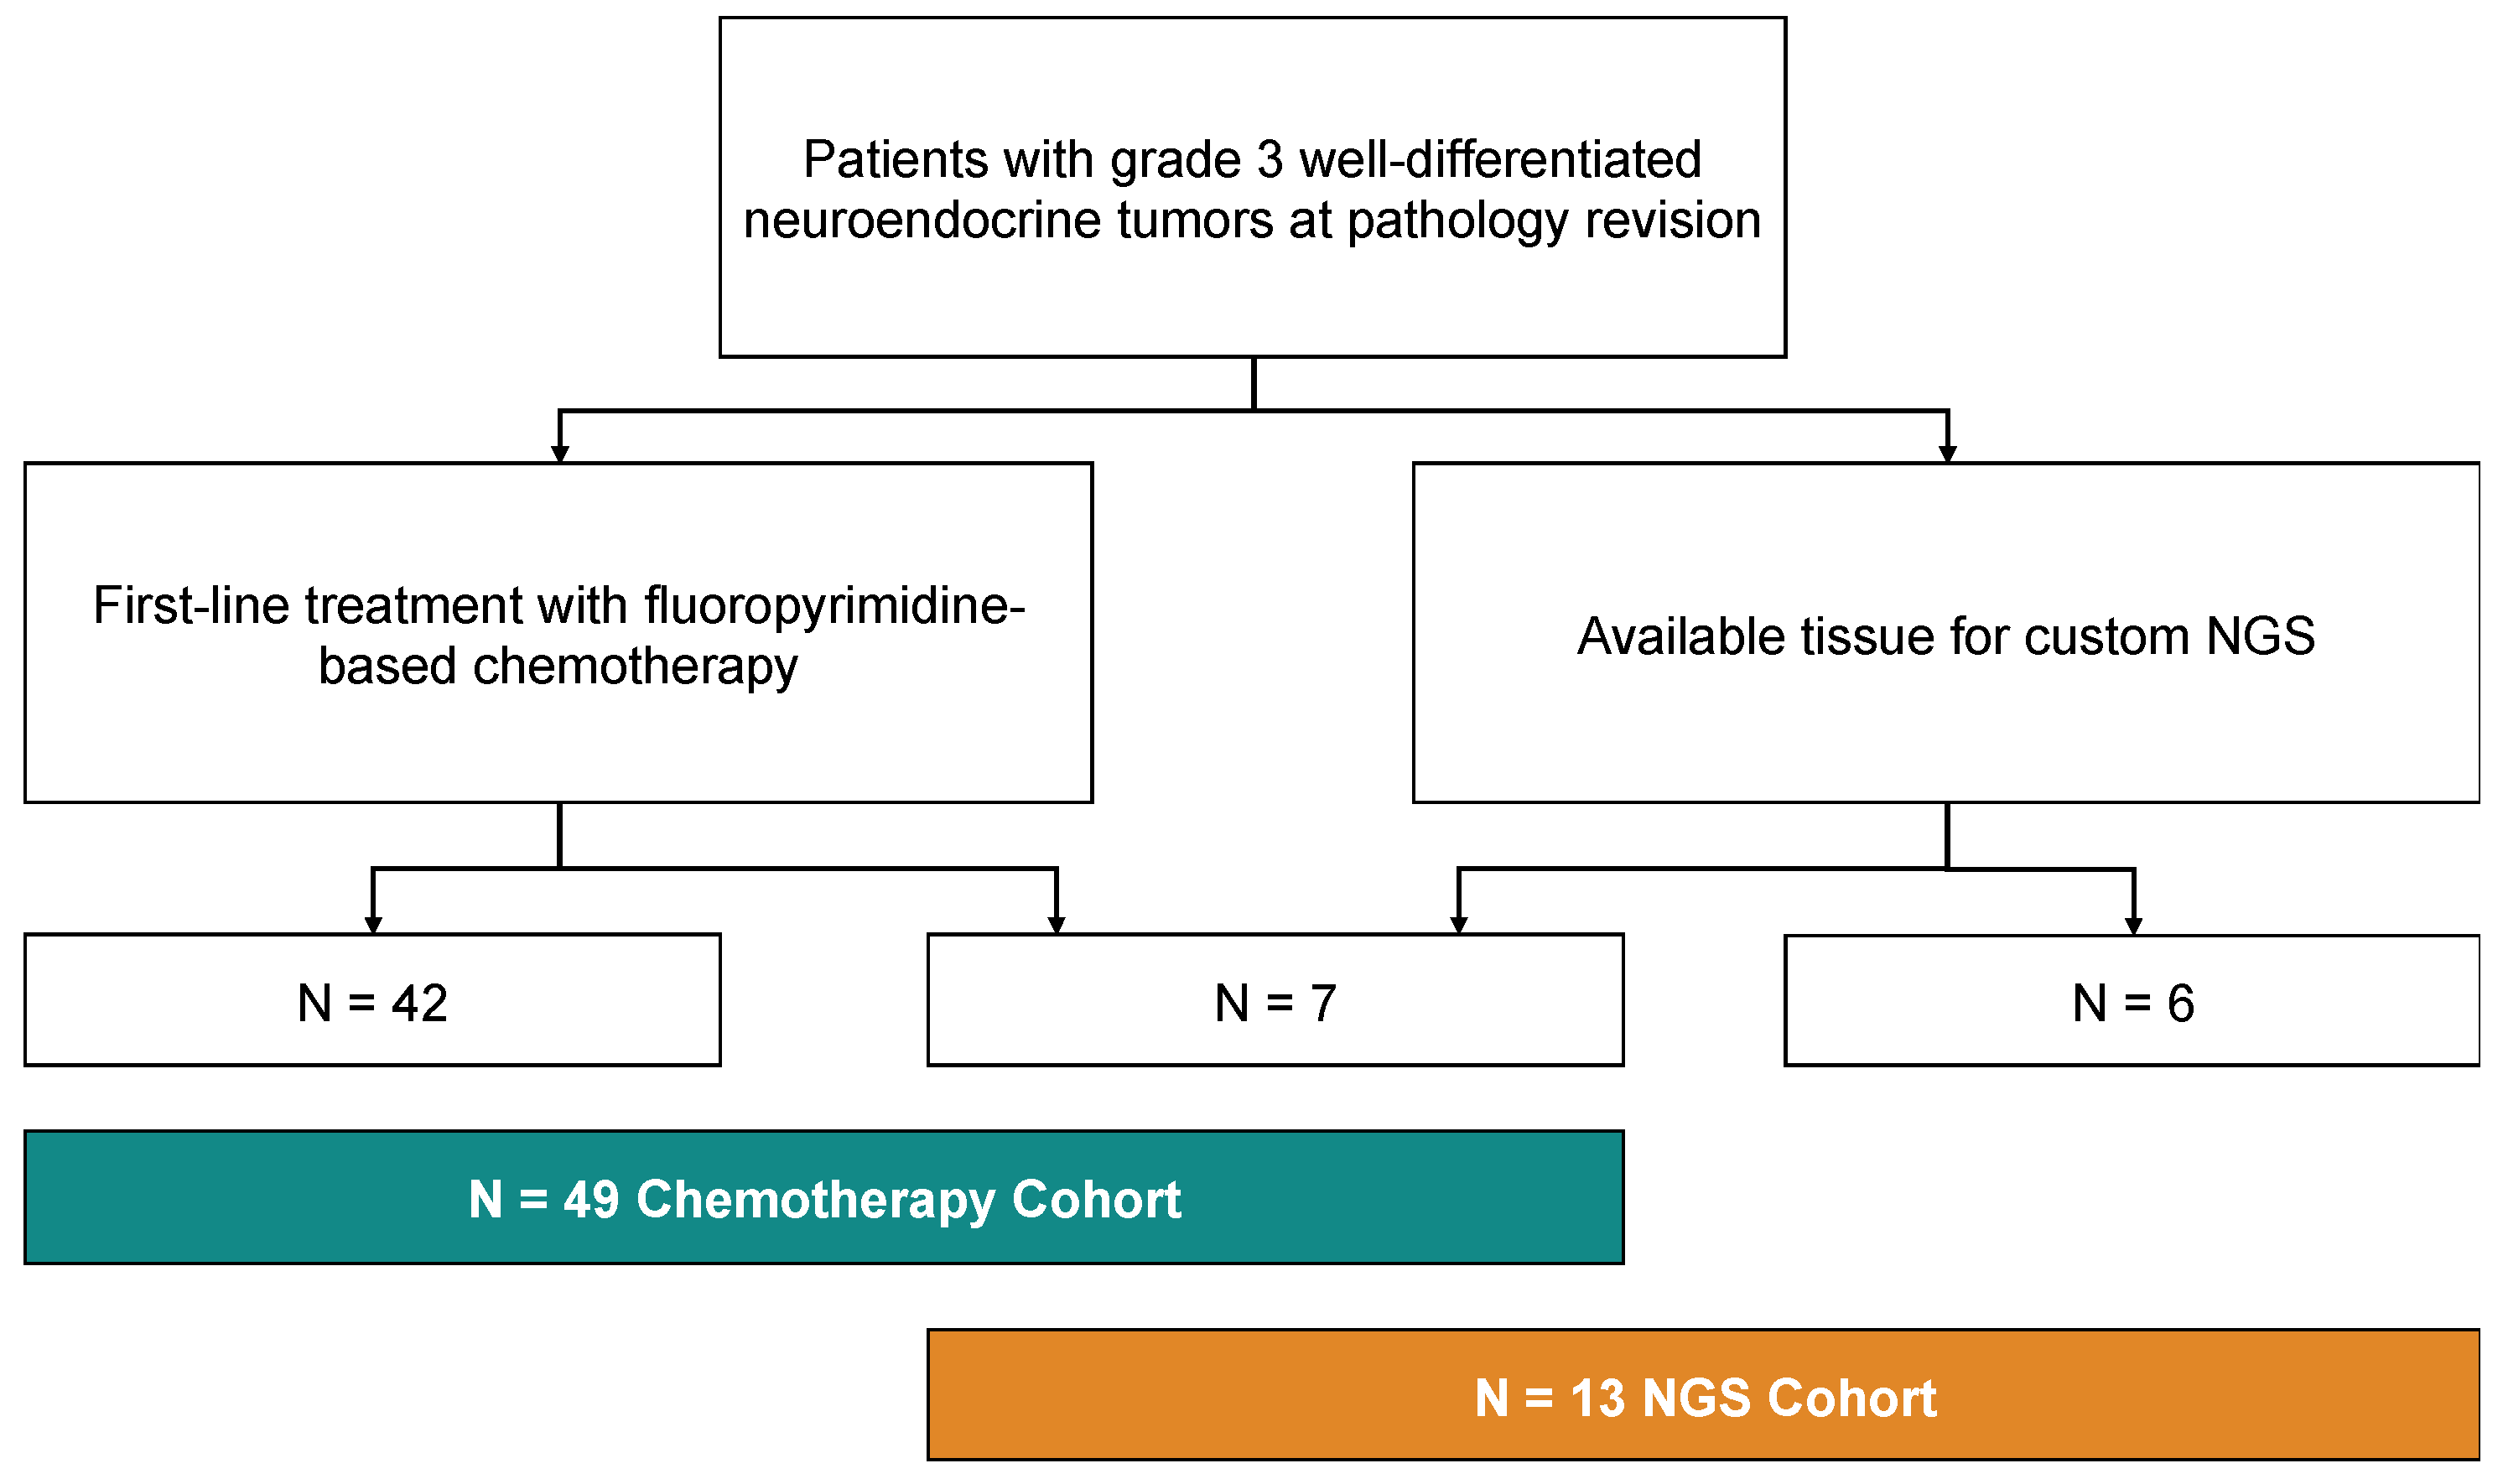
2.1. Patient Selection

Consecutive patients with histologically proven G3 NET have been included in the study if they have received chemotherapy with either FOLFOX (oxaliplatin and 5-fluorouracile), XELOX (oxaliplatin and capecitabine), or CAPTEM (capecitabine and temozolomide) as first-line treatment of a locally advanced or metastatic GEP-NET (chemotherapy cohort), or if their tumor had successfully undergone targeted next-generation sequencing (NGS cohort).
G3 NETs were defined as NET with well-differentiated morphology and proliferation index ≥ 20% as assessed by Ki67 (Mib-1 clone) or ≥20 mitosis per 10 high-powered fields, according to WHO 2019 classification after revision by a NEN-dedicated pathologist. NECs with poorly differentiated morphology (either small cell or large cell) and NET with Ki67 ≤ 20% were excluded.
In the chemotherapy cohort, clinicopathological features have been correlated with chemotherapy outcomes, namely objective response rate (ORR), progression-free survival (PFS), and overall survival (OS). Response to treatment was assessed according to RECIST v1.1 criteria [6].
This study was approved by local IRB (Comitato Etico Indipendente, IRCCS Policlinico Sant’Orsola-Malpighi of Bologna, protocol code: SOCRATE, 787/2019/Oss/AOUBo) and was conducted in accordance with the principles of the Declaration of Helsinki (revision of Edinburgh, 2000).

2.2. Next-Generation Sequencing

The next-generation sequencing (NGS) analysis has been performed using two lab-developed panels of genes developed in the Molecular Pathology Laboratory of Sant’Orsola-Malpighi Hospital. These two panels allow the analysis of the entire coding regions (CDS) or hot-spot regions of 21 genes, for a total of 937 amplicons (about 82.04 kb), starting from archived formalin-fixed and paraffin-embedded (FFPE) tissues. The entire CDS of ATRX, DAXX, EP300, MEN1, EIF1AX, NOTCH1, NOTCH2, NOTCH3, NOTCH4, PIK3CA, RB1, TP53, STK11, KEAP1, and NFE2L2, or the hot-spot regions of AKT1, mTOR, KRAS, NRAS, HRAS, and BRAF have been analyzed. NGS was performed using the Gene Studio S5 sequencer (ThermoFisher Scientific Inc., Waltham, MA, USA). Briefly, about 30 ng of DNA have been used per each panel for the amplicon library preparation, performed with the AmpliSeq Plus Library Kit 2.0. Templates were prepared with Chef Machine Template and then sequenced using an Ion 530 chip, and sequences were analyzed with IonReporter 5.16 (ThermoFisher Scientific) and IGV (Integrative Genomic Viewer) tool. Mutation pathogenicity has been assessed by Varsome (for the ACMG Classification, https://varsome.com/ [accessed on 31/12/2022]), OncoKB [7], and ClinVar [8] database annotations [9]. Mutations annotated as pathogenic in either ACMG Classification, OncoKB, or ClinVar, or as probably damaging by PolyPhen-2 (score ≥ 0.95) were included in the study. Included mutations and key clinicopathological features have been displayed in an OncoPrint plot.

2.3. Statistical Analysis

Categorical variables were reported as absolute numbers and proportions and compared by Fisher’s test or Chi-squared test, as appropriate. Continuous variables were reported as median and range and compared by Mann-Whitney test. ORR was defined as the proportion of complete responses (CR) and partial responses (PR) out of the total evaluable cases by RECIST v1.1 [6], whereas the disease control rate (DCR) was defined as the proportion of CR, PR, and stable disease (SD) out of the total evaluable cases by RECIST v1.1. PFS was defined as the time from treatment start to RECIST-defined disease progression (PD) or death from any cause, whichever occurred first, whereas OS was defined as the time from treatment start to death from any cause. Survival times were estimated using the Kaplan–Meier method, reported in months, and 95% confidence interval (CI) estimated with the Greenwood formula, and compared by the log-rank method. Risk factors were analyzed by univariate and multivariate analysis using the Cox proportional-hazards method and expressed as hazard ratios (HR) [95% CI]. The multivariate model was fitted including all variables with p-value < 0.1 significance in the univariate analysis. The area under the receiver-operating-characteristic (ROC) curve was evaluated to estimate the best Ki67 cut-off to predict response. The best cut-off value was estimated by using Youden’s statistics [10]. The p-values were considered significant when <0.05. The statistical analysis was carried out using R Statistical package version 4.2.2 software.

3. Results

Overall, 52 patients have been included in the study, of which N = 49 received either CAPTEM or FOLFOX/XELOX as first-line treatment for their G3 NET (“Chemotherapy cohort”) and N = 13 had available tissue to perform NGS (Figure 1).

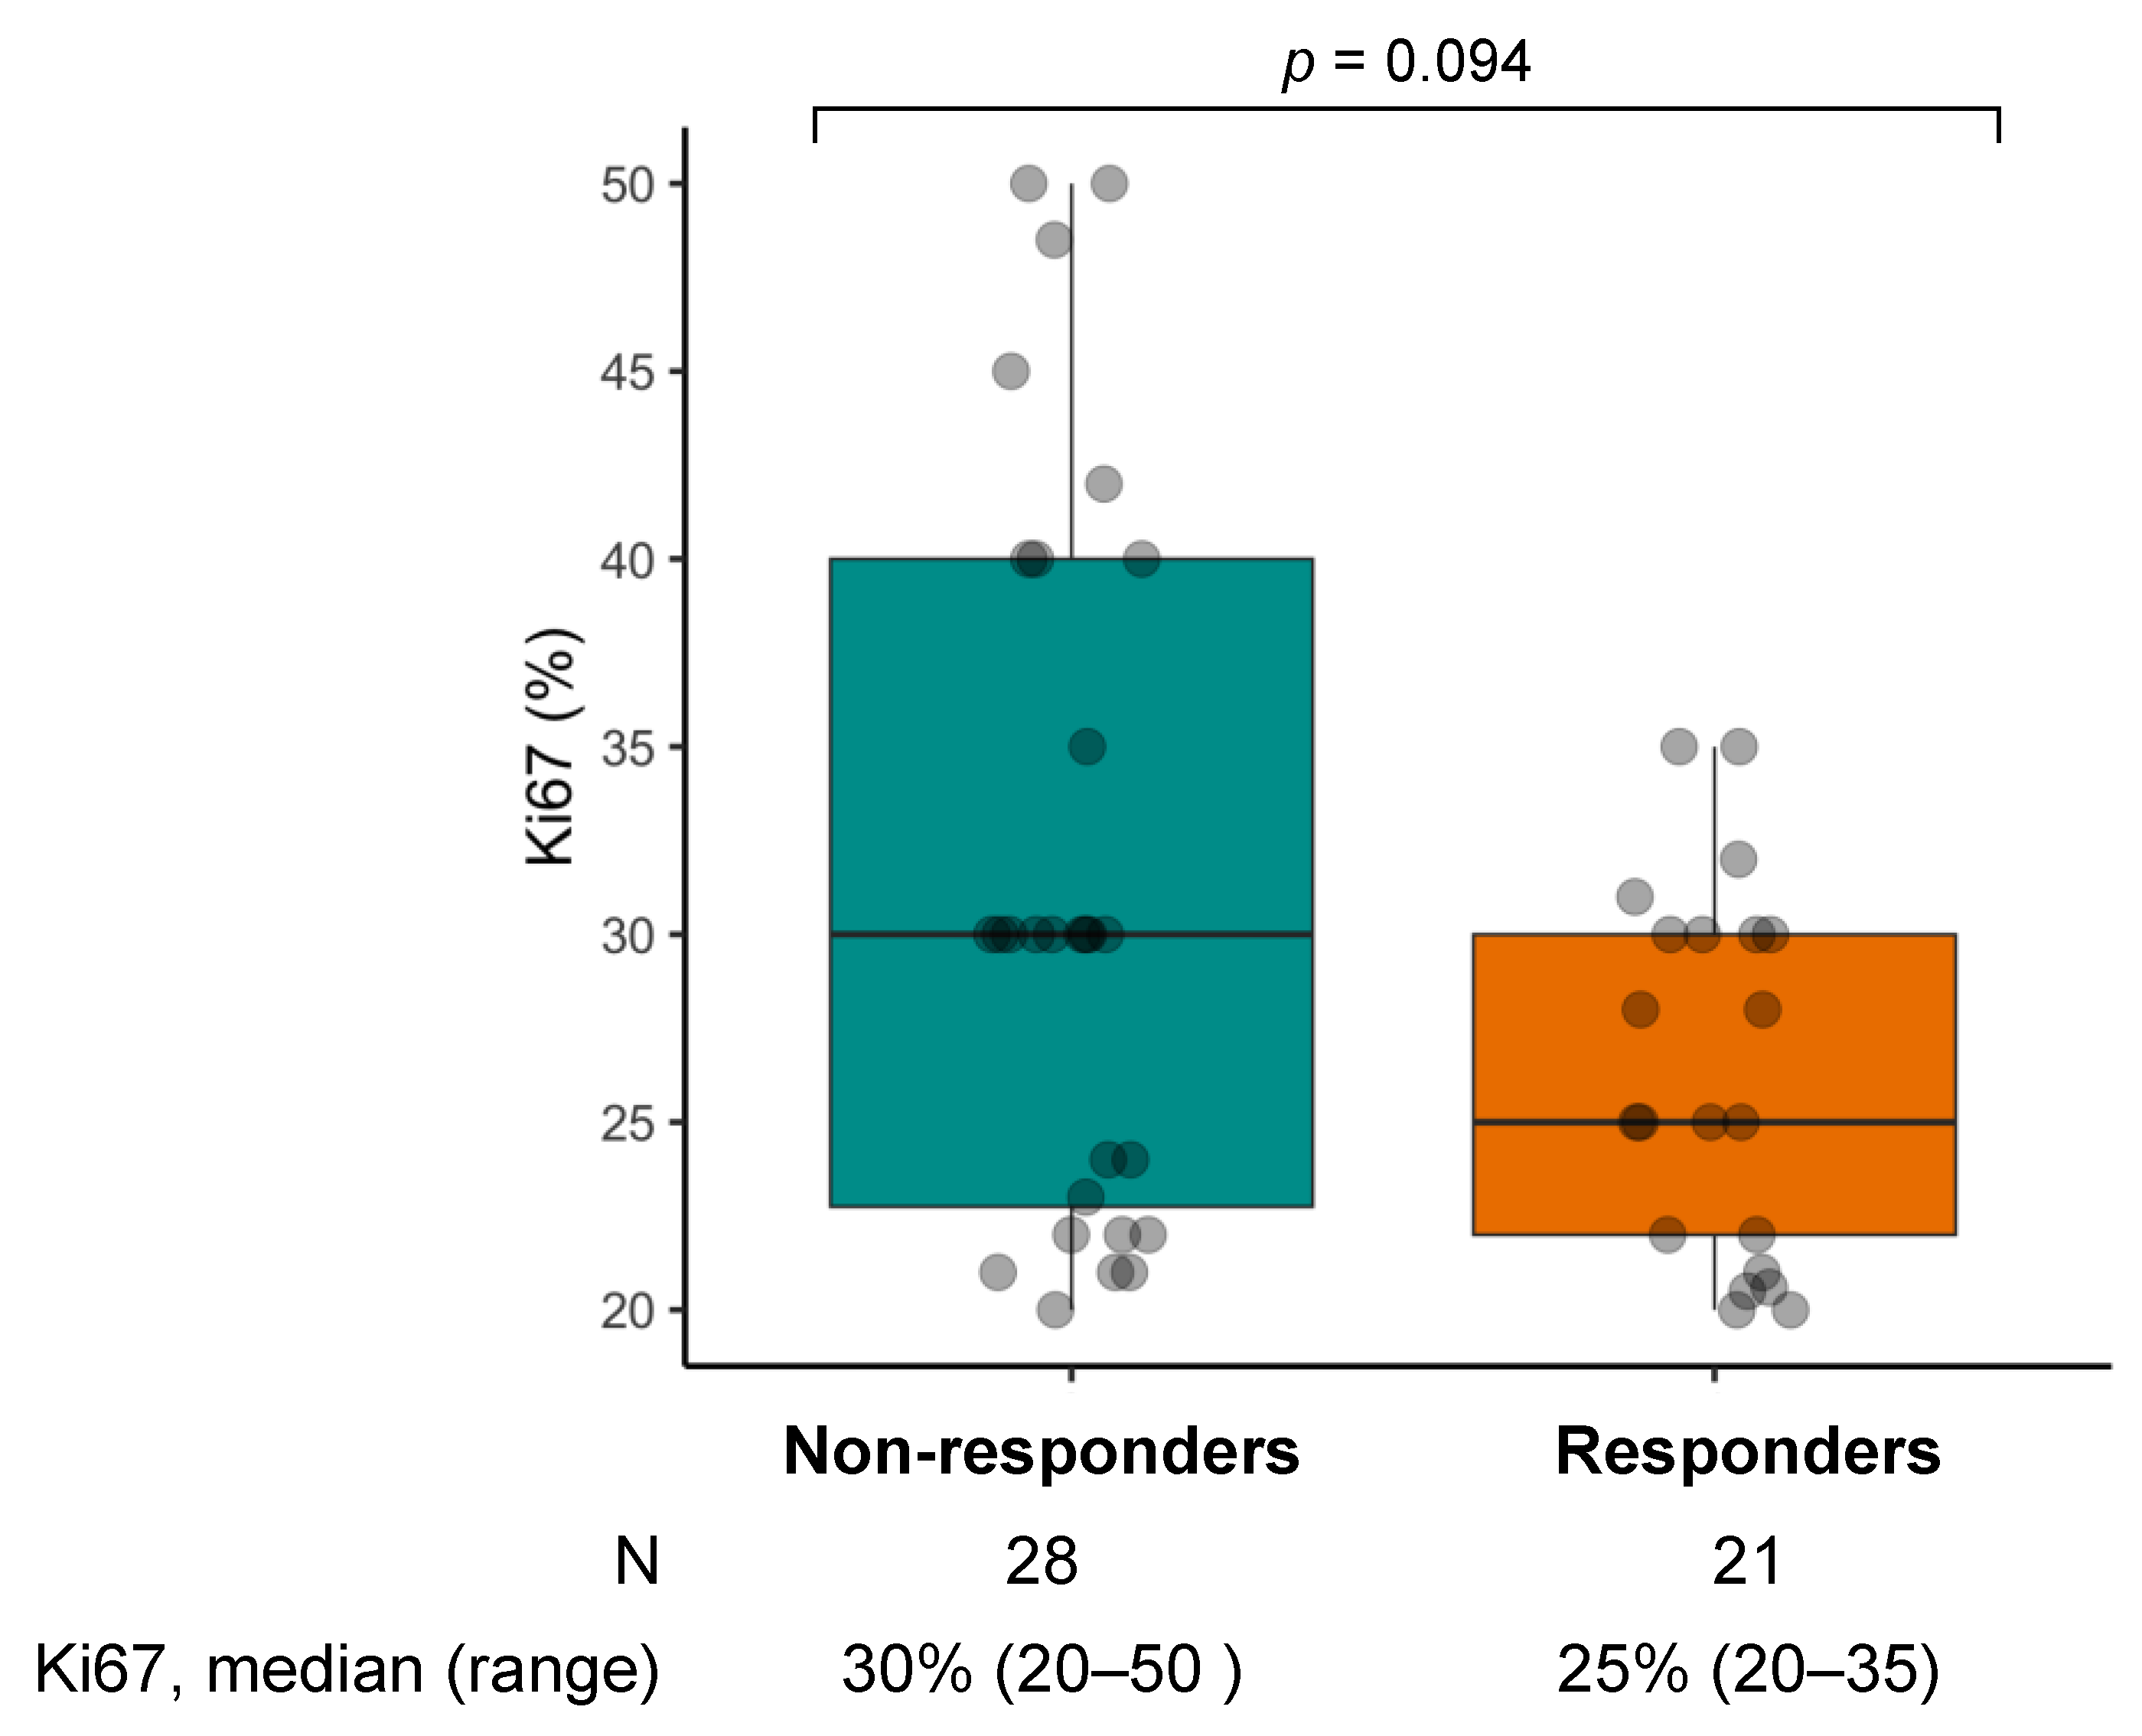
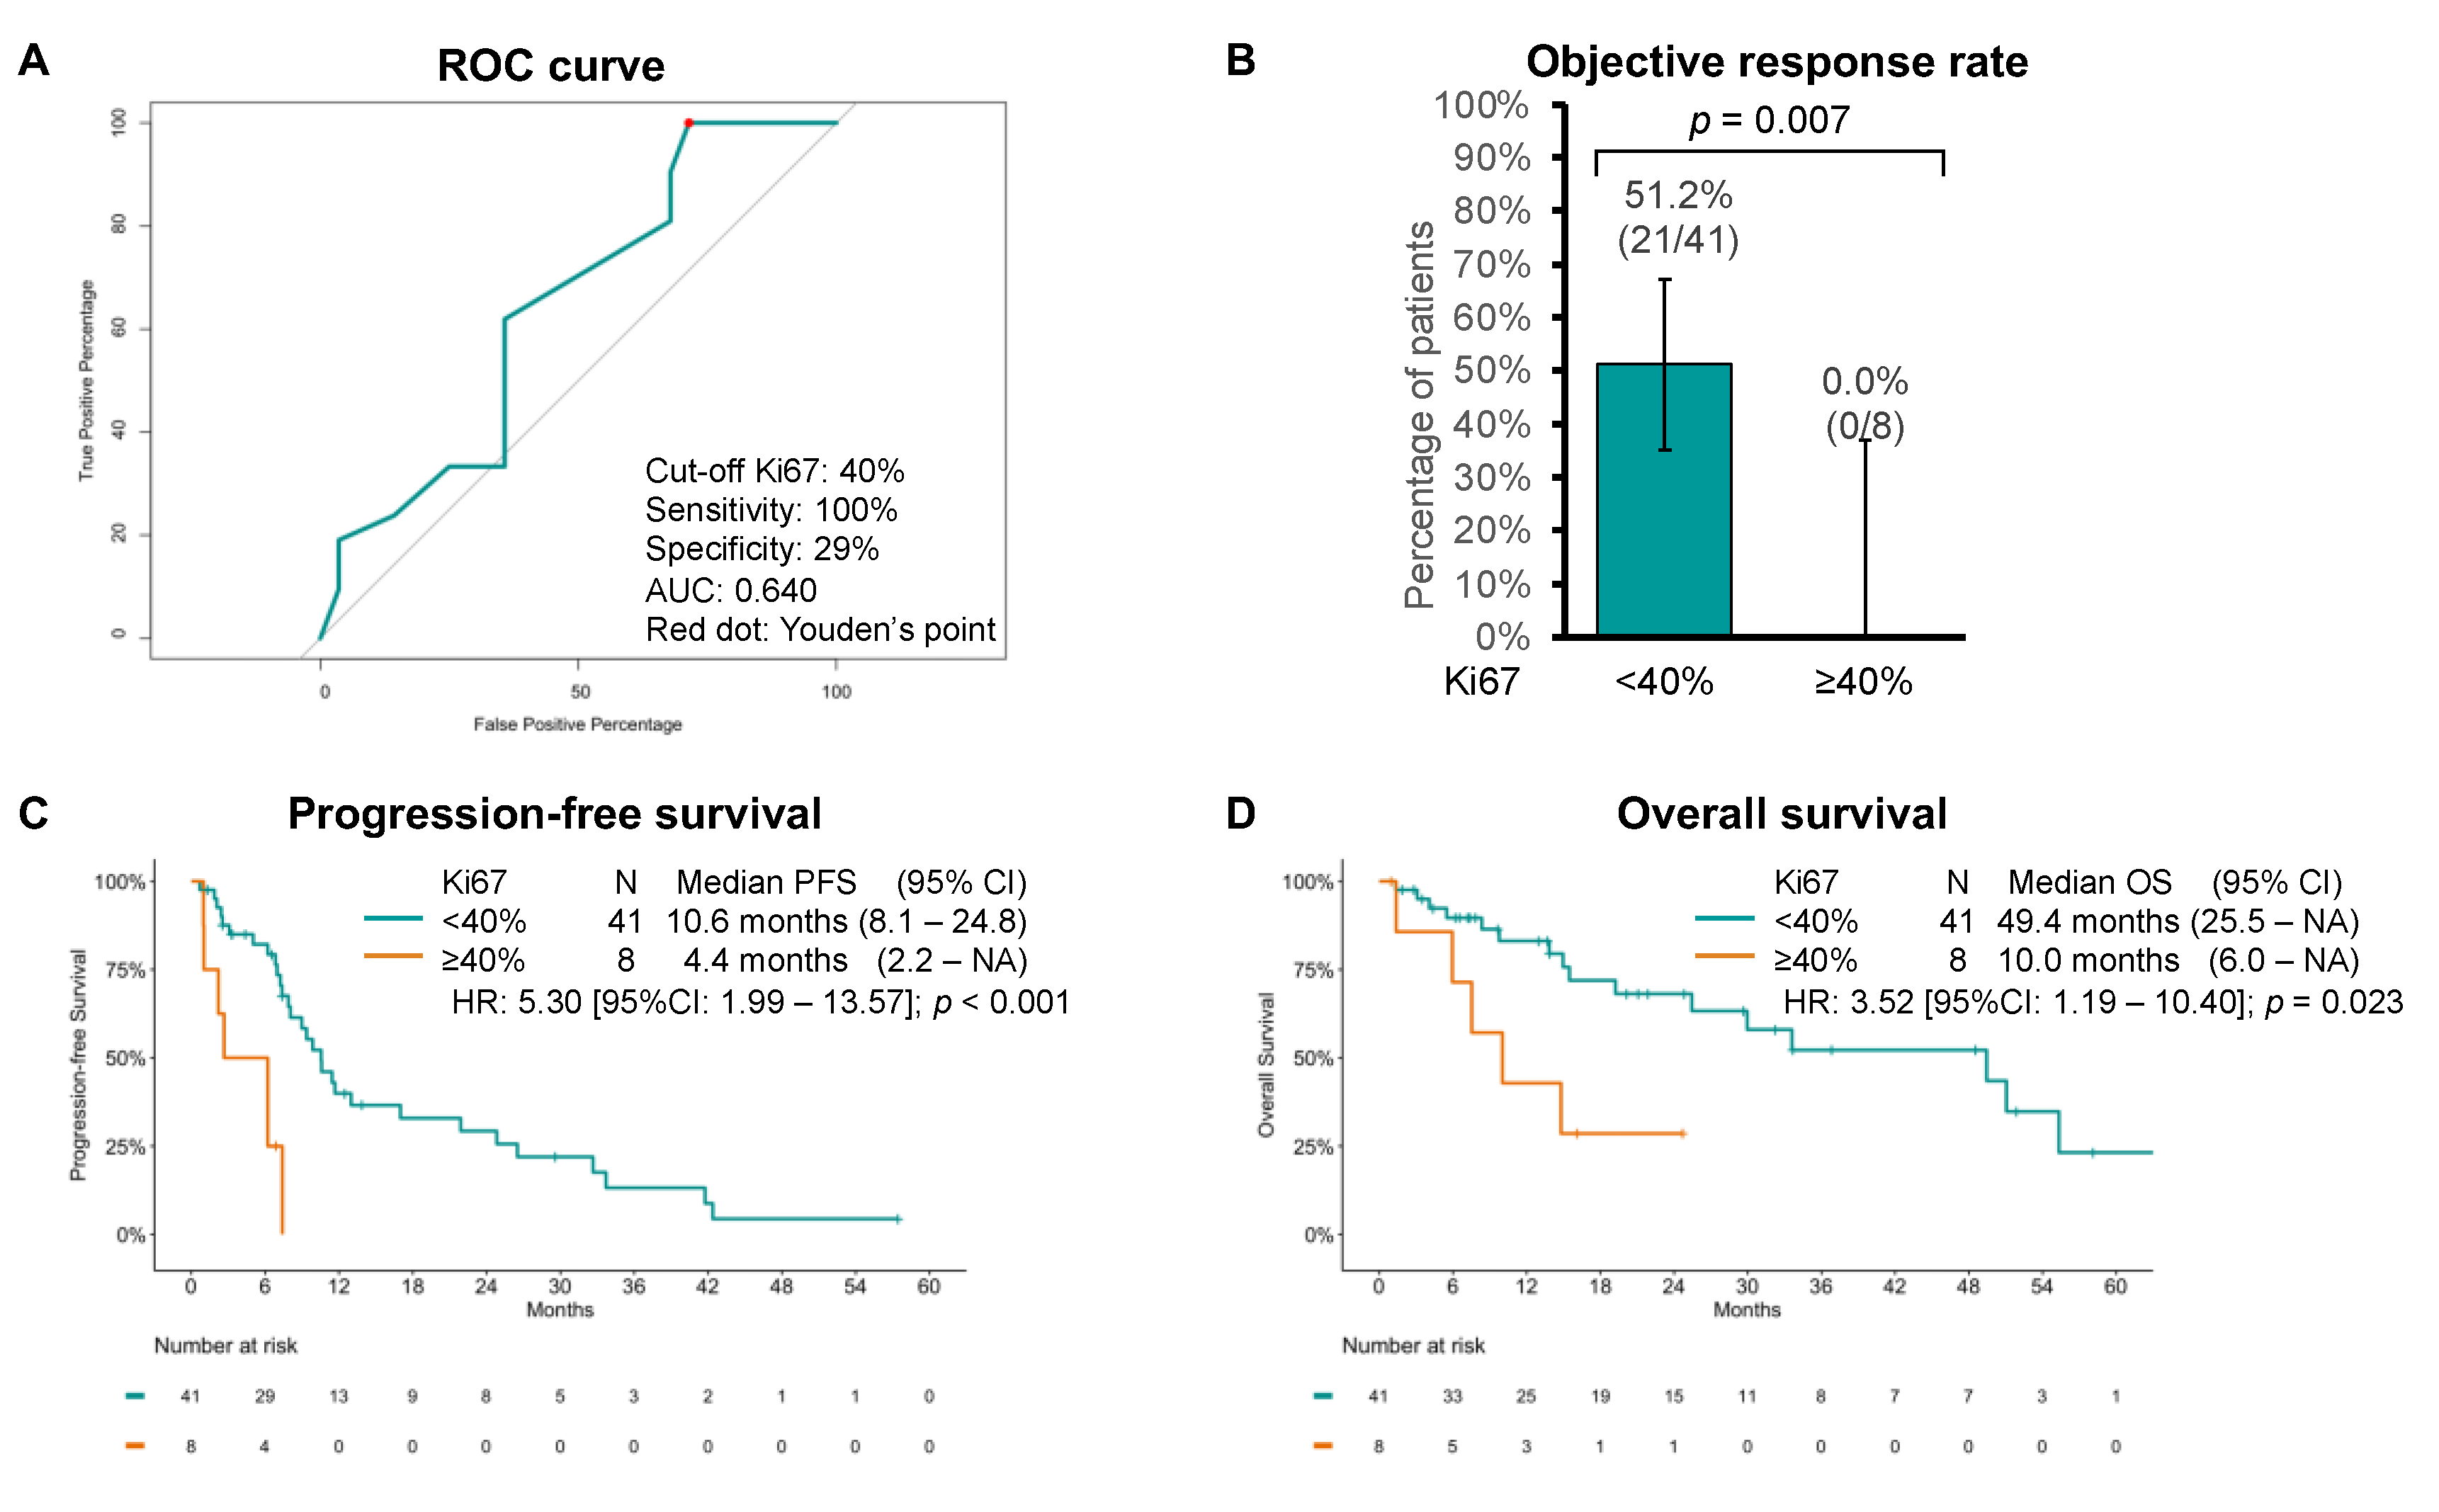
3.1. Chemotherapy Cohort
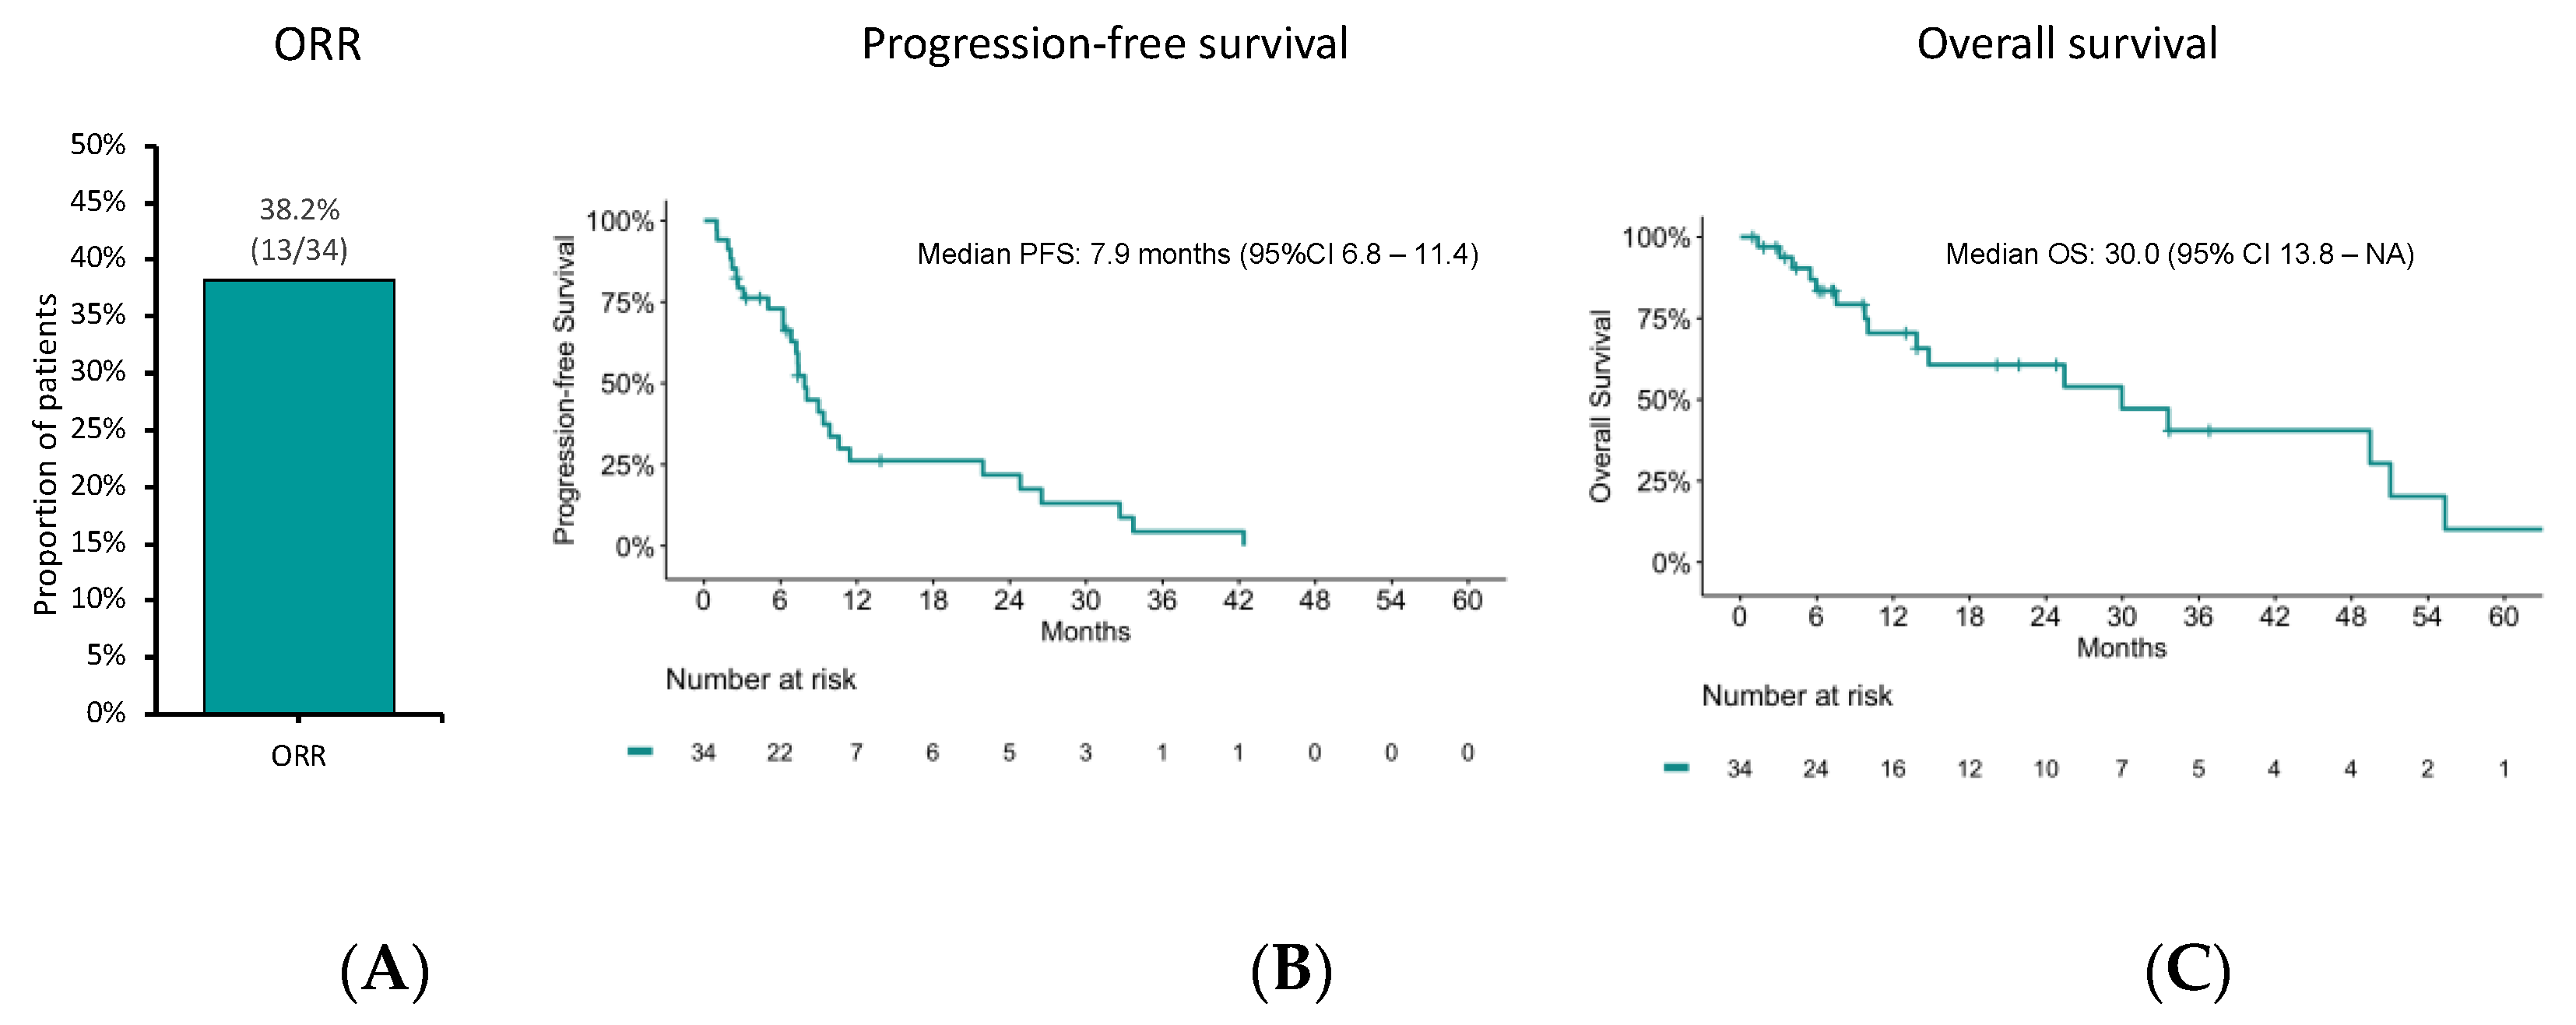
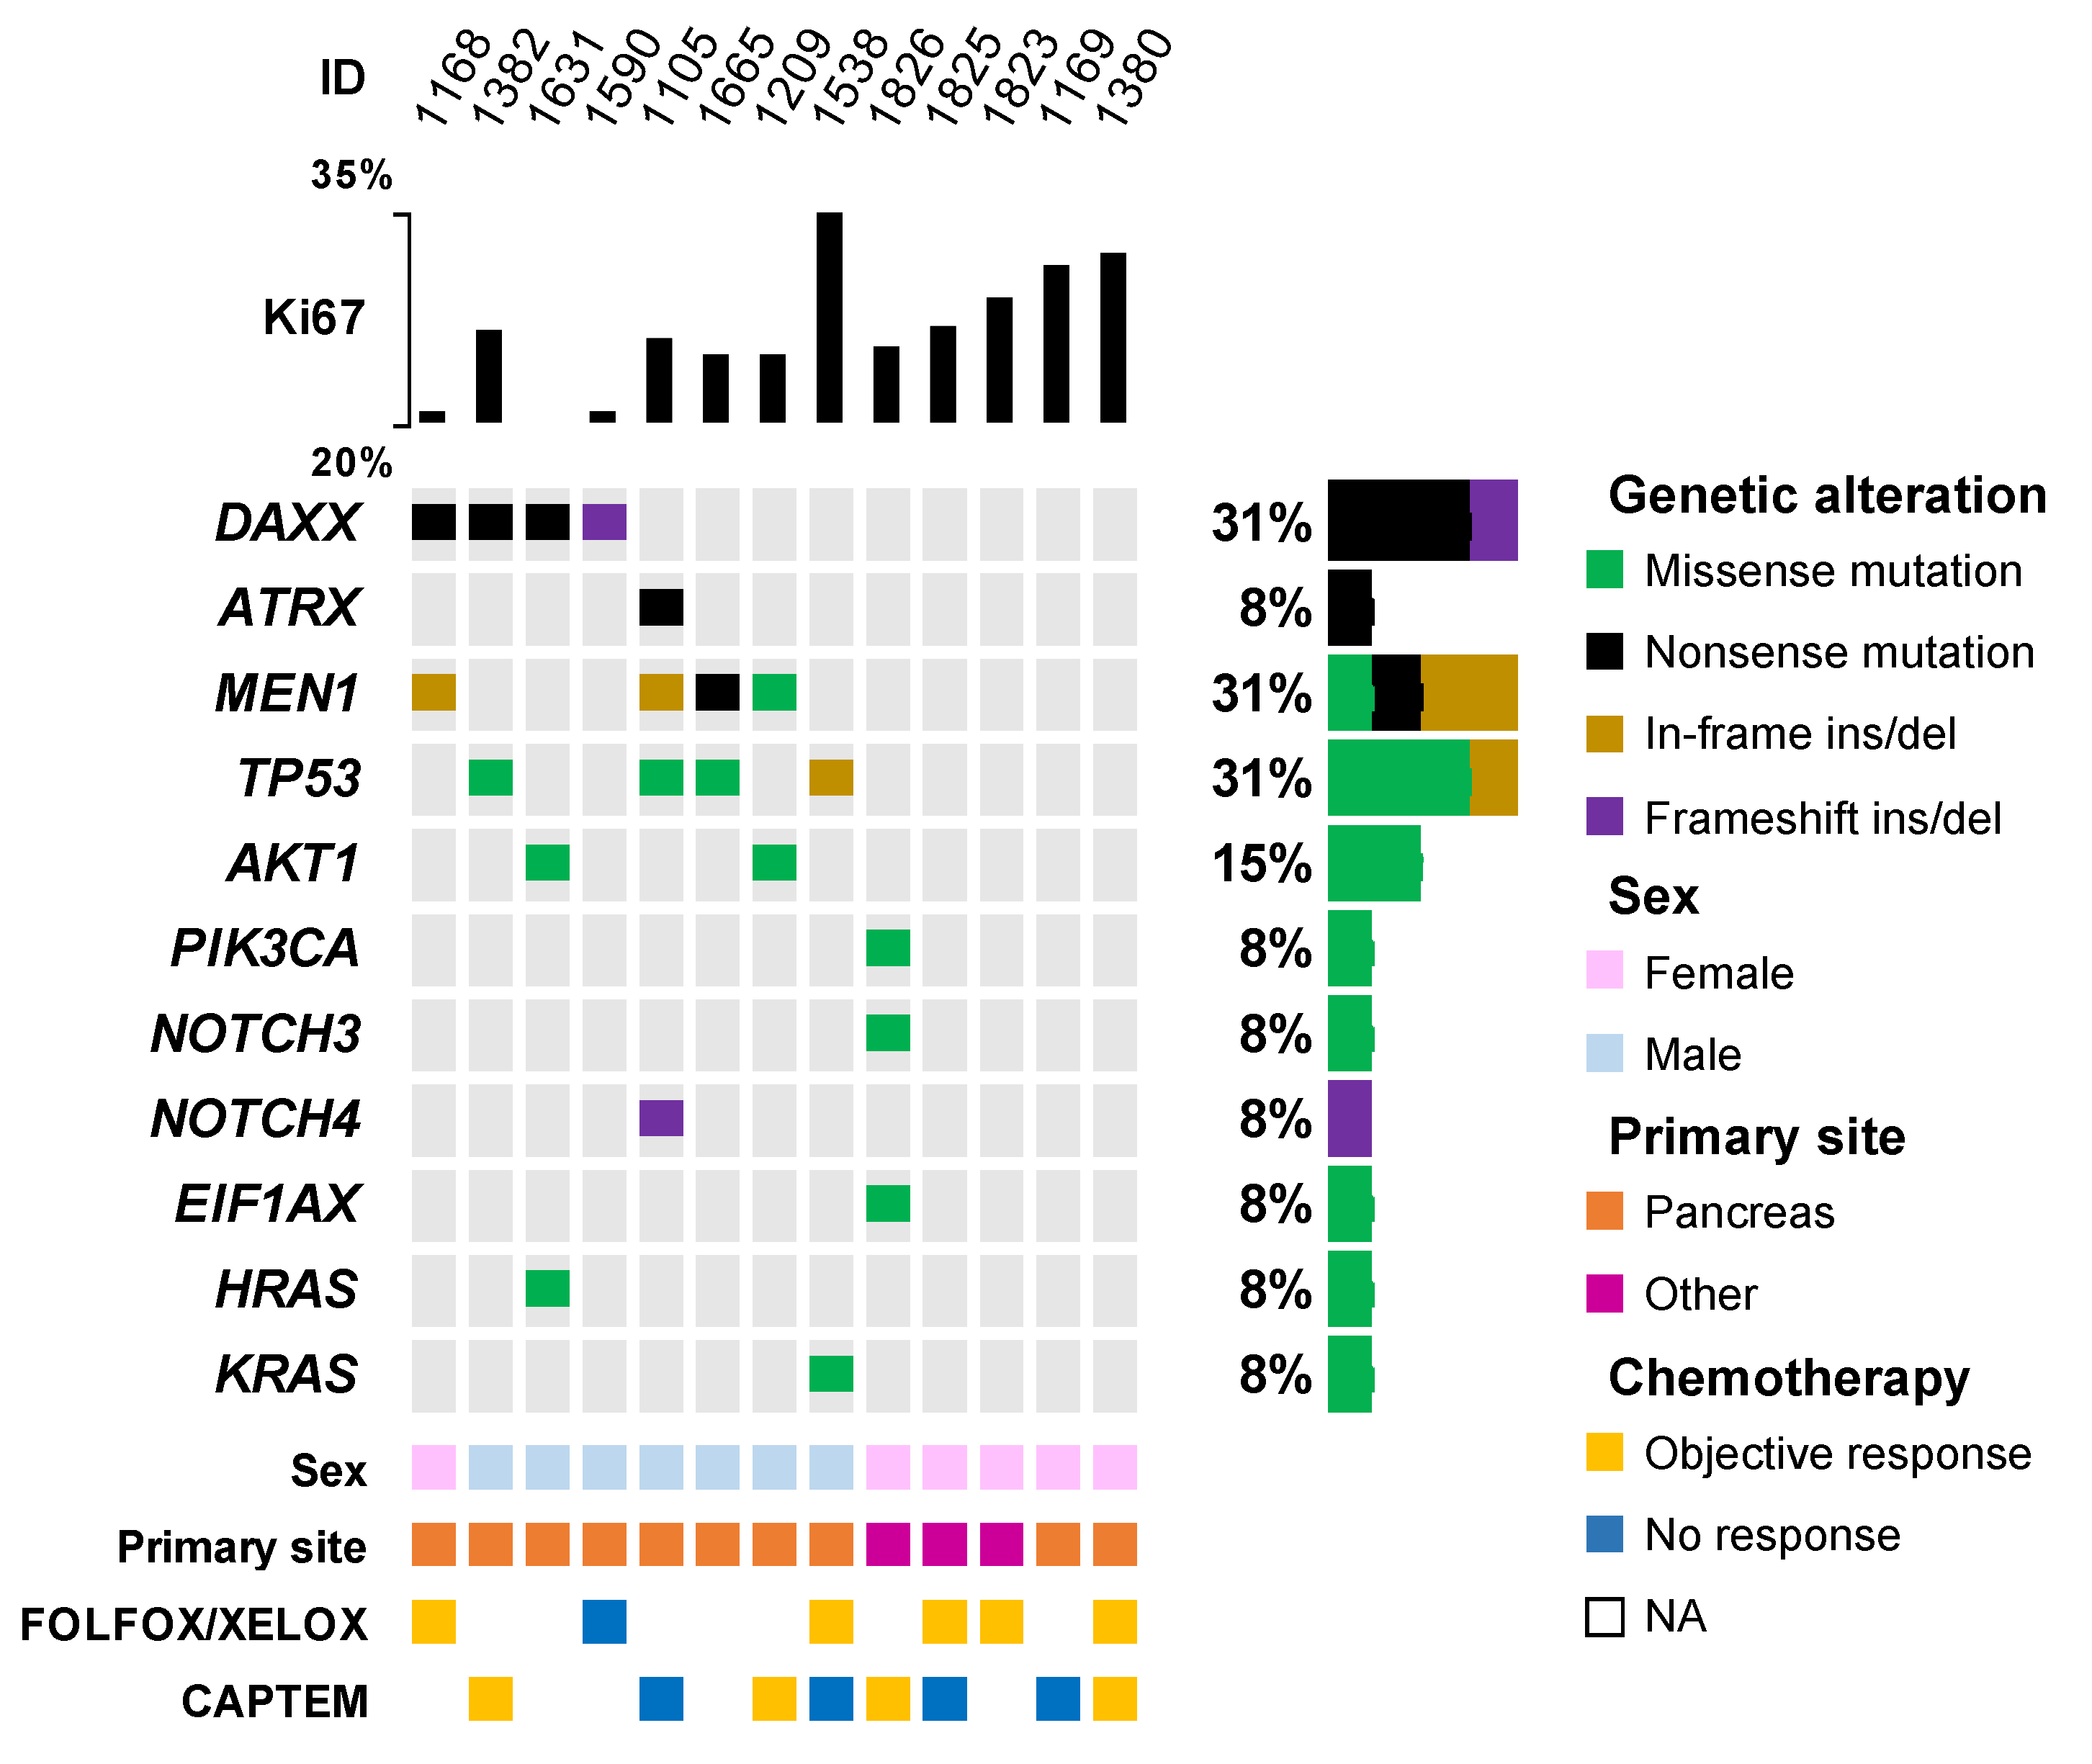
Characteristics of the patients in the chemotherapy cohort are summarized in Table 1.
Median age was 60 years (range 18–80), primary site was pancreas (panNET) in 32 (65%) and the gastrointestinal tract in 17 (35%), median Ki67 was 30% (range 20–50%) and stage at the time of chemotherapy was metastatic in all tumors except 4 (8%), which were locally advanced. In those with available pre-treatment nuclear medicine imaging, the tumor was positive at the 18F-FDG PET/CT scan in 23 cases (89%) and negative in 3 cases (11%), whereas it was positive at the 68Ga-DOTANOC-PET/CT scan in 30 (75%) and negative in 10 (25%). Patient characteristics were overall well balanced between the FOLFOX/XELOX group (N = 34) and the CAPTEM group (N = 15), except for the higher rate of 18-F-FDG-PET positivity in the FOLOX/XELOX group as compared to the CAPTEM group (100% [N = 16/16] vs. 70% [N = 7/10], respectively; p = 0.046).
CR was observed in one case (2.0%), PR in 20 (40.8%), and SD in 17 (34.7%), with an ORR of 42.9% (95%CI: 28.8–57.8, N = 21/49, Figure S1A) and a DCR of 77.6% (95%CI: 63.4–88.2, N = 38/49). Progressive disease (PD) was the best response in 11 cases (22.4%). Ki67 tended to be lower in responders as compared to non-responders (median 25% vs. 30%, respectively; p = 0.094) (Figure 2).
At a median follow-up of 24.8 months (95%CI: 20.2–48.6), PFS and OS were 9.0 months (95%CI: 7.2–13.0), and 33.6 months (95% CI: 19.2–NA) (Figure S1B,C). PFS was shorter in patients with FDG-avid tumors than in those with tumors with no uptake at the 18F-FDG PET/CT scan (8.1 months [95%CI: 7.0–26.5] vs. 41.8 months [95%CI: 41.8–NA], respectively; p = 0.01) (Figure S2) and tended to be shorter in patients who received FOLFOX/XELOX than in those who received CAPTEM (7.9 months [95%CI: 6.8–11.4] vs. 13.0 months [95%CI: 7.0–NA], respectively; p = 0.098). Nevertheless, after adjusting for potential confounding factors in a multivariable Cox proportional-hazards model, only Ki67 was independently associated with the risk of progression or death (HR: 1-07 [95%CI: 1.02–1.13]; p = 0.01) (Table S1). Indeed, after excluding the three patients with no uptake at the 18F-FDG PET imaging who have all received CAPTEM treatment, we observed similar outcomes in terms of ORR (38% vs. 50%, p = 0.514), PFS (7.9 months [95%CI: 6.8–11.4] vs. 11.7 months [95%: 6.2–NA]; p = 0.6), and OS (30.0 months [95%CI: 13.8–NA] vs. 19.2 months [95%CI: 15.0–NA]; p = 0.7) in the FOLFOX/XELOX and CAPTEM group, respectively, further supporting the absence of significant difference between the two treatments (Figure S3).
By means of ROC curve analysis, we then estimated 40% to be the best Ki67 cutoff to predict response, with 100% sensitivity, 29% specificity, and 0.640 AUC (Figure 3A). When comparing with the group with Ki67 < 40%, the group with tumors with Ki67 ≥ 40% had lower ORR (51.2% [95%CI: 35.1–67.1] vs. 0% [95%CI: 0–31.1]; p = 0.007) and shorter PFS (10.6 months [95%CI: 8.1–24.8] vs. 4.4 months [95%CI: 2.2–NA]; p < 0.001) and OS (49.4 months [95%CI: 25.5–NA] vs. 10.0 months [95%CI: 6.0–NA]; p = 0.023) (Figure 3B–D).
We then focused on outcomes to FOLFOX/XELOX because the activity of these chemotherapy schedules has been incompletely characterized, especially in G3 GEP-NET. In the subgroup of patients who received FOLFOX/XELOX as first-line treatment, ORR, PFS, and OS were 38.2% (95%CI: 22.2–56.4), 7.9 months (95%CI: 6.8–11.4), and 30.0 months (95% CI: 13.8–NA), respectively (Figure 4).
While there was no difference in Ki67 between responders and non-responders to FOLFOX/XELOX chemotherapy (median 28% vs. 30%, respectively; p = 0.461), increasing Ki67 was associated with both shorter PFS (HR: 1.09 [95%CI: 1.03–1.16]; p = 0.006) and OS (HR: 1.11 [95%CI: 1.03–1.20]; p = 0.004). We then estimated the best cutoff to predict response in the FOLFOX/XELOX cohort as well by means of ROC curve analysis, which was 40% as in the overall chemotherapy cohort (Figure S4A). When comparing with the group with Ki67 <40%, the Ki67 ≥ 40% group had numerically lower ORR (46.4% [95%CI: 27.5–66.1] vs. 0% [95%CI: 0–45.9]; p = 0.062) and significantly shorter PFS (9.4 months [95%CI: 7.4–24.8] vs. 2.4 months [95%CI: 1.0–NA]; p < 0.001) and OS (49.5 months [95%CI: 25.5–NA] vs. 7.5 months [95%CI: 6.0–NA]; p < 0.001) (Figure S4B–D).
Because outcomes to CAPTEM of patients with panNET have been extensively described [11], we analyzed outcomes of the N = 22 patients with G3 panNET who received FOLFOX/XELOX as first-line chemotherapy: in this cohort, ORR was 36.4%, median PFS was 7.9 months (95%CI: 5.0–32.6), and median OS was 49.4 months (95%CI: 9.8–NA) (Figure S5).

3.2. NGS Cohort

The NGS cohort only partially overlaps with the chemotherapy cohort and comprises 13 patients with G3 NETs whose tumors had successfully undergone targeted NGS with a custom panel. The patient characteristics are summarized in Table 2. The median age in this cohort was 53 years (range: 18–83), and 7 (54%) were men. Most of the patients had a pancreatic primary (N = 10/13, 77%) with a median Ki67 of 26.5% (range: 21–35).
As shown in Figure 5, a mutation in at least one of the genes has been found in nine out of thirteen samples (69%). The most frequently mutated genes are DAXX/ATRX (N = 5/13, 38%), followed by MEN1 (N = 4/13, 31%), and TP53 (N = 4/13, 31%). Genes encoding proteins of the Pi3k/Akt/mTor pathway are also mutated in 3/13 (23%) of tumors: AKT1 in two cases (15%) and PIK3CA in one case (8%). Interestingly, two pancreatic NETs harbored a mutation in genes of the RAS-family, namely KRAS (with TP53 co-mutation) and HRAS (with AKT1 and DAXX co-mutation). Notably, no mutation in RB1 has been identified. In this cohort, six patients received FOLFOX/XELOX chemotherapy, of whom five achieved a PR, whereas eight patients received CAPTEM, of whom four achieved a partial response. One patient with a pancreatic G3 NET received both treatment regimens and responded to both. Given the small sample size, no meaningful comparison can be made according to the treatment or mutation profile.

4. Discussion

We have shown that FOLFOX/XELOX chemotherapy is active in G3 GEP-NET, especially in tumors with Ki67 < 40% and that uptake at 18F-FDG PET is prognostic in G3 panNETs. Furthermore, G3 NETs demonstrated a genomic profiling similar to those of well-differentiated NETs, with a high rate of mutations in DAXX, ATRX, and MEN1, and less similar to poorly differentiated NECs, given the absence of mutations in RB1 and in oncogenes such as KRAS and BRAF.
As the G3 NET category has been recently defined, it poses unique challenges in its management as it shares clinical-pathologic features with both well-differentiated NET and with poorly differentiated NEC, which have dramatically different treatment susceptibility. Indeed, platinum-etoposide chemotherapy, which is the standard treatment in advanced NEC, has shown to be less active in G3 NETs with ORR as low as 24% [12]. On the other hand, chemotherapy is seldom used in G1-2 NET, only in select cases or after failure of other treatments, such as somatostatin analogues at standard or non-conventional doses, peptide radionuclide receptor therapy (PRRT), or tyrosine kinase inhibitors (namely everolimus and sutent for panNET) [3,4,13,14,15,16,17,18,19,20]. Chemotherapy with CAPTEM or single-agent temozolomide has been extensively investigated in G1-2 NETs, especially in panNETs, and yielded ORR of 30–70% and median PFS and OS of up to 23 and over 70 months, respectively [11,21,22,23,24,25,26,27]. Less is known about the activity of temozolomide or CAPTEM in patients with G3 NET. A few small retrospective heterogenous series of temozolomide and CAPTEM in G3 NET report ORR of 44–50% and median PFS of 10 months, which compare favorably with our findings (ORR 53% and PFS 13 months in patients who received CAPTEM as first-line treatment) [28,29]. Even less data are available on the use of FOLFOX/XELOX in G3 NET. Evidence of the activity of FOLFOX/XELOX in G3 NET comes from relatively small heterogeneous retrospective series, which included few G3 NET patients (10 to 12 cases), who mostly received FOLFOX/XELOX as lines of treatment later than first, yielding ORR of 26–45% and PFS of 6–8 months [30,31,32]. In this scenario, we reported about the largest series to date of 34 patients with G3 GEP-NET who received FOLFOX/XELOX as first-line treatment and achieved an ORR of 38% and a median PFS of 7.9 months. Despite the ROC performances likely limited by the relatively small sample size, we found that a Ki67 cutoff of 40% can discriminate outcomes in G3 NET. Indeed, no objective response has been observed with neither CAPTEM nor FOLFOX/XELOX in tumors with Ki67 ≥ 40%, which demonstrated shorter PFS and OS when compared to those with Ki67 < 40%. This was similar to what was previously reported in a large heterogeneous series of patients with NEN with Ki67 > 10% treated with CAPTEM [33]. Interestingly, in patients with NEC, defined as Ki67 > 20%, who received platinum etoposide chemotherapy in the NORDIC NEC study, the ORR was lower in those with Ki67 < 55% than those with a Ki67 ≥ 55% [5]. In an attempt to reconcile these findings with those from the present study, it can be speculated that platinum-etoposide chemotherapy is more effective in G3 NET or NEC with Ki67 ≥ 40–55%, whereas other chemotherapy regimens, such as FOLFOX/XELOX or CAPTEM might be more active in tumors with lower Ki67. With the available data, it is unclear whether the two different types of chemotherapy have differential activity in NEN with Ki67 between 40% and 55%.
In the NGS cohort, a high proportion of mutations in genes which are commonly found in well-differentiated NET, such as DAXX, ATRX, and MEN1, as well as alterations in genes encoding proteins of the PI3K/Akt/mTOR pathway have been found [34,35,36,37,38]. The pattern of mutated genes appears to be different from those of NEC, which are characterized by co-occurring alteration in TP53 and RB1, and in the driver oncogenes KRAS and BRAF [39,40], the latter especially in colorectal NEC [41]. Mutations in TP53 have been identified also in our cohort (31% of cases), but none of these mutations co-occurred with RB1 alterations. Overall, these findings suggest that the genomics of G3 NETs are more similar to G1–G2 NETs than NECs.
Limitations of this study include its retrospective design, which introduced a potential bias in chemotherapy assignment since patients with less aggressive tumors at local investigator’s judgement might have been more likely to receive CAPTEM than FOLFOX/XELOX, which could explain the non-significant numeric differences in outcomes between the two treatment schedules. The retrospective data collection was, however, inevitable since the G3 NET category has been recently defined and represents a rare subgroup of a low-incidence disease. Moreover, some subgroups are small in size and prevent definitive or meaningful comparisons (e.g., tumors with no uptake at 18F-FDG-PET or patients who received chemotherapy in the NGS cohort). Nevertheless, we reported the largest series to date of G3 GEP-NET patients treated with first-line chemotherapy, including FOLFOX/XELOX chemotherapy. Lastly, we performed targeted NGS of coding regions of a selected list of genes which might have missed alterations in intronic regions of suppressor oncogenes, e.g., RB1.

5. Conclusions

In conclusion, FOLFOX/XELOX chemotherapy is active as first-line treatment for patients with G3 GEP-NET and should be considered an option in this setting. The mutational landscape of G3 NET is more similar to well-differentiated NET than to NEC.

Supplementary Materials

The following supporting information can be downloaded at: https://www.mdpi.com/article/10.3390/diagnostics13091595/s1, Figure S1: (A) Objective response rate, (B) progression-free survival (PFS), and (C) overall survival (OS) estimates using the Kaplan–Meier method in the chemotherapy cohort; Figure S2: Progression-free survival (PFS) estimate using the Kaplan–Meier method in the chemotherapy cohort by 18F-fluorodeoxyglucose positron emission tomography (18F-FDG-PET) uptake; Figure S3: (A) Objective response rate, (B) progression-free survival (PFS), and (C) overall survival (OS) estimates using the Kaplan–Meier method in patients treated with CAPTEM or FOLFOX/XELOX (FOX/XOX) chemotherapy; Figure S4: (A) Receiving operator characteristics (ROC) curve of objective response by Ki67 cutoffs. Youden’s point is represented by a red dot. (B) Objective response rate, (C) progression-free survival (PFS), and (D) overall survival (OS) estimates using the Kaplan –Meier method to FOLFOX/XELOX chemotherapy by Ki67 cutoff of 40%; Figure S5: (A) Objective response rate, (B) progression-free survival (PFS), and (C) overall survival (OS) estimates using the Kaplan–Meier method in patients with pancreatic G3 NET who received FOLFOX/XELOX chemotherapy; Table S1: Cox proportional-hazards model for the risk of progression in the overall chemotherapy cohort. Only variables with a p-value < 0.10 at the univariate model have been included in the multivariable model.

Author Contributions

Conceptualization, G.L. and D.C.; methodology, G.L., D.d.B., D.M. and D.C.; formal analysis, G.L. and D.C.; investigation, G.L. and E.A.; data curation, N.P., A.B., M.T., E.A., M.M., R.B., T.I. and S.P.; writing—original draft preparation, G.L.; writing—review and editing, all authors; visualization, G.L.; supervision, D.C.; project administration, D.C. All authors have read and agreed to the published version of the manuscript.

Funding

This research received no external funding.

Institutional Review Board Statement

This study was approved by local IRB (Comitato Etico Indipendente, IRCCS Policlinico Sant’Orsola-Malpighi of Bologna, protocol code: SOCRATE, 626/2020/Oss/AOUBo on 18/06/2020) and was conducted in accordance with the principles of the Declaration of Helsinki (revision of Edinburgh, 2000).

Informed Consent Statement

Informed consent was obtained from all subjects involved in the study.

Data Availability Statement

Data supporting the present study are available from thecorresponding author upon reasonable request.

Conflicts of Interest

The authors declare no conflict of interest.

References

  1. Dasari, A.; Shen, C.; Halperin, D.M.; Zhao, B.; Zhou, S.; Xu, Y.; Shih, T.; Yao, J.C. Trends in the Incidence, Prevalence, and Survival Outcomes in Patients with Neuroendocrine Tumors in the United States. JAMA Oncol. 2017, 3, 1335–1342. [Google Scholar] [CrossRef]
  2. Nagtegaal, I.D.; Odze, R.D.; Klimstra, D.; Paradis, V.; Rugge, M.; Schirmacher, P.; Washington, K.M.; Carneiro, F.; Cree, I.A. The 2019 WHO classification of tumours of the digestive system. Histopathology 2020, 76, 182–188. [Google Scholar] [CrossRef] [Green Version]
  3. Zappi, A.; Persano, I.; Galvani, L.; Parlagreco, E.; Andrini, E.; Campana, D.; Brizzi, M.P.; Lamberti, G.; La Salvia, A. Chemotherapy in Well Differentiated Neuroendocrine Tumors (NET) G1, G2, and G3: A Narrative Review. J. Clin. Med. 2023, 12, 717. [Google Scholar] [CrossRef] [PubMed]
  4. Pavel, M.; O’Toole, D.; Costa, F.; Capdevila, J.; Gross, D.; Kianmanesh, R.; Krenning, E.; Knigge, U.; Salazar, R.; Pape, U.-F.; et al. ENETS Consensus Guidelines Update for the Management of Distant Metastatic Disease of Intestinal, Pancreatic, Bronchial Neuroendocrine Neoplasms (NEN) and NEN of Unknown Primary Site. Neuroendocrinology 2016, 103, 172–185. [Google Scholar] [CrossRef] [PubMed]
  5. Sorbye, H.; Welin, S.; Langer, S.W.; Vestermark, L.W.; Holt, N.; Osterlund, P.; Dueland, S.; Hofsli, E.; Guren, M.G.; Ohrling, K.; et al. Predictive and prognostic factors for treatment and survival in 305 patients with advanced gastrointestinal neuroendocrine carcinoma (WHO G3): The NORDIC NEC study. Ann. Oncol. 2013, 24, 152–160. [Google Scholar] [CrossRef] [PubMed]
  6. Eisenhauer, E.A.; Therasse, P.; Bogaerts, J.; Schwartz, L.H.; Sargent, D.; Ford, R.; Dancey, J.; Arbuck, S.; Gwyther, S.; Mooney, M.; et al. New response evaluation criteria in solid tumours: Revised RECIST guideline (version 1.1). Eur. J. Cancer 2009, 45, 228–247. [Google Scholar] [CrossRef]
  7. Chakravarty, D.; Gao, J.; Phillips, S.; Kundra, R.; Zhang, H.; Wang, J.; Rudolph, J.E.; Yaeger, R.; Soumerai, T.; Nissan, M.H.; et al. OncoKB: A Precision Oncology Knowledge Base. JCO Precis. Oncol. 2017, 2017, 1–16. [Google Scholar] [CrossRef]
  8. Landrum, M.J.; Lee, J.M.; Benson, M.; Brown, G.R.; Chao, C.; Chitipiralla, S.; Gu, B.; Hart, J.; Hoffman, D.; Jang, W.; et al. ClinVar: Improving access to variant interpretations and supporting evidence. Nucleic Acids Res. 2017, 46, D1062–D1067. [Google Scholar] [CrossRef] [Green Version]
  9. Adzhubei, I.A.; Schmidt, S.; Peshkin, L.; Ramensky, V.E.; Gerasimova, A.; Bork, P.; Kondrashov, A.S.; Sunyaev, S.R. A method and server for predicting damaging missense mutations. Nat. Methods 2010, 7, 248–249. [Google Scholar] [CrossRef] [Green Version]
  10. Yin, J.; Tian, L. Joint confidence region estimation for area under ROC curve and Youden index. Stat. Med. 2013, 33, 985–1000. [Google Scholar] [CrossRef]
  11. Kunz, P.L.; Graham, N.T.; Catalano, P.J.; Nimeiri, H.S.; Fisher, G.A.; Longacre, T.A.; Suarez, C.J.; Martin, B.A.; Yao, J.C.; Kulke, M.H.; et al. Randomized Study of Temozolomide or Temozolomide and Capecitabine in Patients with Advanced Pancreatic Neuroendocrine Tumors (ECOG-ACRIN E2211). J. Clin. Oncol. 2022, 41, 1359–1369. [Google Scholar] [CrossRef] [PubMed]
  12. Elvebakken, H.; Perren, A.; Scoazec, J.-Y.; Tang, L.H.; Federspiel, B.; Klimstra, D.S.; Vestermark, L.W.; Ali, A.S.; Zlobec, I.; Myklebust, T.Å.; et al. A Consensus-Developed Morphological Re-Evaluation of 196 High-Grade Gastroenteropancreatic Neuroendocrine Neoplasms and Its Clinical Correlations. Neuroendocrinology 2020, 111, 883–894. [Google Scholar] [CrossRef]
  13. Rinke, A.; Müller, H.-H.; Schade-Brittinger, C.; Klose, K.-J.; Barth, P.; Wied, M.; Mayer, C.; Aminossadati, B.; Pape, U.-F.; Bläker, M.; et al. Placebo-Controlled, Double-Blind, Prospective, Randomized Study on the Effect of Octreotide LAR in the Control of Tumor Growth in Patients with Metastatic Neuroendocrine Midgut Tumors: A Report from the PROMID Study Group. J. Clin. Oncol. 2009, 27, 4656–4663. [Google Scholar] [CrossRef] [PubMed]
  14. Caplin, M.E.; Pavel, M.; Cwikla, J.B.; Phan, A.T.; Raderer, M.; Sedlackova, E.; Cadiot, G.; Wolin, E.M.; Capdevila, J.; Wall, L.; et al. Anti-tumour effects of lanreotide for pancreatic and intestinal neuroendocrine tumours: The CLARINET open-label extension study. Endocr. Relat. Cancer 2016, 23, 191–199. [Google Scholar] [CrossRef] [PubMed]
  15. Pavel, M.; Ćwikła, J.B.; Lombard-Bohas, C.; Borbath, I.; Shah, T.; Pape, U.F.; Capdevila, J.; Panzuto, F.; Thanh, X.-M.T.; Houchard, A.; et al. Efficacy and safety of high-dose lanreotide autogel in patients with progressive pancreatic or midgut neuroendocrine tumours: CLARINET FORTE phase 2 study results. Eur. J. Cancer 2021, 157, 403–414. [Google Scholar] [CrossRef]
  16. Lamberti, G.; Faggiano, A.; Brighi, N.; Tafuto, S.; Ibrahim, T.; Brizzi, M.P.; Pusceddu, S.; Albertelli, M.; Massironi, S.; Panzuto, F.; et al. Nonconventional Doses of Somatostatin Analogs in Patients with Progressing Well-Differentiated Neuroendocrine Tumor. J. Clin. Endocrinol. Metab. 2020, 105, 194–200. [Google Scholar] [CrossRef]
  17. Ricci, C.; Lamberti, G.; Ingaldi, C.; Mosconi, C.; Pagano, N.; Alberici, L.; Ambrosini, V.; Manuzzi, L.; Monari, F.; Malvi, D.; et al. Treatment of Advanced Gastro-Entero-Pancreatic Neuro-Endocrine Tumors: A Systematic Review and Network Meta-Analysis of Phase III Randomized Controlled Trials. Cancers 2021, 13, 358. [Google Scholar] [CrossRef]
  18. Fazio, N.; Buzzoni, R.; Fave, G.D.; Tesselaar, M.E.; Wolin, E.; Van Cutsem, E.; Tomassetti, P.; Strosberg, J.; Voi, M.; Bubuteishvili-Pacaud, L.; et al. Everolimus in advanced, progressive, well-differentiated, non-functional neuroendocrine tumors: RADIANT-4 lung subgroup analysis. Cancer Sci. 2017, 109, 174–181. [Google Scholar] [CrossRef] [Green Version]
  19. Yao, J.C.; Pavel, M.; Lombard-Bohas, C.; Van Cutsem, E.; Voi, M.; Brandt, U.; He, W.; Chen, D.; Capdevila, J.; De Vries, E.G.E.; et al. Everolimus for the Treatment of Advanced Pancreatic Neuroendocrine Tumors: Overall Survival and Circulating Biomarkers from the Randomized, Phase III RADIANT-3 Study. J. Clin. Oncol. 2016, 34, 3906–3913. [Google Scholar] [CrossRef]
  20. Raymond, E.; Dahan, L.; Raoul, J.-L.; Bang, Y.-J.; Borbath, I.; Lombard-Bohas, C.; Valle, J.; Metrakos, P.; Smith, D.; Vinik, A.; et al. Sunitinib Malate for the Treatment of Pancreatic Neuroendocrine Tumors. N. Engl. J. Med. 2011, 364, 501–513. [Google Scholar] [CrossRef] [Green Version]
  21. Fine, R.L.; Gulati, A.P.; Tsushima, D.; Mowatt, K.B.; Oprescu, A.; Bruce, J.N.; Chabot, J.A. Prospective phase II study of capecitabine and temozolomide (CAPTEM) for progressive, moderately, and well-differentiated metastatic neuroendocrine tumors. J. Clin. Oncol. 2014, 32, 179. [Google Scholar] [CrossRef]
  22. de Mestier, L.; Walter, T.; Brixi, H.; Evrard, C.; Legoux, J.-L.; de Boissieu, P.; Hentic, O.; Cros, J.; Hammel, P.; Tougeron, D.; et al. Comparison of Temozolomide-Capecitabine to 5-Fluorouracile-Dacarbazine in 247 Patients with Advanced Digestive Neuroendocrine Tumors Using Propensity Score Analyses. Neuroendocrinology 2019, 108, 343–353. [Google Scholar] [CrossRef] [PubMed]
  23. Spada, F.; Fumagalli, C.; Antonuzzo, L.; Messerini, L.; Radice, D.; Di Rocco, R.; Galdy, S.; Barucca, V.; Pisa, E.; Barberis, M.; et al. Capecitabine plus temozolomide (CAP-TEM) in patients with advanced neuroendocrine neoplasms (NEN): An Italian multicenter retrospective analysis. J. Clin. Oncol. 2014, 32, 281. [Google Scholar] [CrossRef]
  24. Strosberg, J.R.; Fine, R.L.; Choi, J.; Nasir, A.; Coppola, D.; Chen, D.-T.; Helm, J.; Kvols, L. First-line chemotherapy with capecitabine and temozolomide in patients with metastatic pancreatic endocrine carcinomas. Cancer 2010, 117, 268–275. [Google Scholar] [CrossRef]
  25. Campana, D.; Walter, T.; Pusceddu, S.; Gelsomino, F.; Graillot, E.; Prinzi, N.; Spallanzani, A.; Fiorentino, M.; Barritault, M.; Dall’olio, F.; et al. Correlation between MGMT promoter methylation and response to temozolomide-based therapy in neuroendocrine neoplasms: An observational retrospective multicenter study. Endocrine 2018, 60, 490–498. [Google Scholar] [CrossRef]
  26. Saranga-Perry, V.; Morse, B.; Centeno, B.; Kvols, L.; Strosberg, J. Treatment of Metastatic Neuroendocrine Tumors of the Thymus with Capecitabine and Temozolomide: A Case Series. Neuroendocrinology 2013, 97, 318–321. [Google Scholar] [CrossRef]
  27. Ekeblad, S.; Sundin, A.; Janson, E.T.; Welin, S.; Granberg, D.; Kindmark, H.; Dunder, K.; Kozlovacki, G.; Orlefors, H.; Sigurd, M.; et al. Temozolomide as Monotherapy Is Effective in Treatment of Advanced Malignant Neuroendocrine Tumors. Clin. Cancer Res. 2007, 13, 2986–2991. [Google Scholar] [CrossRef] [Green Version]
  28. Bongiovanni, A.; Liverani, C.; Foca, F.; Fausti, V.; Di Menna, G.; Mercatali, L.; De Vita, A.; Riva, N.; Calpona, S.; Miserocchi, G.; et al. Temozolomide Alone or Combined with Capecitabine for the Treatment of Metastatic Neuroendocrine Neoplasia: A “Real-World” Data Analysis. Neuroendocrinology 2021, 111, 895–906. [Google Scholar] [CrossRef]
  29. Raj, N.; Klimstra, D.S.; Horvat, N.; Zhang, L.; Chou, J.F.; Capanu, M.; Basturk, O.; Do, R.K.G.; Allen, P.J.; Reidy-Lagunes, D. O6-Methylguanine DNA Methyltransferase Status Does Not Predict Response or Resistance to Alkylating Agents in Well-Differentiated Pancreatic Neuroendocrine Tumors. Pancreas 2017, 46, 758–763. [Google Scholar] [CrossRef]
  30. Merola, E.; Buono, A.D.; Denecke, T.; Arsenic, R.; Pape, U.-F.; Jann, H.; Wiedenmann, B.; Pavel, M.E. Efficacy and Toxicity of 5-Fluorouracil–Oxaliplatin in Gastroenteropancreatic Neuroendocrine Neoplasms. Pancreas 2020, 49, 912–917. [Google Scholar] [CrossRef]
  31. Spada, F.; Antonuzzo, L.; Marconcini, R.; Radice, D.; Antonuzzo, A.; Ricci, S.; Di Costanzo, F.; Fontana, A.; Gelsomino, F.; Luppi, G.; et al. Oxaliplatin-Based Chemotherapy in Advanced Neuroendocrine Tumors: Clinical Outcomes and Preliminary Correlation with Biological Factors. Neuroendocrinology 2016, 103, 806–814. [Google Scholar] [CrossRef]
  32. Al-Toubah, T.; Morse, B.; Pelle, E.; Strosberg, J. Efficacy of FOLFOX in Patients with Aggressive Pancreatic Neuroendocrine Tumors after Prior Capecitabine/Temozolomide. Oncologist 2021, 26, 115–119. [Google Scholar] [CrossRef]
  33. Wang, W.; Zhang, Y.; Peng, Y.; Jin, K.-Z.; Li, Y.-L.; Liang, Y.; Tan, H.-Y.; Yu, X.-J.; Zhou, Z.-W.; Chen, J. A Ki-67 Index to Predict Treatment Response to the Capecitabine/Temozolomide Regimen in Neuroendocrine Neoplasms: A Retrospective Multicenter Study. Neuroendocrinology 2020, 111, 752–763. [Google Scholar] [CrossRef] [PubMed]
  34. Scarpa, A.; Chang, D.K.; Nones, K.; Corbo, V.; Patch, A.-M.; Bailey, P.; Lawlor, R.T.; Johns, A.L.; Miller, D.K.; Mafficini, A.; et al. Whole-genome landscape of pancreatic neuroendocrine tumours. Nature 2017, 543, 65–71. [Google Scholar] [CrossRef] [PubMed] [Green Version]
  35. Park, H.Y.; Kwon, M.J.; Kang, H.S.; Kim, Y.J.; Kim, N.Y.; Kim, M.J.; Min, K.-W.; Choi, K.C.; Nam, E.S.; Cho, S.J.; et al. Targeted next-generation sequencing of well-differentiated rectal, gastric, and appendiceal neuroendocrine tumors to identify potential targets. Hum. Pathol. 2019, 87, 83–94. [Google Scholar] [CrossRef]
  36. Samsom, K.G.; Levy, S.; van Veenendaal, L.M.; Roepman, P.; Kodach, L.L.; Steeghs, N.; Valk, G.D.; Dercksen, M.W.; Kuhlmann, K.F.; Verbeek, W.H.; et al. Driver mutations occur frequently in metastases of well-differentiated small intestine neuroendocrine tumours. Histopathology 2020, 78, 556–566. [Google Scholar] [CrossRef] [PubMed]
  37. Yao, J.; Garg, A.; Chen, D.; Capdevila, J.; Engstrom, P.; Pommier, R.; Van Cutsem, E.; Singh, S.; Fazio, N.; He, W.; et al. Genomic profiling of NETs: A comprehensive analysis of the RADIANT trials. Endocr. Relat. Cancer 2019, 26, 391–403. [Google Scholar] [CrossRef] [Green Version]
  38. Puccini, A.; Poorman, K.; Salem, M.E.; Soldato, D.; Seeber, A.; Goldberg, R.M.; Shields, A.F.; Xiu, J.; Battaglin, F.; Berger, M.D.; et al. Comprehensive Genomic Profiling of Gastroenteropancreatic Neuroendocrine Neoplasms (GEP-NENs). Clin. Cancer Res. 2020, 26, 5943–5951. [Google Scholar] [CrossRef]
  39. Lee, S.M.; Sung, C.O. Comprehensive analysis of mutational and clinicopathologic characteristics of poorly differentiated colorectal neuroendocrine carcinomas. Sci. Rep. 2021, 11, 6203. [Google Scholar] [CrossRef]
  40. Yachida, S.; Totoki, Y.; Noë, M.; Nakatani, Y.; Horie, M.; Kawasaki, K.; Nakamura, H.; Saito-Adachi, M.; Suzuki, M.; Takai, E.; et al. Comprehensive Genomic Profiling of Neuroendocrine Carcinomas of the Gastrointestinal System. Cancer Discov. 2022, 12, 692–711. [Google Scholar] [CrossRef]
  41. Idrees, K.; Padmanabhan, C.; Liu, E.; Guo, Y.; Gonzalez, R.S.; Berlin, J.; Dahlman, K.B.; Beauchamp, R.D.; Shi, C. Frequent BRAF mutations suggest a novel oncogenic driver in colonic neuroendocrine carcinoma. J. Surg. Oncol. 2018, 117, 284–289. [Google Scholar] [CrossRef] [PubMed]
Figure 1. Consort diagram of the study, showing the allocation of patients in the “Chemotherapy cohort” and in the “NGS cohort”.
Diagnostics 13 01595 g001
Figure 2. Box and whiskers plot of Ki67 by objective response in the chemotherapy cohort.
Diagnostics 13 01595 g002
Figure 3. (A) Receiving operator characteristics (ROC) curve of objective response by Ki67 cutoffs. Youden’s point is represented by a red dot. (B) Objective response rate, (C) progression-free survival (PFS), and (D) overall survival (OS) estimates using the Kaplan–Meier method to chemotherapy by Ki67 cutoff of 40%.
Diagnostics 13 01595 g003
Figure 4. (A) Objective response rate (ORR), (B) progression-free survival (PFS), and (C) overall survival (OS) estimates using the Kaplan–Meier method to FOLFOX/XELOX chemotherapy.
Diagnostics 13 01595 g004
Figure 5. OncoPrint plot of mutations in the NGS cohort. Only genes altered in at least one sample are displayed. NA: not available. “Other” primary site category includes lung (n = 1), rectum (n = 1), and ovary (n = 1).
Diagnostics 13 01595 g005
Table 1. Characteristics of patients in the chemotherapy cohort by treatment regimen.
Overall
(N= 49)
CAPTEM
(N= 15)
FOLFOX/XELOX
(N= 34)
p
Age
Median [range]60.0 [18.0, 80.0]63.0 [39.0, 77.0]58.5 [18.0, 80.0]0.345
Site of primary
Pancreas32 (65.3%)10 (66.7%)22 (64.7%)1.00
GI17 (34.7%)5 (33.3%)12 (35.3%)
Stage
IIIB4 (8.16%)2 (13.3%)2 (5.88%)0.576
IV45 (91.8%)13 (86.7%)32 (94.1%)
Ki67
Median [range]30.0 [20.0, 50.0]28.0 [20.0, 48.5]30.0 [20.0, 50.0]0.599
18F-FDG-PET
Negative3 (11.5%)3 (30.0%)0 (0%)0.046
Positive23 (88.5%)7 (70.0%)16 (100%)
68Ga-DOTANOC-PET
Negative10 (25.0%)3 (27.3%)7 (24.1%)1.00
Positive30 (75.0%)8 (72.7%)22 (75.9%)
Concomitant use of SSA25 (51.0%)9 (60.0%)16 (47.1%)0.538
Table 2. Characteristics of patients in the NGS cohort.
Overall
(N = 13)
Age
Median [range]53.0 [18.0, 83.0]
Sex
Female6 (46%)
Male7 (54%)
Site of primary
Pancreas10 (77%)
Other *3 (33%)
Stage
IIIB5 (38%)
IV8 (62%)
Ki67
Median [range]26.5 [21.0, 35.0]
18F-FDG-PET/CT
Negative1 (11%)
Positive8 (89%)
68Ga-DOTANOC-PET/CT
Negative0 (0%)
Positive10 (100%)
Chemotherapy
FOLFOX/XELOX6 (46%)
CAPTEM10 (69%)
* includes lung (n = 1), rectum (n = 1), and ovary (n = 1).
Disclaimer/Publisher’s Note: The statements, opinions and data contained in all publications are solely those of the individual author(s) and contributor(s) and not of MDPI and/or the editor(s). MDPI and/or the editor(s) disclaim responsibility for any injury to people or property resulting from any ideas, methods, instructions or products referred to in the content.

