Abstract
A wireless, wearable Doppler ultrasound offers a new paradigm for linking physiology to resuscitation medicine. To this end, the image analysis of simultaneously-acquired venous and arterial Doppler spectrograms attained by wearable ultrasound represents a new source of hemodynamic data. Previous investigators have reported a direct relationship between the central venous pressure (CVP) and the ratio of the internal jugular-to-common carotid artery diameters. Because Doppler power is directly related to the number of red cell scatterers within a vessel, we hypothesized that (1) the ratio of internal jugular-to-carotid artery Doppler power (V/APOWER) would be a surrogate for the ratio of the vascular areas of these two vessels and (2) the V/APOWER would track the anticipated CVP change during simulated hemorrhage and resuscitation. To illustrate this proof-of-principle, we compared the change in V/APOWER obtained via a wireless, wearable Doppler ultrasound to B-mode ultrasound images during a head-down tilt. Additionally, we elucidated the change in the V/APOWER during simulated hemorrhage and transfusion via lower body negative pressure (LBNP) and release. With these Interesting Images, we show that the Doppler V/APOWER ratio qualitatively tracks anticipated changes in CVP (e.g., cardiac preload) which is promising for both diagnosis and management of hemodynamic unrest.
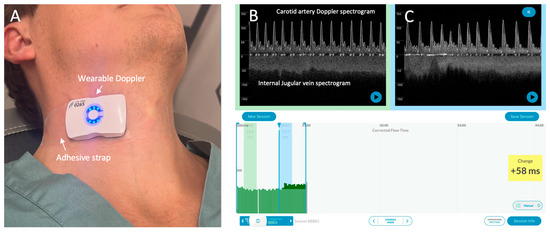
Figure 1.
The wireless, wearable Doppler system [1,2]. (A) The wearable Doppler transducer adhered on a healthy volunteer. (B) The graphical user interface (GUI) of the Doppler system. The carotid and internal jugular spectrograms are shown in baseline section of a hemodynamic assessment. (C) shows the spectrograms from the same subject during a preload augmentation.
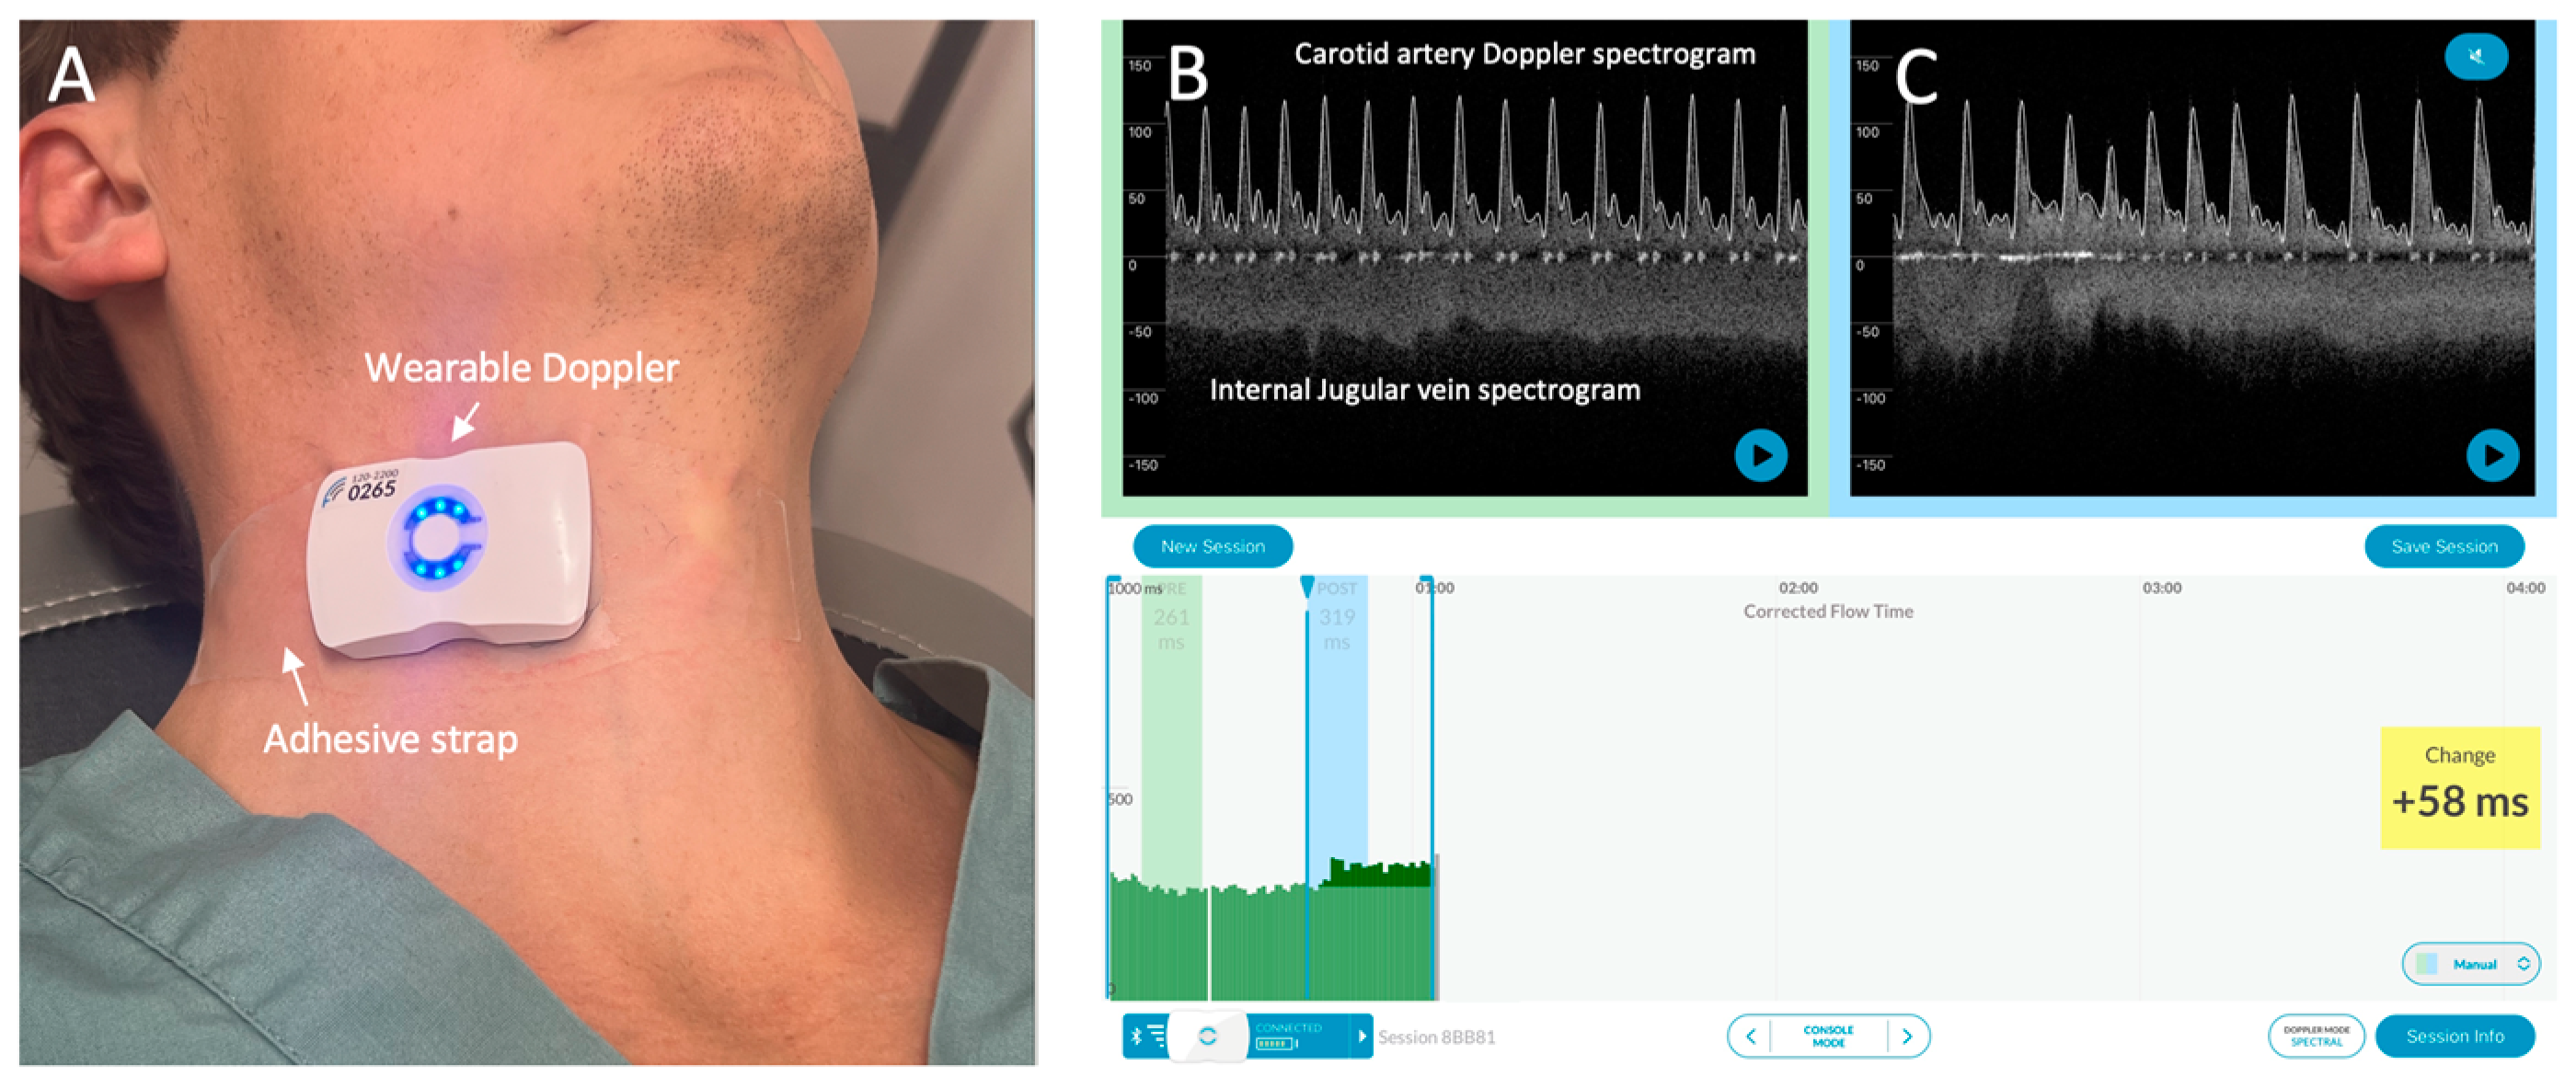
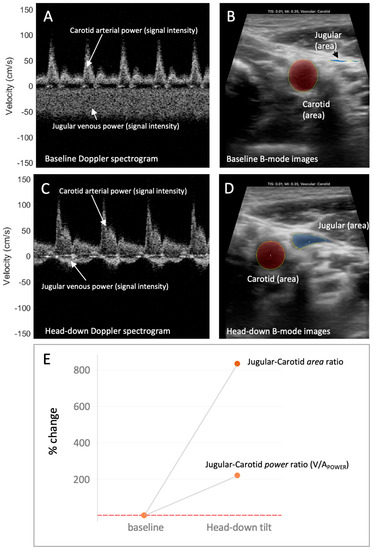
Figure 2.
The venous–arterial power (V/APOWER) index and relation to venous–arterial area during increased preload. (A) The jugular venous and carotid arterial Doppler spectrograms during low preload condition (i.e., baseline, fully upright). The Doppler power relates to the “brightness” or “intensity” of the signal. Here, the jugular power (intensity) compared to the carotid power (intensity) is relatively low. (B) The jugular venous and carotid arterial vascular area during low preload condition (i.e., baseline, fully upright). Here, the jugular relative to carotid area is also low. (C) The jugular venous and carotid arterial Doppler spectrograms during high preload condition (i.e., head-down). The jugular power (intensity) relative to the carotid power (intensity) has increased. (D) The jugular venous and carotid arterial vascular area during high preload condition (i.e., head-down). Here, the jugular relative to carotid area has increased. (E) The change in the jugular–carotid (i.e., venous–arterial, V/A) Doppler power ratio and jugular–carotid (i.e., venous–arterial) area ratio from low preload (i.e., upright, baseline) to high preload (i.e., head-down) conditions. The jugular vein-to-carotid artery area ratio is a surrogate for central venous pressure [3,4].
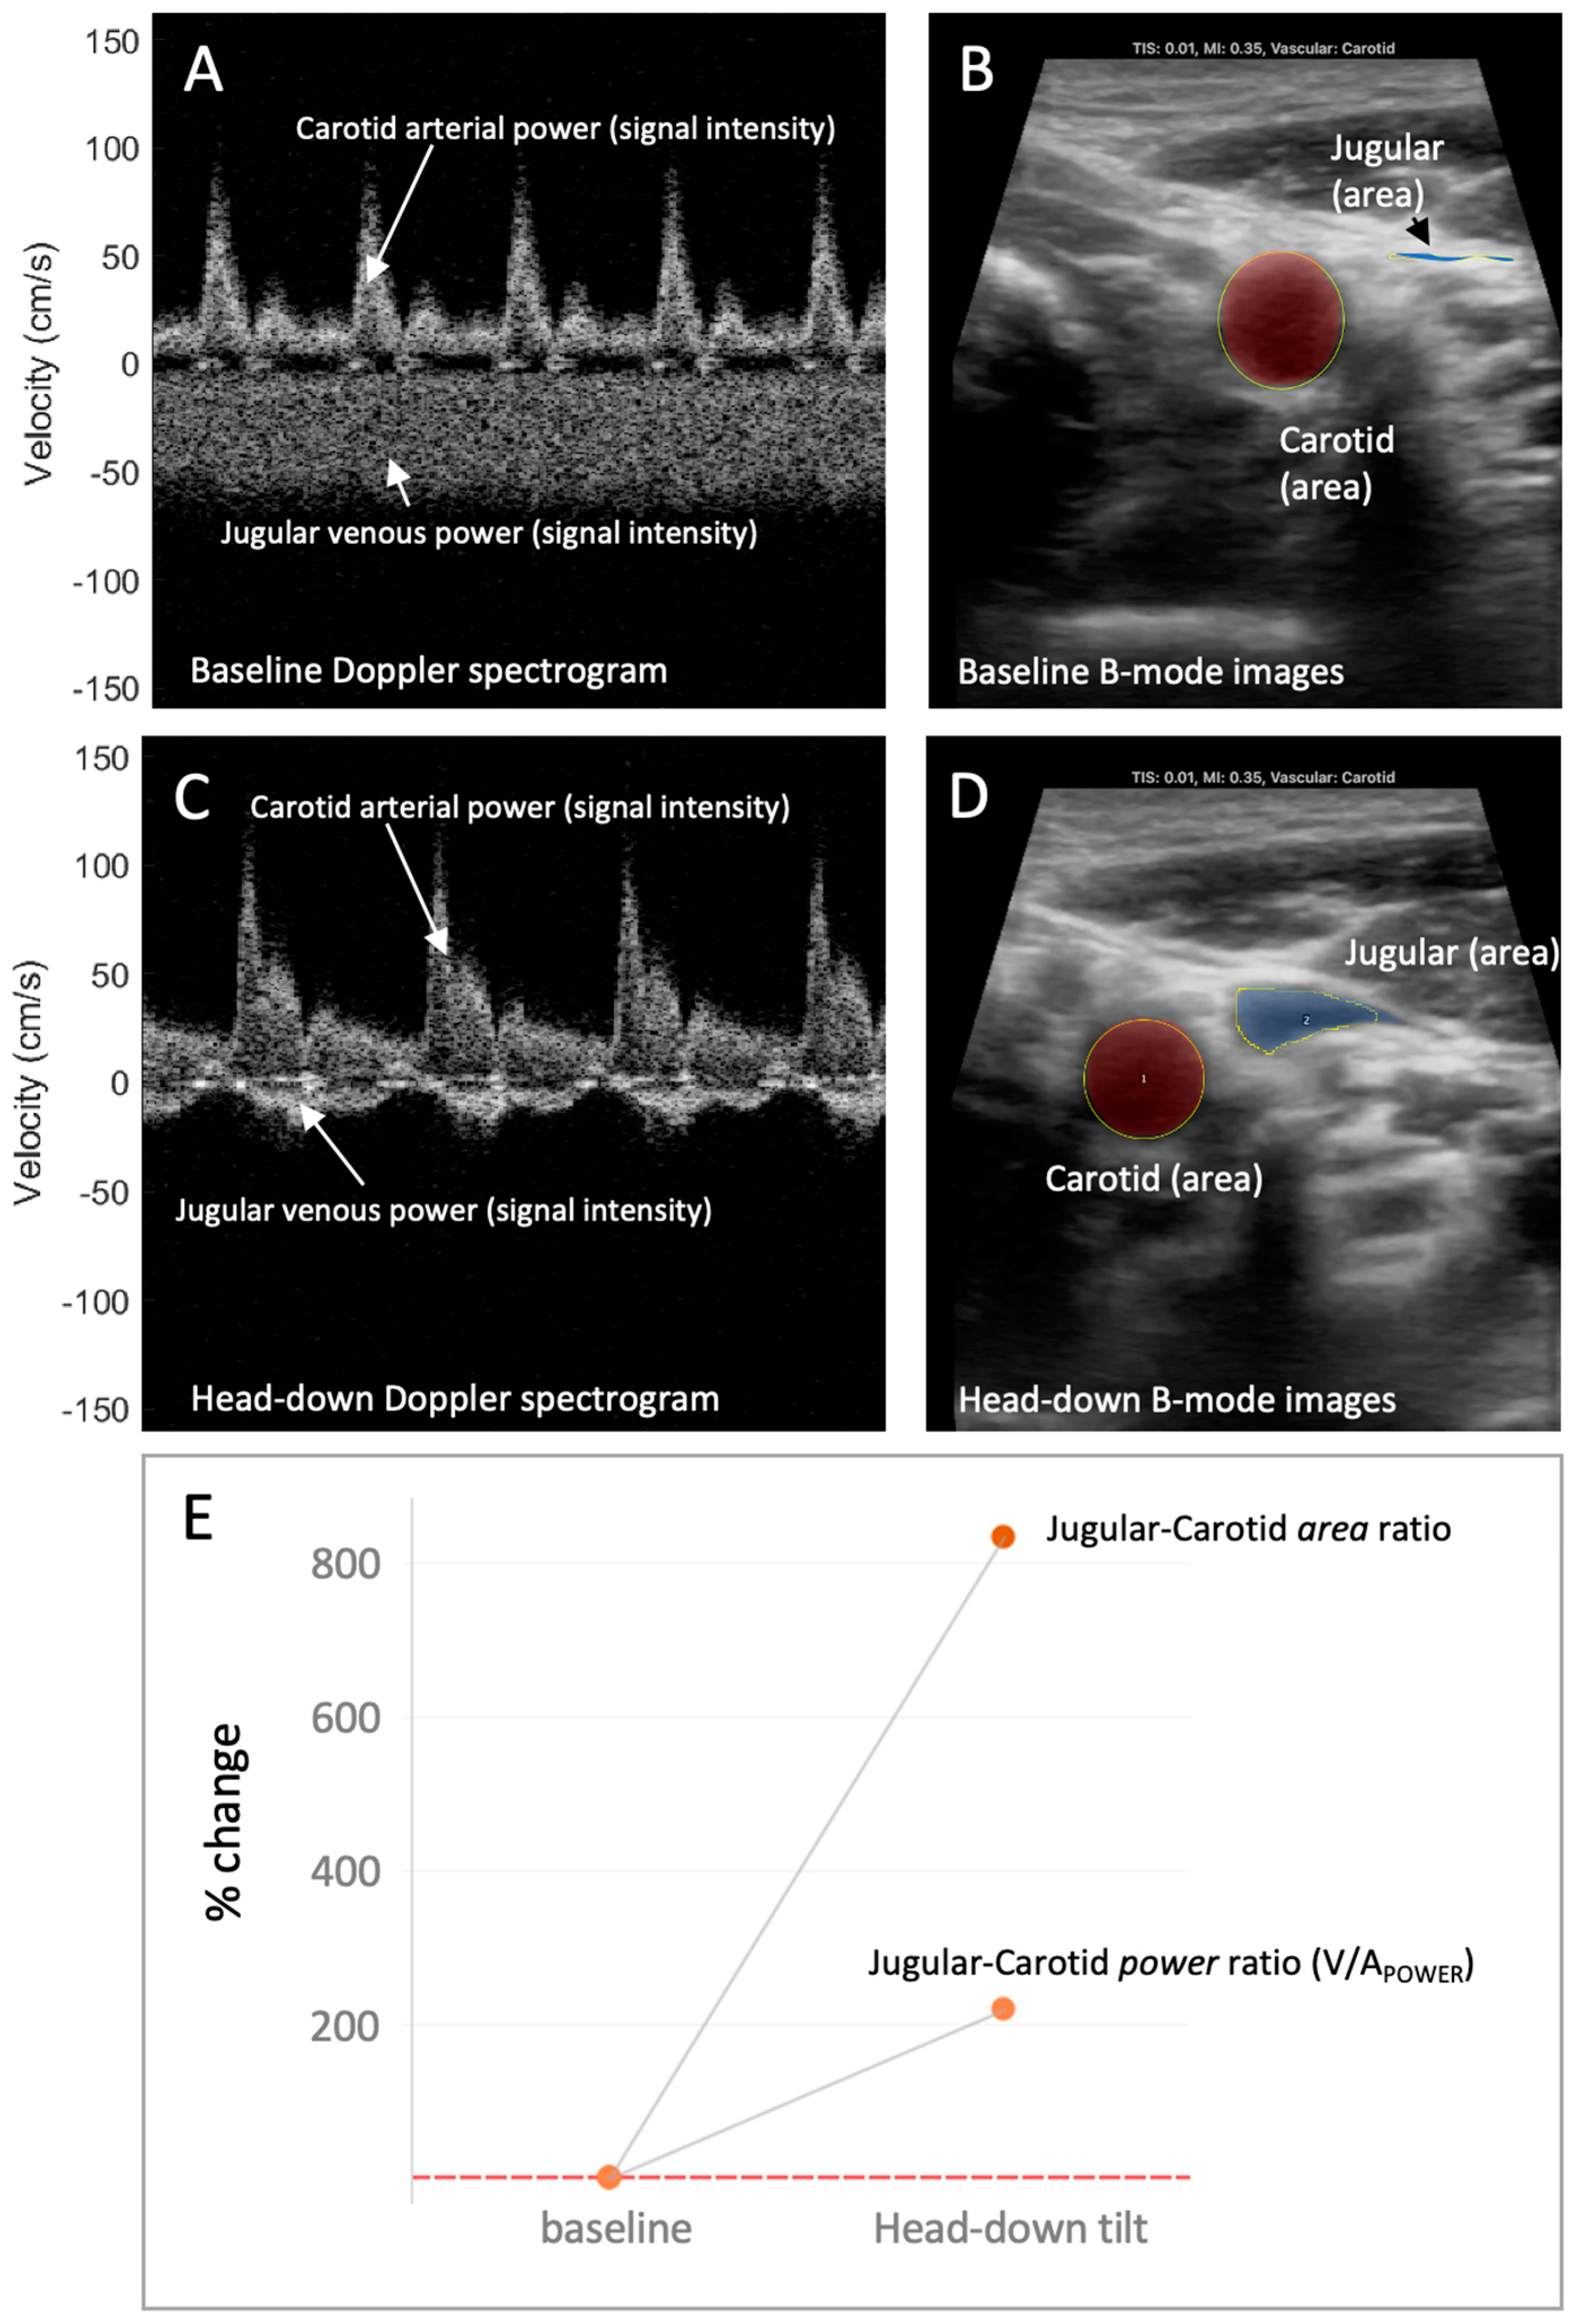
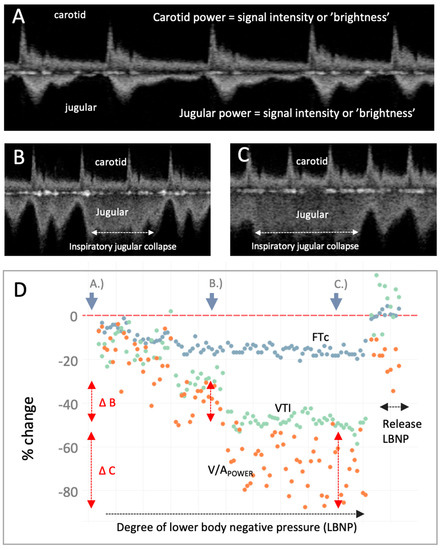
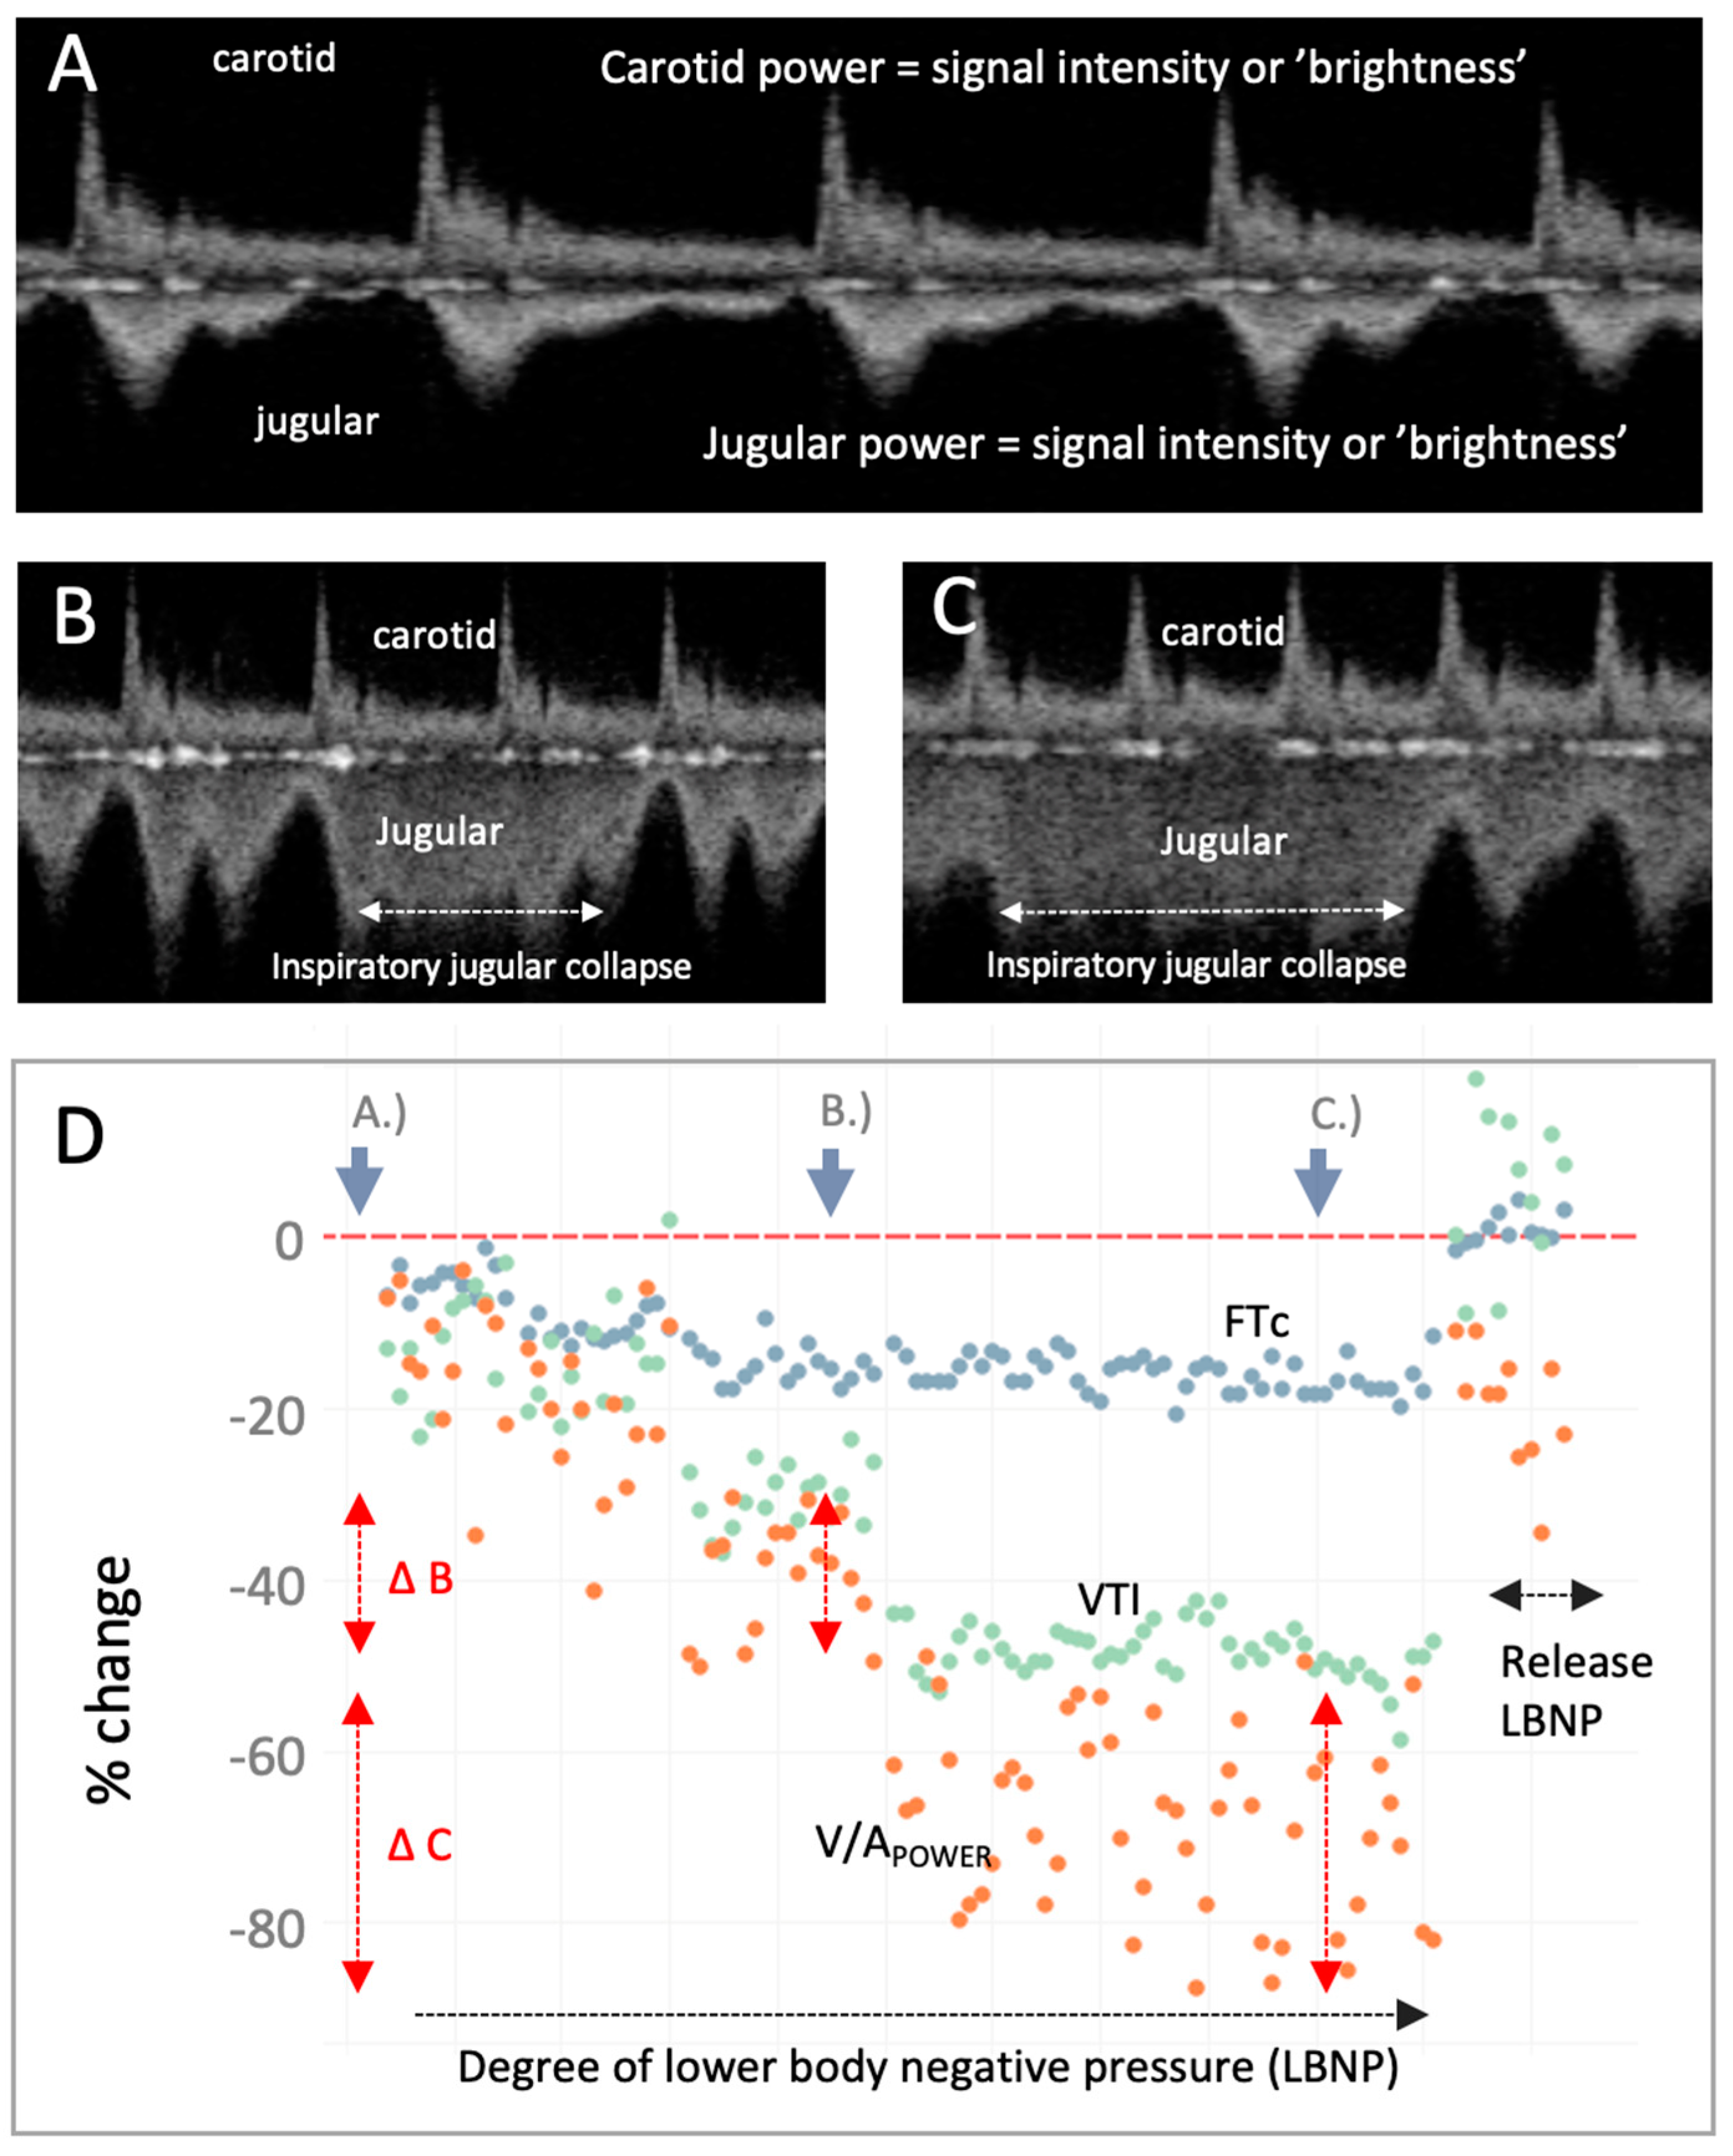
Figure 3.
The venous–arterial power (V/APOWER) index during moderate-to-severe central hypovolemia and resuscitation. (A) Carotid and jugular spectrograms during resting, supine baseline. (B) Carotid and jugular spectrograms midway through the lower body negative pressure (LBNP) protocol which induces mild-to-moderate central hypovolemia. The jugular spectrogram has a reduced power relative to the carotid (i.e., decreased V/APOWER) consistent with decreasing jugular vein-to-carotid artery area. (C) Carotid and jugular spectrograms during late LBNP which induces moderate-to-severe central hypovolemia; the V/APOWER has observably fallen further. Partial jugular collapse with inspiration is marked as the higher, less-distinct velocity pattern. (D) Plot of V/APOWER (orange dots) during progressively severe LBNP and release. The portions of the LBNP protocol from which the displayed Doppler spectrograms were obtained are indicated on the graphic (resting baseline is far left, increasing central hypovolemia progresses rightwards followed by LBNP release which induces rapid central blood volume expansion). V/APOWER falls as the degree of LBNP intensifies, intimating falling jugular-to-carotid area ratio (i.e., diminishing CVP), as anticipated [5]. While total V/APOWER is falling, there is increasing V/APOWER variability from baseline (i.e., point A.) to mild-to-moderate central hypovolemia at point B. (i.e., vertical red arrows, ∆B) to moderate-to-severe central hypovolemia at point C. (i.e., ∆C); this illustrates inspiratory collapse and expiratory distension of the jugular vein. Corrected flow time (FTc, blue dots) and velocity time integral (VTI, green dots) of the carotid artery are measures from the carotid artery Doppler spectrogram and are stroke volume (SV) surrogates [6,7,8,9]. With LBNP release (i.e., auto-transfusion), V/APOWER increases consistent with rising CVP; so, too, do the measured SV surrogates. To further our conclusions, especially given known inter-observer variability when assessing vascular dimensions [10], comparing 3-dimensional vessel area [11] to V/APOWER and validating this ratio against computational models [12] will improve confidence in its physiological fidelity.
Author Contributions
J.-E.S.K.: conceptualization, methodology, drafting; M.E.: software, validation, investigation, resources, review and editing; Z.Y.: software, validation, investigation, resources, review and editing; G.C.: software, validation, investigation, resources, review and editing; C.E.M.: software, validation, investigation, resources, review and editing; A.M.E.: investigation, resources, project administration, funding, review, editing; J.K.E.: conceptualization, investigation, resources, review, editing; C.-H.K.: project administration, data curation, resources, review and editing; J.L.T.: project administration, data curation, resources, review and editing; B.D.J.: project administration, data curation, resources, review and editing, supervision. All authors have read and agreed to the published version of the manuscript.
Funding
This work was supported by the Office of the Assistant Secretary of Defense for Health Affairs, through the Congressionally Directed Medical Research Program under Award No. W81XWH1910591. Opinions, interpretations, conclusions and recommendations are those of the authors and are not necessarily endorsed by the Department of Defense.
Institutional Review Board Statement
The study was conducted in accordance with the Declaration of Helsinki, and approved by the Institutional Review Board of the Mayo Clinic (IRB number 19-010136; 17 January 2020).
Informed Consent Statement
Informed consent was obtained from all subjects involved.
Data Availability Statement
Data available upon reasonable request.
Conflicts of Interest
J.-E.S.K., M.E., Z.Y., G.C., C.E.M., A.M.E. and J.K.E. are employees of Flosonics Medical, a start-up building the wearable ultrasound, C.-H.K., J.L.T. and B.D.J. report no conflict.
References
- Kenny, J.-É.S.; Munding, C.E.; Eibl, J.K.; Eibl, A.M.; Long, B.F.; Boyes, A.; Yin, J.; Verrecchia, P.; Parrotta, M.; Gatzke, R. A novel, hands-free ultrasound patch for continuous monitoring of quantitative Doppler in the carotid artery. Sci. Rep. 2021, 11, 7780. [Google Scholar] [CrossRef] [PubMed]
- Kenny, J.-É.S.; Munding, C.E.; Eibl, A.M.; Eibl, J.K. Wearable ultrasound and provocative hemodynamics: A view of the future. Crit. Care 2022, 26, 329. [Google Scholar] [CrossRef] [PubMed]
- Hossein-Nejad, H.; Mohammadinejad, P.; Ahmadi, F. Internal jugular vein/common carotid artery cross-sectional area ratio and central venous pressure. J. Clin. Ultrasound 2016, 44, 312–318. [Google Scholar] [CrossRef] [PubMed]
- Kenny, J.-E.S.; Prager, R.; Rola, P.; McCulloch, G.; Eibl, J.K.; Haycock, K. The effect of gravity-induced preload change on the venous excess ultrasound (VExUS) score and internal jugular vein Doppler in healthy volunteers. Intensive Care Med. Exp. 2023, 11, 19. [Google Scholar] [CrossRef] [PubMed]
- Hinojosa-Laborde, C.; Shade, R.E.; Muniz, G.W.; Bauer, C.; Goei, K.A.; Pidcoke, H.F.; Chung, K.K.; Cap, A.P.; Convertino, V.A. Validation of lower body negative pressure as an experimental model of hemorrhage. J. Appl. Physiol. 2014, 116, 406–415. [Google Scholar] [CrossRef] [PubMed]
- Kenny, J.-É.S.; Barjaktarevic, I.; Mackenzie, D.C.; Elfarnawany, M.; Yang, Z.; Eibl, A.M.; Eibl, J.K.; Kim, C.-H.; Johnson, B.D. Carotid artery velocity time integral and corrected flow time measured by a wearable Doppler ultrasound detect stroke volume rise from simulated hemorrhage to transfusion. BMC Res. Notes 2022, 15, 7. [Google Scholar] [CrossRef] [PubMed]
- Kenny, J.-É.S.; Barjaktarevic, I.; Mackenzie, D.C.; Elfarnawany, M.; Yang, Z.; Eibl, A.M.; Eibl, J.K.; Kim, C.-H.; Johnson, B.D. Carotid Doppler ultrasonography correlates with stroke volume in a human model of hypovolaemia and resuscitation: Analysis of 48,570 cardiac cycles. Br. J. Anaesth. 2021, 127, e60–e63. [Google Scholar] [CrossRef] [PubMed]
- Kenny, J.-É.S.; Barjaktarevic, I.; Mackenzie, D.C.; Eibl, A.M.; Parrotta, M.; Long, B.F.; Eibl, J.K. Diagnostic characteristics of 11 formulae for calculating corrected flow time as measured by a wearable Doppler patch. Intensive Care Med. Exp. 2020, 8, 54. [Google Scholar] [CrossRef] [PubMed]
- Barjaktarevic, I.; Toppen, W.E.; Hu, S.; Montoya, E.A.; Ong, S.; Buhr, R.; David, I.J.; Wang, T.; Rezayat, T.; Chang, S.Y. Ultrasound Assessment of the Change in Carotid Corrected Flow Time in Fluid Responsiveness in Undifferentiated Shock. Crit. Care Med. 2018, 11, 1040–1046. [Google Scholar] [CrossRef] [PubMed]
- Leng, X.; Lan, L.; Ip, V.H.L.; Liu, H.; Abrigo, J.; Liebeskind, D.S.; Wong, L.K.S.; Leung, T.W. Noninvasive fractional flow in intracranial atherosclerotic stenosis: Reproducibility, limitations, and perspectives. J. Neurol. Sci. 2017, 381, 150–152. [Google Scholar] [CrossRef] [PubMed]
- Liu, H.; Wingert, A.; Wang, J.A.; Zhang, J.; Wang, X.; Sun, J.; Chen, F.; Khalid, S.G.; Jiang, J.; Zheng, D. Extraction of Coronary Atherosclerotic Plaques From Computed Tomography Imaging: A Review of Recent Methods. Front. Cardiovasc. Med. 2021, 8, 597568. [Google Scholar] [CrossRef] [PubMed]
- Liu, H.; Pan, F.; Lei, X.; Hui, J.; Gong, R.; Feng, J.; Zheng, D. Effect of intracranial pressure on photoplethysmographic waveform in different cerebral perfusion territories: A computational study. Front. Physiol. 2023, 14, 373. [Google Scholar] [CrossRef] [PubMed]
Disclaimer/Publisher’s Note: The statements, opinions and data contained in all publications are solely those of the individual author(s) and contributor(s) and not of MDPI and/or the editor(s). MDPI and/or the editor(s) disclaim responsibility for any injury to people or property resulting from any ideas, methods, instructions or products referred to in the content. |
© 2023 by the authors. Licensee MDPI, Basel, Switzerland. This article is an open access article distributed under the terms and conditions of the Creative Commons Attribution (CC BY) license (https://creativecommons.org/licenses/by/4.0/).