Abstract
We developed a novel quantification method named “shape feature” by combining the features of amyloid positron emission tomography (PET) and brain magnetic resonance imaging (MRI) and evaluated its significance in predicting the conversion from mild cognitive impairment (MCI) to Alzheimer’s disease (AD) in the Alzheimer’s Disease Neuroimaging Initiative (ADNI) cohort. From the ADNI database, 334 patients with MCI were included. The brain amyloid smoothing score (AV45_BASS) and brain atrophy index (MR_BAI) were calculated using the surface area and volume of the region of interest in AV45 PET and MRI. During the 48-month follow-up period, 108 (32.3%) patients converted from MCI to AD. Age, Mini-Mental State Examination (MMSE), cognitive subscale of the Alzheimer’s Disease Assessment Scale (ADAS-cog), apolipoprotein E (APOE), standardized uptake value ratio (SUVR), AV45_BASS, MR_BAI, and shape feature were significantly different between converters and non-converters. Univariate analysis showed that age, MMSE, ADAS-cog, APOE, SUVR, AV45_BASS, MR_BAI, and shape feature were correlated with the conversion to AD. In multivariate analyses, high shape feature, SUVR, and ADAS-cog values were associated with an increased risk of conversion to AD. In patients with MCI in the ADNI cohort, our quantification method was the strongest prognostic factor for predicting their conversion to AD.
1. Introduction
Significant efforts are underway to identify and develop reliable biomarkers for Alzheimer’s disease (AD), to allow the targeting of those individuals who would most benefit from early treatment intervention [1], particularly those with mild cognitive impairment (MCI) [2,3]. However, because the etiology of MCI is heterogeneous, the rate of cognitive decline varies considerably across patients with MCI, and some do not convert to AD [4]. Thus, identifying patients with MCI who would benefit from treatment is essential [5]. It is widely assumed that imaging biomarkers for predicting conversion from MCI to AD are grouped into those based on beta-amyloid deposition, pathological tau, or neurodegeneration [6]. Amyloid positron emission tomography (PET) radiotracers, such as F-18 flutemetamol, F-18 florbetapir (AV-45), and F-18 florbetaben, have been developed for the assessment of beta-amyloid deposition in the brain [7,8,9]. Additionally, measures of brain atrophy on magnetic resonance imaging (MRI) have been used as biomarkers of neurodegeneration or neuronal injury [6,10,11].
As MCI progresses, brain atrophy increases and the shape of the brain changes on MRI. However, biomarkers of neurodegeneration cannot be used directly to represent the pathophysiological process of AD because they exhibit topographical overlap with non-AD pathologies [6,12]. Amyloid PET is correlated with the presence and density of amyloid deposition [8,9] and has been shown to be a predictor of future cognitive decline [13]. As amyloid deposition increases, the cortical uptake of amyloid radiotracers increases, and cortical gray–white matter differentiation is no longer possible on amyloid PET images. Furthermore, the cortical shape changes to a smoother form, and the differentiation of the gyral cerebrospinal fluid space on amyloid PET images is reduced by partial volume effects [14,15]. Studies have used each biomarker type to predict the conversion from MCI to AD; however, only a few studies have integrated amyloid and neurodegenerative markers. Obtaining integrated biomarkers that combine information from both beta-amyloid deposition on amyloid PET and brain atrophy on MRI would enhance the predictive power of these biomarkers. Therefore, developing quantification methods that combine information from various biomarkers is necessary. We hypothesized that the predictive power of biomarkers would be significantly enhanced if we used an integrated biomarker that combined information from beta-amyloid deposition on amyloid PET and brain atrophy on MRI.
In this study, we developed a novel shape feature quantification method for AV-45 PET and brain MRI and evaluated its prognostic significance in predicting the conversion from MCI to AD in patients from the Alzheimer’s Disease Neuroimaging Initiative (ADNI) cohort.
2. Materials and Methods
2.1. Patients
Data were obtained from patients recruited to the ADNI with available baseline data on AV-45 PET and MRI (http://ida.loni.usc.edu accessed on 6 September 2023). The ADNI was launched in 2003 as a public–private partnership, under the guidance of Principal Investigator Michael W. Weiner, MD, from VA Medical Center and the University of California in San Francisco, CA, USA. Patients were recruited from over 50 sites across the USA and Canada. The primary purpose of the ADNI was to test whether serial MRI, PET, other biological markers, and clinical and neuropsychological assessments could be combined to measure the progression of MCI and early AD (for up-to-date information, please refer to http://www.adni-info.org accessed on 6 September 2023). Written informed consent for cognitive testing and neuroimaging was obtained from all patients before their participation, and the procedures were approved by the Institutional Review Boards of all participating institutions.
For this study, 334 patients with MCI with baseline AV-45 PET data, baseline brain MRI data, and 4-year follow-up clinical evaluation data were selected. These patients were grouped into MCI converters or non-converters based on whether they had converted to AD within the 4-year follow-up period. The cognitive function of the patients was evaluated using the Clinical Dementia Rating Sum of Boxes (CDR-SB), Alzheimer’s Disease Assessment Scale–Cognitive Subscale (ADAS-cog), Functional Activities Questionnaire (FAQ), and Mini-Mental State Examination (MMSE).
2.2. AV-45 PET/CT and MRI
All PET and MRI data were retrieved from the ADNI database in the most advanced preprocessed stage. AV-45 PET images were acquired 50–70 min after the injection of F-18 AV-45 370 MBq (10 mCi); the images were then co-registered to each other, averaged across time frames, and standardized to the same voxel size (1.5 × 1.5 × 1.5 mm). The images were acquired at the 57 sites participating in the ADNI, and scanner-specific smoothing was applied. Because of the lack of scaling or warping processes, brain size and shape were not altered after preprocessing. For MRI, imaging was performed at 3T using T1-weighted imaging parameters. T1-weighted magnetization-prepared rapid gradient-echo sequences were used to correct image geometry distortion and image intensity nonuniformity, and a histogram peak sharpening algorithm was used. The postprocessed images used for the analysis in this study can be downloaded from the ADNI database.
2.3. Quantitative PET Image Analysis
The semiautomatic quantification of brain beta-amyloid deposition was performed using the brain amyloid smoothing score (BASS), which was calculated using the following formula:
where VOI is the volume of interest and VOI t50% is the VOI segmented with a standardized uptake value (SUV) threshold of 50%.
The postprocessed images received from ADNI were converted to a file with the filename extension “nii”. The segmented brain was generated by combining segmented gray and white matter images using the SPM12 software package (https://www.fil.ion.ucl.ac.uk/spm/ accessed on 6 September 2023) running within MATLAB 2022a (MathWorks, Cambridge, UK). The algorithm was described in a unified segmentation paper [16]. A mask image was created using a gray matter image plus a white matter image with a threshold of 50%. Using the “regionprops3” function within MATLAB 2022a (MathWorks, Cambridge, UK), we calculated the surface area and volume of the mask image and selected the largest value. We calculated the volume and surface area of the AV45 image by considering the voxel size. The BASS value was derived using Formula (1).
The rationale for the definition of the BASS is as follows. Because a sphere is a three-dimensional object with the smallest surface area for a given fixed volume, a VOI with a smoother, more sphere-like surface would have a higher BASS value (Figure 1). When a receiver operating characteristic (ROC) value was calculated using BASS values and conversion using thresholds of 30%, 40%, 50%, 60%, and 70%, the area under the ROC curve (AUC) value was highest at the threshold of 50%, and this value was used (Figure A1).

Figure 1.
Representative segmentations used to measure the BASS and BAI. The volume of interest (VOI) from a patient with conversion to AD showed a smooth surface on AV-45 PET (high BASS score) and an irregular surface on brain MRI (high BAI score) (A). The VOI from a patient without conversion to AD showed a sharp surface on AV-45 PET (low BASS score) and a regular surface on brain MRI (low BAI score) (B). The VOI from a patient with conversion to AD showing a smooth surface on AV-45 PET (high BASS score) and a regular surface on brain MRI (low BAI score) (C). The VOI from a patient with conversion to AD showed a sharp surface on AV-45 PET (low BASS score) and an irregular surface on brain MRI (high BAI score) (D). Abbreviations: BASS, brain amyloid smoothing score; BAI, brain atrophic index; AV-45, F-18 florbetapir; SUVR, standardized uptake value ratio; AD, Alzheimer’s disease.
To acquire the SUV ratio (SUVR) from the PET images, baseline structural MRIs were first co-registered with each participant’s AV-45 PET images. These images were then used to extract the mean weighted cortical retention uptake from the frontal, parietal, cingulate, and temporal regions. The SUVR was calculated using a composite reference region comprising the entire cerebellum, pons, and eroded subcortical white matter [17].
2.4. Quantitative MRI Analysis
A semiautomatic quantification of brain atrophy was performed by calculating the brain atrophic index (BAI) using the following formula:
In MRIs, segmented gray matter and white matter images were also generated from postprocessed images received from the ADNI using the SPM12 software package (https://www.fil.ion.ucl.ac.uk/spm/ accessed on 6 September 2023) running within MATLAB 2022a (MathWorks, Cambridge, UK). A mask image was created using a gray matter image plus a white matter image. Using the “regionprops3” function within MATLAB 2022a (MathWorks, Cambridge, UK), we calculated the surface area and volume of the mask image and selected the largest value. We calculated the volume and surface area of the AV45 image by considering the voxel size. The BAI value was derived using Formula (2).
The rationale for the definition of the BAI is as follows. Because a sphere is a three-dimensional object with the smallest surface area for a given fixed volume, a VOI with a more irregular surface would have a higher BAI value (Figure 1).
2.5. Prediction of Cognitive Decline in Patients with MCI
A semiautomatic quantification of brain beta-amyloid deposition and brain atrophy was performed using the shape feature, which was calculated using the following formula:
When an ROC value was calculated using shape feature values and conversion using thresholds of 30%, 40%, 50%, 60%, and 70%, the AUC value was highest at the threshold of 50%, and this value was used (Figure A1). These longitudinal changes were calculated by comparing the measurements at 2-year follow-up visits with those acquired at baseline.
2.6. Statistical Analyses
Continuous data are expressed as means ± standard deviations, and categorical data are presented as frequencies. Continuous data analysis was performed using the independent sample t-test, and categorical data were analyzed using Pearson’s chi-square test. A comparison ROC curve was used to compare the parameters of the shape feature, BASS, BAI, and SUVR. Correlations between the shape feature and SUVR were assessed using Spearman’s rank correlation coefficient. ROC analysis was performed to identify the optimal conversion-predicting cutoff values for age, MMSE, ADAS-cog, apolipoprotein E4 (APOE4) levels, SUVR, AV45_BASS, MRI_BAI, and the shape feature. The univariate analysis of predictors of conversion was performed using the Kaplan–Meier method and log-rank test. A Cox proportional hazards model with a stepwise variable selection was used for multivariate analysis. Correlations between the shape feature and neuropsychological tests were assessed using Spearman’s rank correlation coefficient. MedCalc (Windows XP, version 12.3, Broekstraat, Mariakerke, Belgium) was used to perform all statistical analyses. p-values < 0.05 were used to denote statistical significance.
3. Results
3.1. Patient Characteristics
The mean age of the patients was 71.2 ± 7.1 years, and 108 (32.3%) of the 334 patients with MCI had converted to AD during the 48-month follow-up period. Conversion to AD was significantly associated with age, MMSE score, ADAS-cog score, and APOE4. No significant differences in sex and educational level were observed between converters and non-converters. The patient demographics are shown in Table 1.

Table 1.
Study population demographic characteristics.
3.2. Imaging Parameters
The mean SUVR, AV45_BASS, MR_BAI, and shape feature values were 1.22 ± 0.23, 0.40 ± 0.07, 3.98 ± 0.54, and 1.59 ± 0.33, respectively. Representative SUVR, AV45_BASS, MR_BAI, and shape feature examples are presented in Figure 1. SUVR, AV45_BASS, MR_BAI, and shape feature values were significantly higher in converters than in non-converters. The imaging parameters used in the 334 patients included in this study are summarized in Table 1.
3.3. ROC Curve Analysis
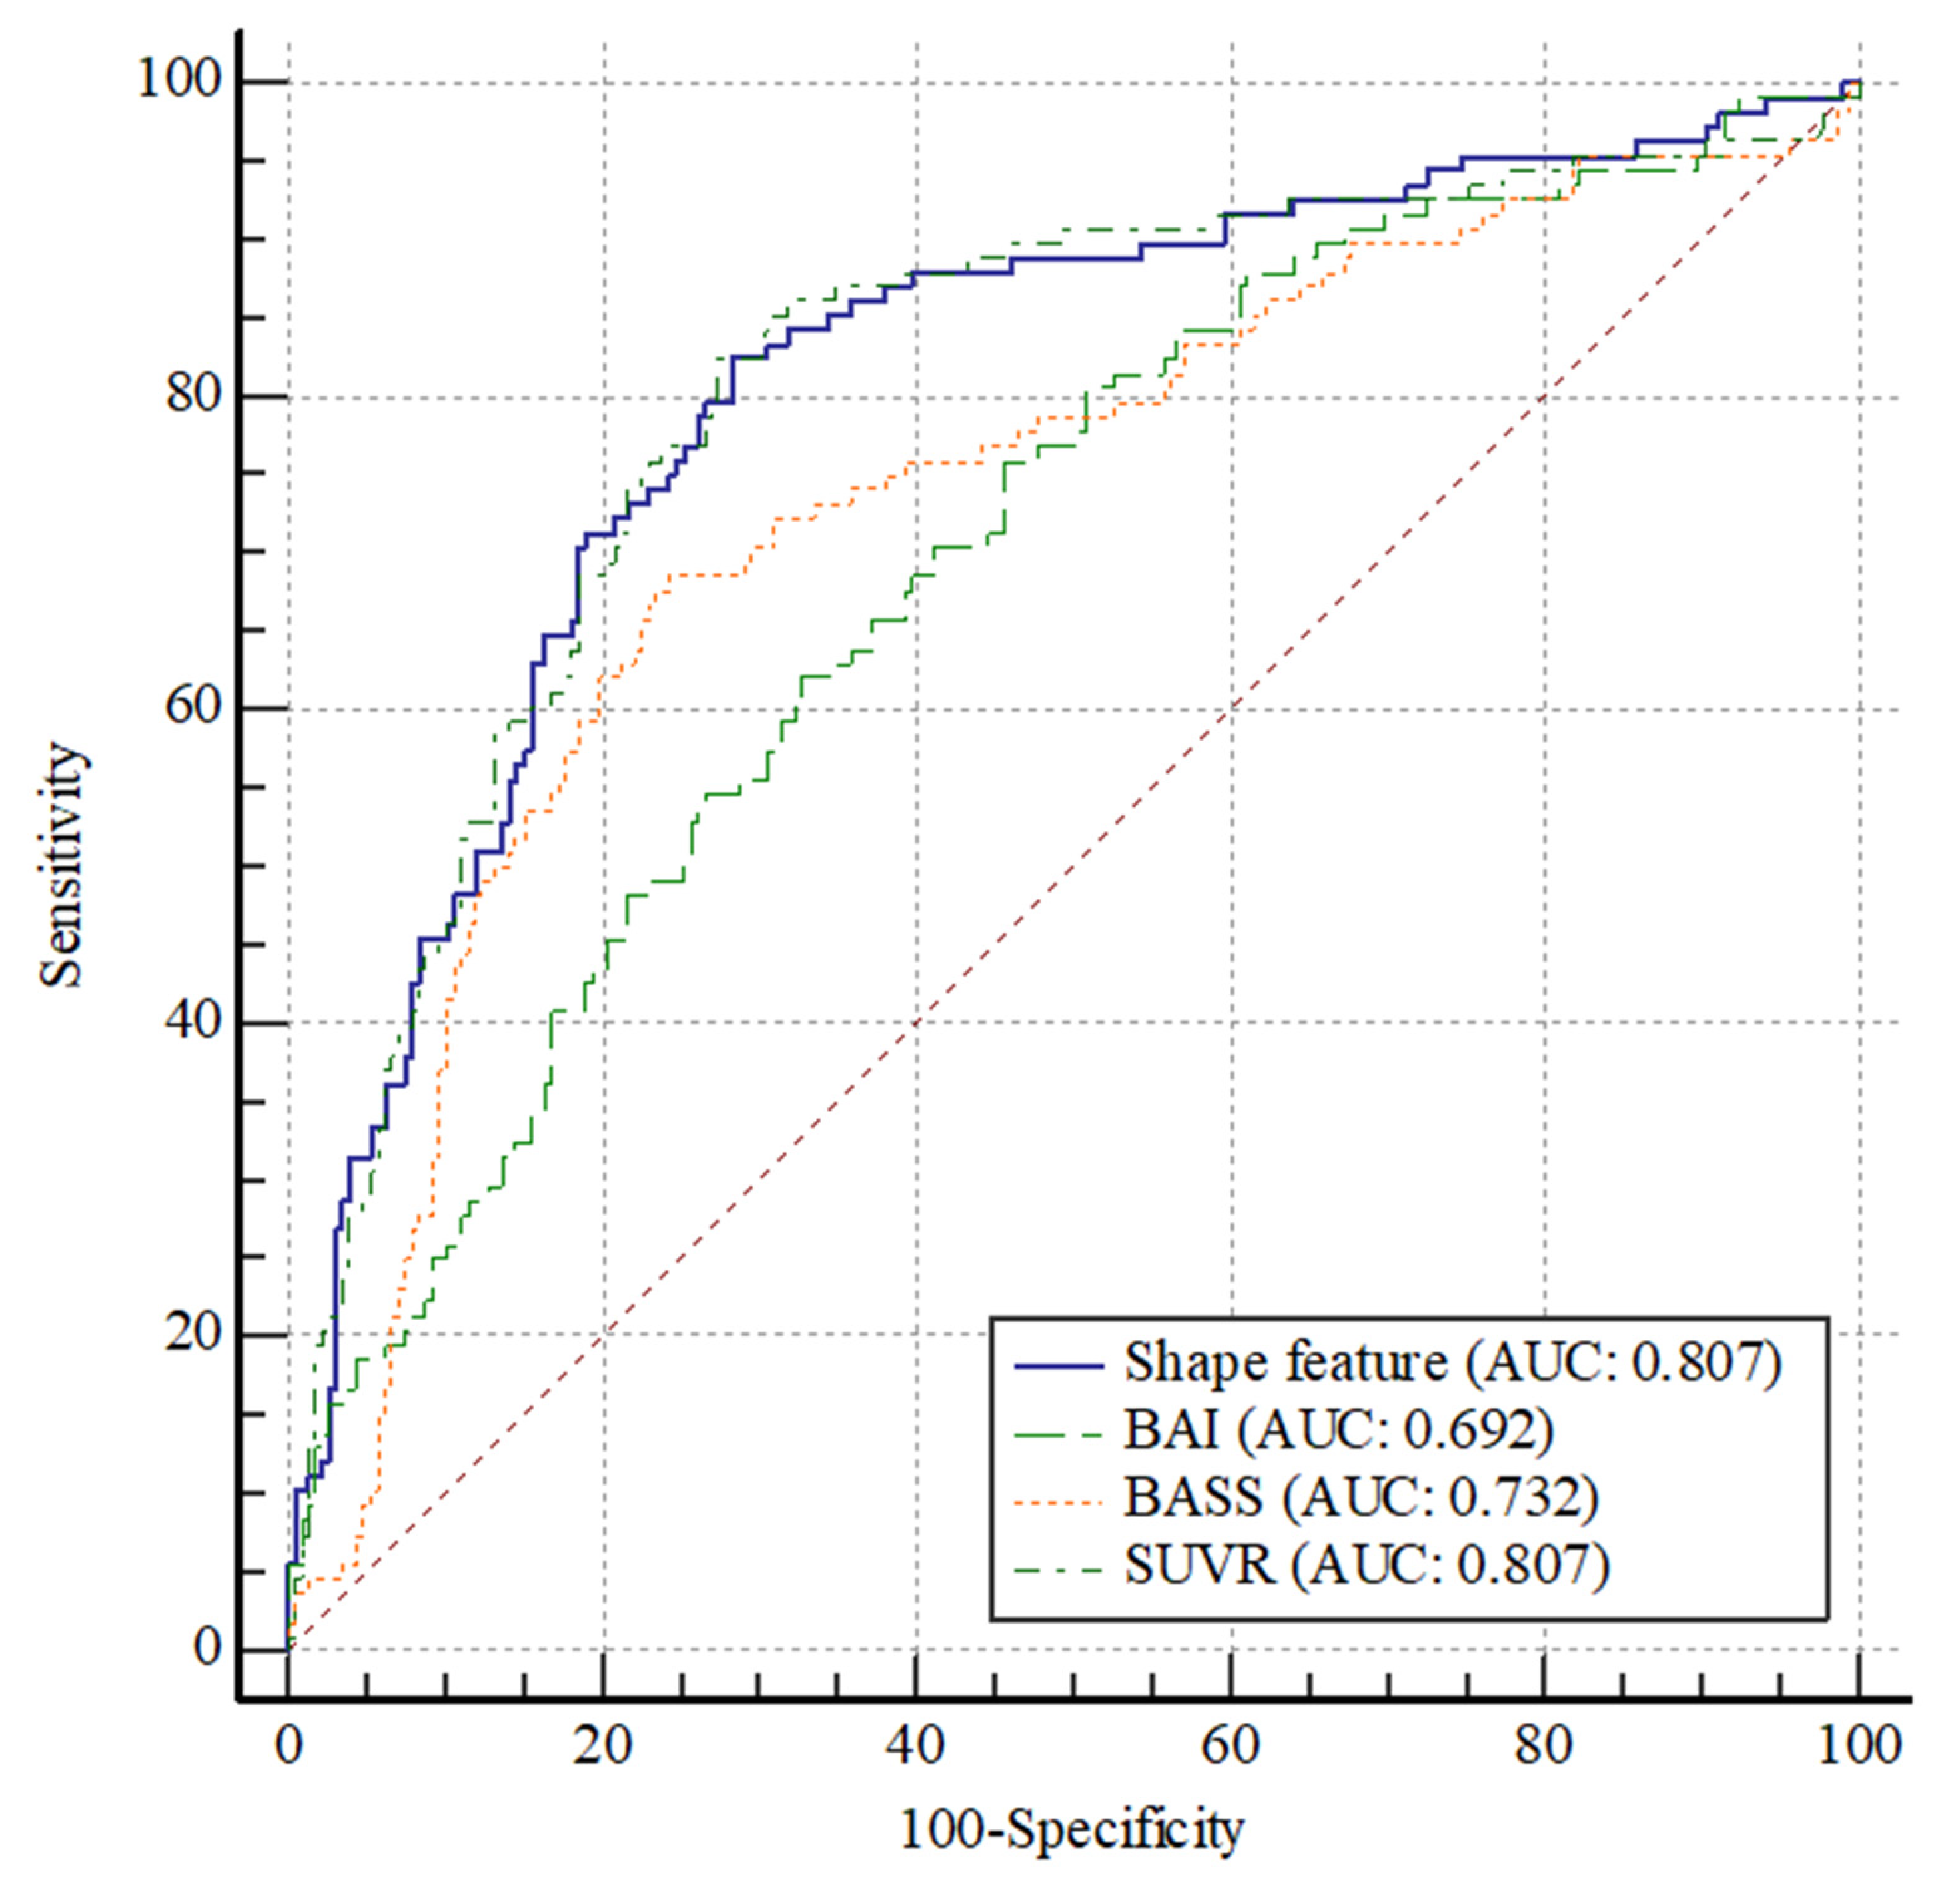
The usefulness of the SUVR, AV45_BASS, MR_BAI, and shape feature in the conversion to AD is presented by ROC curves (Figure 2 and Table 2). The ROC curves of the SUVR and shape feature were not significantly different (p = 0.994). Thus, the shape feature can be considered equivalent to SUVR. In contrast, a significant difference in the ROC curves was observed between SUVR and AV45_BASS (p = 0.001). SUVR was found to be a better parameter than AV45_BASS. Furthermore, a significant difference in the ROC curves was observed between SUVR and MR_BAI (p = 0.002), with SUVR being a better parameter than MR_BAI.
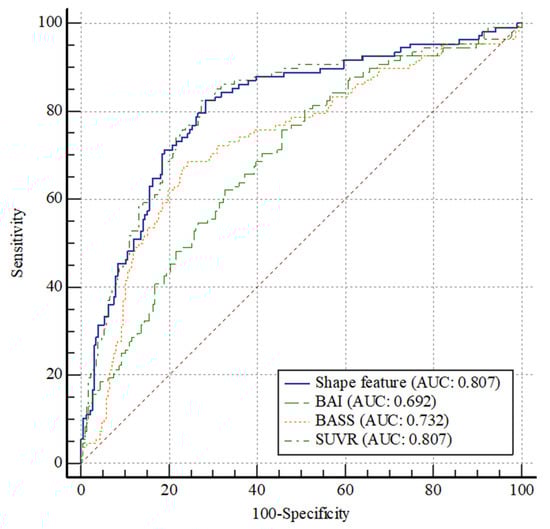
Figure 2.
Comparison of ROC curves among the SUVR, AV45_BASS, MR_BAI, and shape feature. No significant difference in the ROC curves between SUVR and shape feature (p = 0. 994). Thus, they can be considered as comparable parameters. A significant difference in the ROC curves was observed between SUVR and AV45_BASS (p = 0.001); SUVR was a better parameter than AV45_BASS. A significant difference in the ROC curves was observed between SUVR and MR_BAI (p = 0.002); SUVR was a better parameter than MR_BAI. Abbreviations: ROC, receiver operating characteristic; AUC, area under the ROC curve; SUV, standardized uptake value; SUVR, standardized uptake value ratio; BASS, brain amyloid smoothing score; BAI, brain atrophic index.
Table 2.
Comparison of ROC curves.
Figure 3 shows the correlation between SUVR and shape feature. SUVR and shape feature showed a significant positive correlation, with a correlation coefficient of 0.77 (r = 0.77; p < 0.0001).
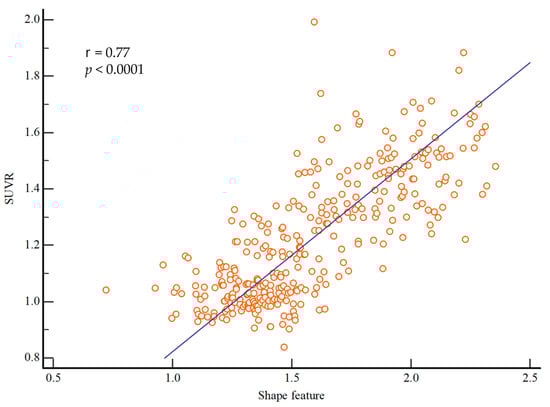
Figure 3.
Correlations between the shape feature and SUVR values. There was a significant correlation between shape feature and SUVR (r = 0.77; p < 0.0001). Abbreviations: SUVR, standardized uptake value ratio.
3.4. Univariate and Multivariate Analyses for the Predictors of the Conversion from MCI to AD
The prognostic values of the patient characteristics and imaging parameters for predicting conversion from MCI to AD during follow-up are summarized in Table 3. The optimal cutoff values were determined using ROC curve analysis (Figure A2). A shape feature value of >1.54 (p < 0.001; hazard ratio [HR], 7.20; 95% confidence interval [CI], 4.77–10.88), an SUVR of >1.22 (p < 0.001; HR, 7.64; 95% CI, 5.05–11.56), an AV45_BASS of >0.41 (p < 0.001; HR, 5.22; 95% CI, 3.42–7.97), and an MR_BAI of >3.93 (p < 0.001; HR, 2.94; 95% CI, 1.96–4.42) were significant predictors of a shorter MCI duration, as were all other evaluated parameters.
Table 3.
Kaplan–Meier analysis of the conversion from MCI to AD and factors influencing the duration of MCI.
The results of the multivariate Cox regression analysis adjusted for age, MMSE, APOE4, AV45_BASS, and MRI_BAI showed that the shape feature, SUVR, and ADAS-cog remained statistically significant predictors of a shorter MCI duration before conversion to AD. The HRs calculated for these three variables are shown in Table 4.
Table 4.
Multivariate Cox regression analysis of the conversion from MCI to AD and factors influencing the duration of MCI.
3.5. Correlation of the Shape Feature with Cognitive Outcomes
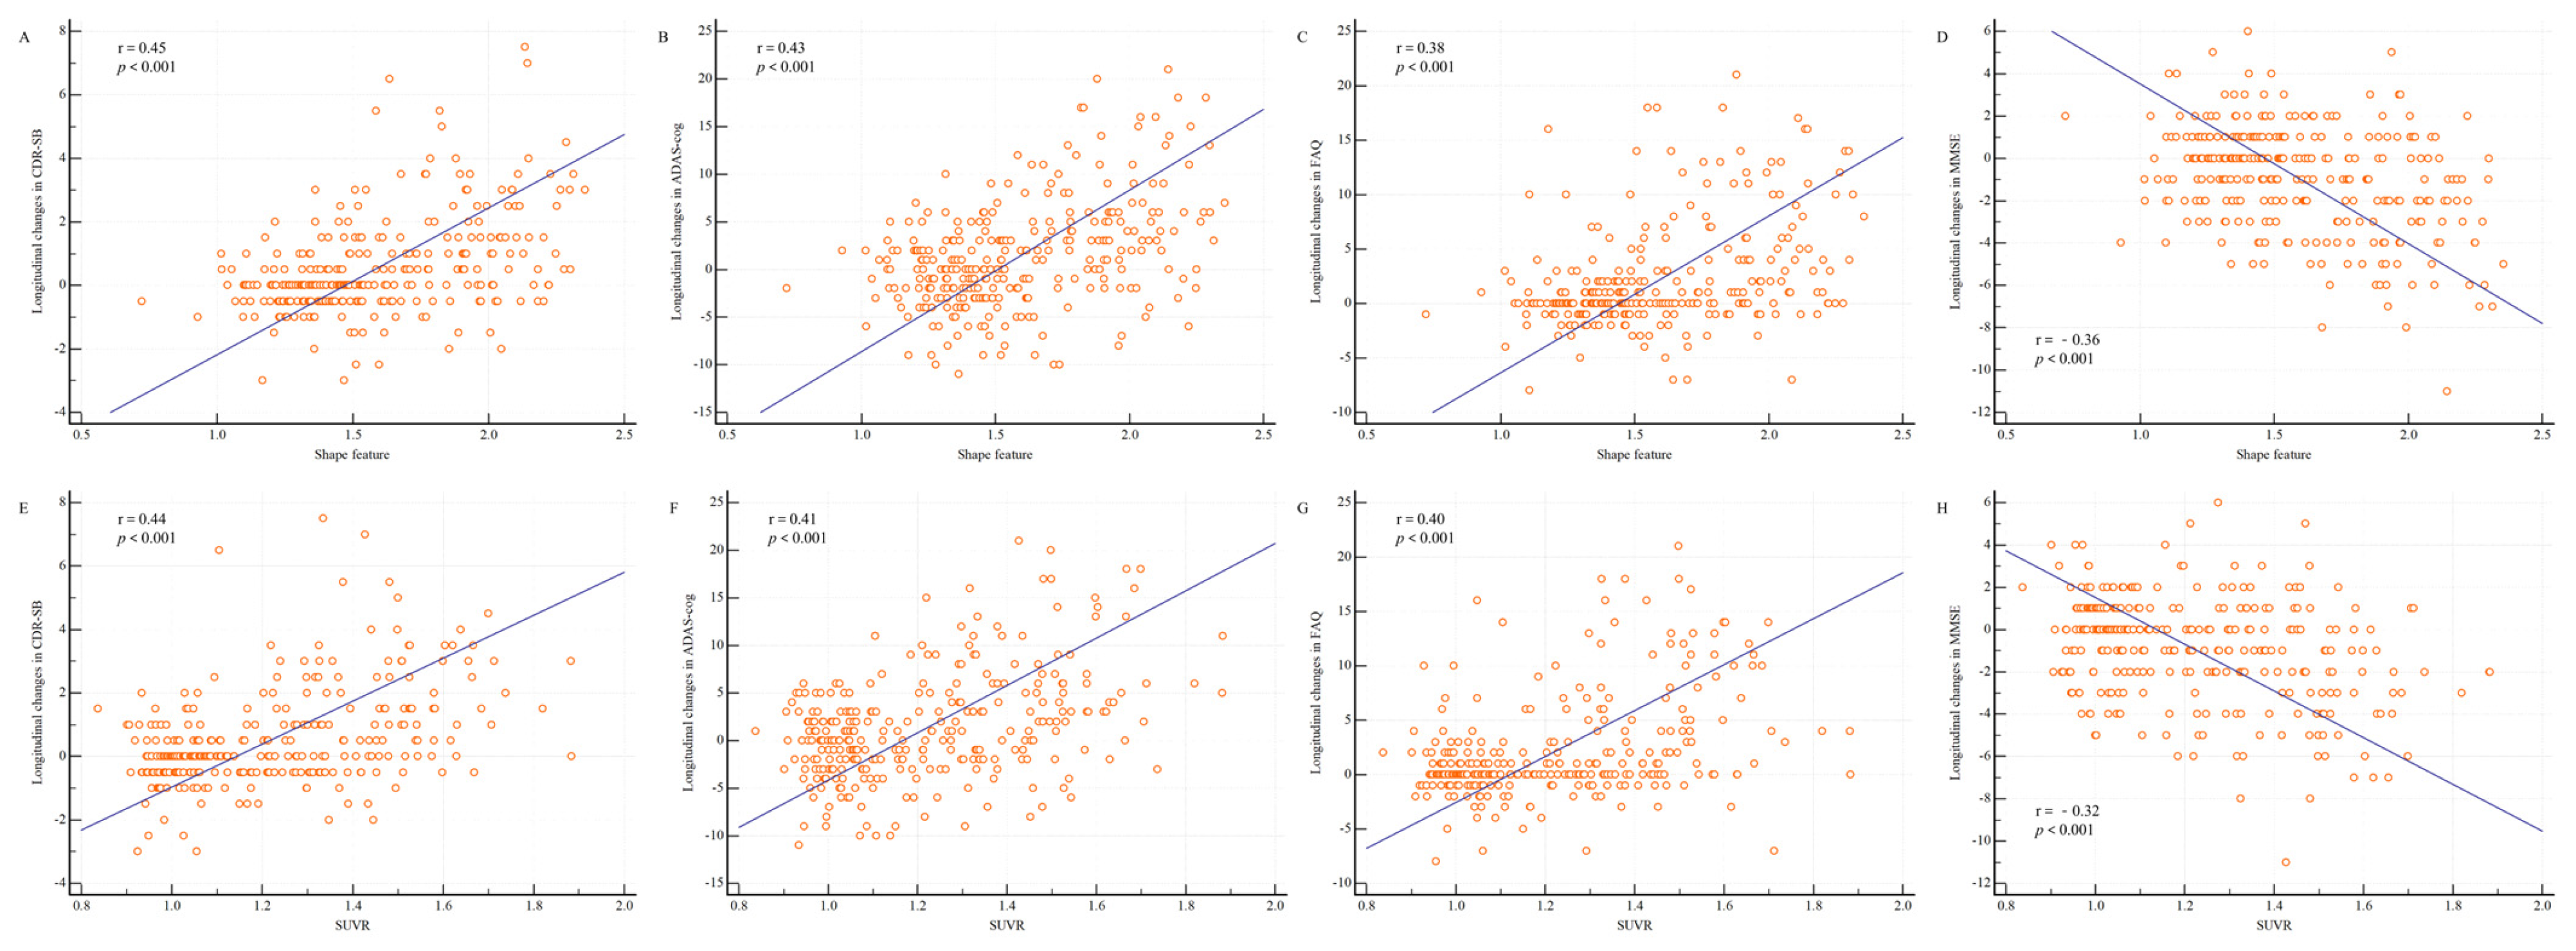
The shape feature calculated from the baseline PET and MR images of patients with MCI showed significant correlations with the longitudinal changes in cognitive measurements at 2 years (Figure 4). In particular, the shape feature was positively correlated with longitudinal changes in CDR-SB (r = 0.45; p < 0.001), ADAS-cog (r = 0.43; p < 0.001), and FAQ (r = 0.38; p < 0.001) and negatively correlated with longitudinal changes in MMSE scores (r = −0.36; p < 0.001).
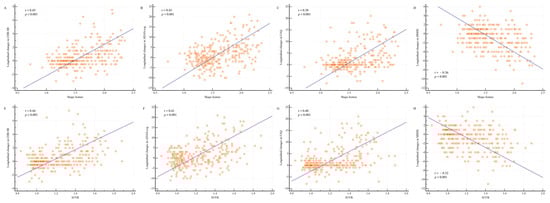
Figure 4.
Shape feature and SUVR distributions according to longitudinal changes in cognitive measurements. Changes in the cognitive measurements between baseline and 2 years are shown. (A) Between the shape feature and Clinical Dementia Rating sum of boxes (CDR-SB); (B) between the shape feature and Alzheimer’s Disease Assessment Scale–Cognitive Subscale (ADAS-cog); (C) between the shape feature and Functional Activities Questionnaire (FAQ); (D) between the shape feature and Mini-Mental State Examination (MMSE); (E) between the SUVR and CDR-SB; (F) between the SUVR and ADAS-cog; (G) between the SUVR and FAQ; and (H) between the SUVR and MMSE. The shape feature was positively correlated with longitudinal changes in CDR-SB (r = 0.45; p < 0.001), ADAS-cog (r = 0.43; p < 0.001), and FAQ (r = 0.38; p < 0.001) and negatively correlated with longitudinal changes in MMSE scores (r = −0.36; p < 0.001). The SUVR was positively correlated with longitudinal changes in CDR-SB (r = 0.44; p < 0.001), ADAS-cog (r = 0.41; p < 0.001), and FAQ (r = 0.40; p < 0.001) and negatively correlated with longitudinal changes in MMSE scores (r = −0.32; p < 0.001). Abbreviations: SUVR, standardized uptake value ratio.
4. Discussion
Using the data prospectively collected from the ADNI-2 cohort, we developed a novel shape feature quantification method that combines the baseline data of AV-45 PET and brain MRI and showed that this method could predict the conversion from MCI to AD. The shape feature was an important predictor of the conversion to AD because it had the highest HR in both the univariate and multivariate analyses. The shape feature could be used as a quantitative biomarker for predicting a longitudinal decline in cognitive measurements in patients with MCI and the conversion to AD. Our results demonstrate that the shape feature may be a feasible metric for identifying a clinically relevant semiquantitative biomarker.
Jack et al. proposed a framework for the in vivo staging of AD using two types of biomarkers—the measurement of beta-amyloid deposition and measurements of neurodegeneration [18]. According to the National Institute on Aging and Alzheimer’s Association Research Framework, AD is defined by its underlying pathological processes, which can be documented by postmortem examination or in vivo biomarkers [6]. This may help achieve a greater understanding of the mechanisms underlying heterogeneity and disease progression in AD [19]. However, beta-amyloid accumulation begins several decades before the appearance of the first cognitive symptoms, suggesting that the associations between these two types of biomarker abnormalities and the “time-dependent risk” of progression from MCI to AD vary considerably [20]. Therefore, determining a factor that can provide information on both amyloidosis and neurodegeneration is critical.
The prognostic value of amyloid PET using fluorinated tracers (visually [21], semiquantitatively [22], or both [23]) to determine cognitive decline and conversion to AD has been emphasized in patients with MCI, and its clinical impact on diagnostic confidence and drug treatment has recently been demonstrated [24]. Semiquantitative amyloid PET measurements commonly use the SUVR of cortical retention as a reference subcortical region [25]. However, the measurement of cortical retention in specific small cortical regions is limited by the partial volume effect that stems from the spatial resolution of PET scanners and post-smoothing images [15,16]. The disadvantages of using the SUVR are related to the variability of SUVR estimates, which can vary depending on the segmentation method used to define the target cortical and reference subcortical regions [26]. Because the BASS is not affected by a specific reference region, physicians can use this quantification method to generate consistent BASS values from a single AV-45 PET image. A limitation of the BASS is that even in cases with high degrees of amyloid deposition, the BASS may decrease if high-resolution PET images are used and brain atrophy has increased. However, in the shape feature method, such disadvantages of the BASS are compensated by measuring the structural changes using MRI.
Semiquantitative measures of atrophy on brain MRI commonly evaluate whole brain atrophy, hippocampal atrophy, or entorhinal cortex atrophy [27]. Guo et al. showed that the premorbid brain size was associated with protection against clinical deterioration in the face of AD-related brain atrophy in patients with MCI [28], thus supporting the theory that the brain reserve plays a compensatory role rather than a neuroprotective role [28]. Tabatabaei-Jafari et al. performed meta-regression analyses to investigate the impact of segmentation methodologies (manual vs. automated) on image-based atrophy measures and found that the manual segmentation of the hippocampus resulted in larger atrophy rate estimates than automatic segmentation using FreeSurfer [27]. Furthermore, Mulder et al. showed that lower atrophy rates can be achieved in investigations using automatic segmentation [29]. The BAI is a value obtained by measuring a large area and is thus expected to be less affected by segmentation variations than other methods; therefore, the BAI has excellent reproducibility with negligible interobserver and intraobserver variability.
The rationale for using the novel parameter AV45_BASS is that in positive scans, the full anatomical lobes are generally easier to visualize and the cortical margins are smoother [14]. Geometrically, the smooth shape of the beta-amyloid deposition leads to a low surface-area-to-volume ratio, which increases the sphericity of the surface. The rationale for using the novel parameter MR_BAI is that cortical margins show shrinkage in positive scans. Geometrically, this shrinkage of the brain cortex leads to a high surface area to volume ratio, which decreases the sphericity of the surface. Moreover, the MR resolution and limitations of the segmentation method may affect the use of the MR_BAI. Our novel shape feature is calculated by multiplying the AV45_BASS by the MR_BAI. One advantage of this feature over the SUVR is that it reveals an operator-independent characteristic of beta-amyloid deposition.
The correlation of the shape feature with neuropsychological tests may provide useful information on the timing and extent of beta-amyloid deposition, which are closely related to the clinical phenomenology of AD. Barthel et al. showed that the regional SUVR is well correlated with cognitive impairment measures, such as the MMSE, word-list memory, and word-list recall scores [30]. We noted significant correlations between the shape feature and longitudinal changes in neurological test results, including the CDR-SB (r = 0.45; p < 0.001), ADAS-cog (r = 0.43; p < 0.001), FAQ (r = 0.38; p < 0.001), and MMSE (r = −0.36; p < 0.001). These correlations raise the possibility of using AV-45 PET and brain MRI as markers of neuropsychological information.
Our study shows that the newly devised quantitative shape feature measurement may be used as a fusion biomarker for multimodal imaging. The demonstration of high amyloid deposition and high atrophy in the cortex at baseline on imaging biomarkers can predict longitudinal declines in cognitive scores [27,30]. However, determining a combined parameter that considers both amyloid deposition and atrophic changes is critical. The shape feature is a fusion biomarker directly obtained from both PET and MR images, which are also correlated with longitudinal cognitive measurements. This suggests that cognitive functions could rapidly deteriorate in patients with a high shape feature value at baseline. Therefore, the shape feature could act as a single parameter that reflects both PET and MRI patterns of future cognitive decline, particularly in terms of long-term outcomes. This correlation is an important observation with a potential impact on clinical trials for early treatment intervention in prodromal AD because the shape feature could help select patients likely to benefit from treatments.
5. Conclusions
We developed a new shape feature quantification method by combining the features of amyloid PET and brain MRI and showed that this shape feature was a strong imaging biomarker for predicting the conversion of patients with MCI to AD. Importantly, the shape feature values were significantly correlated with longitudinal changes in cognitive measurements in a sample of patients with MCI from the ADNI cohort. The shape feature measurement is expected to help identify patients with prodromal AD who may benefit from early intervention.
Author Contributions
Conceptualization: D.-H.K., M.O. and J.S.K.; Data curation: D.-H.K.; Formal analysis: D.-H.K.; Investigation: D.-H.K. and M.O.; Methodology: D.-H.K.; Project administration: D.-H.K., M.O. and J.S.K.; Resources: Alzheimer’s Disease Neuroimaging Initiative; Supervision: M.O. and J.S.K.; Visualization: D.-H.K.; Writing—original draft: D.-H.K.; Writing—review and editing: M.O. and J.S.K. All authors have read and agreed to the published version of the manuscript.
Funding
This research was supported by a grant from the Korea Dementia Research Project through the Korea Dementia Research Center, funded by the Ministry of Health & Welfare and Ministry of Science and ICT, Republic of Korea (grant number: HU22C0031); by a grant from the Korea Health Technology R&D Project through the Korea Health Industry Development Institute, funded by the Ministry of Health & Welfare, Republic of Korea (grant number: HI18C2383); and by a National Research Foundation of Korea grant funded by the Ministry of Science and ICT, Republic of Korea (grant number: 2021R1A2C3009056).
Institutional Review Board Statement
This study was conducted at a tertiary referral hospital with the approval of our Institutional Review Board (Eulji Medical Center Institutional Review Board No. EMC 2023-10-001) and according to the Declaration of Helsinki (1989) by the World Medical Association.
Informed Consent Statement
The need for informed consent was waived because of the retrospective nature of the review of the patients’ records and images.
Data Availability Statement
The ADNI dataset is available at: https://adni.loni.usc.edu accessed on 6 September 2023.
Acknowledgments
Data collection and sharing for this project were funded by the ADNI (National Institutes of Health Grant U01 AG024904) and DOD ADNI (Department of Defense award number W81XWH-12-2-0012). The ADNI is funded by the National Institute on Aging and the National Institute of Biomedical Imaging and Bioengineering and is supported by the generous contributions from the following: AbbVie, Alzheimer’s Association; Alzheimer’s Drug Discovery Foundation; Araclon Biotech; BioClinica Inc.; Biogen; Bristol-Myers Squibb Company; CereSpir Inc.; Eisai Inc.; Elan Pharmaceuticals Inc.; Eli Lilly and Company; EuroImmun; F. Hoffmann-La Roche Ltd. and its affiliated company Genentech Inc.; Fujirebio; GE Healthcare; IXICO Ltd.; Janssen Alzheimer Immunotherapy Research & Development LLC; Johnson & Johnson Pharmaceutical Research & Development LLC.; Lumosity; Lundbeck; Merck & Co. Inc.; Meso Scale Diagnostics LLC; NeuroRx Research; Neurotrack Technologies; Novartis Pharmaceuticals Corporation; Pfizer Inc.; Piramal Imaging; Servier; Takeda Pharmaceutical Company; and Transition Therapeutics. The Canadian Institutes of Health Research provided funds to support ADNI clinical sites in Canada. Private sector contributions are facilitated by the Foundation for the National Institutes of Health (http://www.fnih.org accessed on 6 September 2023). The grantee organization is the Northern California Institute for Research and Education, and the study is coordinated by the Alzheimer’s Disease Cooperative Study at the University of California, San Diego. ADNI data were disseminated by the Laboratory for Neuro Imaging at the University of Southern California. The data used in this study were obtained from the ADNI database (adni.loni.usc.edu accessed on 6 September 2023). As such, ADNI investigators contributed to the study design and implementation of the database and/or provided data but did not otherwise participate in the analysis or writing of this manuscript. A complete listing of ADNI investigators can be found at http://adni.loni.usc.edu/wp-content/uploads/how_to_apply/ADNI_Acknowledgement_List.pdf accessed on 6 September 2023.
Conflicts of Interest
The authors declare no conflict of interest.
Appendix A
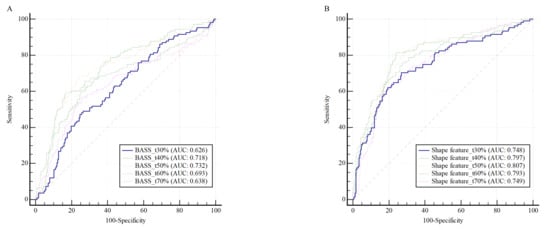
Figure A1.
Comparison of ROC curves of (A) BASS and (B) shape feature according to the thresholds of the SUV max. The ROC graph exhibited the highest AUC value when delineated based on the SUV max threshold of 50% in BASS and shape feature. Abbreviations: ROC, receiver operating characteristics; BASS, brain amyloid smoothing score; SUV, standard uptake value; AUC, area under the ROC curve.
Appendix B
Figure A2.
Receiver operating characteristics analyses of (A) age, (B) MMSE (C) ADAS-cog, (D) SUVR, (E) AV-45_BASS, (F) MR_BAI, and (G) shape feature. Abbreviations: MMSE, Mini-Mental State Examination; ADAS-cog, Alzheimer’s Disease Assessment Scale–Cognitive Subscale; SUVR, standardized uptake value ratio; AV-45, F-18 florbetapir; BASS, brain amyloid smoothing score; BAI, brain amyloid index.
References
- Jack, C.R., Jr.; Knopman, D.S.; Jagust, W.J.; Shaw, L.M.; Aisen, P.S.; Weiner, M.W.; Petersen, R.C.; Trojanowski, J.Q. Hypothetical model of dynamic biomarkers of the Alzheimer’s pathological cascade. Lancet Neurol. 2010, 9, 119–128. [Google Scholar] [CrossRef] [PubMed]
- Ellendt, S.; Voβ, B.; Kohn, N.; Wagels, L.; Goerlich, K.S.; Drexler, E.; Schneider, F.; Habel, U. Predicting Stability of Mild Cognitive Impairment (MCI): Findings of a Community Based Sample. Curr. Alzheimer Res. 2017, 14, 608–619. [Google Scholar] [CrossRef] [PubMed]
- Sperling, R.A.; Aisen, P.S.; Beckett, L.A.; Bennett, D.A.; Craft, S.; Fagan, A.M.; Iwatsubo, T.; Jack, C.R., Jr.; Kaye, J.; Montine, T.J.; et al. Toward Defining the Preclinical Stages of Alzheimer’s Disease: Recommendations from the National Institute on Aging-Alzheimer’s Association Workgroups on Diagnostic Guidelines for Alzheimer’s Disease. Alzheimer’s Dement. 2011, 7, 280–292. [Google Scholar] [CrossRef] [PubMed]
- Grand, J.H.; Caspar, S.; MacDonald, S.W. Clinical features and multidisciplinary approaches to dementia care. J. Multidiscip. Health 2011, 4, 125–147. [Google Scholar] [CrossRef]
- Choi, H.; Jin, K.H.; Alzheimer’s Disease Neuroimaging Initiative. Predicting cognitive decline with deep learning of brain metabolism and amyloid imaging. Behav. Brain Res. 2018, 344, 103–109. [Google Scholar] [CrossRef]
- Jack, C.R., Jr.; Bennett, D.A.; Blennow, K.; Carrillo, M.C.; Dunn, B.; Haeberlein, S.B.; Holtzman, D.M.; Jagust, W.; Jessen, F.; Karlawish, J.; et al. NIA-AA Research Framework: Toward a biological definition of Alzheimer’s disease. Alzheimer’s Dement. 2018, 14, 535–562. [Google Scholar] [CrossRef]
- Thurfjell, L.; Lilja, J.; Lundqvist, R.; Buckley, C.; Smith, A.; Vandenberghe, R.; Sherwin, P. Automated Quantification of 18F-Flutemetamol PET Activity for Categorizing Scans as Negative or Positive for Brain Amyloid: Concordance with Visual Image Reads. J. Nucl. Med. 2014, 55, 1623–1628. [Google Scholar] [CrossRef]
- Clark, C.M.; Schneider, J.A.; Bedell, B.J.; Beach, T.G.; Bilker, W.B.; Mintun, M.A.; Pontecorvo, M.J.; Hefti, F.; Carpenter, A.P.; Flitter, M.L.; et al. Use of Florbetapir-PET for Imaging β-Amyloid Pathology. JAMA 2011, 305, 275–283. [Google Scholar] [CrossRef]
- Clark, C.M.; Pontecorvo, M.J.; Beach, T.G.; Bedell, B.J.; Coleman, R.E.; Doraiswamy, P.M.; Fleisher, A.S.; Reiman, E.M.; Sabbagh, M.N.; Sadowsky, C.H.; et al. Cerebral PET with florbetapir compared with neuropathology at autopsy for detection of neuritic amyloid-β plaques: A prospective cohort study. Lancet Neurol. 2012, 11, 669–678. [Google Scholar] [CrossRef]
- Whitwell, J.L.; Josephs, K.A.; Murray, M.E.; Kantarci, K.; Przybelski, S.A.; Weigand, S.D.; Vemuri, P.; Senjem, M.L.; Parisi, J.E.; Knopman, D.S.; et al. MRI correlates of neurofibrillary tangle pathology at autopsy: A voxel-based morphometry study. Neurology 2008, 71, 743–749. [Google Scholar] [CrossRef]
- Vemuri, P.; Whitwell, J.L.; Kantarci, K.; Josephs, K.A.; Parisi, J.E.; Shiung, M.S.; Knopman, D.S.; Boeve, B.F.; Petersen, R.C.; Dickson, D.W.; et al. Antemortem MRI based STructural Abnormality iNDex (STAND)-scores correlate with postmortem Braak neurofibrillary tangle stage. NeuroImage 2008, 42, 559–567. [Google Scholar] [CrossRef] [PubMed]
- Wirth, M.; Madison, C.M.; Rabinovici, G.D.; Oh, H.; Landau, S.M.; Jagust, W.J. Alzheimer’s Disease Neurodegenerative Biomarkers Are Associated with Decreased Cognitive Function but Not β-Amyloid in Cognitively Normal Older Individuals. J. Neurosci. 2013, 33, 5553–5563. [Google Scholar] [CrossRef] [PubMed]
- Ben Bouallègue, F.; Mariano-Goulart, D.; Payoux, P.; Alzheimer’s Disease Neuroimaging Initiative. Comparison of CSF markers and semi-quantitative amyloid PET in Alzheimer’s disease diagnosis and in cognitive impairment prognosis using the ADNI-2 database. Alzheimer’s Res. Ther. 2017, 9, 32. [Google Scholar] [CrossRef]
- Rowe, C.C.; Villemagne, V.L. Brain Amyloid Imaging. J. Nucl. Med. 2011, 52, 1733–1740. [Google Scholar] [CrossRef] [PubMed]
- Rullmann, M.; Dukart, J.; Hoffmann, K.-T.; Luthardt, J.; Tiepolt, S.; Patt, M.; Gertz, H.-J.; Schroeter, M.L.; Seibyl, J.; Schulz-Schaeffer, W.J.; et al. Partial-Volume Effect Correction Improves Quantitative Analysis of 18F-Florbetaben β-Amyloid PET Scans. J. Nucl. Med. 2015, 57, 198–203. [Google Scholar] [CrossRef]
- Ashburner, J.; Friston, K.J.; Ashburner, J.; Friston, K.J.; Ashburner, J.; Friston, K.J. Unified segmentation. NeuroImage 2005, 26, 839–851. [Google Scholar] [CrossRef] [PubMed]
- Landau, S.M.; Fero, A.; Baker, S.L.; Koeppe, R.; Mintun, M.; Chen, K.; Reiman, E.M.; Jagust, W.J. Measurement of Longitudinal β-Amyloid Change with 18F-Florbetapir PET and Standardized Uptake Value Ratios. J. Nucl. Med. 2015, 56, 567–574. [Google Scholar] [CrossRef]
- Jack, C.R., Jr.; Knopman, D.S.; Jagust, W.J.; Petersen, R.C.; Weiner, M.W.; Aisen, P.S.; Shaw, L.M.; Vemuri, P.; Wiste, H.J.; Weigand, S.D.; et al. Tracking pathophysiological processes in Alzheimer’s disease: An updated hypothetical model of dynamic biomarkers. Lancet Neurol. 2013, 12, 207–216. [Google Scholar] [CrossRef]
- Ekman, U.; Ferreira, D.; Westman, E. The A/T/N biomarker scheme and patterns of brain atrophy assessed in mild cognitive impairment. Sci. Rep. 2018, 8, 8431. [Google Scholar] [CrossRef]
- Jack, C.R.; Wiste, H.J.; Vemuri, P.; Weigand, S.D.; Senjem, M.L.; Zeng, G.; Bernstein, M.A.; Gunter, J.L.; Pankratz, V.S.; Aisen, P.S.; et al. Brain beta-amyloid measures and magnetic resonance imaging atrophy both predict time-to-progression from mild cognitive impairment to Alzheimer’s disease. Brain 2010, 133, 3336–3348. [Google Scholar] [CrossRef]
- Doraiswamy, P.M.; Sperling, R.A.; Johnson, K.; Reiman, E.M.; Wong, T.Z.; Sabbagh, M.N.; Sadowsky, C.H.; Fleisher, A.S.; Carpenter, A.; AV45-A11 Study Group; et al. Florbetapir F 18 amyloid PET and 36-month cognitive decline:a prospective multicenter study. Mol. Psychiatry 2014, 19, 1044–1051. [Google Scholar] [CrossRef] [PubMed]
- Landau, S.M.; Mintun, M.A.; Joshi, A.D.; Koeppe, R.A.; Petersen, R.C.; Aisen, P.S.; Weiner, M.W.; Jagust, W.J.; Alzheimer’s Disease Neuroimaging Initiative. Amyloid deposition, hypometabolism, and longitudinal cognitive decline. Ann. Neurol. 2012, 72, 578–586. [Google Scholar] [CrossRef] [PubMed]
- Schreiber, S.; Landau, S.M.; Fero, A.; Schreiber, F.; Jagust, W.J. Comparison of Visual and Quantitative Florbetapir F 18 Positron Emission Tomography Analysis in Predicting Mild Cognitive Impairment Outcomes. JAMA Neurol. 2015, 72, 1183–1190. [Google Scholar] [CrossRef] [PubMed]
- Boccardi, M.; Altomare, D.; Ferrari, C.; Festari, C.; Guerra, U.P.; Paghera, B.; Pizzocaro, C.; Lussignoli, G.; Geroldi, C.; Zanetti, O.; et al. Assessment of the Incremental Diagnostic Value of Florbetapir F 18 Imaging in Patients With Cognitive Impairment: The incremental diagnostic value of amyloid PET with [18F]-florbetapir (INDIA-FBP) study. JAMA Neurol. 2016, 73, 1417–1424. [Google Scholar] [CrossRef]
- Lopresti, B.J.; Klunk, W.E.; Mathis, C.A.; Hoge, J.A.; Ziolko, S.K.; Lu, X.; Meltzer, C.C.; Schimmel, K.; Tsopelas, N.D.; DeKosky, S.T.; et al. Simplified quantification of Pittsburgh Compound B amyloid imaging PET studies: A comparative analysis. J. Nucl. Med. 2005, 46, 1959–1972. [Google Scholar]
- Ben Bouallègue, F.; Vauchot, F.; Mariano-Goulart, D.; Payoux, P. Diagnostic and prognostic value of amyloid PET textural and shape features: Comparison with classical semi-quantitative rating in 760 patients from the ADNI-2 database. Brain Imaging Behav. 2018, 13, 111–125. [Google Scholar] [CrossRef]
- Tabatabaei-Jafari, H.; Shaw, M.E.; Cherbuin, N. Cerebral atrophy in mild cognitive impairment: A systematic review with meta-analysis. Alzheimer’s Dement. Diagn. Assess. Dis. Monit. 2015, 1, 487–504. [Google Scholar] [CrossRef]
- Guo, L.; Alexopoulos, P.; Wagenpfeil, S.; Kurz, A.; Perneczky, R.; Initiative, A.D.N. Brain size and the compensation of Alzheimer’s disease symptoms: A longitudinal cohort study. Alzheimer’s Dement. 2012, 9, 580–586. [Google Scholar] [CrossRef]
- Mulder, E.R.; de Jong, R.A.; Knol, D.L.; van Schijndel, R.A.; Cover, K.S.; Visser, P.J.; Barkhof, F.; Vrenken, H. Hippocampal volume change measurement: Quantitative assessment of the reproducibility of expert manual outlining and the automated methods FreeSurfer and FIRST. NeuroImage 2014, 92, 169–181. [Google Scholar] [CrossRef]
- Barthel, H.; Gertz, H.-J.; Dresel, S.; Peters, O.; Bartenstein, P.; Buerger, K.; Hiemeyer, F.; Wittemer-Rump, S.M.; Seibyl, J.; Reininger, C. Cerebral amyloid-β PET with florbetaben (18F) in patients with Alzheimer’s disease and healthy controls: A multicentre phase 2 diagnostic study. Lancet Neurol. 2011, 10, 424–435. [Google Scholar] [CrossRef]

Disclaimer/Publisher’s Note: The statements, opinions and data contained in all publications are solely those of the individual author(s) and contributor(s) and not of MDPI and/or the editor(s). MDPI and/or the editor(s) disclaim responsibility for any injury to people or property resulting from any ideas, methods, instructions or products referred to in the content. |
© 2023 by the authors. Licensee MDPI, Basel, Switzerland. This article is an open access article distributed under the terms and conditions of the Creative Commons Attribution (CC BY) license (https://creativecommons.org/licenses/by/4.0/).