


The Relationship between Planar and SPECT/CT Parameters and Functional Markers in Primary Hyperparathyroidism


Abstract
:1. Introduction
2. Materials and Methods
2.1. Study Population
2.2. Study Protocol
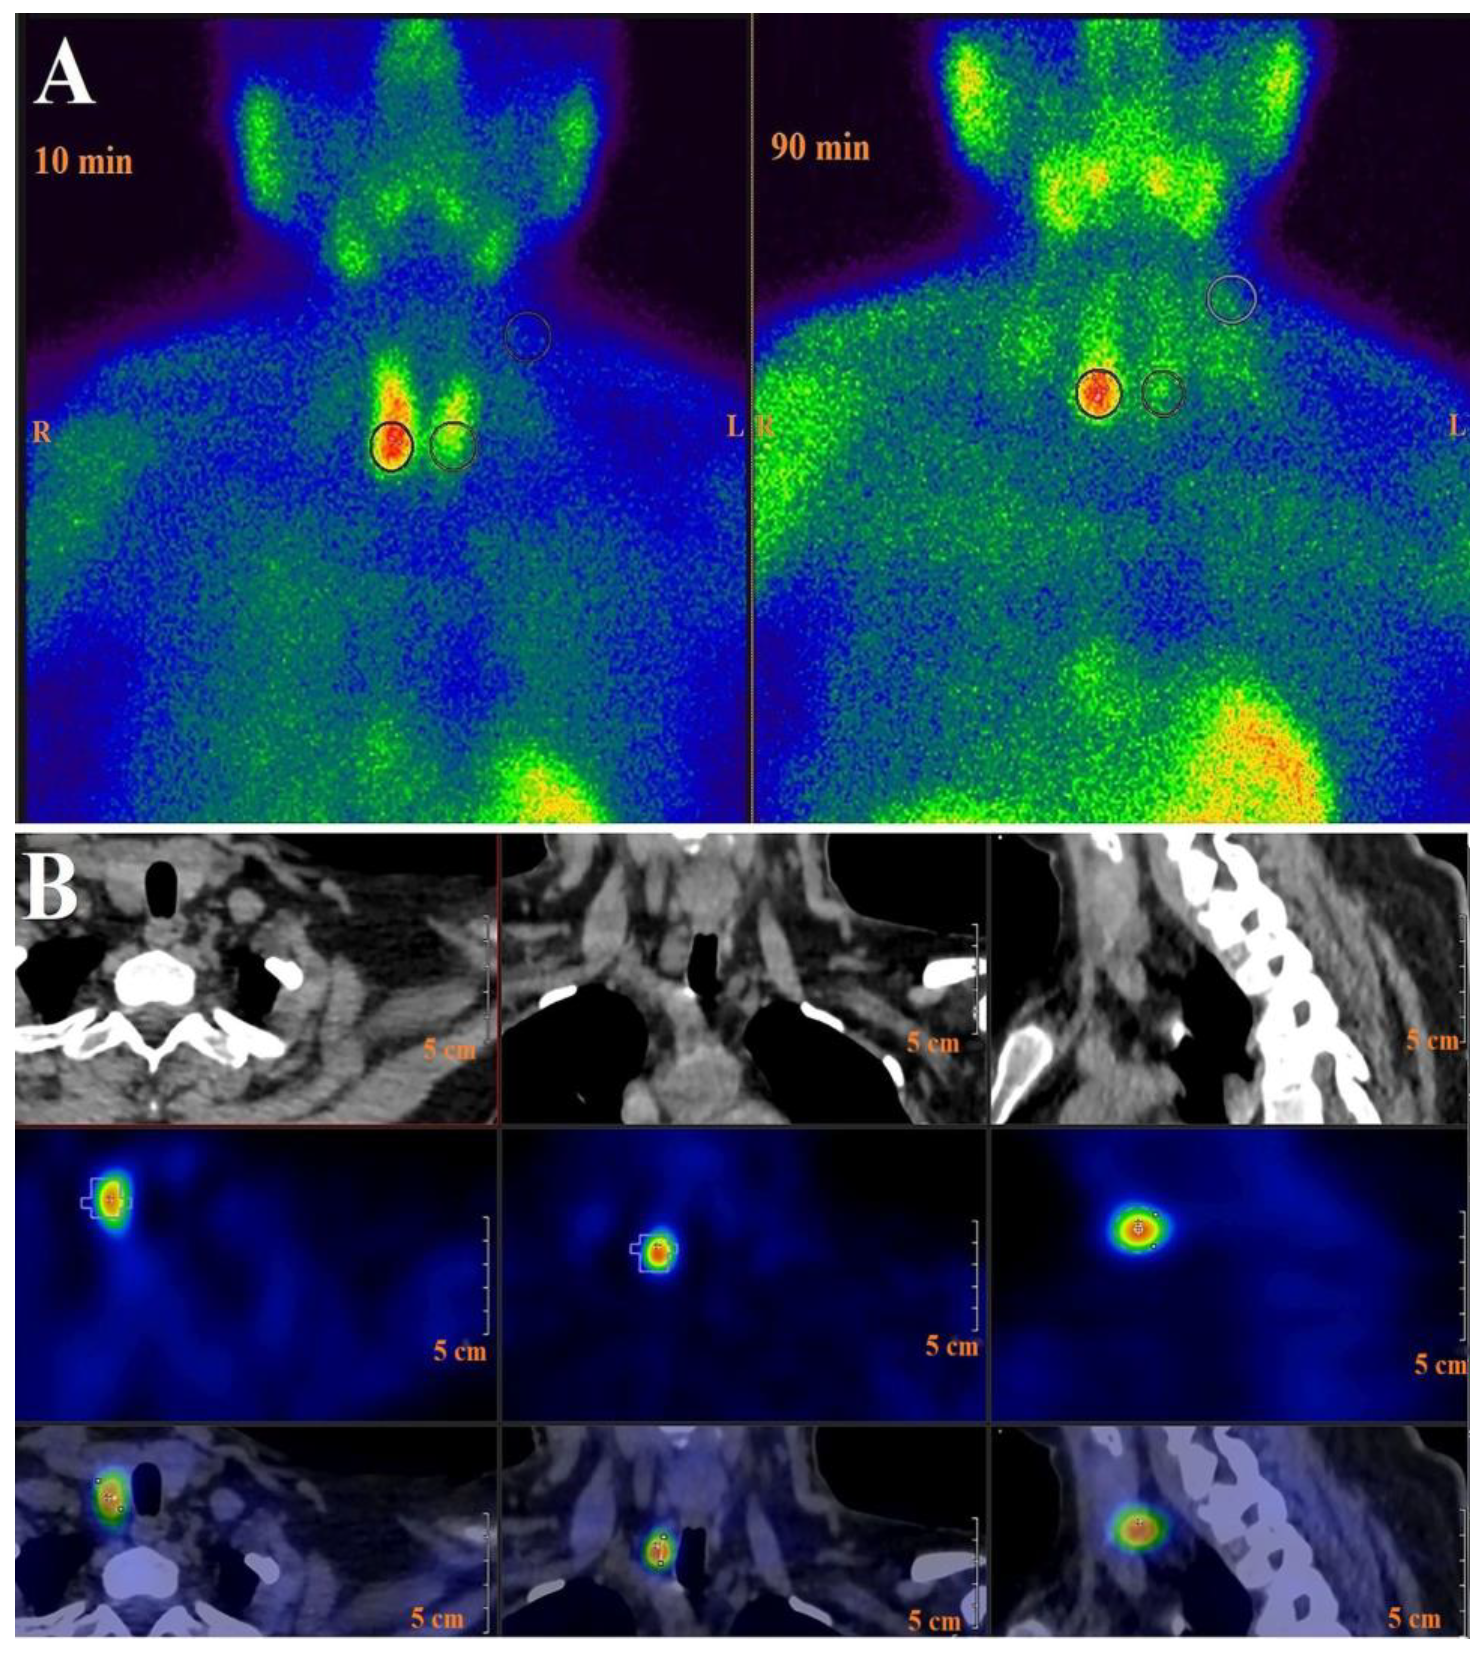
2.3. Parathyroid Imaging
2.4. 99mTc-MIBI DPS Image Analysis
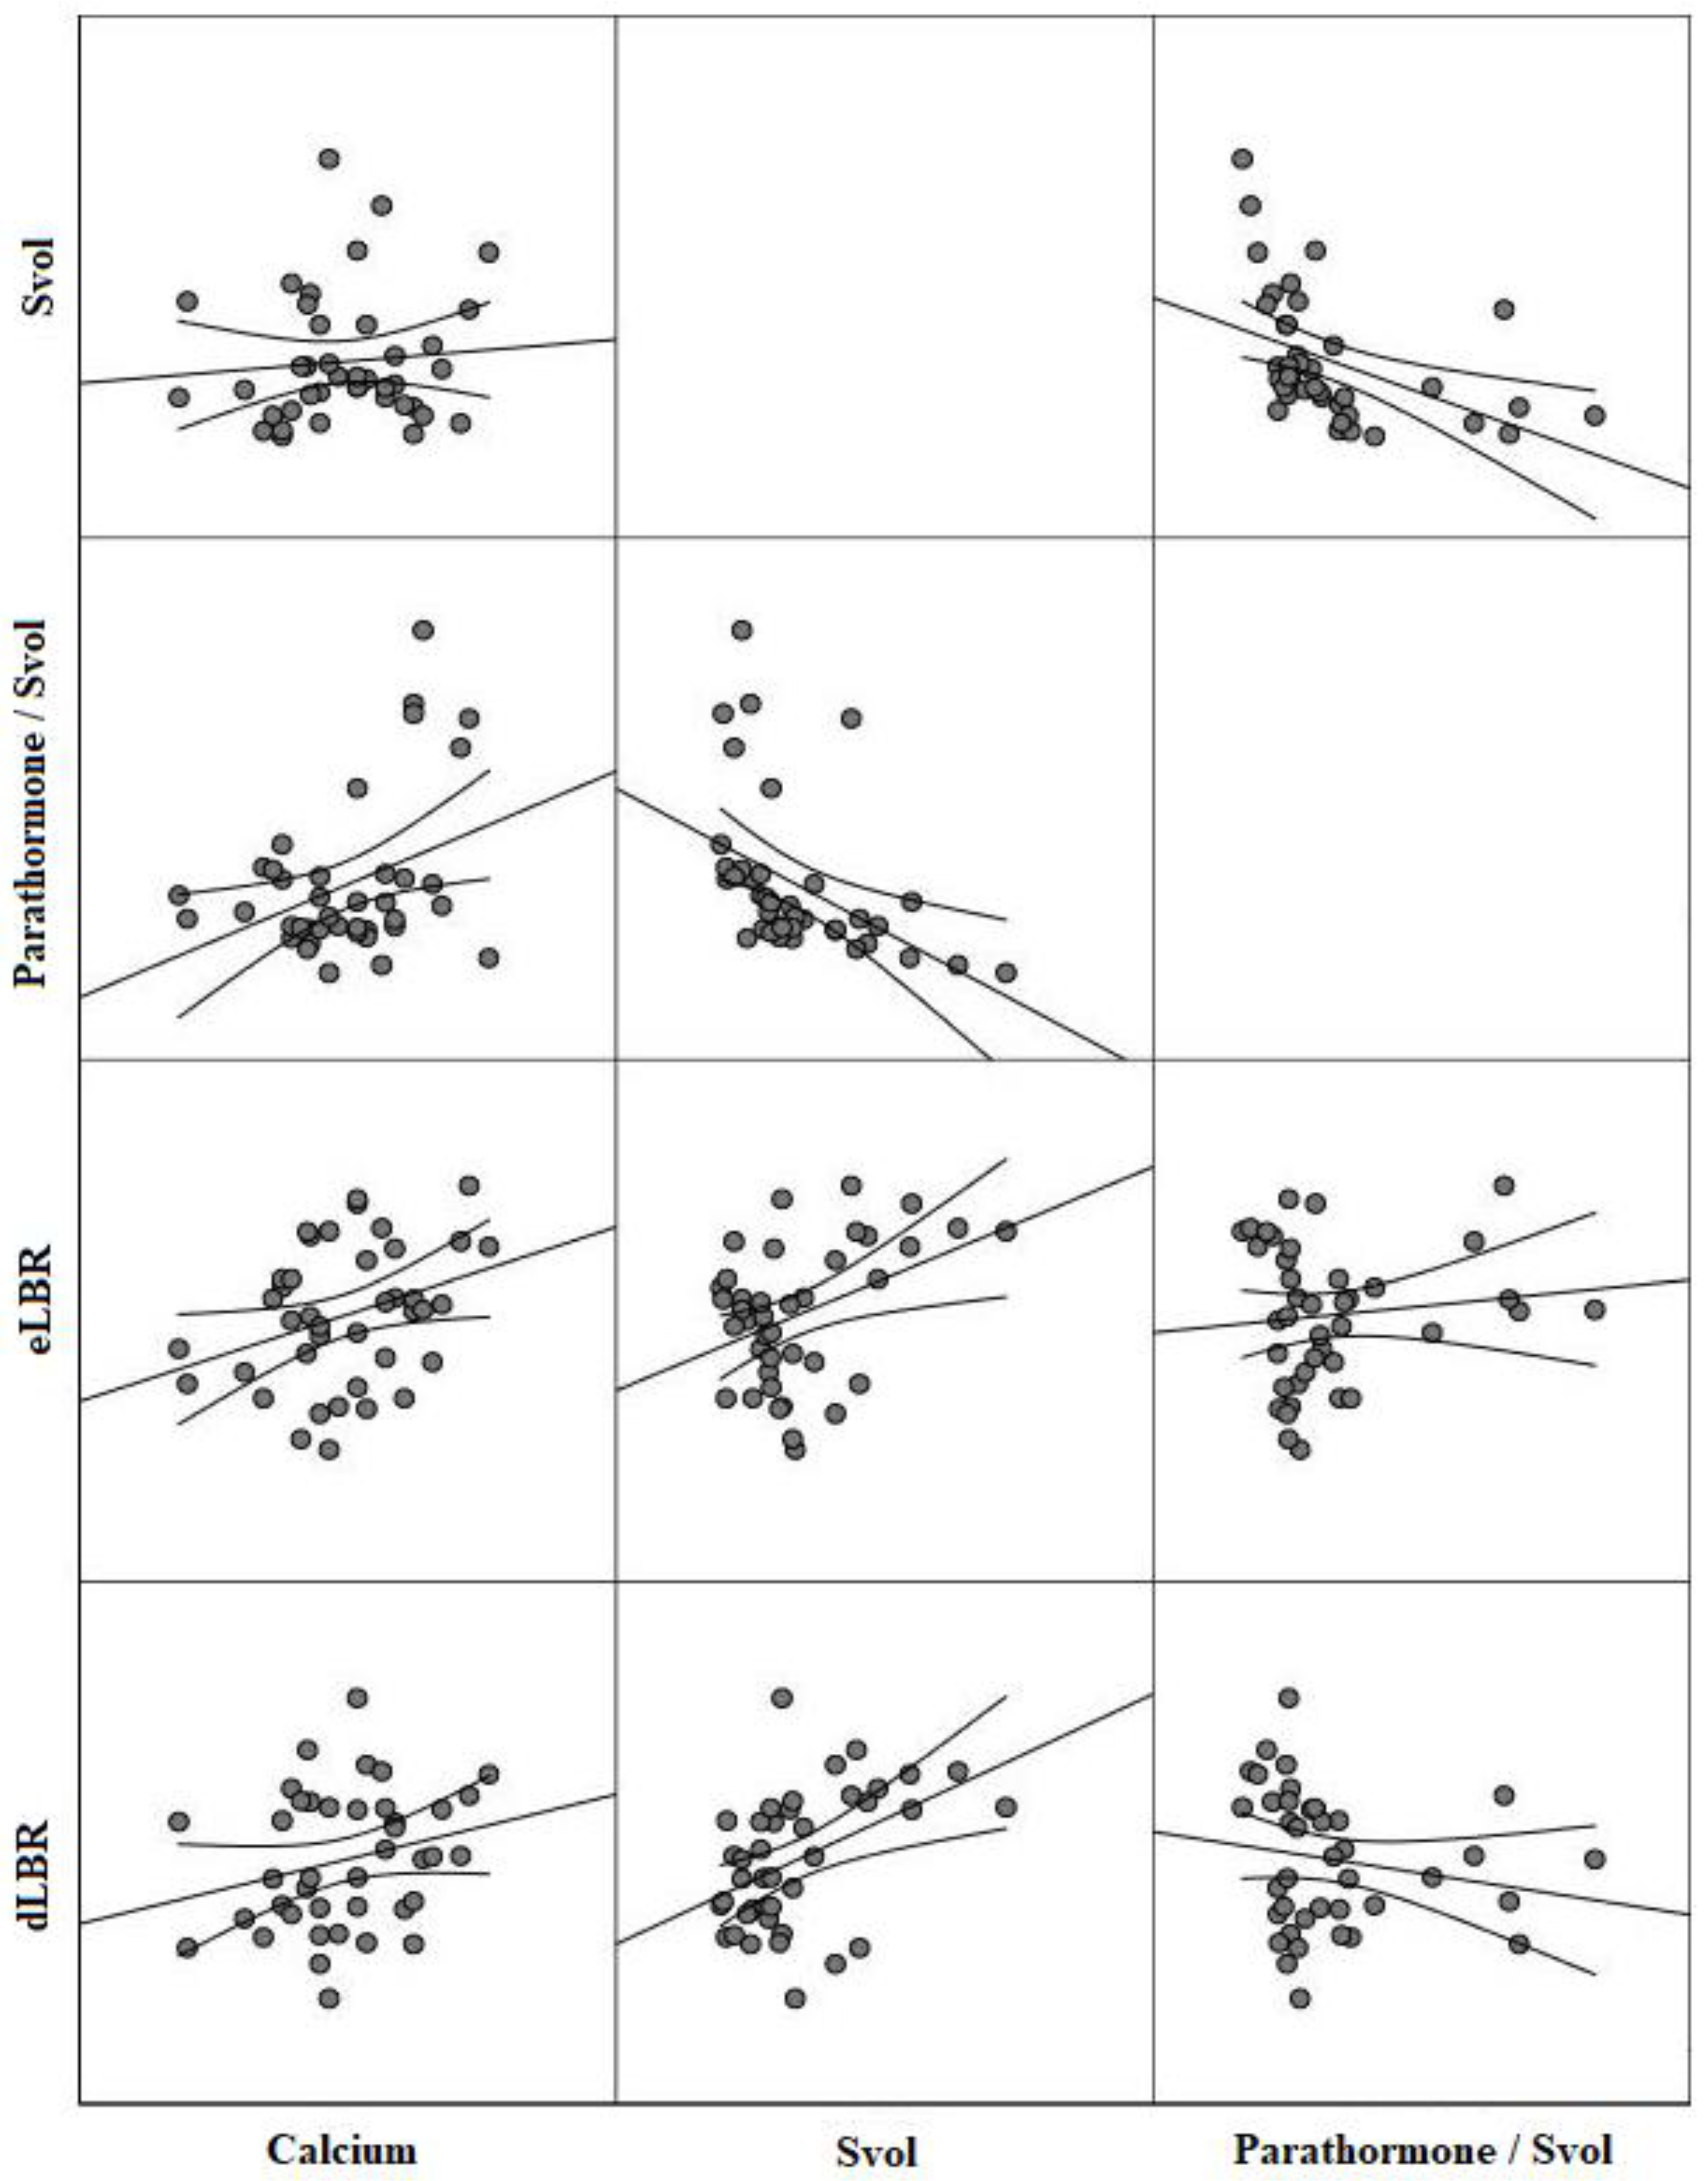
2.5. Statistical Analysis
3. Results
4. Discussion
5. Conclusions
Author Contributions
Funding
Institutional Review Board Statement
Informed Consent Statement
Data Availability Statement
Conflicts of Interest
References
- Bilezikian, J.P.; Bandeira, L.; Khan, A.; Cusano, N.E. Hyperparathyroidism. Lancet 2018, 391, 168–178. [Google Scholar] [CrossRef] [PubMed]
- Insogna, K.L. Primary Hyperparathyroidism. N. Engl. J. Med. 2018, 379, 1050–1059. [Google Scholar] [CrossRef] [PubMed]
- Nasiri, S.; Soroush, A.; Hashemi, A.P.; Hedayat, A.; Donboli, K.; Mehrkhani, F. Parathyroid adenoma Localization. Med. J. Islam. Repub. Iran 2012, 26, 103–109. [Google Scholar] [PubMed]
- Hindie, E.; Ugur, O.; Fuster, D.; O’Doherty, M.; Grassetto, G.; Urena, P.; Kettle, A.; Gulec, S.A.; Pons, F.; Rubello, D.; et al. 2009 EANM parathyroid guidelines. Eur. J. Nucl. Med. Mol. Imaging 2009, 36, 1201–1216. [Google Scholar] [CrossRef]
- Jorna, F.H.; Hollema, H.; Hendrikse, H.N.; Bart, J.; Brouwers, A.H.; Plukker, J.T. P-gp and MRP1 expression in parathyroid tumors related to histology, weight and (99m)Tc-sestamibi imaging results. Exp. Clin. Endocrinol. Diabetes 2009, 117, 406–412. [Google Scholar] [CrossRef]
- Mshelia, D.S.; Hatutale, A.N.; Mokgoro, N.P.; Nchabaleng, M.E.; Buscombe, J.R.; Sathekge, M.M. Correlation between serum calcium levels and dual-phase (99m)Tc-sestamibi parathyroid scintigraphy in primary hyperparathyroidism. Clin. Physiol. Funct. Imaging 2012, 32, 19–24. [Google Scholar] [CrossRef]
- Calva-Cerqueira, D.; Smith, B.J.; Hostetler, M.L.; Lal, G.; Menda, Y.; O’Dorisio, T.M.; Howe, J.R. Minimally invasive parathyroidectomy and preoperative MIBI scans: Correlation of gland weight and preoperative PTH. J. Am. Coll. Surg. 2007, 205, S38–S44. [Google Scholar] [CrossRef]
- Bindlish, V.; Freeman, J.L.; Witterick, I.J.; Asa, S.L. Correlation of biochemical parameters with single parathyroid adenoma weight and volume. Head Neck 2002, 24, 1000–1003. [Google Scholar] [CrossRef]
- Im, H.J.; Lee, I.K.; Paeng, J.C.; Lee, K.E.; Cheon, G.J.; Kang, K.W.; Chung, J.K.; Lee, D.S. Functional evaluation of parathyroid adenoma using 99mTc-MIBI parathyroid SPECT/CT: Correlation with functional markers and disease severity. Nucl. Med. Commun. 2014, 35, 649–654. [Google Scholar] [CrossRef]
- Melloul, M.; Paz, A.; Koren, R.; Cytron, S.; Feinmesser, R.; Gal, R. 99mTc-MIBI scintigraphy of parathyroid adenomas and its relation to tumour size and oxyphil cell abundance. Eur. J. Nucl. Med. 2001, 28, 209–213. [Google Scholar] [CrossRef]
- Bilezikian, J.P.; Khan, A.A.; Potts, J.T., Jr.; Third International Workshop on the Management of Asymptomatic Primary Hyperthyroidism. Guidelines for the management of asymptomatic primary hyperparathyroidism: Summary statement from the third international workshop. J. Clin. Endocrinol. Metab. 2009, 94, 335–339. [Google Scholar] [CrossRef] [PubMed]
- Akirov, A.; Gorshtein, A.; Shraga-Slutzky, I.; Shimon, I. Calcium levels on admission and before discharge are associated with mortality risk in hospitalized patients. Endocrine 2017, 57, 344–351. [Google Scholar] [CrossRef]
- Greenspan, B.S.; Dillehay, G.; Intenzo, C.; Lavely, W.C.; O’Doherty, M.; Palestro, C.J.; Scheve, W.; Stabin, M.G.; Sylvestros, D.; Tulchinsky, M. SNM practice guideline for parathyroid scintigraphy 4.0. J. Nucl. Med. Technol. 2012, 40, 111–118. [Google Scholar] [CrossRef] [PubMed]
- Koo, T.K.; Li, M.Y. A Guideline of Selecting and Reporting Intraclass Correlation Coefficients for Reliability Research. J. Chiropr. Med. 2016, 15, 155–163. [Google Scholar] [CrossRef] [PubMed]
- Fluss, R.; Faraggi, D.; Reiser, B. Estimation of the Youden Index and its associated cutoff point. Biom. J. 2005, 47, 458–472. [Google Scholar] [CrossRef]
- Wong, K.K.; Fig, L.M.; Gross, M.D.; Dwamena, B.A. Parathyroid adenoma localization with 99mTc-sestamibi SPECT/CT: A meta-analysis. Nucl. Med. Commun. 2015, 36, 363–375. [Google Scholar] [CrossRef]
- Chiu, M.L.; Kronauge, J.F.; Piwnica-Worms, D. Effect of mitochondrial and plasma membrane potentials on accumulation of hexakis (2-methoxyisobutylisonitrile) technetium(I) in cultured mouse fibroblasts. J. Nucl. Med. 1990, 31, 1646–1653. [Google Scholar]
- Gungor, S.; Dede, F.; Can, B.; Keskin, H.; Aras, M.; Ones, T.; Erdil, T.Y.; Turoglu, H.T. The value of parathyroid scintigraphy on lesion detection in patients with normocalcemic primary hyperparathyroidism. Rev. Esp. Med. Nucl. Imagen Mol. 2022, 41, 86–90. [Google Scholar] [CrossRef]
- Silov, G.; Ozdal, A.; Erdogan, Z.; Turhal, O.; Karaman, H. The relationship between technetium-99m-methoxyisobutyl isonitrile parathyroid scintigraphy and hormonal and biochemical markers in suspicion of primary hyperparathyroidism. Mol. Imaging Radionucl. Ther. 2013, 22, 8–13. [Google Scholar] [CrossRef]
- Durmus, E.T.; Atmaca, A.; Kefeli, M.; Mete, O.; Canbaz Tosun, F.; Baycelebi, D.; Polat, C.; Colak, R. Clinicopathological variables that correlate with sestamibi positivity in uniglandular parathyroid disease: A retrospective analysis of 378 parathyroid adenomas. Ann. Nucl. Med. 2022, 36, 33–42. [Google Scholar] [CrossRef]
- Khorasani, N.; Mohammadi, A. Effective factors on the sensitivity of preoperative sestamibi scanning for primary hyperparathyroidism. Int. J. Clin. Exp. Med. 2014, 7, 2639–2644. [Google Scholar]
- Cermik, T.F.; Puyan, F.O.; Sezer, A.; Firat, M.F.; Berkarda, S. Relation between Tc-99m sestamibi uptake and biological factors in hyperparathyroidism. Ann. Nucl. Med. 2005, 19, 387–392. [Google Scholar] [CrossRef] [PubMed]
- Westerdahl, J.; Bergenfelz, A. Sestamibi scan-directed parathyroid surgery: Potentially high failure rate without measurement of intraoperative parathyroid hormone. World J. Surg. 2004, 28, 1132–1138. [Google Scholar] [CrossRef] [PubMed]
- Goldstein, R.E.; Billheimer, D.; Martin, W.H.; Richards, K. Sestamibi scanning and minimally invasive radioguided parathyroidectomy without intraoperative parathyroid hormone measurement. Ann. Surg. 2003, 237, 722–730; discussion 730–731. [Google Scholar] [CrossRef] [PubMed]
- Williams, J.G.; Wheeler, M.H.; Aston, J.P.; Brown, R.C.; Woodhead, J.S. The relationship between adenoma weight and intact (1-84) parathyroid hormone level in primary hyperparathyroidism. Am. J. Surg. 1992, 163, 301–304. [Google Scholar] [CrossRef]
- Cantley, L.K.; Ontjes, D.A.; Cooper, C.W.; Thomas, C.G.; Leight, G.S.; Wells, S.A., Jr. Parathyroid hormone secretion from dispersed human hyperparathyroid cells: Increased secretion in cells from hyperplastic glands versus adenomas. J. Clin. Endocrinol. Metab. 1985, 60, 1032–1037. [Google Scholar] [CrossRef]
- Randhawa, P.S.; Mace, A.D.; Nouraei, S.A.; Stearns, M.P. Primary hyperparathyroidism: Do perioperative biochemical variables correlate with parathyroid adenoma weight or volume? Clin. Otolaryngol. 2007, 32, 179–184. [Google Scholar] [CrossRef]
- Kamani, F.; Najafi, A.; Mohammadi, S.S.; Tavassoli, S.; Shojaei, S.P. Correlation of biochemical markers of primary hyperparathyroidism with single adenoma weight and volume. Indian. J. Surg. 2013, 75, 102–105. [Google Scholar] [CrossRef]
- Kong, S.H.; Kim, J.H.; Kim, S.W.; Shin, C.S. Radioactive Parathyroid Adenomas on Sestamibi Scans: Low Parathyroid Hormone Secretory Potential and Large Volume. Endocrinol. Metab. 2021, 36, 351–358. [Google Scholar] [CrossRef]
- Patel, C.N.; Salahudeen, H.M.; Lansdown, M.; Scarsbrook, A.F. Clinical utility of ultrasound and 99mTc sestamibi SPECT/CT for preoperative localization of parathyroid adenoma in patients with primary hyperparathyroidism. Clin. Radiol. 2010, 65, 278–287. [Google Scholar] [CrossRef]
- Huang, Z.; Lou, C. (99m)TcO(4)(−)/(99m)Tc-MIBI dual-tracer scintigraphy for preoperative localization of parathyroid adenomas. J. Int. Med. Res. 2019, 47, 836–845. [Google Scholar] [CrossRef] [PubMed]
- Carral, F.; Jimenez, A.I.; Tome, M.; Alvarez, J.; Diez, A.; Partida, F.; Ayala, C. Factors associated with negative (99m)Tc-MIBI scanning in patients with primary hyperparathyroidism. Rev. Esp. Med. Nucl. Imagen Mol. 2021, 40, 222–228. [Google Scholar] [CrossRef] [PubMed]

| Variables | Study Population n = 70 |
|---|---|
| Demographic findings | |
| Age, year | 56.23 ± 13.14 |
| Gender, n (%) | |
| Male | 16 (22.90) |
| Female | 54 (77.10) |
| Severity of hypercalcemia, n (%) | |
| Mild | 50 (71.40) |
| Severe | 20 (28.60) |
| Laboratory findings | |
| Parathormone, ng/L | 128.30 (33.10–888.00) |
| Calcium, mg/dL | 11.02 ± 0.71 |
| Phosphorus, mg/dL | 2.71 (1.61–5.30) |
| 25 (OH) vitamin D, µg/L | 14.20 (4.20–52.20) |
| Localization of adenoma, n (%) | |
| Lower left | 21 (30.00) |
| Lower right | 16 (22.90) |
| Lower middle right | 8 (11.40) |
| Upper right | 7 (10.00) |
| Lower middle left | 5 (7.10) |
| Upper middle right | 3 (4.30) |
| Upper left | 2 (2.90) |
| Ectopic | 8 (11.40) |
| Planar imaging parameters | |
| eLBR | 2.61 ± 0.67 |
| eLTR | 1.33 ± 0.32 |
| dLBR | 2.06 (0.22–4.01) |
| dLTR | 1.28 (0.13–2.32) |
| RI | 0.03 [(−0.90)–0.96] |
| SPECT imaging parameters | n = 41 |
| Svol, cm3 | 2.10 (0.64–8.23) |
| PTH/Svol ratio, ng/L/cm3 | 55.06 (6.97–288.33) |
| Variables | Svol † | PTH/Svol Ratio † | eLBR | dLBR | RI |
|---|---|---|---|---|---|
| Parathormone | |||||
| r | 0.20 | 0.59 | 0.09 | 0.08 | 0.06 |
| p-value | 0.25 | <0.001 | 0.66 | 0.79 | 0.80 |
| Calcium | |||||
| r | 0.12 | 0.38 | 0.33 | 0.29 | 0.18 |
| p-value | 0.46 | <0.001 | <0.001 | 0.01 | 0.23 |
| Phosphorus | |||||
| r | −0.08 | −0.29 | −0.15 | −0.20 | −0.05 |
| p-value | 0.62 | 0.02 | 0.29 | 0.15 | 0.87 |
| 25 (OH) vitamin D | |||||
| r | 0.12 | −0.17 | −0.11 | −0.05 | 0.02 |
| p-value | 0.46 | 0.32 | 0.32 | 0.87 | 0.99 |
| eLBR | |||||
| r | 0.40 | −0.07 | - | 0.70 | −0.14 |
| p-value | <0.001 | 0.69 | - | <0.001 | 0.26 |
| eLTR | |||||
| r | −0.04 | 0.21 | 0.60 | 0.38 | −0.43 |
| p-value | 0.79 | 0.20 | <0.001 | 0.01 | <0.001 |
| dLBR | |||||
| r | 0.45 | −0.19 | 0.70 | - | 0.20 |
| p-value | <0.001 | 0.30 | <0.001 | - | 0.17 |
| dLTR | |||||
| r | 0.28 | −0.10 | 0.49 | 0.49 | 0.62 |
| p-value | 0.08 | 0.54 | <0.001 | <0.001 | <0.001 |
| RI | |||||
| r | 0.61 | −0.55 | −0.14 | 0.20 | - |
| p-value | <0.001 | <0.001 | 0.26 | 0.17 | - |
| Svol † | |||||
| r | - | −0.66 | 0.40 | 0.45 | 0.61 |
| p-value | - | <0.001 | <0.001 | <0.001 | <0.001 |
| Variables | Severity of Hypercalcemia | p-Value | |
|---|---|---|---|
| Mild | Marked | ||
| (10.50–11.49 mg/dL) | (>11.50 mg/dL) | ||
| n = 50 | n = 20 | ||
| Parathormone, ng/L | 119.50 (33.10–374.00) | 172.00 (74.80–888.00) | 0.002 |
| Phosphorus, mg/dL | 2.85 (1.98–4.83) | 2.32 (1.61–5.30) | 0.001 |
| 25 (OH) vitamin D, µg/mL | 14.75 (4.20–52.20) | 11.90 (6.72–37.40) | 0.471 |
| Planar imaging parameters | |||
| eLBR | 2.51 ± 0.64 | 2.91 ± 0.63 | 0.020 |
| eLTR | 1.29 ± 0.33 | 1.42 ± 0.32 | 0.092 |
| dLBR | 1.92 (0.22–4.01) | 2.28 (1.65–3.68) | 0.038 |
| dLTR | 1.24 (0.13–1.87) | 1.43 (0.89–2.32) | 0.010 |
| RI | 0.01 [(−0.90)–0.96] | 0.07 [(−0.14)–0.60] | 0.132 |
| SPECT imaging parameters | n = 29 | n = 12 | |
| Svol, cm3 | 2.20 (0.64–8.23) | 2.27 (0.70–5.67) | 0.682 |
| PTH/Svol ratio, ng/L/cm3 | 45.44 (6.97–158.60) | 84.56 (19.22–288.33) | 0.017 |
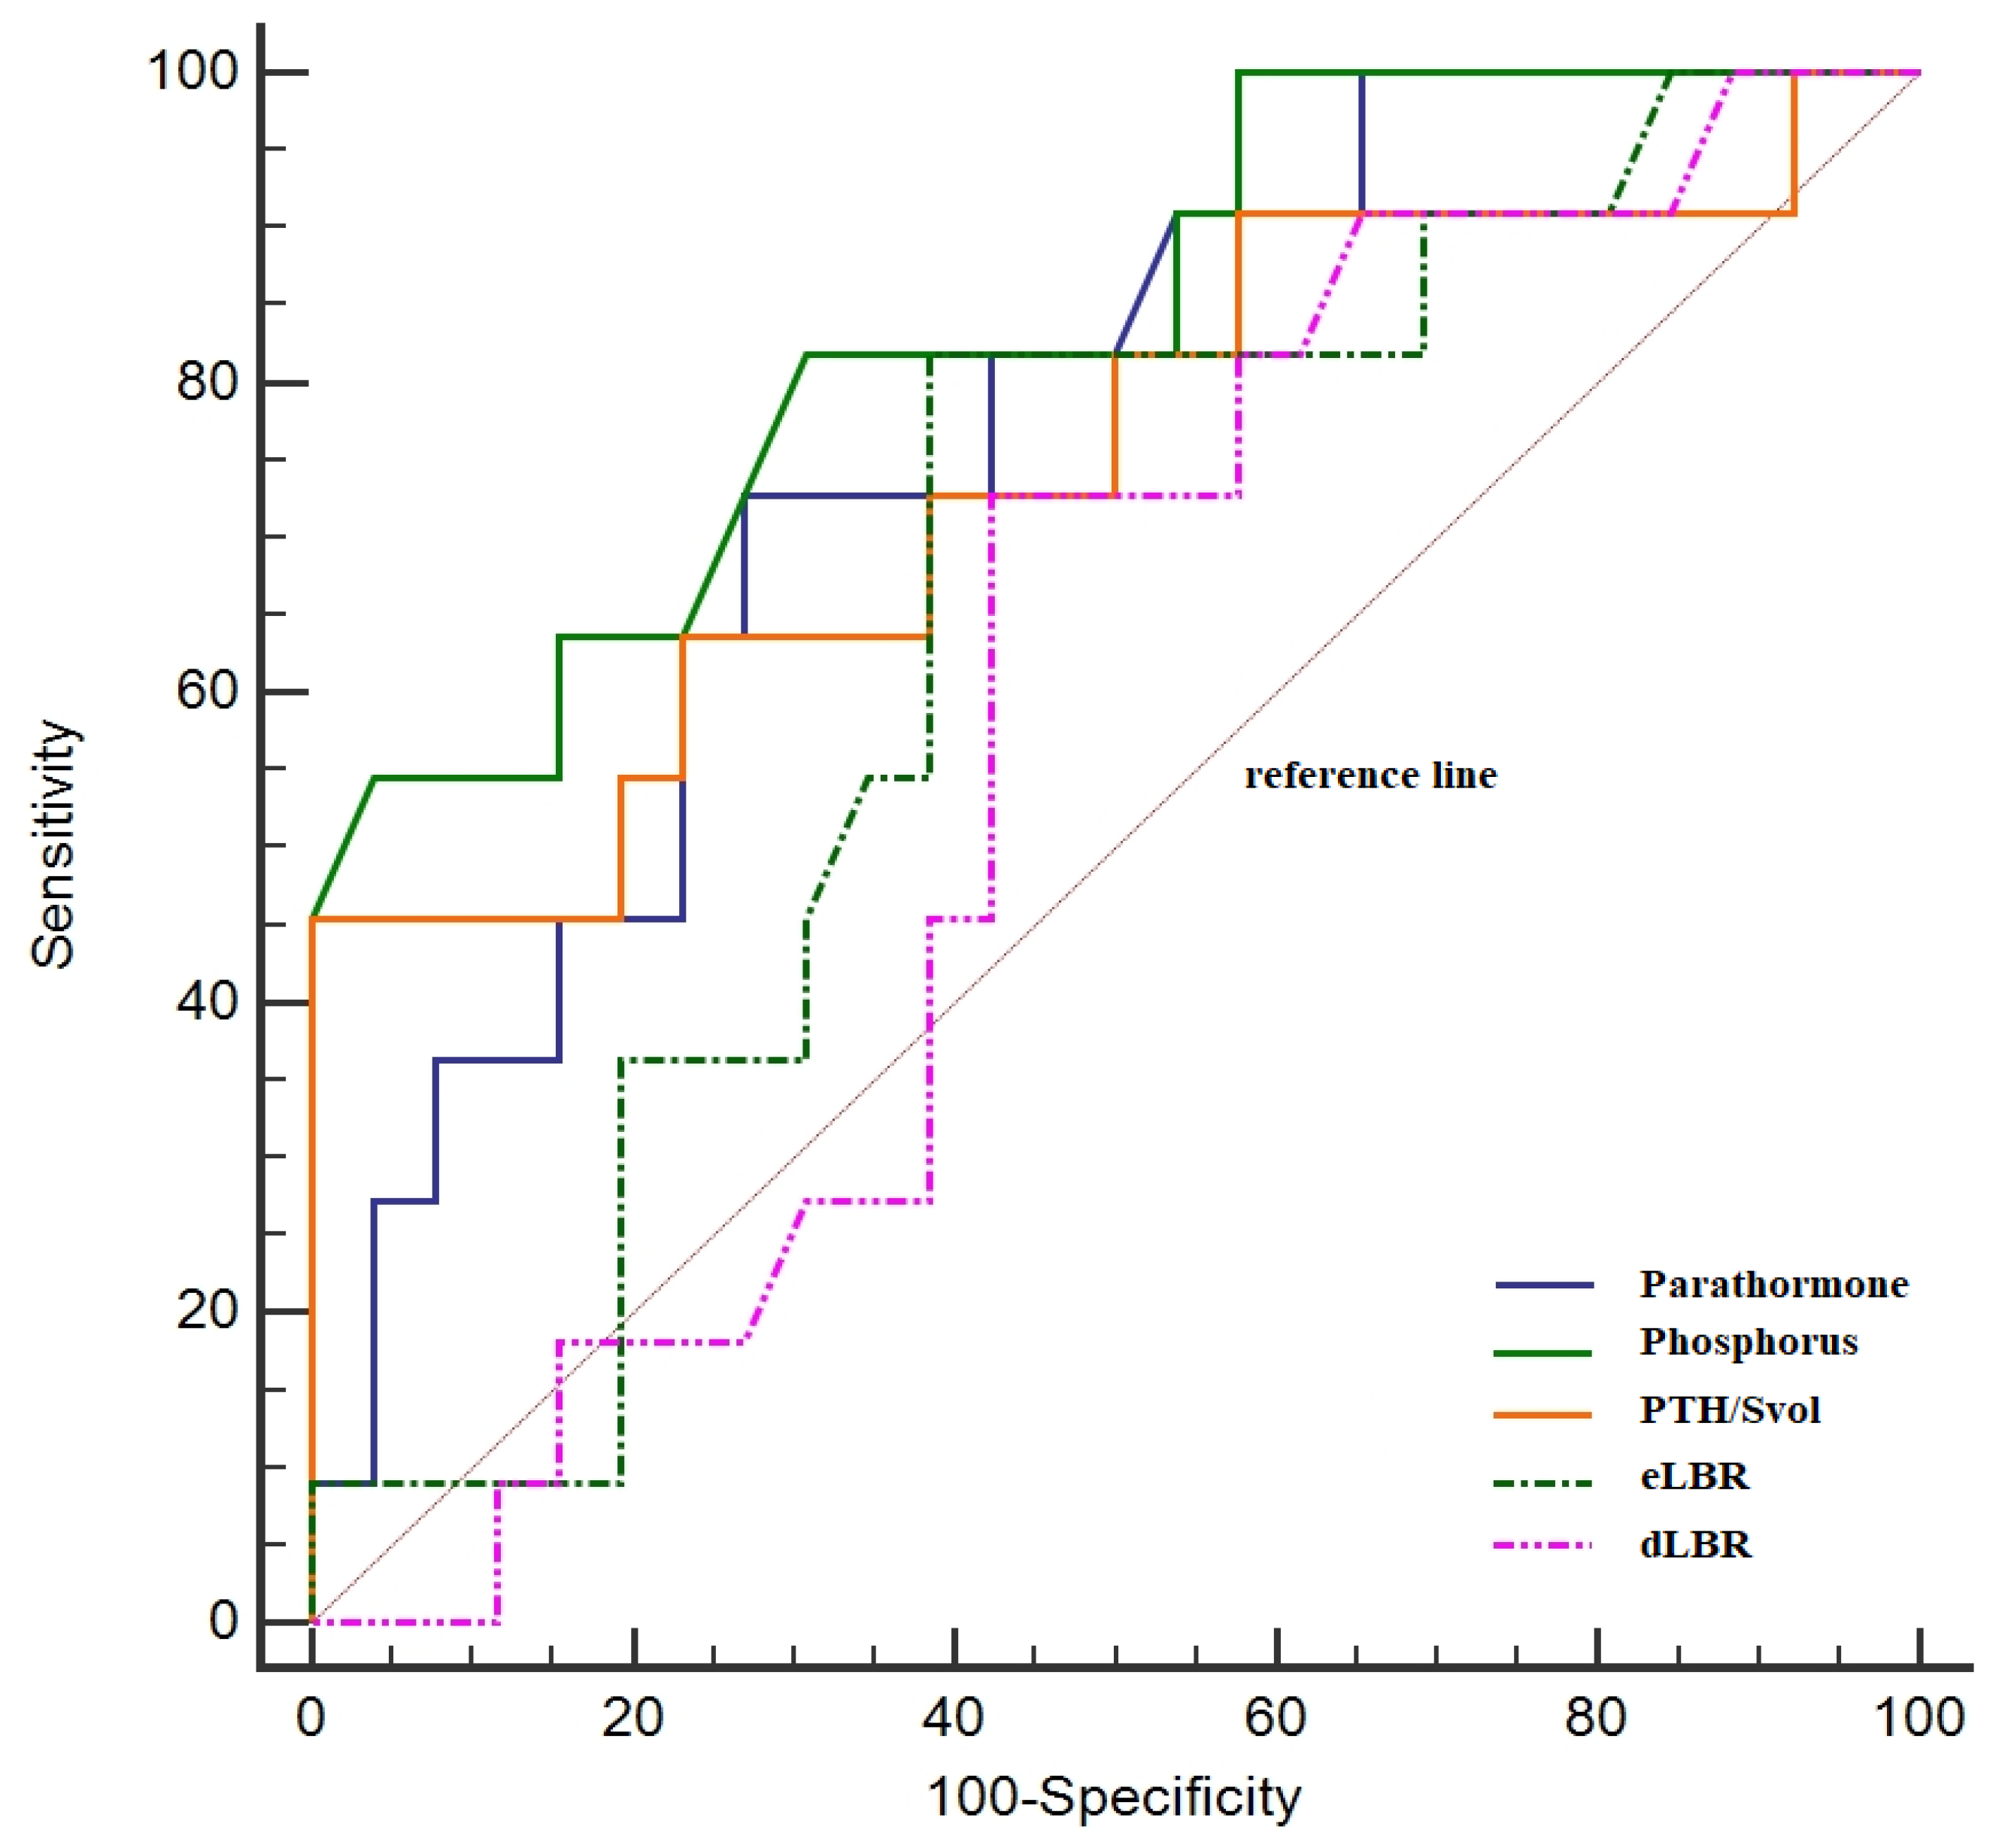
| Variables | AUC (95% CI) | Cut-Off Value | p-Value | Sensitivity (%) | Specificity (%) | Youden index |
|---|---|---|---|---|---|---|
| Parathormone | 0.76 (0.64–0.85) | >150.00 | <0.001 | 68.42 | 80.00 | 0.48 |
| Phosphorus | 0.75 (0.58–0.87) | <2.53 | <0.001 | 73.68 | 73.91 | 0.47 |
| 25 (OH) vitamin D | 0.56 (0.43–0.68) | <15.57 | 0.22 | 76.47 | 45.67 | 0.22 |
| Planar imaging parameters | ||||||
| eLBR | 0.68 (0.56–0.78) | >2.54 | 0.01 | 85.00 | 60.00 | 0.45 |
| eLTR | 0.62 (0.49–0.73) | >1.45 | 0.13 | 45.80 | 79.17 | 0.25 |
| dLBR | 0.66 (0.54–0.77) | >2.13 | 0.03 | 65.00 | 66.00 | 0.31 |
| dLTR | 0.66 (0.54–0.76) | >1.40 | 0.01 | 60.00 | 75.00 | 0.35 |
| RI | 0.62 (0.49–0.73) | >0.07 | 0.11 | 50.00 | 68.80 | 0.19 |
| SPECT imaging parameters | ||||||
| Svol | 0.54 (0.38–0.70) | <1.50 | 0.68 | 41.67 | 79.31 | 0.21 |
| PTH/Svol ratio | 0.75 (0.58–0.87) | >58.35 | 0.01 | 72.70 | 62.10 | 0.35 |
| Variables | Anatomic Localization | p-Value | |
|---|---|---|---|
| Lower Right n = 16 | Lower Left n = 21 | ||
| Parathormone, ng/L | 126.00 (67.10–888.00) | 135.00 (33.10–346.00) | 0.28 |
| Calcium, mg/dL | 11.28 ± 0.72 | 10.74 ± 0.79 | 0.05 |
| Phosphorus, mg/dL | 2.40 (2.10–3.60) | 3.10 (1.93–4.83) | 0.01 |
| 25 (OH) vitamin D, µg/mL | 12.15 (9.52–37.40) | 16.20 (4.20–52.20) | 0.58 |
| Planar imaging parameters | |||
| eLBR | 2.76 ± 0.59 | 2.38 ± 0.47 | 0.04 |
| eLTR | 1.46 ± 0.28 | 1.30 ± 0.37 | 0.14 |
| dLBR | 2.01 (0.22–3.46) | 1.90 (1.56–3.30) | 0.34 |
| dLTR | 1.34 (0.13–2.17) | 1.20 (0.88–2.30) | 0.08 |
| RI | 0.01 [(−0.90)–0.24] | 0.02 [(−0.40)–0.60] | 0.55 |
| SPECT imaging parameters | |||
| SVOL, cm3 | 1.50 (0.64–3.70) | 1.84 (1.00–4.54) | 0.36 |
| PTH/Svol ratio, ng/L/cm3 | 84.22 (35.14–227.97) | 62.10 (31.06–288.33) | 0.42 |
Disclaimer/Publisher’s Note: The statements, opinions and data contained in all publications are solely those of the individual author(s) and contributor(s) and not of MDPI and/or the editor(s). MDPI and/or the editor(s) disclaim responsibility for any injury to people or property resulting from any ideas, methods, instructions or products referred to in the content. |
© 2023 by the authors. Licensee MDPI, Basel, Switzerland. This article is an open access article distributed under the terms and conditions of the Creative Commons Attribution (CC BY) license (https://creativecommons.org/licenses/by/4.0/).
Share and Cite
Silov, G.; Erdogan Ozbodur, S. The Relationship between Planar and SPECT/CT Parameters and Functional Markers in Primary Hyperparathyroidism. Diagnostics 2023, 13, 3182. https://doi.org/10.3390/diagnostics13203182
Silov G, Erdogan Ozbodur S. The Relationship between Planar and SPECT/CT Parameters and Functional Markers in Primary Hyperparathyroidism. Diagnostics. 2023; 13(20):3182. https://doi.org/10.3390/diagnostics13203182
Chicago/Turabian StyleSilov, Guler, and Serpil Erdogan Ozbodur. 2023. "The Relationship between Planar and SPECT/CT Parameters and Functional Markers in Primary Hyperparathyroidism" Diagnostics 13, no. 20: 3182. https://doi.org/10.3390/diagnostics13203182
APA StyleSilov, G., & Erdogan Ozbodur, S. (2023). The Relationship between Planar and SPECT/CT Parameters and Functional Markers in Primary Hyperparathyroidism. Diagnostics, 13(20), 3182. https://doi.org/10.3390/diagnostics13203182