
Effect of Age and Gender on Taste Function as Measured by the Waterless Empirical Taste Test

Abstract
:1. Introduction
2. Materials and Methods
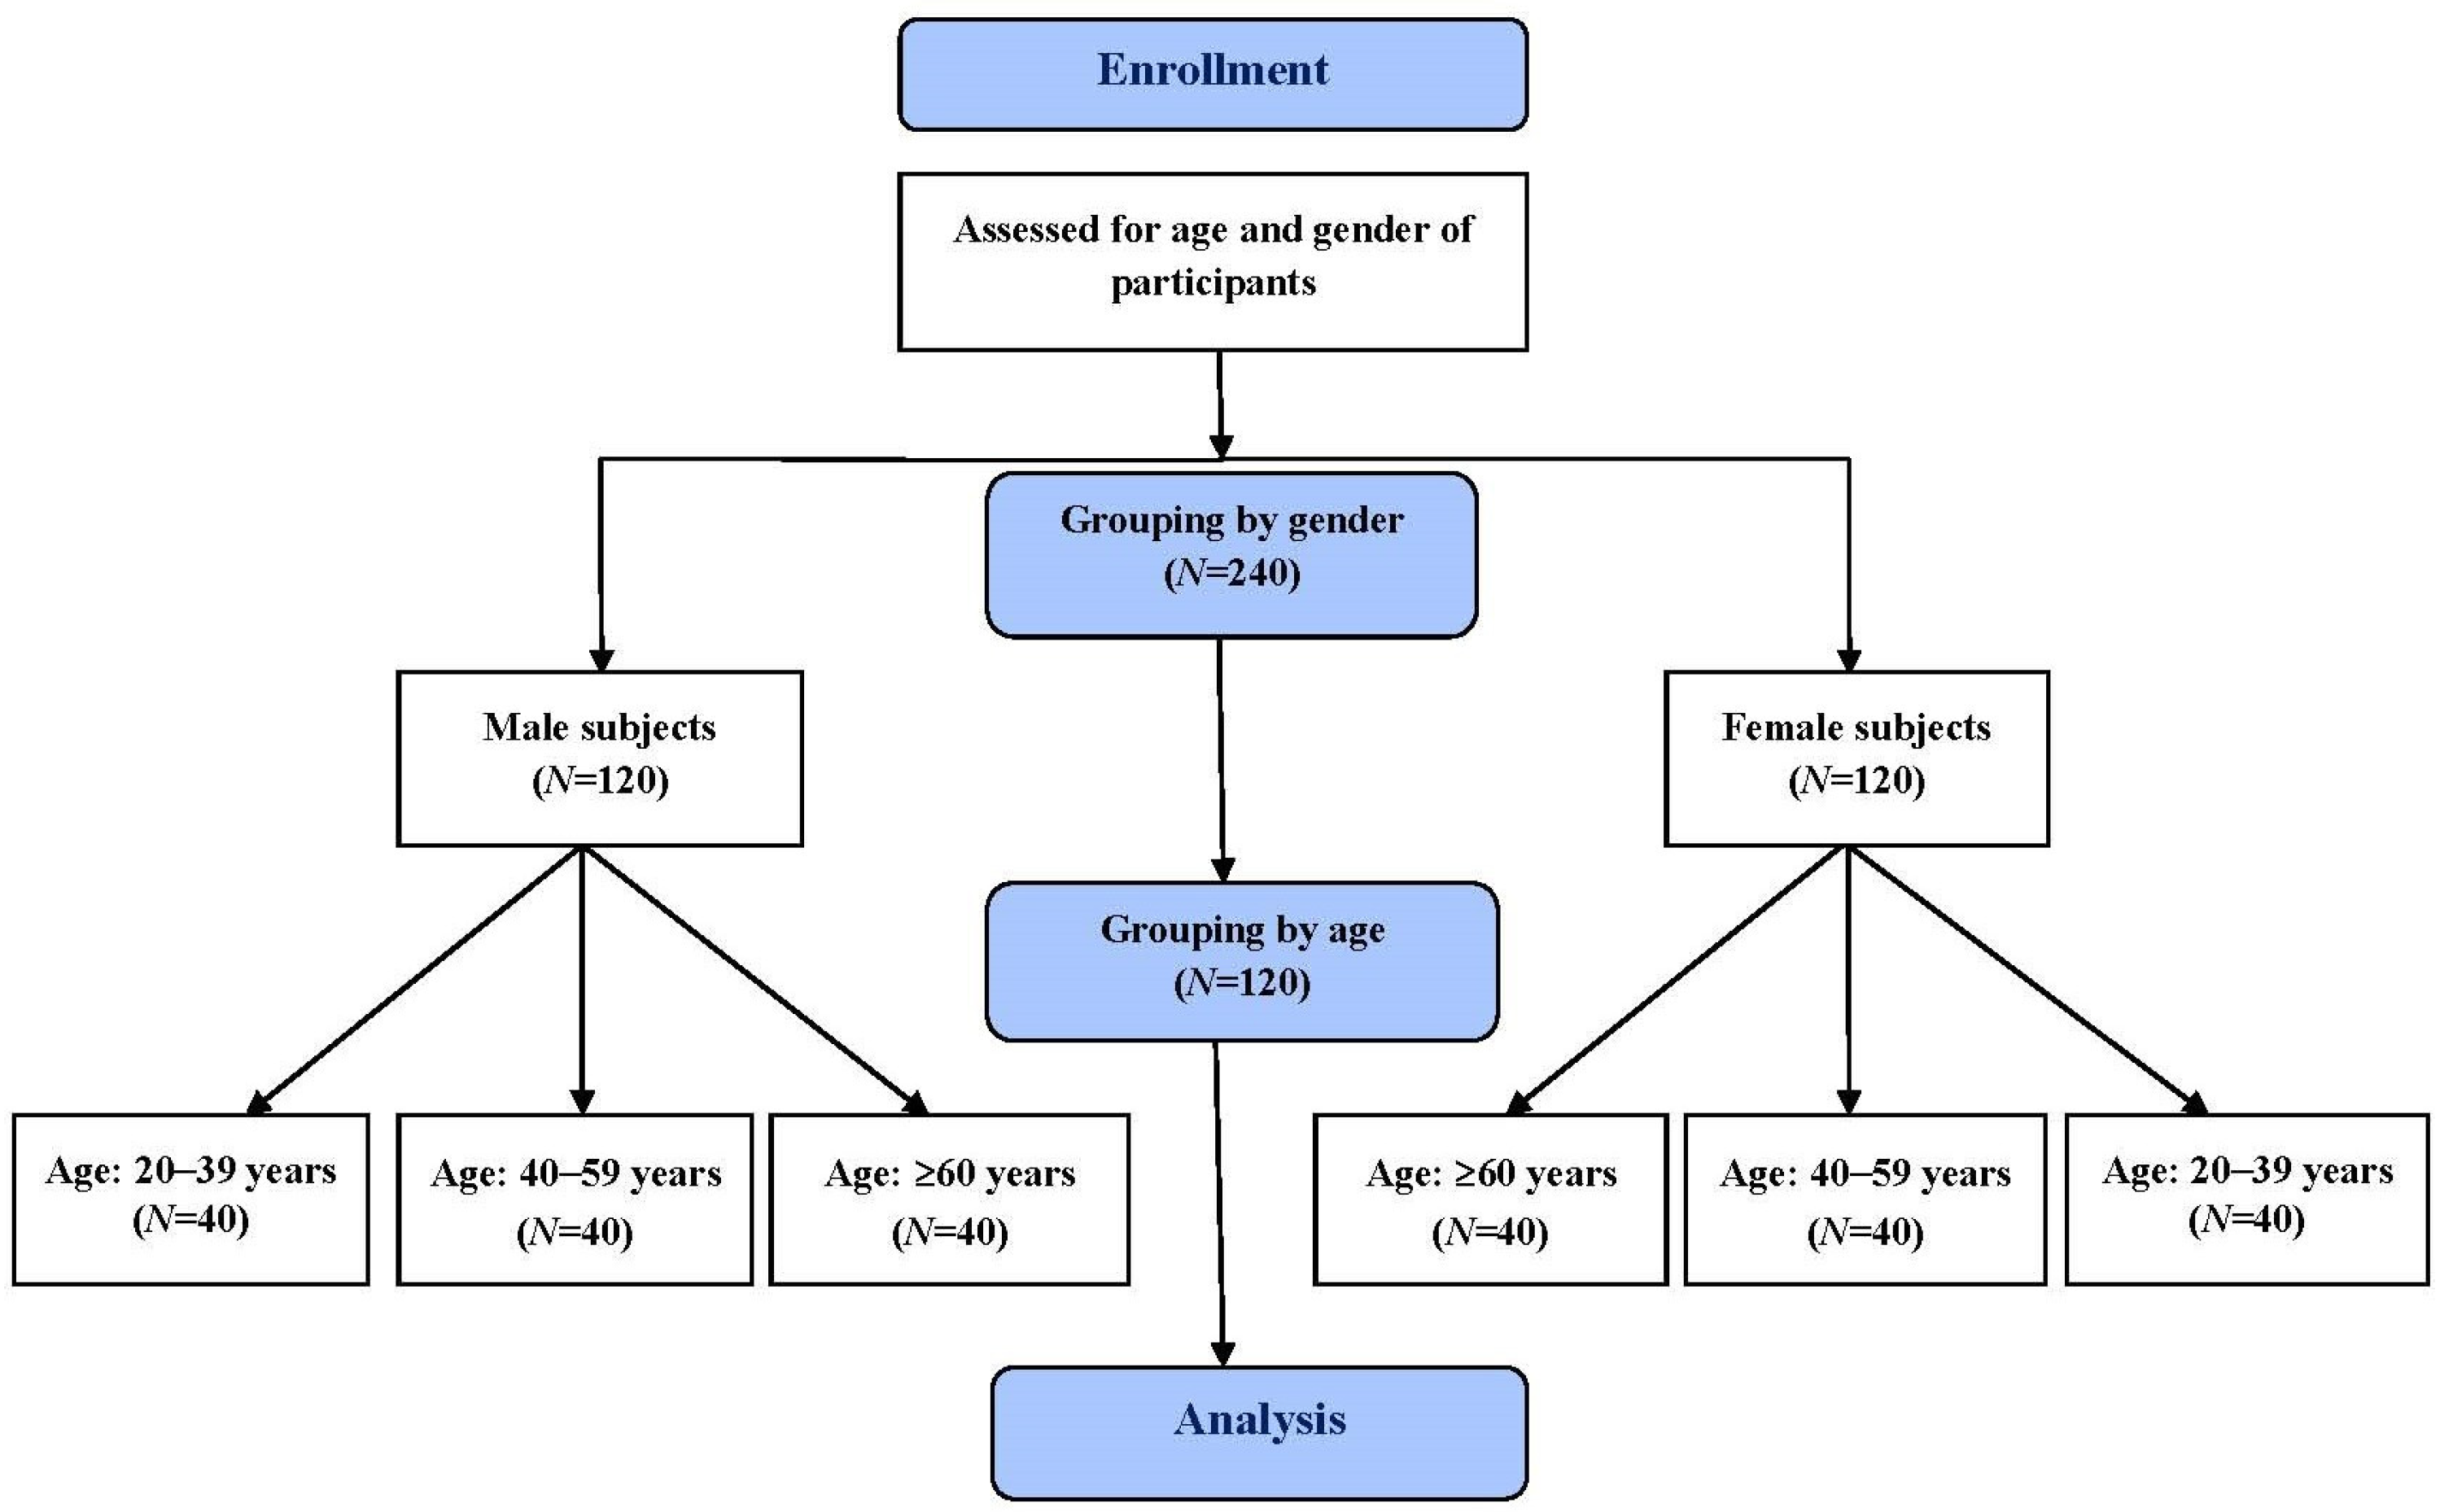
2.1. Study Subjects
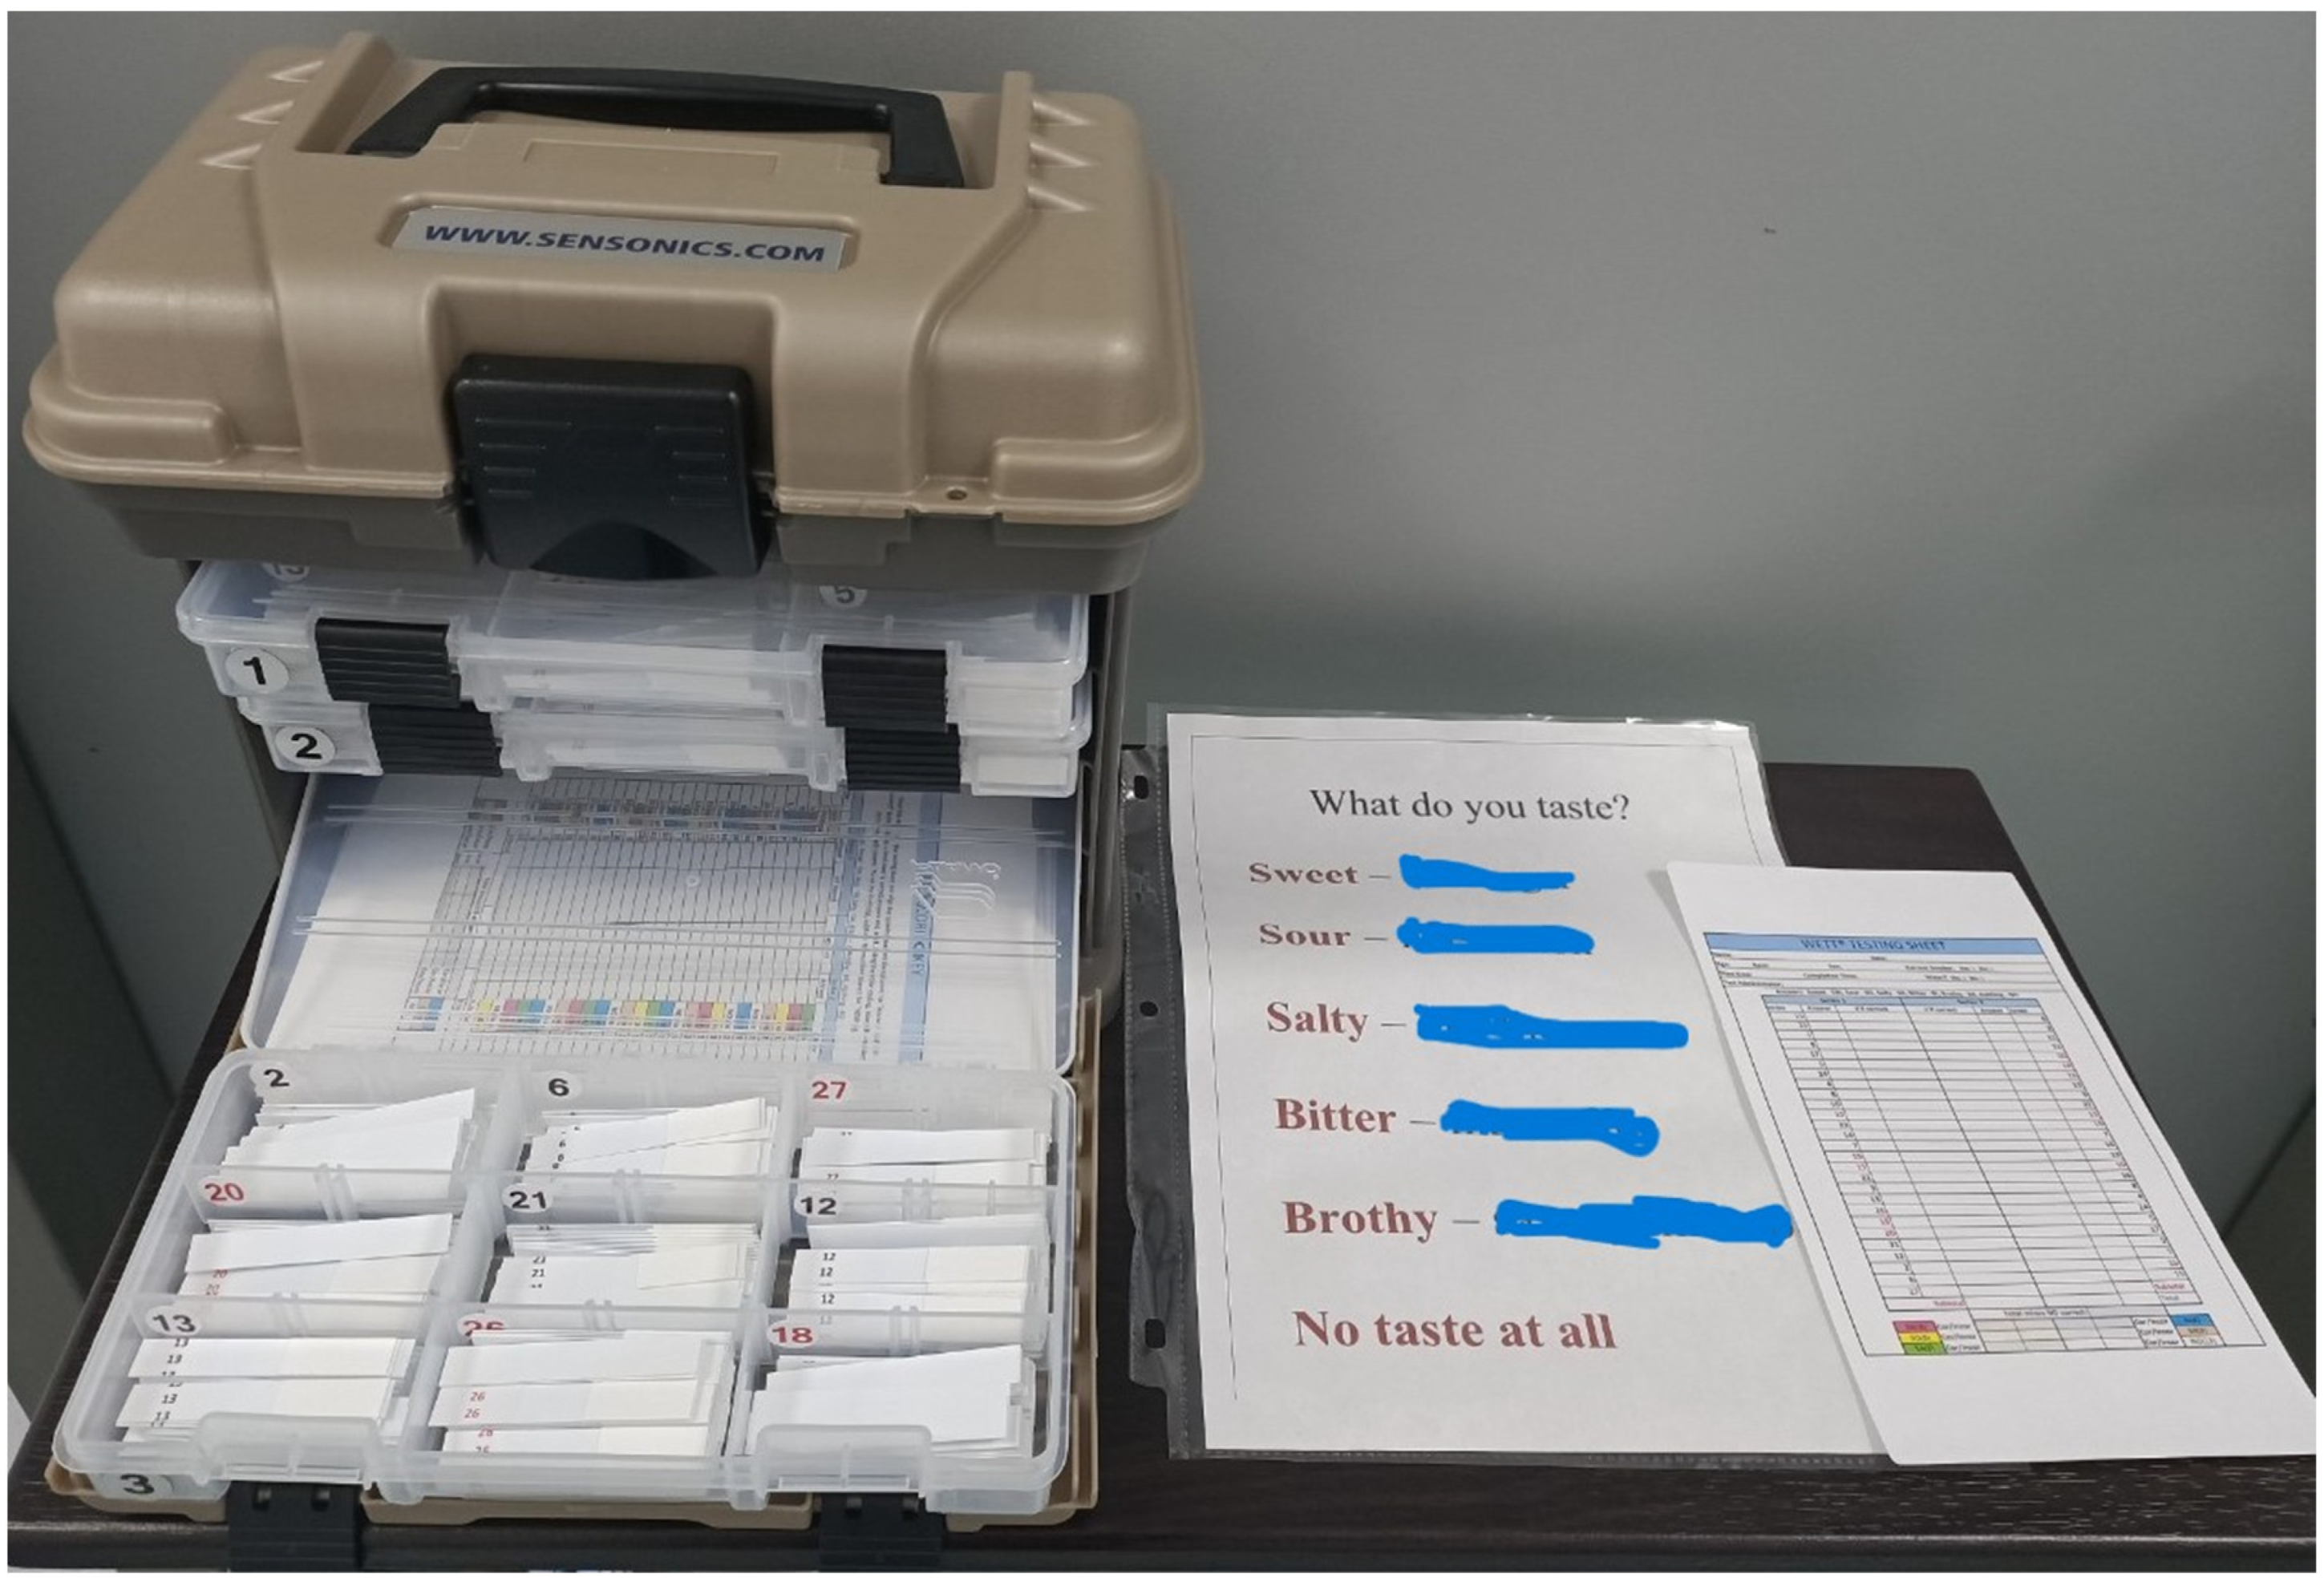
2.2. Taste Test
2.3. Statistical Analyses
3. Results
3.1. Study Subjects
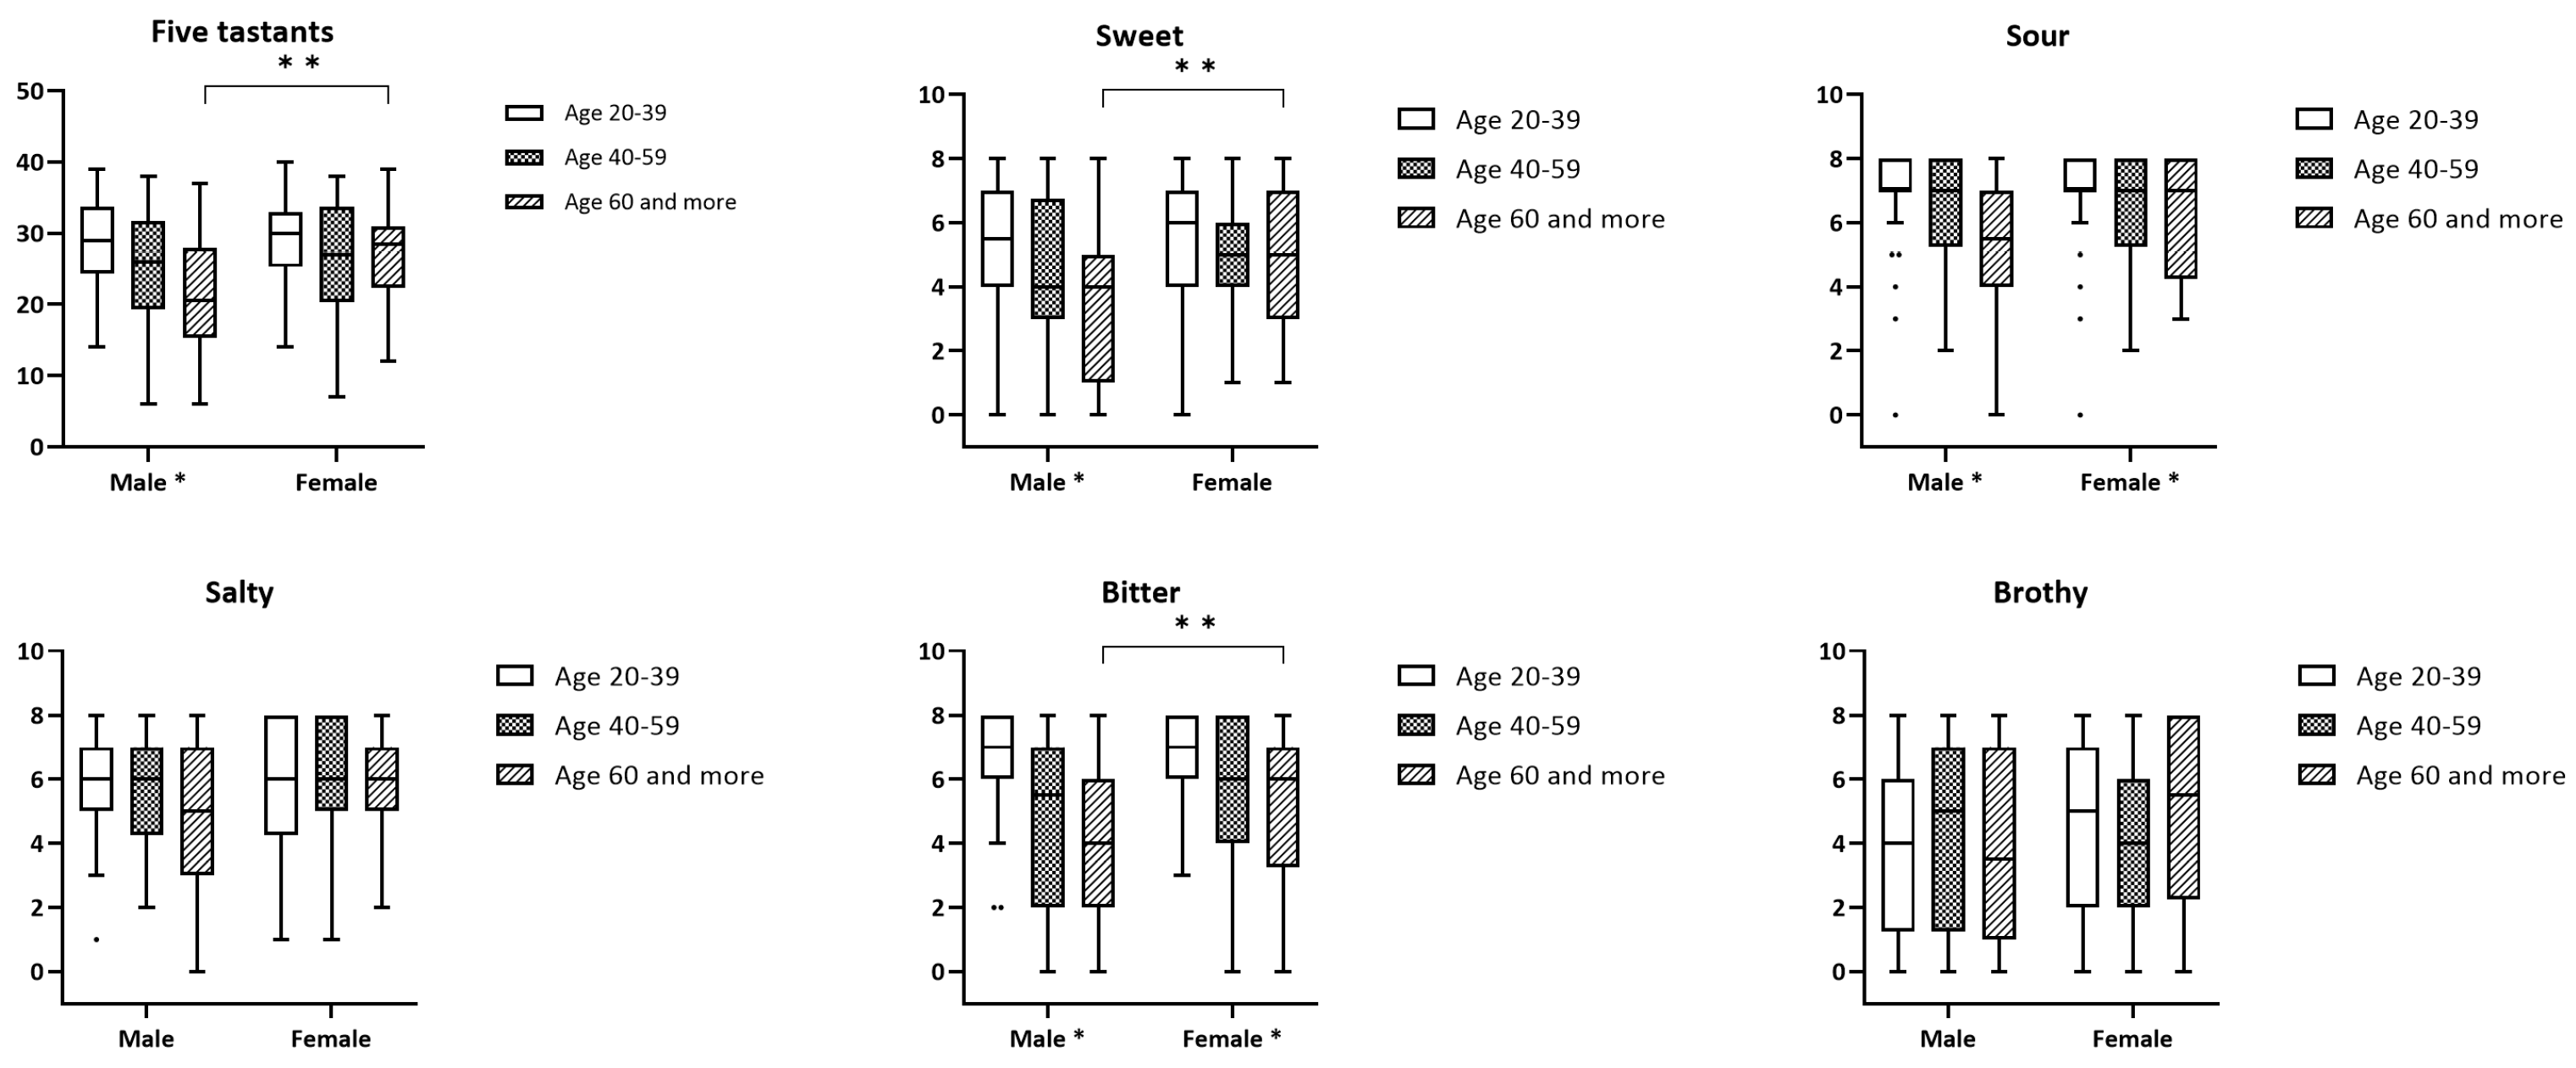
3.2. Waterless Empirical Taste Test
4. Discussion
5. Conclusions
Author Contributions
Funding
Institutional Review Board Statement
Informed Consent Statement
Data Availability Statement
Acknowledgments
Conflicts of Interest
References
- Manzi, B.; Hummel, T. Intensity of regionally applied tastes in relation to administration method: An investigation based on the “taste strips” test. Eur. Arch. Oto-Rhino-Laryngol. 2014, 271, 411–415. [Google Scholar] [CrossRef] [PubMed]
- Liu, G.; Zong, G.; Doty, R.L.; Sun, Q. Prevalence and risk factors of taste and smell impairment in a nationwide representative sample of the US population: A cross-sectional study. BMJ Open 2016, 6, e013246. [Google Scholar] [CrossRef]
- Naciri, L.C.; Mastinu, M.; Melis, M.; Green, T.; Wolf, A.; Hummel, T.; Tomassini Barbarossa, I. A supervised learning regression method for the analysis of the taste functions of healthy controls and patients with chemosensory loss. Biomedicines 2023, 11, 2133. [Google Scholar] [CrossRef]
- Doty, R.L. Age-related deficits in taste and smell. Otolaryngol. Clin. N. Am. 2018, 51, 815–825. [Google Scholar] [CrossRef]
- Whiddon, Z.D.; Rynberg, S.T.; Mast, T.G.; Breza, J.M. Aging decreases chorda-tympani nerve responses to NaCl and alters morphology of fungiform taste pores in rats. Chem. Senses 2018, 43, 117–128. [Google Scholar] [CrossRef]
- Methven, L.; Allen, V.J.; Withers, C.A.; Gosney, M.A. Ageing and taste. Proc. Nutr. Soc. 2012, 71, 556–565. [Google Scholar] [CrossRef]
- Martin, L.J.; Sollars, S.I. Contributory role of sex differences in the variations of gustatory function. J. Neurosci. Res. 2017, 95, 594–603. [Google Scholar] [CrossRef] [PubMed]
- Gudziol, H.; Hummel, T. Normative values for the assessment of gustatory function using liquid tastants. Acta Oto-Laryngol. 2007, 127, 658–661. [Google Scholar] [CrossRef]
- Hyde, R.J.; Feller, R.P. Age and sex effects on taste of sucrose, NaCl, citric acid and caffeine. Neurobiol. Aging 1981, 2, 315–318. [Google Scholar] [CrossRef] [PubMed]
- Yang, L.; Wei, Y.; Yu, D.; Zhang, J.; Liu, Y. Olfactory and gustatory function in healthy adult Chinese subjects. Otolaryngol. Head Neck Surg. 2010, 143, 554–560. [Google Scholar] [CrossRef]
- Welge-Lussen, A.; Dorig, P.; Wolfensberger, M.; Krone, F.; Hummel, T. A study about the frequency of taste disorders. J. Neurol. 2011, 258, 386–392. [Google Scholar] [CrossRef]
- Smutzer, G.; Lam, S.; Hastings, L.; Desai, H.; Abarintos, R.A.; Sobel, M.; Sayed, N. A test for measuring gustatory function. Laryngoscope 2008, 118, 1411–1416. [Google Scholar] [CrossRef]
- Landis, B.N.; Welge-Luessen, A.; Brämerson, A.; Bende, M.; Mueller, C.A.; Nordin, S.; Hummel, T. “Taste Strips”—A rapid, lateralized, gustatory bedside identification test based on impregnated filter papers. J. Neurol. 2009, 256, 242–248. [Google Scholar] [CrossRef] [PubMed]
- Ahne, G.; Erras, A.; Hummel, T.; Kobal, G. Assessment of gustatory function by means of tasting tablets. Laryngoscope 2000, 110, 1396–1401. [Google Scholar] [CrossRef] [PubMed]
- Hummel, T.; Erras, A.; Kobal, G. A test for the screening of taste function. Rhinology 1997, 35, 146–148. [Google Scholar]
- Park, Y.J.; Kho, H.S. Relationship between subjective taste sensations and taste strip test in patients with taste disorders with and without burning mouth syndrome. J. Dent. Sci. 2022, 17, 1528–1537. [Google Scholar] [CrossRef]
- Doty, R.L.; Wylie, C.; Potter, M. Validation of the Waterless Empirical Taste Test (WETT®). Behav. Res. Methods 2021, 53, 864–873. [Google Scholar] [CrossRef]
- Jiang, R.S.; Liu, S.A.; Wang, C.P.; Wu, S.H.; Wang, J.J. A pilot study of the Waterless Empirical Taste Test. Ear Nose Throat J. 2022, 101, 506–513. [Google Scholar] [CrossRef]
- Wang, J.J.; Liang, K.L.; Lin, W.J.; Chen, C.Y.; Jiang, R.S. Influence of age and sex on taste function of healthy subjects. PLoS ONE 2020, 15, e0227014. [Google Scholar] [CrossRef]
- Jiang, R.S.; Wang, J.J. Validation of the clinical applicability of the brief self-administered waterless empirical taste test during the era of COVID-19. J. Chin. Med. Assoc. 2022, 85, 1136–1144. [Google Scholar] [CrossRef]
- Chen, J.; Ren, X.; Yan, H.; Zhao, B.; Chen, J.; Zhu, K.; Lyu, H.; Li, Z.; Doty, R.L. Comparison of Chinese and American subjects on the self-administered Waterless Empirical Taste Test. J. Sens. Stud. 2022, 2022, e12745. [Google Scholar] [CrossRef] [PubMed]
- Lee, T.S.; Dietsch, A.M.; Damra, R.H.; Mulheren, R.W. The effect of genetic taste status on swallowing: A literature review. Am. J. Speech Lang. Pathol. 2023, 32, 1770–1781. [Google Scholar] [CrossRef] [PubMed]
- Sandell, M.; Hoppu, U.; Mikkilä, V.; Mononen, N.; Kähönen, M.; Männistö, S.; Rönnemaa, T.; Viikari, J.; Lehtimäki, T.; Raitakari, O.T. Genetic variation in the hTAS2R38 taste receptor and food consumption among Finnish adults. Genes Nutr. 2014, 9, 433. [Google Scholar] [CrossRef]
- Bachmanov, A.A.; Bosak, N.P.; Lin, C.; Matsumoto, I.; Ohmoto, M.; Reed, D.R.; Nelson, T.M. Genetics of taste receptors. Curr. Pharm. Des. 2014, 20, 2669–2683. [Google Scholar] [CrossRef]
- Cohen, N.A. The genetics of the bitter taste receptor T2R38 in upper airway innate immunity and implications for chronic rhinosinusitis. Laryngoscope 2017, 127, 44–51. [Google Scholar] [CrossRef]
- Bufe, B.; Breslin, P.A.; Kuhn, C.; Reed, D.R.; Tharp, C.D.; Slack, J.P.; Kim, U.K.; Drayna, D.; Meyerhof, W. The molecular basis of individual differences in phenylthiocarbamide and propylthiouracil bitterness perception. Curr. Biol. 2005, 15, 322–327. [Google Scholar] [CrossRef] [PubMed]


| Male | Female | p | |||
|---|---|---|---|---|---|
| Mean | ±SD | Mean | ±SD | ||
| Total score for 5 tastants | |||||
| Age 20–39 | 28.7 | (6.1) | 29.4 | (6.1) | 0.661 |
| Age 40–59 | 25.3 | (7.8) | 26.8 | (7.6) | 0.353 |
| Age 60+ | 21.5 | (8.6) | 27.1 | (6.5) | 0.002 |
| p | 0.001 | 0.263 | |||
| Sweet tastant | |||||
| Age 20–39 | 5.3 | (2.2) | 5.4 | (2.0) | 0.957 |
| Age 40–59 | 4.4 | (2.5) | 4.9 | (2.2) | 0.390 |
| Age 60+ | 3.4 | (2.4) | 4.9 | (1.9) | 0.005 |
| p | 0.003 | 0.431 | |||
| Sour tastant | |||||
| Age 20–39 | 6.9 | (1.6) | 7.0 | (1.6) | 0.849 |
| Age 40–59 | 6.4 | (1.8) | 6.5 | (1.7) | 0.893 |
| Age 60+ | 5.2 | (2.1) | 6.1 | (1.8) | 0.069 |
| p | <0.001 | 0.042 | |||
| Salty tastant | |||||
| Age 20–39 | 5.7 | (1.7) | 6.0 | (1.9) | 0.389 |
| Age 40–59 | 5.6 | (2.2) | 5.9 | (2.1) | 0.580 |
| Age 60+ | 5.0 | (2.2) | 5.8 | (1.6) | 0.085 |
| p | 0.216 | 0.738 | |||
| Bitter tastant | |||||
| Age 20–39 | 6.7 | (1.6) | 6.6 | (1.6) | 0.781 |
| Age 40–59 | 4.7 | (2.8) | 5.7 | (2.3) | 0.133 |
| Age 60+ | 4.2 | (2.5) | 5.3 | (2.3) | 0.037 |
| p | <0.001 | 0.027 | |||
| Umami tastant | |||||
| Age 20–39 | 4.0 | (2.8) | 4.5 | (2.6) | 0.465 |
| Age 40–59 | 4.2 | (2.9) | 3.9 | (2.6) | 0.638 |
| Age 60+ | 3.9 | (3.1) | 5.1 | (2.7) | 0.061 |
| p | 0.956 | 0.104 | |||
| 5 Tastants | Sweet | Sour | Salty | Bitter | Umami | |
|---|---|---|---|---|---|---|
| Male subjects | ||||||
| Age 20–39 | 21.1 | 2 | 5 | 3 | 4.1 | 0 |
| Age 40–59 | 14.2 | 1 | 4 | 2 | 0 | 0 |
| Age 60+ | 9 | 0 | 2.1 | 2 | 1 | 0 |
| Female subjects | ||||||
| Age 20–39 | 21.1 | 3 | 5.1 | 3 | 4 | 1 |
| Age 40–59 | 16.1 | 2 | 4.1 | 2.1 | 2.1 | 0 |
| Age 60+ | 18.1 | 2.1 | 3 | 3 | 2 | 1 |
| All subjects | ||||||
| Age 20–39 | 21.1 | 3 | 5 | 3 | 4 | 0 |
| Age 40–59 | 16 | 1 | 4 | 2 | 0.1 | 0 |
| Age 60+ | 13.1 | 1 | 3 | 3 | 1 | 0 |
| All male subjects | 14 | 0.1 | 3 | 2.1 | 1 | 0 |
| All female subjects | 18 | 2 | 4 | 3 | 2.1 | 1 |
Disclaimer/Publisher’s Note: The statements, opinions and data contained in all publications are solely those of the individual author(s) and contributor(s) and not of MDPI and/or the editor(s). MDPI and/or the editor(s) disclaim responsibility for any injury to people or property resulting from any ideas, methods, instructions or products referred to in the content. |
© 2023 by the authors. Licensee MDPI, Basel, Switzerland. This article is an open access article distributed under the terms and conditions of the Creative Commons Attribution (CC BY) license (https://creativecommons.org/licenses/by/4.0/).
Share and Cite
Jiang, R.-S.; Chiang, Y.-F. Effect of Age and Gender on Taste Function as Measured by the Waterless Empirical Taste Test. Diagnostics 2023, 13, 3172. https://doi.org/10.3390/diagnostics13203172
Jiang R-S, Chiang Y-F. Effect of Age and Gender on Taste Function as Measured by the Waterless Empirical Taste Test. Diagnostics. 2023; 13(20):3172. https://doi.org/10.3390/diagnostics13203172
Chicago/Turabian StyleJiang, Rong-San, and Yi-Fang Chiang. 2023. "Effect of Age and Gender on Taste Function as Measured by the Waterless Empirical Taste Test" Diagnostics 13, no. 20: 3172. https://doi.org/10.3390/diagnostics13203172
APA StyleJiang, R.-S., & Chiang, Y.-F. (2023). Effect of Age and Gender on Taste Function as Measured by the Waterless Empirical Taste Test. Diagnostics, 13(20), 3172. https://doi.org/10.3390/diagnostics13203172