
Sex-Specific Cut-Offs of Single Point Insulin Sensitivity Estimator (SPISE) in Predicting Metabolic Syndrome in the Arab Adolescents

 ,
, 
Abstract
1. Introduction
2. Materials and Methods
2.1. Study Participants and Recruitment
2.2. Clinical and Biochemical Evaluations
2.3. MetS Components and SPISE Index Determination
- Elevated waist circumference: age-specific waist circumference of ≥90th percentile
- Elevated blood pressure: age-specific systolic or diastolic blood pressure of ≥90th percentile
- Elevated fasting glucose: fasting glucose level of ≥6.1 mmol/L
- Elevated triglycerides: circulating triglyceride levels of ≥1.24 mmol/L for age 10–15 years and ≥1.7 mmol/L for age ≥16 years
- Low HDL-cholesterol: circulating HDL-cholesterol level of ≤1.03 mmol/L
2.4. Data Analysis
3. Results
3.1. Clinical Characteristics of the Subjects
3.2. Characteristics of the Study Subjects Divided into MetS/Non-MetS Groups
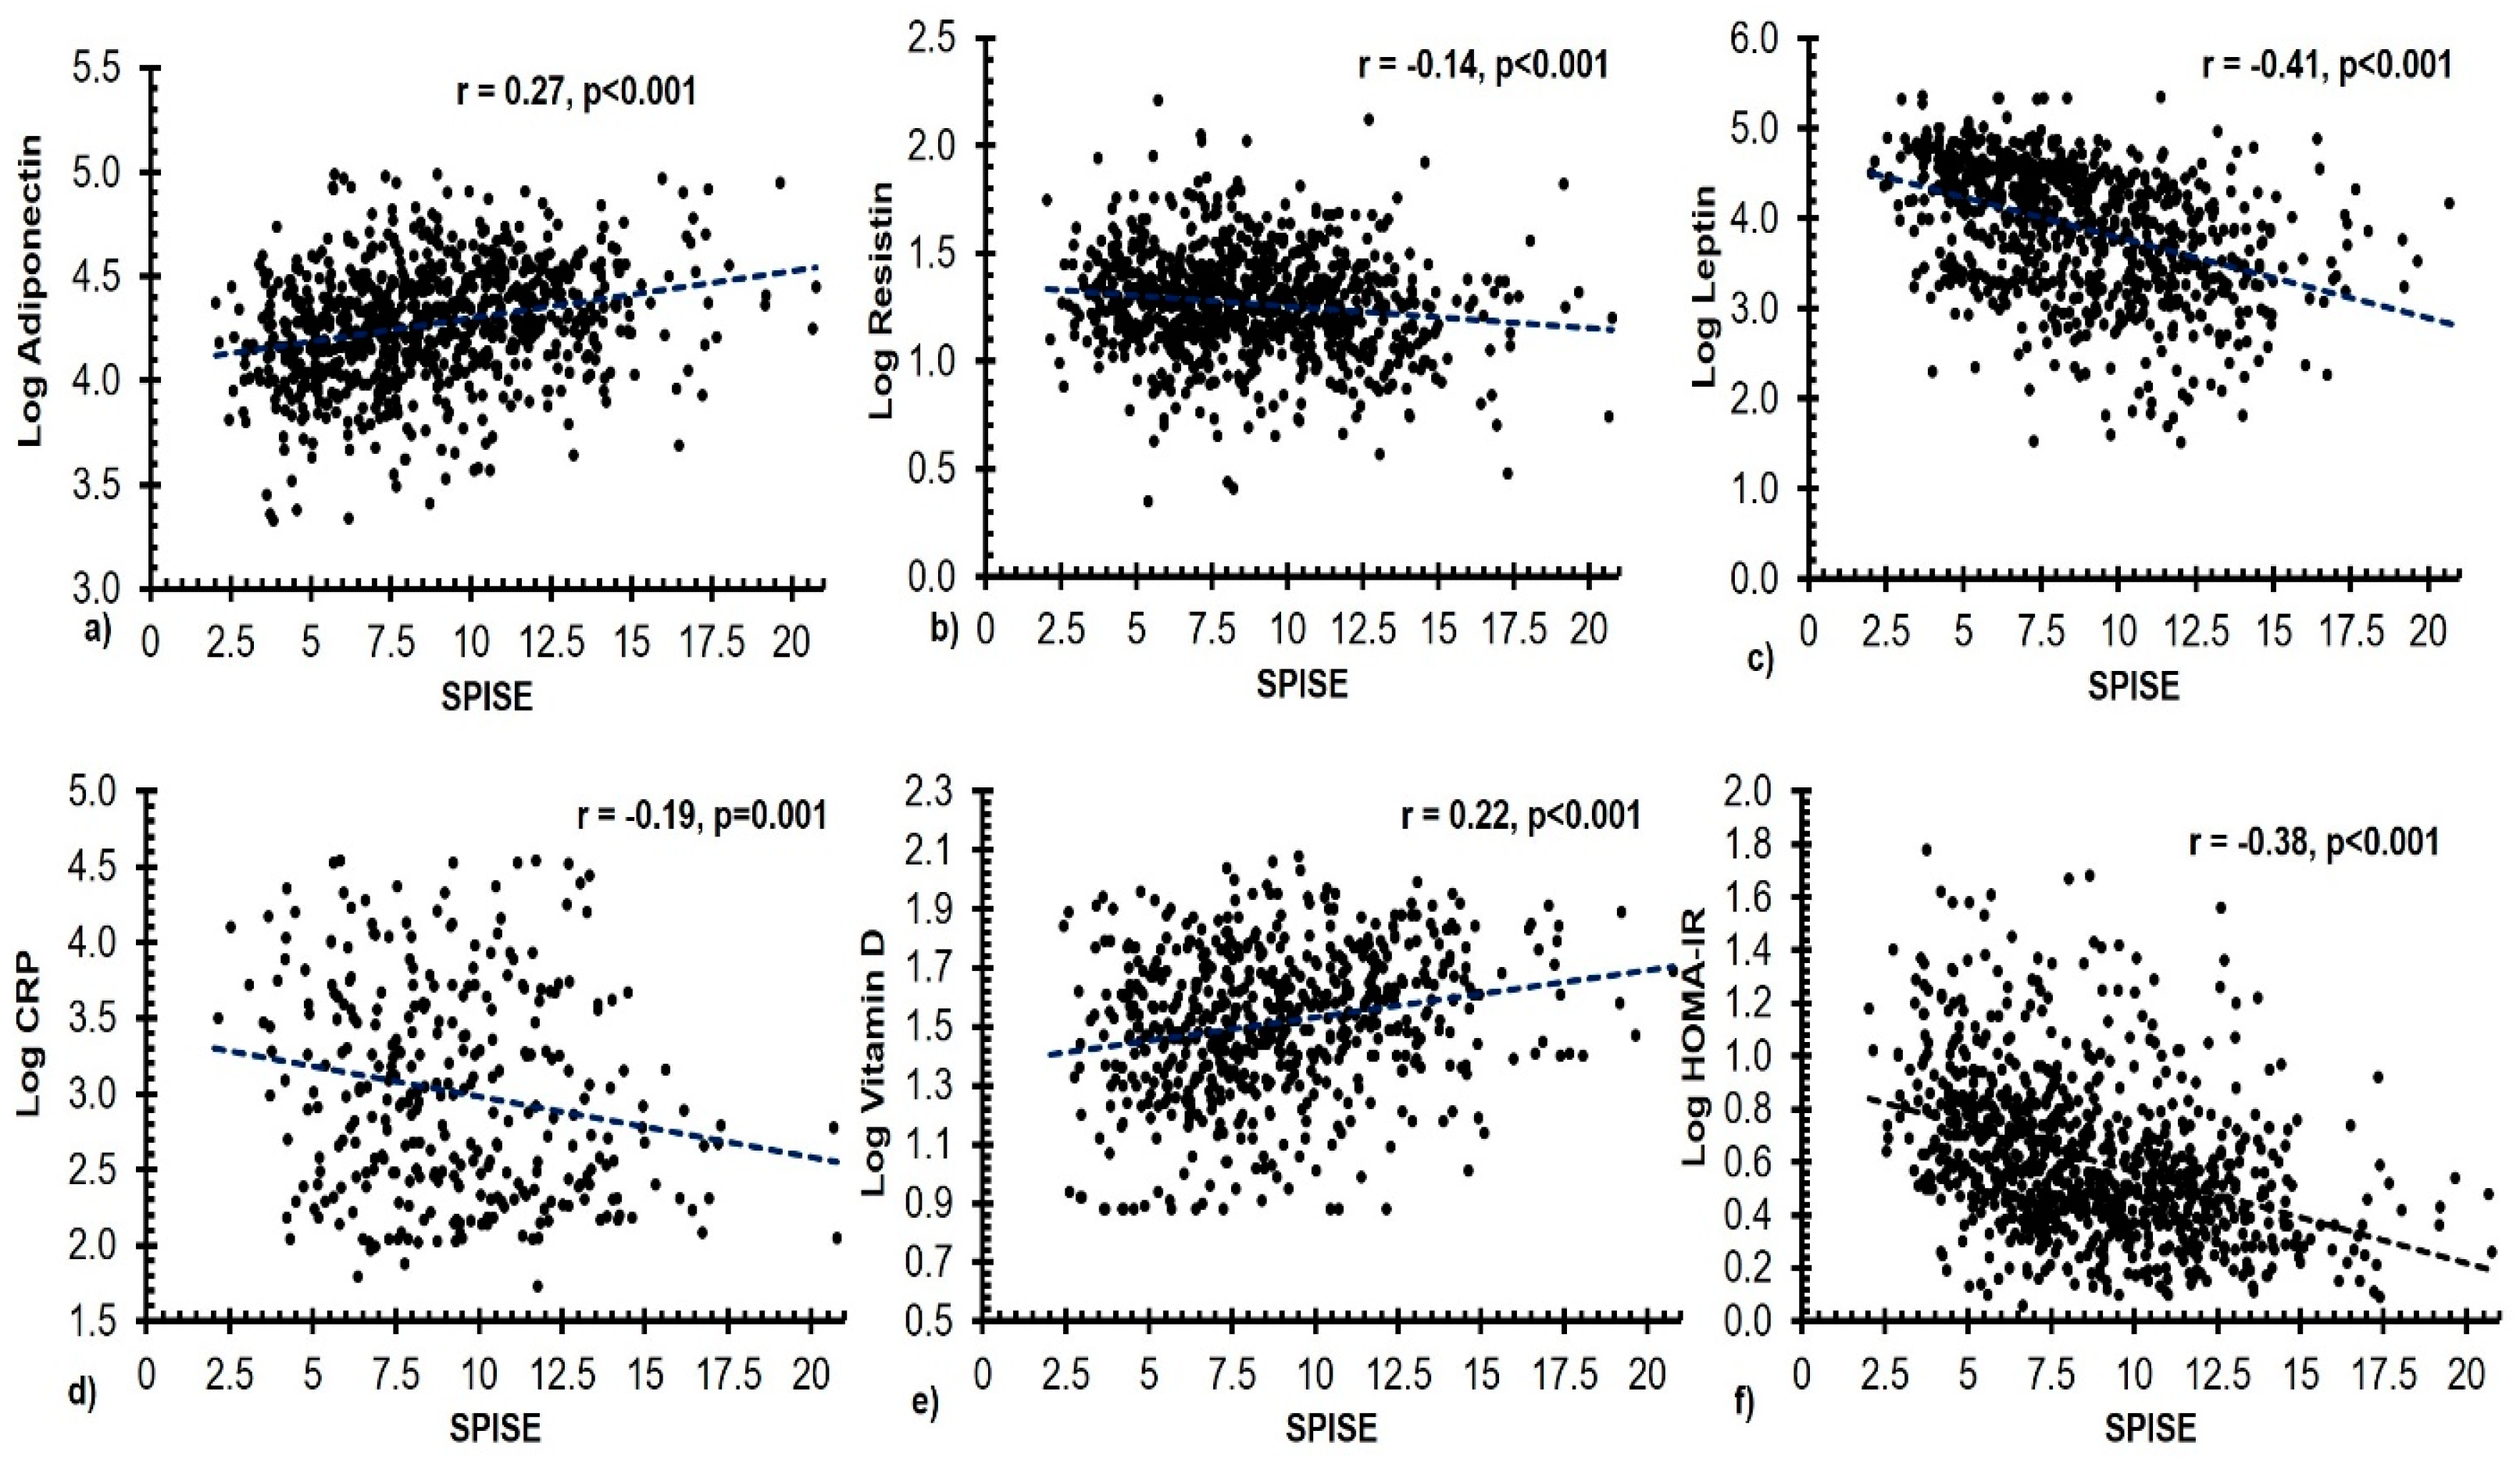
3.3. Associations of SPISE Index with Other Measured Variables
3.4. Receiver Operating Characteristic (ROC) Curve of SPISE Index in Predicting MetS/Non MetS
3.5. MetS Components According to Cut-Offs in SPISE Index
4. Discussion
5. Conclusions
Supplementary Materials
Author Contributions
Funding
Institutional Review Board Statement
Informed Consent Statement
Data Availability Statement
Acknowledgments
Conflicts of Interest
References
- Al-Rubeaan, K.; Bawazeer, N.; Al Farsi, Y.; Youssef, A.M.; Al-Yahya, A.A.; AlQumaidi, H.; Al-Malki, B.M.; Naji, K.A.; Al-Shehri, K.; Al Rumaih, F.I. Prevalence of metabolic syndrome in Saudi Arabia—A cross sectional study. BMC Endocr. Disord. 2018, 18, 16. [Google Scholar] [CrossRef] [PubMed]
- Guembe, M.J.; Fernandez-Lazaro, C.I.; Sayon-Orea, C.; Toledo, E.; Moreno-Iribas, C.; Cosials, J.B.; Reyero, J.B.; Martínez, J.D.; Diego, P.G.; Uche, A.M.G.; et al. Risk for cardiovascular disease associated with metabolic syndrome and its components: A 13-year prospective study in the RIVANA cohort. Cardiovasc. Diabetol. 2020, 19, 195. [Google Scholar] [CrossRef] [PubMed]
- Galassi, A.; Reynolds, K.; He, J. Metabolic Syndrome and Risk of Cardiovascular Disease: A Meta-Analysis. Am. J. Med. 2006, 119, 812–819. [Google Scholar] [CrossRef]
- Park, M.H.; Falconer, C.; Viner, R.M.; Kinra, S. The impact of childhood obesity on morbidity and mortality in adulthood: A systematic review. Obes. Rev. 2012, 13, 985–1000. [Google Scholar] [CrossRef] [PubMed]
- Gupta, N.; Shah, P.; Nayyar, S.; Misra, A. Childhood Obesity and the Metabolic Syndrome in Developing Countries. Indian J. Pediatr. 2013, 80, 28–37. [Google Scholar] [CrossRef]
- Al-Daghri, N.M.; Aljohani, N.J.; Al-Attas, O.S.; Al-Saleh, Y.; Alnaami, A.M.; Sabico, S.; Amer, O.E.; Alharbi, M.; Kumar, S.; Alokail, M.S. Comparisons in childhood obesity and cardiometabolic risk factors among urban Saudi Arab adolescents in 2008 and 2013. Child Care Health Dev. 2016, 42, 652–657. [Google Scholar] [CrossRef]
- Amer, O.E.; Sabico, S.; Khattak, M.N.; Alnaami, A.M.; Aljohani, N.J.; Alfawaz, H.; AlHameidi, A.; Al-Daghri, N.M. Increasing prevalence of pediatric metabolic syndrome and its components among Arab youth: A time-series study from 2010–2019. Children 2021, 8, 1129. [Google Scholar] [CrossRef]
- Farrag, N.S.; Cheskin, L.J.; Farag, M.K. A systematic review of childhood obesity in the Middle East and North Africa (MENA) region: Health impact and management. Adv. Pediatr. Res. 2017, 4, 6. [Google Scholar]
- Bleich, S.N.; Vercammen, K.A.; Zatz, L.Y.; Frelier, J.M.; Ebbeling, C.B.; Peeters, A. Interventions to prevent global childhood overweight and obesity: A systematic review. Lancet Diabetes Endocrinol. 2018, 6, 332–346. [Google Scholar] [CrossRef]
- Al-Daghri, N.M.; Alkharfy, K.M.; Alokail, M.S.; Alenad, A.M.; Al-Attas, O.S.; Mohammed, A.K.; Sabico, S.; Albagha, O.M. Assessing the contribution of 38 genetic loci to the risk of type 2 diabetes in the Saudi Arabian Population. Clin. Endocrinol. 2014, 80, 532–537. [Google Scholar] [CrossRef]
- Balkau, B.; Charles, M.A. Comment on the provisional report from the WHO consultation. European Group for the Study of Insulin Resistance (EGIR). Diabet. Med. 1999, 16, 442–443. [Google Scholar] [CrossRef]
- Petersen, M.C.; Shulman, G.I. Mechanisms of Insulin Action and Insulin Resistance. Physiol. Rev. 2018, 98, 2133–2223. [Google Scholar] [CrossRef]
- Auger, C.; Kajimura, S. Adipose tissue remodeling in pathophysiology. Annu. Rev. Pathol. 2023, 18. [Google Scholar] [CrossRef] [PubMed]
- Scheja, L.; Heeren, J. The endocrine function of adipose tissues in health and cardiometabolic disease. Nat. Rev. Endocrinol. 2019, 15, 507–524. [Google Scholar] [CrossRef]
- Zhang, Y.; Xue, Y.; Zhang, D.; Liu, Y.; Xu, Z.; Gao, J.; Li, W.; Li, X. Effect of Vitamin D Supplementation on Glycemic Control in Prediabetes: A Meta-Analysis. Nutrients 2021, 13, 4464. [Google Scholar] [CrossRef] [PubMed]
- Singh, B.; Saxena, A. Surrogate markers of insulin resistance: A review. World J. Diabetes 2010, 1, 36–47. [Google Scholar] [CrossRef] [PubMed]
- Placzkowska, S.; Pawlik-Sobecka, L.; Kokot, I.; Piwowar, A. Indirect insulin resistance detection: Current clinical trends and laboratory limitations. Biomed. Pap. Med. Fac. Univ. Palacky Olomouc Czechoslov. Repub. 2019, 163, 187–199. [Google Scholar] [CrossRef]
- Tam, C.S.; Xie, W.; Johnson, W.D.; Cefalu, W.T.; Redman, L.M.; Ravussin, E. Defining insulin resistance from hyperin-sulinemic-euglycemic clamps. Diabetes Care 2012, 35, 1605–1610. [Google Scholar] [CrossRef]
- Samaras, K.; McElduff, A.; Twigg, S.M.; Proietto, J.; Prins, J.B.; Welborn, T.A.; Zimmet, P.; Chisholm, D.J.; Campbell, L.V. Insulin levels in insulin resistance: Phantom of the metabolic opera? Med. J. Aust. 2006, 185, 159–161. [Google Scholar] [CrossRef]
- Giannini, C.; Santoro, N.; Caprio, S.; Kim, G.; Lartaud, D.; Shaw, M.; Pierpont, B.; Weiss, R. The triglyceride-to-HDL cholesterol ratio: Association with insulin resistance in obese youths of different ethnic backgrounds. Diabetes Care 2011, 34, 1869–1874. [Google Scholar] [CrossRef]
- Kim-Dorner, S.-J.; Deuster, P.A.; Zeno, S.A.; Remaley, A.T.; Poth, M. Should triglycerides and the triglycerides to high-density lipoprotein cholesterol ratio be used as surrogates for insulin resistance? Metabolism 2010, 59, 299–304. [Google Scholar] [CrossRef] [PubMed]
- Paulmichl, K.; Hatunic, M.; Højlund, K.; Jotic, A.; Krebs, M.; Mitrakou, A.; Porcellati, F.; Tura, A.; Bergsten, P.; Forslund, A. Modification and Validation of the Triglyceride-to–HDL Cholesterol Ratio as a Surrogate of Insulin Sensitivity in White Juveniles and Adults without Diabetes Mellitus: The Single Point Insulin Sensitivity Estimator (SPISE). Clin. Chem. 2016, 62, 1211–1219. [Google Scholar] [CrossRef]
- Ha, J.; Oh, Y.-R.; Kang, E.; Nam, H.-K.; Rhie, Y.-J.; Lee, K.-H. Single Point Insulin Sensitivity Estimator for predicting type 2 diabetes mellitus in obese adolescents. Ann. Pediatr. Endocrinol. Metab. 2022, 27, 201–206. [Google Scholar] [CrossRef] [PubMed]
- Correa-Burrows, P.; Blanco, E.; Gahagan, S.; Burrows, R. Validity assessment of the single-point insulin sensitivity estimator (spise) for diagnosis of cardiometabolic risk in post-pubertal hispanic adolescents. Sci. Rep. 2020, 10, 14399. [Google Scholar] [CrossRef]
- Dudi, P.; Goyal, B.; Saxena, V.; Rabari, K.; Mirza, A.A.; Naithani, M.; Kumar, T.; Goyal, R. Single point insulin sensitivity estimator as an index for insulin sensitivity for metabolic syndrome: A study in North Indian population. J. Lab. Physicians 2019, 11, 244–248. [Google Scholar] [CrossRef]
- Al-Daghri, N.M. Extremely high prevalence of metabolic syndrome manifestations among Arab youth: A call for early intervention. Eur. J. Clin. Investig. 2010, 40, 1063–1066. [Google Scholar] [CrossRef]
- Al-Daghri, N.M.; Wani, K.; Khattak, M.N.K.; Alnaami, A.M.; Amer, O.E.; Aljohani, N.J.; Hameidi, A.; Alfawaz, H.; Alharbi, M.; Sabico, S. Cardiometabolic Effects of a 12-Month, COVID-19 Lockdown-Interrupted Lifestyle Education Program for Arab Adolescents. Front. Pediatr. 2022, 10, 887138. [Google Scholar] [CrossRef]
- Al-Daghri, N.M.; Rahman, S.; Sabico, S.; Yakout, S.; Wani, K.; Al-Attas, O.S.; Saravanan, P.; Tripathi, G.; McTernan, P.G.; Alokail, M.S. Association of Vitamin B12 with Pro-Inflammatory Cytokines and Biochemical Markers Related to Cardiometabolic Risk in Saudi Subjects. Nutrients 2016, 8, 460. [Google Scholar] [CrossRef]
- Cook, S.; Weitzman, M.; Auinger, P.; Nguyen, M.; Dietz, W.H. Prevalence of a metabolic syndrome phenotype in ado-lescents: Findings from the third National Health and Nutrition Examination Survey, 1988–1994. Arch. Pediatr. Adolesc. Med. 2003, 157, 821–827. [Google Scholar] [CrossRef]
- Tang, Q.; Li, X.; Song, P.; Xu, L. Optimal cut-off values for the homeostasis model assessment of insulin resistance (HOMA-IR) and pre-diabetes screening: Developments in research and prospects for the future. Drug Discov. Ther. 2015, 9, 380–385. [Google Scholar] [CrossRef]
- Gluvic, Z.; Zaric, B.; Resanovic, I.; Obradovic, M.; Mitrovic, A.; Radak, D.; R Isenovic, E. Link between metabolic syn-drome and insulin resistance. Curr. Vasc. Pharmacol. 2017, 15, 30–39. [Google Scholar] [CrossRef]
- Al-Daghri, N.M.; Al-Attas, O.S.; Alokail, M.; Alkharfy, K.; Wani, K.; Amer, O.E.; Haq, S.U.; Rahman, S.; Alnaami, A.M.; Livadas, S.; et al. Does visceral adiposity index signify early metabolic risk in children and adolescents?: Association with insulin resistance, adipokines, and subclinical inflammation. Pediatr. Res. 2014, 75, 459–463. [Google Scholar] [CrossRef]
- Hernandez-Baixauli, J.; Quesada-Vázquez, S.; Mariné-Casadó, R.; Gil Cardoso, K.; Caimari, A.; Del Bas, J.M.; Escoté, X.; Baselga-Escudero, L. Detection of Early Disease Risk Factors Associated with Metabolic Syndrome: A New Era with the NMR Metabolomics Assessment. Nutrients 2020, 12, 806. [Google Scholar] [CrossRef] [PubMed]
- DeFronzo, R.A.; Tobin, J.D.; Andres, R. Glucose clamp technique: A method for quantifying insulin secretion and resistance. Am. J. Physiol. Endocrinol. Metab. 1979, 237, E214–E223. [Google Scholar] [CrossRef]
- Matthews, D.R.; Hosker, J.; Rudenski, A.; Naylor, B.; Treacher, D.; Turner, R. Homeostasis model assessment: Insulin resistance and β-cell function from fasting plasma glucose and insulin concentrations in man. Diabetologia 1985, 28, 412–419. [Google Scholar] [CrossRef]
- Katz, A.; Nambi, S.S.; Mather, K.; Baron, A.D.; Follmann, D.A.; Sullivan, G.; Quon, M.J. Quantitative insulin sensitivity check index: A simple, accurate method for assessing insulin sensitivity in humans. J. Clin. Endocrinol. Metab. 2000, 85, 2402–2410. [Google Scholar] [CrossRef]
- Henderson, M.; Rabasa-Lhoret, R.; Bastard, J.-P.; Chiasson, J.-L.; Baillargeon, J.-P.; Hanley, J.; Lambert, M. Measuring insulin sensitivity in youth: How do the different indices compare with the gold-standard method? Diabetes Metab. 2011, 37, 72–78. [Google Scholar] [CrossRef] [PubMed]
- Vega, G.L.; Barlow, C.E.; Grundy, S.M.; Leonard, D.; DeFina, L.F. Triglyceride-To-High-Density-Lipoprotein-Cholesterol Ratio Is an Index of Heart Disease Mortality and of Incidence of Type 2 Diabetes Mellitus in Men. J. Investig. Med. 2014, 62, 345–349. [Google Scholar] [CrossRef] [PubMed]
- Newgard, C.B. Interplay between Lipids and Branched-Chain Amino Acids in Development of Insulin Resistance. Cell Metab. 2012, 15, 606–614. [Google Scholar] [CrossRef]
- Garvey, W.T.; Kwon, S.; Zheng, D.; Shaughnessy, S.; Wallace, P.; Hutto, A.; Pugh, K.; Jenkins, A.J.; Klein, R.L.; Liao, Y. Effects of Insulin Resistance and Type 2 Diabetes on Lipoprotein Subclass Particle Size and Concentration Determined by Nuclear Magnetic Resonance. Diabetes 2003, 52, 453–462. [Google Scholar] [CrossRef]
- Festa, A.; Williams, K.; Hanley, A.J.; Otvos, J.D.; Goff, D.C.; Wagenknecht, L.E.; Haffner, S.M. Nuclear magnetic resonance lipoprotein abnormalities in prediabetic subjects in the Insulin Resistance Atherosclerosis Study. Circulation 2005, 111, 3465–3472. [Google Scholar] [CrossRef] [PubMed]
- Ginsberg, H.N.; Zhang, Y.-L.; Hernandez-Ono, A. Regulation of Plasma Triglycerides in Insulin Resistance and Diabetes. Arch. Med. Res. 2005, 36, 232–240. [Google Scholar] [CrossRef] [PubMed]
- Wang, H.; Eckel, R.H. Lipoprotein lipase: From gene to obesity. Am. J. Physiol. Endocrinol. Metab. 2009, 297, E271–E288. [Google Scholar] [CrossRef]
- Al-Daghri, N.M.; Wani, K.; Sabico, S.; Garbis, S.D.; Chrousos, G.P.; Amer, O.E.; Ansari, M.G.A.; Al-Saleh, Y.; Aljohani, N.J.; Al-Attas, O.S.; et al. Sex-specific expression of apolipoprotein levels following replenishment of vitamin D. J. Steroid Biochem. Mol. Biol. 2018, 180, 129–136. [Google Scholar] [CrossRef]
- Sumner, A.E.; Vega, G.L.; Genovese, D.J.; Finley, K.B.; Bergman, R.N.; Boston, R.C. Normal triglyceride levels despite insulin resistance in African Americans: Role of lipoprotein lipase. Metabolism 2005, 54, 902–909. [Google Scholar] [CrossRef]
- Kodama, K.; Tojjar, D.; Yamada, S.; Toda, K.; Patel, C.J.; Butte, A.J. Ethnic differences in the relationship between insulin sensitivity and insulin response: A systematic review and meta-analysis. Diabetes Care 2013, 36, 1789–1796. [Google Scholar] [CrossRef]
- Chen, Y.; Chang, Z.; Liu, Y.; Zhao, Y.; Fu, J.; Zhang, Y.; Liu, Y.; Fan, Z. Triglyceride to high-density lipoprotein cholesterol ratio and cardiovascular events in the general population: A systematic review and meta-analysis of cohort studies. Nutr. Metab. Cardiovasc. Dis. NMCD 2021, 32, 318–329. [Google Scholar] [CrossRef]
- Barnes, K.M.; Miner, J.L. Role of Resistin in Insulin Sensitivity in Rodents and Humans. Curr. Protein Pept. Sci. 2009, 10, 96–107. [Google Scholar] [CrossRef]
- Denroche, H.; Huynh, F.; Kieffer, T.J. The role of leptin in glucose homeostasis. J. Diabetes Investig. 2012, 3, 115–129. [Google Scholar] [CrossRef]
- Frühbeck, G.; Busetto, L.; Dicker, D.; Yumuk, V.; Goossens, G.H.; Hebebrand, J.; Halford, J.G.; Farpour-Lambert, N.J.; Blaak, E.E.; Woodward, E.; et al. The ABCD of Obesity: An EASO Position Statement on a Diagnostic Term with Clinical and Scientific Implications. Obes. Facts 2019, 12, 131–136. [Google Scholar] [CrossRef]
- Frühbeck, G.; Gómez-Ambrosi, J.; Salvador, J. Leptin-induced lipolysis opposes the tonic inhibition of endogenous adenosine in white adipocytes. FASEB J. 2001, 15, 333–340. [Google Scholar] [CrossRef] [PubMed]
- Rodríguez, A.; Gomez-Ambrosi, J.; Catalan, V.; Rotellar, F.; Valentí, V.; Silva, C.; Mugueta, M.D.C.; Pulido, M.R.; Vázquez, R.; Salvador, J.; et al. The ghrelin O-acyltransferase—ghrelin system reduces TNF-α-induced apoptosis and autophagy in human visceral adipocytes. Diabetologia 2012, 55, 3038–3050. [Google Scholar] [CrossRef]
- Sjöholm, Å.; Nyström, T. Endothelial inflammation in insulin resistance. Lancet 2005, 365, 610–612. [Google Scholar] [CrossRef] [PubMed]
- Ndumele, C.E.; Pradhan, A.D.; Ridker, P.M. Interrelationships between inflammation, C-reactive protein, and insulin resistance. J. Cardiometabolic Syndr. 2006, 1, 190–196. [Google Scholar] [CrossRef] [PubMed]
- Ye, R.; Scherer, P.E. Adiponectin, driver or passenger on the road to insulin sensitivity? Mol. Metab. 2013, 2, 133–141. [Google Scholar] [CrossRef]
- Teegarden, D.; Donkin, S.S. Vitamin D: Emerging new roles in insulin sensitivity. Nutr. Res. Rev. 2009, 22, 82–92. [Google Scholar] [CrossRef]
- Frühbeck, G.; Catalán, V.; Rodríguez, A.; Ramírez, B.; Becerril, S.; Salvador, J.; Colina, I.; Gómez-Ambrosi, J. Adiponectin-leptin ratio is a functional biomarker of adipose tissue inflammation. Nutrients 2019, 11, 454. [Google Scholar] [CrossRef]
- Link, J.C.; Reue, K. Genetic Basis for Sex Differences in Obesity and Lipid Metabolism. Annu. Rev. Nutr. 2017, 37, 225–245. [Google Scholar] [CrossRef]
- Kim, C.; Halter, J.B. Endogenous sex hormones, metabolic syndrome, and diabetes in men and women. Curr. Cardiol. Rep. 2014, 16, 467. [Google Scholar] [CrossRef]
- Pinyerd, B.; Zipf, W.B. Puberty—Timing is everything! J. Pediatr. Nurs. 2005, 20, 75–82. [Google Scholar] [CrossRef]


| Parameters | All Subjects (951) | Boys (503) | Girls (448) | p-Value |
|---|---|---|---|---|
| Anthropometric Characteristics | ||||
| Age (years) | 13.8 ± 2.3 | 13.9 ± 2.2 | 13.7 ± 2.3 | 0.14 |
| BMI (kg/m2) | 22.1 ± 6.3 | 21.4 ± 6.2 | 22.8 ± 6.3 | 0.001 |
| Waist (cm) | 75 ± 16 | 76 ± 17 | 74 ± 15 | 0.06 |
| Hip (cm) | 87 ± 17 | 86 ± 18 | 89 ± 16 | 0.001 |
| WHR | 0.88 ± 0.3 | 0.92 ± 0.4 | 0.84 ± 0.1 | <0.001 |
| Systolic BP | 107 ± 10 | 107 ± 10 | 106 ± 10 | 0.35 |
| Diastolic BP | 69 ± 7 | 69 ± 8 | 69 ± 7 | 0.96 |
| Lipid Profile | ||||
| Total Cholesterol (mmol/L) | 4.2 ± 0.8 | 4.2 ± 0.8 | 4.2 ± 0.8 | 0.35 |
| HDL-Cholesterol (mmol/L) | 1.02 ± 0.4 | 0.99 ± 0.3 | 1.1 ± 0.3 | 0.007 |
| Triglycerides (mmol/L) | 0.9(0.7–1.3) | 0.96(0.7–1.3) | 0.94(0.7–1.3) | 0.69 |
| Adipocytokines and Inflammatory Markers | ||||
| Adiponectin (µg/mL) | 18.9(12.5–28.5) | 17.8(11–27.7) | 20.1(12.8–29.7) | 0.001 |
| Resistin (ng/mL) | 18.6(13.5–25.6) | 17.6(12.1–23.8) | 19.9(14.8–27.9) | <0.001 |
| Leptin (ng/mL) | 11.4(2.5–31.4) | 6.3(1.8–22.2) | 19.5(5.4–38.1) | <0.001 |
| Adiponectin/Leptin | 1.82(0.5–8.9) | 2.99(0.7–13.3) | 1.17(0.4–4.2) | <0.001 |
| TNF-Alpha (pg/mL) | 8.4(5.7–12.1) | 9.1(6.0–13.2) | 7.7(5.3–10.6) | <0.001 |
| CRP (µg/mL) | 0.99(0.3–3.9) | 0.99(0.3–3.7) | 1.01(0.3–4.1) | 0.89 |
| APAI-1 (ng/mL) | 24.2(14.5–34.5) | 23.7(12.9–34.3) | 24.3(15.3–34.7) | 0.35 |
| 25(OH) D (nmmol/L) | 33.4(22.7–48.0) | 40.9(29.5–57.5) | 26.4(17.6–37.3) | <0.001 |
| Glycemic Profile | ||||
| Glucose (mmol/L) | 5.1 ± 1.1 | 5.1 ± 1.0 | 5.1 ± 1.2 | 0.79 |
| Insulin (miU/mL) | 11.8(6.9–21.3) | 10.9(6.3–21.3) | 12.5(7.7–21.4) | 0.027 |
| HOMA-IR | 2.6(1.5–4.9) | 2.4(1.3–5.0) | 2.8(1.7–4.9) | 0.052 |
| SPISE | 8.67 ± 3.3 | 8.95 ± 3.3 | 8.37 ± 3.4 | 0.010 |
| Parameters | All (951) | Boys (503) | Girls (448) | ||||||
|---|---|---|---|---|---|---|---|---|---|
| Non-MetS 869 | MetS 82 | p-Value | Non-MetS 449 | MetS 54 | p-Value | Non-MetS 420 | MetS 28 | p-Value | |
| Age (years) | 13.7 ± 2.3 | 14.9 ± 1.9 | <0.001 | 13.8 ± 2.2 | 14.7 ± 2.1 | 0.003 | 13.6 ± 2.3 | 15.2 ± 1.8 | <0.001 |
| BMI (kg/m2) | 21.4 ± 5.7 | 28.9 ± 7.8 | <0.001 | 20.7 ± 5.6 | 27.6 ± 7.9 | <0.001 | 22.2 ± 5.7 | 31.9 ± 7.0 | <0.001 |
| Adiponectin (µg/mL) | 19.6 (13.1–29.5) | 13.4 (9.9–17.5) | <0.001 | 18.5 (11–28.4) | 13.1 (9.5–18.5) | <0.001 | 20.3 (14–29.0) | 14.8 (10.2–18.6) | 0.002 |
| Resistin (ng/mL) | 18.6 (13.4–25.6) | 18.9 (13.9–24.7) | 0.79 | 17.5 (12.1–24.0) | 18.4 (12.9–22.9) | 0.96 | 19.8 (14.7–27.7) | 22.8 (15.9–32.6) | 0.32 |
| Leptin (ng/mL) | 10.6 (2.4–29.9) | 22.7 (6.9–48.9) | <0.001 | 5.2 (1.7–20.2) | 15.7 (5.6–42.2) | <0.001 | 18.4 (5.3–36.6) | 38.8 (20.5–69.1) | 0.004 |
| Adiponectin/Leptin | 1.96 (0.6–9.7) | 0.55 (0.3–2.6) | <0.001 | 3.95 (0.8–14.4) | 0.74 (0.3–2.9) | <0.001 | 1.28 (0.5–4.5) | 0.31 (0.2–0.6) | 0.001 |
| TNF-Alpha (pg/mL) | 8.3 (5.6–11.7) | 10.4 (6.1–15.1) | 0.005 | 8.9 (6.0–13.0) | 10.9 (6.3–14.7) | 0.09 | 7.6 (5.3–10.2) | 9.8 (5.4–15.2) | 0.06 |
| CRP (µg/mL) | 0.97 (0.3–3.8) | 3.2 (0.5–10.2) | <0.001 | 0.97 (0.3–3.7) | 2.03 (0.3–14.7) | <0.001 | 0.98 (0.3–3.9) | 5.2 (3.2–10.2) | <0.001 |
| APAI-1 (ng/mL) | 24.2 (14.6–34.5) | 24.9 (11.1–38.4) | 0.94 | 23.8 (14–34.4) | 22.4 (96.4–32.5) | 0.33 | 24.2 (15.3–34.4) | 29.3 (19.4–42.5) | 0.10 |
| Vitamin D (nmmol/L) | 33.5 (22.7–48.0) | 33.1 (20.5–57.9) | 0.94 | 40.8 (29.5–55.7) | 40.9 (30.6–62.3) | 0.35 | 27.2 (18.3–38.0) | 19.0 (8.6–25.5) | 0.006 |
| Insulin (miU/mL) | 11.1 (6.6–19.7) | 26.4 (14.1–46.5) | <0.001 | 10.1 (5.8–18.5) | 28.5 (12.9–44.4) | <0.001 | 12.1 (7.6–20.2) | 23.9 (14.5–60.7) | <0.001 |
| HOMA-IR | 2.5 (1.4–4.5) | 6.1 (3.2–13.5) | <0.001 | 2.2 (1.3–4.3) | 5.9 (3.2–13.5) | <0.001 | 2.7 (1.6–4.6) | 6.2 (2.9–13.7) | <0.001 |
| SPISE | 9.04 ± 3.2 | 5.17 ± 2.3 | <0.001 | 9.41 ± 3.2 | 5.53 ± 2.5 | <0.001 | 8.64 ± 3.2 | 4.44 ± 1.4 | <0.001 |
| Parameters | All Subjects | Boys | Girls | |||
|---|---|---|---|---|---|---|
| Correlation Coefficient | p | Correlation Coefficient | p | Correlation Coefficient | p | |
| Adiponectin | 0.27 | <0.001 | 0.22 | <0.001 | 0.36 | <0.001 |
| Resistin | −0.14 | <0.001 | −0.17 | <0.001 | −0.08 | 0.098 |
| Leptin | −0.41 | <0.001 | −0.39 | <0.001 | −0.43 | <0.001 |
| Adiponectin/Leptin | 0.49 | <0.001 | 0.45 | <0.001 | 0.51 | <0.001 |
| TNF-Alpha | 0.06 | 0.08 | −0.03 | 0.60 | 0.14 | 0.005 |
| CRP | −0.19 | 0.001 | −0.24 | 0.001 | −0.13 | 0.12 |
| APAI-1 | −0.04 | 0.25 | −0.02 | 0.63 | −0.05 | 0.31 |
| Vitamin D | 0.22 | <0.001 | 0.13 | 0.027 | 0.27 | <0.001 |
| Insulin | −0.40 | <0.001 | −0.42 | <0.001 | −0.37 | <0.001 |
| HOMA-IR | −0.38 | <0.001 | −0.41 | <0.001 | −0.35 | <0.001 |
| Boys (503) | |||||||
| MetS Components | Present | SPISE ≤ 6.14 (103) | SPISE > 6.14 (349) | OR (95% CI) | p-Value | OR (95% CI) * | p-Value * |
| Elevated waist circumference | 62 (12.3) | 52 (50.5) | 10 (2.9) | 34.56 (16.5, 72.3) | <0.001 | 29.72 (14.1, 62.7) | <0.001 |
| Elevated blood pressure | 61 (12.1) | 27 (26.2) | 34 (9.7) | 3.29 (1.9, 5.8) | <0.001 | 2.93 (1.6, 5.2) | <0.001 |
| Elevated fasting glucose | 55 (10.9) | 20 (19.4) | 35 (10.0) | 2.16 (1.2, 3.9) | 0.012 | 1.81 (1.0, 3.4) | 0.07 |
| Elevated triglycerides | 113 (22.5) | 45 (43.7) | 68 (19.5) | 3.21 (2.1, 5.1) | <0.001 | 3.51 (2.2, 5.7) | <0.001 |
| Low HDL-Cholesterol | 270 (53.7) | 91 (88.3) | 179 (51.3) | 2.51 (1.5, 3.6) | <0.001 | 2.29 (1.2, 2.6) | <0.001 |
| MetS | 54 (10.7) | 39 (37.9) | 15 (4.3) | 13.56 (7.1, 26.1) | <0.001 | 12.37 (6.3, 24.1) | <0.001 |
| Girls (448) | |||||||
| MetS Components | Present | SPISE ≤ 6.46 (128) | SPISE > 6.46 (282) | OR (95% CI) | p-Value | OR (95% CI) * | p-Value * |
| Elevated waist circumference | 59 (13.2) | 44 (34.4) | 15 (5.3) | 9.32 (4.9, 17.6) | <0.001 | 7.25 (3.7, 14.2) | <0.001 |
| Elevated blood pressure | 61 (13.6) | 29 (28.2) | 32 (9.2) | 2.29 (1.3, 3.9) | 0.004 | 2.31 (1.3, 4.1) | 0.004 |
| Elevated fasting glucose | 43 (9.6) | 24 (18.8) | 19 (6.7) | 3.19 (1.7, 6.1) | <0.001 | 2.68 (1.4, 5.2) | 0.004 |
| Elevated triglycerides | 94 (21) | 50 (48.5) | 44 (12.6) | 3.47 (2.1, 5.6) | <0.001 | 4.33 (2.6, 7.2) | <0.001 |
| Low HDL-Cholesterol | 212 (47.3) | 83 (80.6) | 129 (37.0) | 2.19 (1.4, 3.4) | <0.001 | 1.81 (1.2, 2.8) | 0.009 |
| MetS | 28 (6.3) | 26 (20.3) | 0 (0.0) | - | - | - | - |
Disclaimer/Publisher’s Note: The statements, opinions and data contained in all publications are solely those of the individual author(s) and contributor(s) and not of MDPI and/or the editor(s). MDPI and/or the editor(s) disclaim responsibility for any injury to people or property resulting from any ideas, methods, instructions or products referred to in the content. |
© 2023 by the authors. Licensee MDPI, Basel, Switzerland. This article is an open access article distributed under the terms and conditions of the Creative Commons Attribution (CC BY) license (https://creativecommons.org/licenses/by/4.0/).
Share and Cite
Wani, K.; Khattak, M.N.K.; Saadawy, G.M.; Al-Attas, O.S.; Alokail, M.S.; Al-Daghri, N.M. Sex-Specific Cut-Offs of Single Point Insulin Sensitivity Estimator (SPISE) in Predicting Metabolic Syndrome in the Arab Adolescents. Diagnostics 2023, 13, 324. https://doi.org/10.3390/diagnostics13020324
Wani K, Khattak MNK, Saadawy GM, Al-Attas OS, Alokail MS, Al-Daghri NM. Sex-Specific Cut-Offs of Single Point Insulin Sensitivity Estimator (SPISE) in Predicting Metabolic Syndrome in the Arab Adolescents. Diagnostics. 2023; 13(2):324. https://doi.org/10.3390/diagnostics13020324
Chicago/Turabian StyleWani, Kaiser, Malak N. K. Khattak, Gamal M. Saadawy, Omar S. Al-Attas, Majed S. Alokail, and Nasser M. Al-Daghri. 2023. "Sex-Specific Cut-Offs of Single Point Insulin Sensitivity Estimator (SPISE) in Predicting Metabolic Syndrome in the Arab Adolescents" Diagnostics 13, no. 2: 324. https://doi.org/10.3390/diagnostics13020324
APA StyleWani, K., Khattak, M. N. K., Saadawy, G. M., Al-Attas, O. S., Alokail, M. S., & Al-Daghri, N. M. (2023). Sex-Specific Cut-Offs of Single Point Insulin Sensitivity Estimator (SPISE) in Predicting Metabolic Syndrome in the Arab Adolescents. Diagnostics, 13(2), 324. https://doi.org/10.3390/diagnostics13020324