2. Materials and Methods
All subjects were scanned on a 3.0T GE Healthcare SIGNATM PET/MR featuring simultaneous time of flight (TOF) PET imaging and a whole body 3.0T MRI scanner using a GE HeadNeckSpine 16 channel coil.
2.1. Participants
Five healthy subjects three female, two male, three right- and two left-handed, median age 42 years, height 173 cm, weight 85 kg, average blood glucose 5.44 ± 0.86 mmol/L were included.
The study was approved by the Ethics Committee of The Region of Southern Denmark Project-ID: S-20170086 and procedures were carried out in accordance with the Declaration of Helsinki. Written consent was acquired from all subjects before participating in the study procedure.
Participants were fasting for at least 5 h before FDG-tracer administration to allow optimal cerebral FDG uptake not to be influenced by increased blood glucose levels [
22]. In the preparation routine a peripheral venous catheter was inserted in the hand and blood glucose levels measured. Participants were positioned supine in the scanner, placed in the head coil and fixed with foam pads to minimize head movement during scan.
2.2. Activation Paradigm
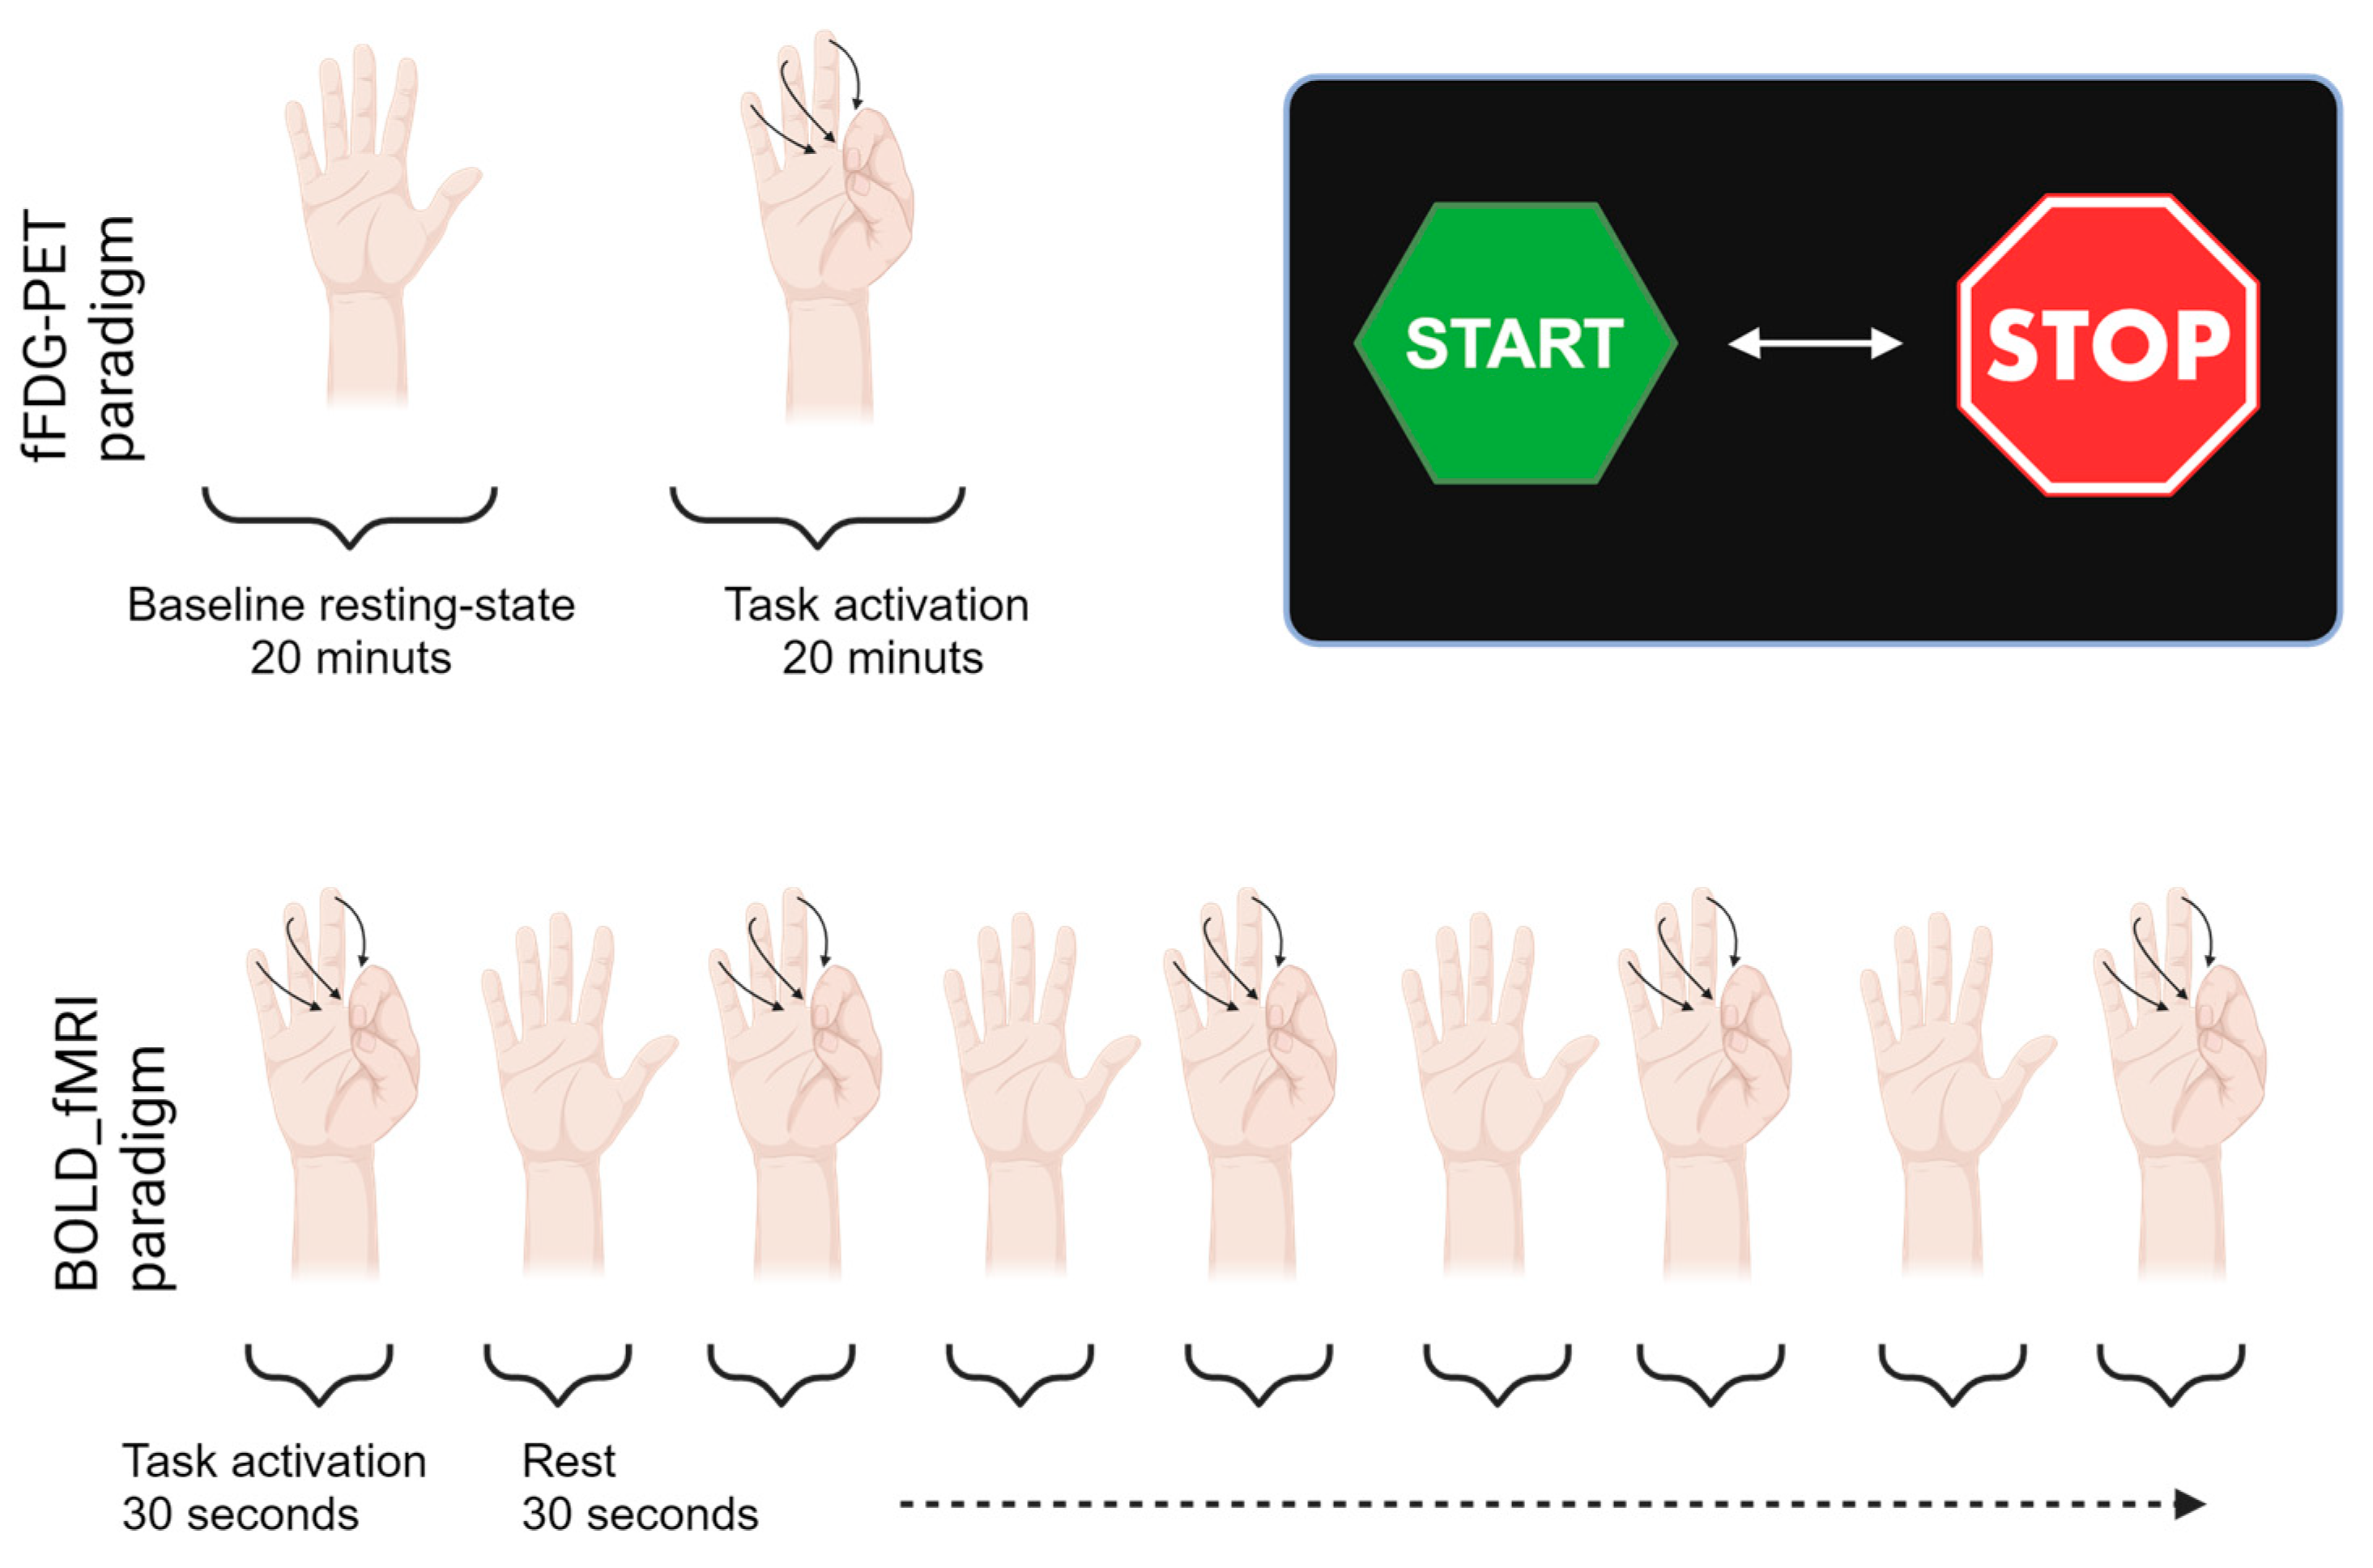
In the finger-tapping task the participants tapped their fingers to the thumb on their right hand at a steady pace of about 1 Hz [
23]. Visual instructions for commencement and completion of the finger-tapping paradigm were projected on a Nordic Neuro Lab system screen viewed via a mirror placed on the head coil above the eyes. The fFDG paradigm lasted for 40 min. Initially, a baseline was established for the first 20 min after injection, where participants rested with no form of external stimuli constituting our baseline resting-state acquisition. Hereafter, the finger-tapping paradigm was initiated and continued throughout the last 20 min of the dynamic PET scan. Following a short break after the 20 min continuous PET finger-tapping, a fMRI BOLD activation of 4 min and 30 s was initiated. The fMRI paradigm was built up by 30 s alternating blocks of START and STOP finger-tapping activation indicated by a presentation of visual START or STOP signs on the screen. The composition of the respective activation paradigms are illustrated in
Figure 4.
2.3. FDG Administration and Data Acquisition
The [18F]FDG tracer was produced according to GMP specifications. A 40 min PET list-mode acquisition was recorded, and with a short delay, the first bolus injection of approximately 150 MBq [18F]FDG was administrated by a MRidium 3860+ MRI IV Infusion pump. The tracer was dissolved in 4.5 mL saline and injected at a rate of 600 mL/h, lasting 24 s in total. After 20 min scan time, and at the beginning of the activation session, an identical bolus was administrated to increase the amount of free tracer accessible to the task induced changes in glucose metabolism.
2.4. Image Processing and Data Analysis
A T1-weighted MRI scan (MRI T1: Sag T1W 3D FSPGR BRAVO (TE 2.3, TR 6.44 ms, voxel size 0.5 × 0.5 × 0.5 mm3) was acquired for all subjects to serve as the mutual structural original image for the aggregation of the FDG-PET analysis results and the fMRI analysis results. Intra-subject analysis images were analysed entirely in native space without normalization.
The image data for both modalities were analysed separately, and then compared. All subjects were analysed separately on an intra-subject level exclusively. The functional scans were quantified in two steps regarding the FDG-PET data for the baseline acquisition and the activation task acquisition, and the fMRI BOLD data analysis following in a separate analysis. Finally, the fFDG and the fMRI results were compared on spatial peak seed regions. The fFDG data were processed in Siemens Inveon Research Workplace, Advanced Normalization Tools (ANTs) (BSD License, NITRC,
https://www.nitrc.org/projects/ants (accessed on 3 October 2023)) ANTs and custom-made Python code. fMRI data were processed in SPM12 (
https://www.fil.ion.ucl.ac.uk/spm/software/spm12/ (accessed on 3 October 2023)). Single subject fFDG and fMRI were then warped to standard space and processed at group level in SPM12 for visual comparison of the mean fFDG and fMRI results in peak seed region.
2.5. fMRI
The fMRI BOLD data (EPI fMRI-TE 30, TR 2000 ms, native voxel size 3.75 × 3.75 × 4.0 mm) were processed in SPM12 fMRI module with default parameters maintained unless otherwise specified, including estimating options smoothing kernel (FWHM) 5, register to first, interpolation 2nd Degree B-spline, no wrap, and reslice options All Images + Mean image, interpolation 4th Degree B-Spline and Mask images. The T1 images were skull-stripped with FSL BET (Brain Extraction Tool) with T2-weighted FLAR acquisition as mask [
24]. The realigned images were coregistered to the skull-stripped T1-weigthed structural image by applying estimation only. No further smoothing was applied to the single subject fMRI data. A grey matter, white matter and cerebrospinal fluid mask were created, to exclude non-brain matter from the analysis.
For group level analysis the single subject fMRI data was first coregistered to the individual T1 structural images and resliced to voxel size [2 2 2], smoothed by a Gaussian kernel of [8 8 8] and normalized to Montreal Neurological Institute coordinate system (MNI) standard space with estimate and write. In the group level, the stats paradigm parameters were set identical to those applied to the single subject analysis, However, with no explicit mask.
2.6. PET
The PET listmode files (Axial PET field-of-view 25 cm) were reconstructed with the GE Healthcare Q.Clear algorithm with a β-value of 500. Attenuation correction maps were supplied using GE zero-echo-time (ZTE)-based attenuation correction for integrated PET/MRI brain imaging. In the fFDG data, the first two minutes were framed in 8 × 15 s, following 9 frames of 2 min in the baseline acquisition. This framing was repeated for the remaining 20 min of scan time during activation. The data were reconstructed with an anisotropic voxel size of 2.34 × 2.34 × 2.78 mm3 into a volume of 89 slices of 128 × 128 pixels. Intraframe PET motion corrections for the dynamic series were applied by rigid registration in ANTs using the final frame as reference.
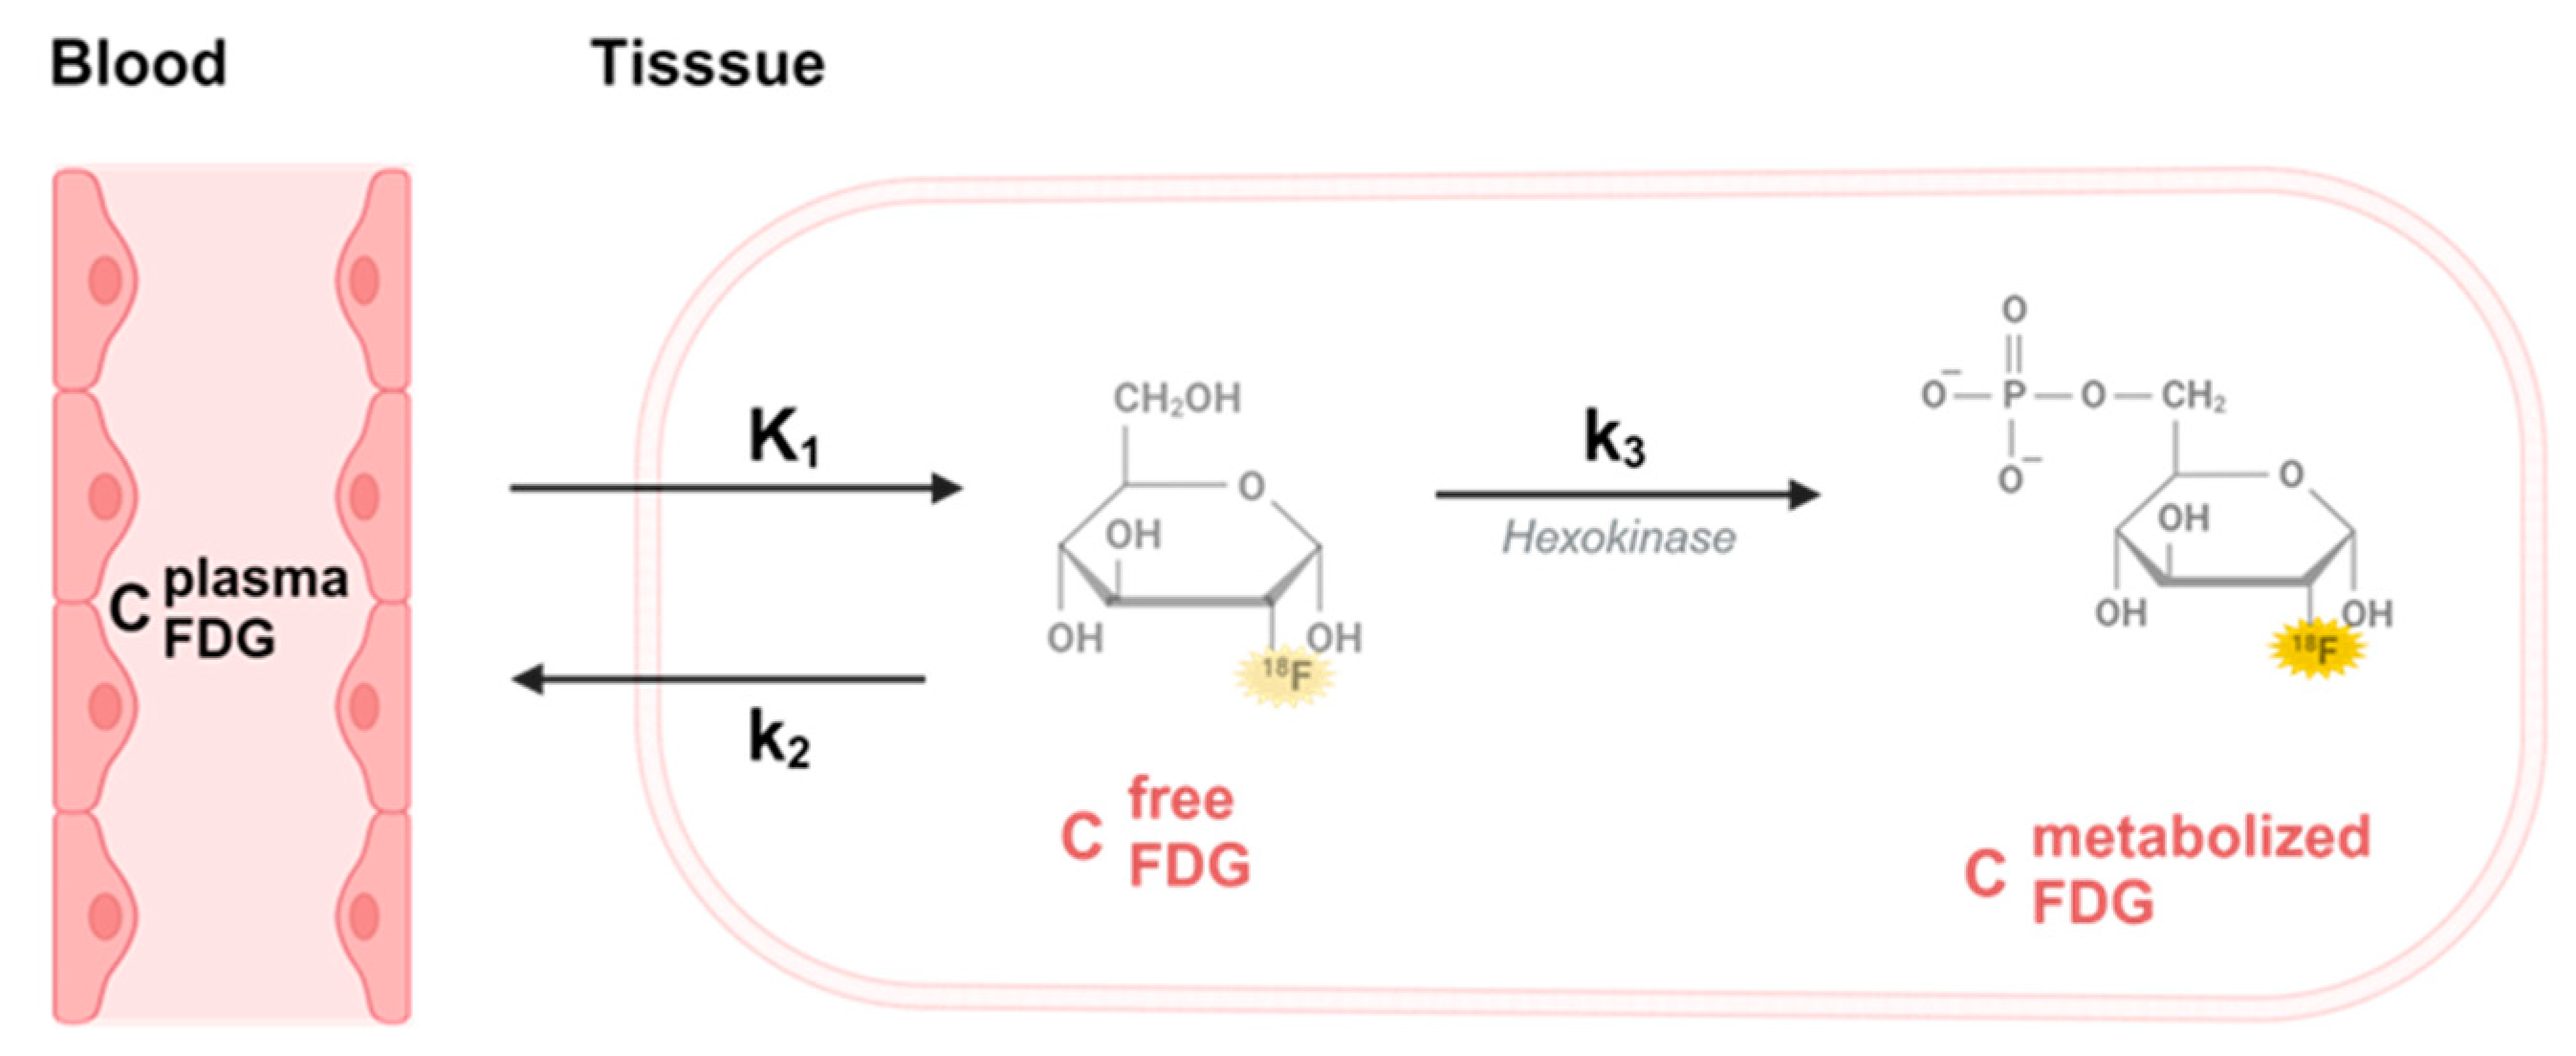
FDG data was modelled by the approach initially applied by Murase et al. in a double boli administration application [
17]. We evaluated the FDG tissue uptake using a two-tissue compartment model for irreversible tracers with a free (
Cf) and a metabolized (trapped) compartment (
Cm).
is the unidirectional blood-to-tissue clearance,
is the rate constant for clearance of FDG from tissue to blood and
is the rate constant for FDG trapping illustrated in
Figure 5.
Input function for modelling was defined by an image-derived input curve [
25]. The model forms the foundation for determining the relationship between the dynamic measure of change in FDG metabolism and, hence, represent the cerebral metabolic rate of glucose (CMRglu) in the baseline and during the finger-tapping activation.
The underlying differential equation that describes the free compartment function
is:
And the equation describing the metabolized compartment function
is given by:
where
(t) is the (arterial) blood FDG concentration at time t.
The PET measured total FDG activity concentration
is the sum of both compartments with an additional small contribution from the vascular blood FDG activity component, as follows:
where
is the vascular blood volume.
The parameter of interest in this study is the net uptake rate
of FDG, which is determined as:
The cerebral metabolic rate for glucose
is directly proportion to
through the equation:
where
is the plasma glucose concentration and
LC is the lumped constant connecting the FDG rate constant
to the glucose rate constant [
26]. A relative change in
is equal to the relative change in the glucose metabolism, assuming a constant plasma glucose concentration between the two sessions.
To calculate the change in glucose metabolism between baseline and activation the PET acquisition analysis was divided into two consecutive sessions, with initial bolus injection at the beginning (t = 0 min) and the second bolus injection at beginning of the activation session (t2 = 20 min).
Quantification with double boli.
The solution to the baseline session
t < 20 min is given by:
where
and
denotes the baseline model parameters.
While the solution for the activation session
t > 20 min has an extra term due to initial boundary conditions originating from the previous baseline session:
where
and
denotes session 2 (activation) model parameters.
is the time for beginning of session 2 (
= 20 min).
To obtain the blood input function
, we used a non-invasive PET image-derived method. From the first minute of the acquisition, we obtained a well-defined image of the blood vessels below the brain. Using a simple threshold technique, we segmented the blood vessels. To reduce the sensitivity from potential patient movement and partial volume effect (
PVE), we dilated the volume of interest (
VOIvessel) with 6 mm in all directions. An area in the neck region without any notable blood vessels constitutes the reference volume (
VOIbkg) for the background correction to the image derived input function. The image derived blood input function is calculated as:
where
PVC is a partial volume correction constant that corrects the volume to the true vessel volume. From the differential Equation (1) above, it is seen that the
PVC constant is a simple multiplication factor just like the
parameter, which implies that
becomes proportional to
PVC and hence the relative change of
between baseline and activation sessions is independent of the
PVC constant.
2.7. Vascular Blood Volume
The short time frames and the low injected activity implies a rather high statistical noise level in the raw data. To reduce the noise, we applied an 8 mm FWHM Gaussian spatial 3-dimensional smoothing filter on all individual frames.
The model parameters and are calculated voxelwise. On a voxel scale the vascular blood volume fluctuates hugely and depends on the distribution of larger vessels in the brain.
Equation (3) can be re-arranged as .
However, the effect of on the time activity curves (TAC) is predominately in the early vascular phase. Estimating the and from data in the time span from 4 min after start of acquisition until end of baseline session, we can estimate parameters and with minor influence from the vascular blood volume . Using these parameters in the early phase dominated by the vascular component we can calculate from the above equation as the average value from 15 s prior and until the vascular peak in . was calculated using the smoothed data.
To reduce the possibility of the fitting algorithm getting trapped in local minima produced by noise we initiate the parameter estimation of and using the smoothed baseline data. Next, we fitted the raw data with constraints that the new estimated parameters should lie in the interval 0.25 to 4 times the initial estimate and kept constant. Finally, we estimated the parameters from the activation session and set equal to . Again, to reduce the possibility that the fitting algorithm gets trapped in local minima the activation parameters was constrained to lie in the interval from 0.5 to 2.5 times the baseline parameters. The parameter constrain intervals were chosen based on the need for narrow limits due to noise. However, the limits are large enough to allow for the relevant physiological changes from baseline session to the activation session.
The final parametric image was calculated as
. All parameter estimations were done using Lmfit, a least-square Levenberg–Marquardt algorithm implemented in Python (v1.0.3, GitHub,
https://lmfit.github.io/lmfit-py/ (accessed on 3 October 2023)).
A visualisation of the seed peak regions of the fMRI and fFDG results were projected on the single subject T1 structural image and at group level the MNI standard T1 structural brain template using FSLeyes version 1.3.0 software (
https://git.fmrib.ox.ac.uk/fsl/fsleyes/fsleyes/ (accessed on 3 October 2023)). Peak values were extracted for all five participants and the group mean level.
3. Results
The adapted two-tissue compartment model for quantification of task-evoked neural activity provided a consistent solution to determine the relative change in
, representing the relative change in glucose metabolism, independent of the PVC constant and with a calculated V
0 at the voxel level shown in
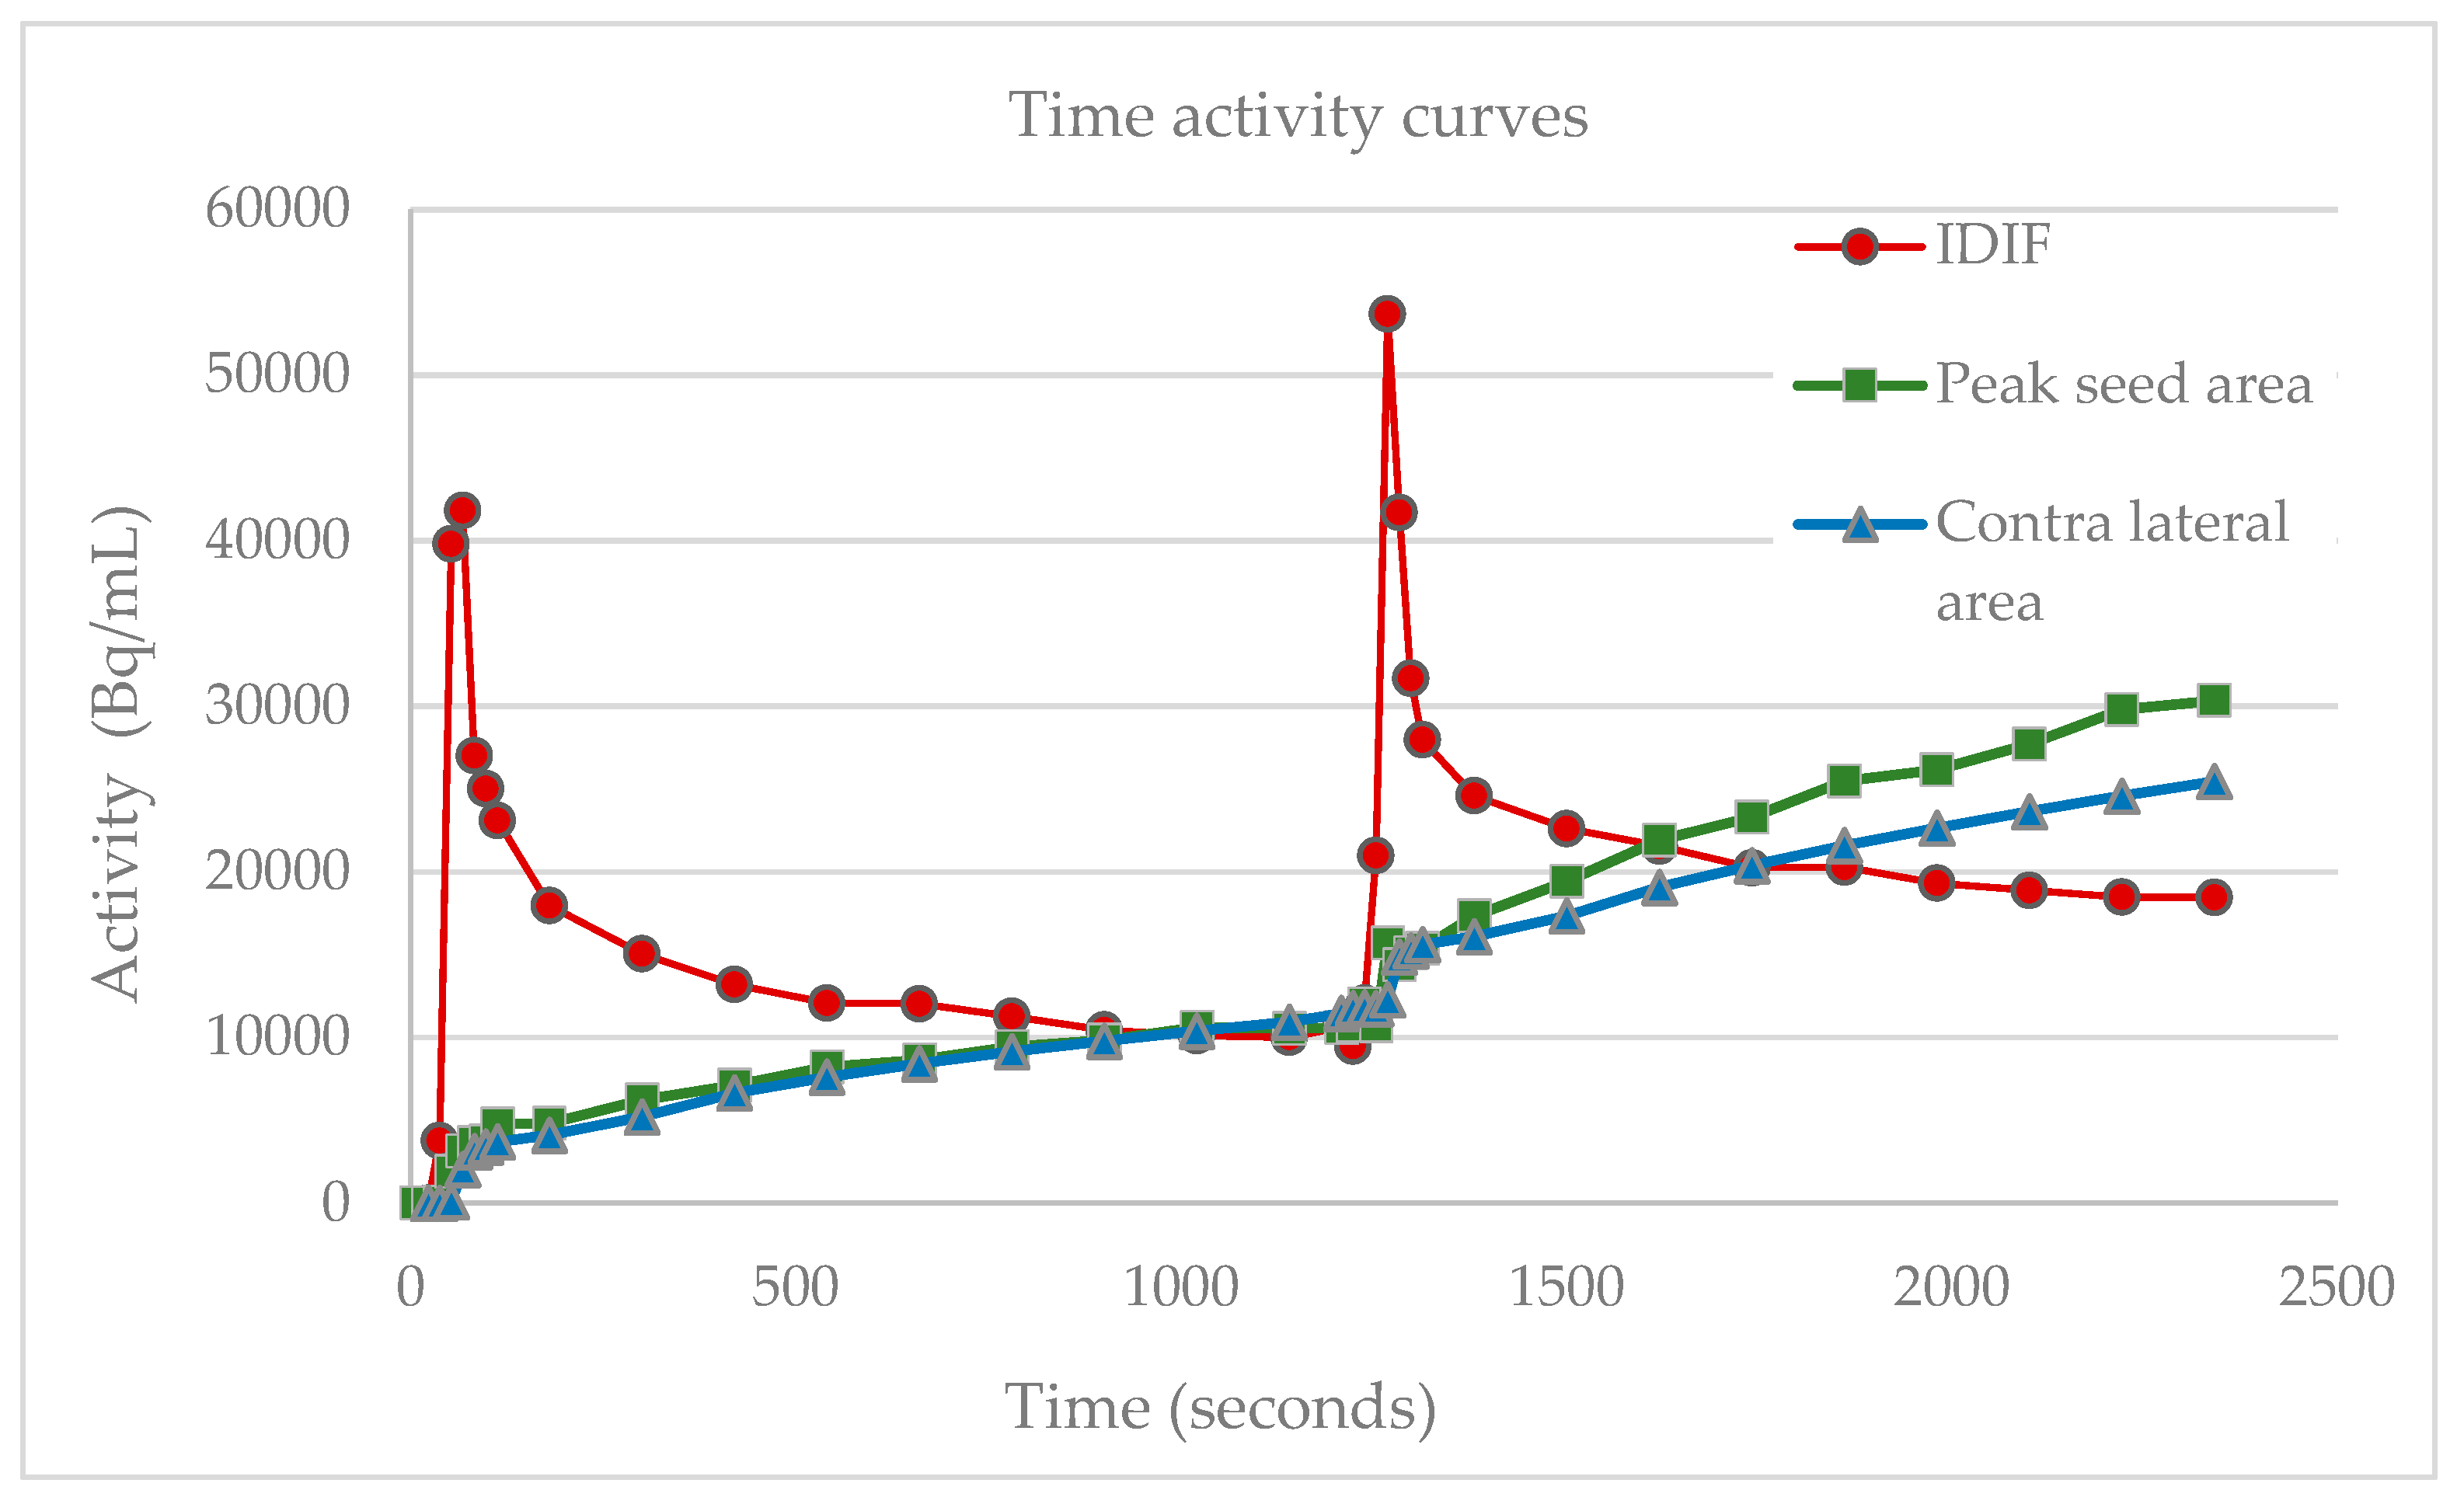
Figure 6.
Change in the slope of the motor cortex M1 measured during baseline and activation is equal to changes in net uptake rate constant Ki represented by FGD-uptake, illustrated with the contralateral reference region of the peak effect and blood component curves. The abbreviations used are as follows: IDIF, image derived input function; Bq, Bequerel; mL, milliliters.
Applying the two-tissue compartment model to the double boli scanner paradigm design the relative changes in
Ki in the M1 peak seed area increased with 36.3% to 87.9% for the finger-tapping task at single subject level. Likewise, the single subject fMRI paradigm analysis showed a statistically significant task specific activation in the M1 area measured by the BOLD signal with peak t-values from 15.2–27.6, average 21.7. Single-subject peak values for the relative rise in FDG uptake and fMRI peak T-values are listed in
Table 1.
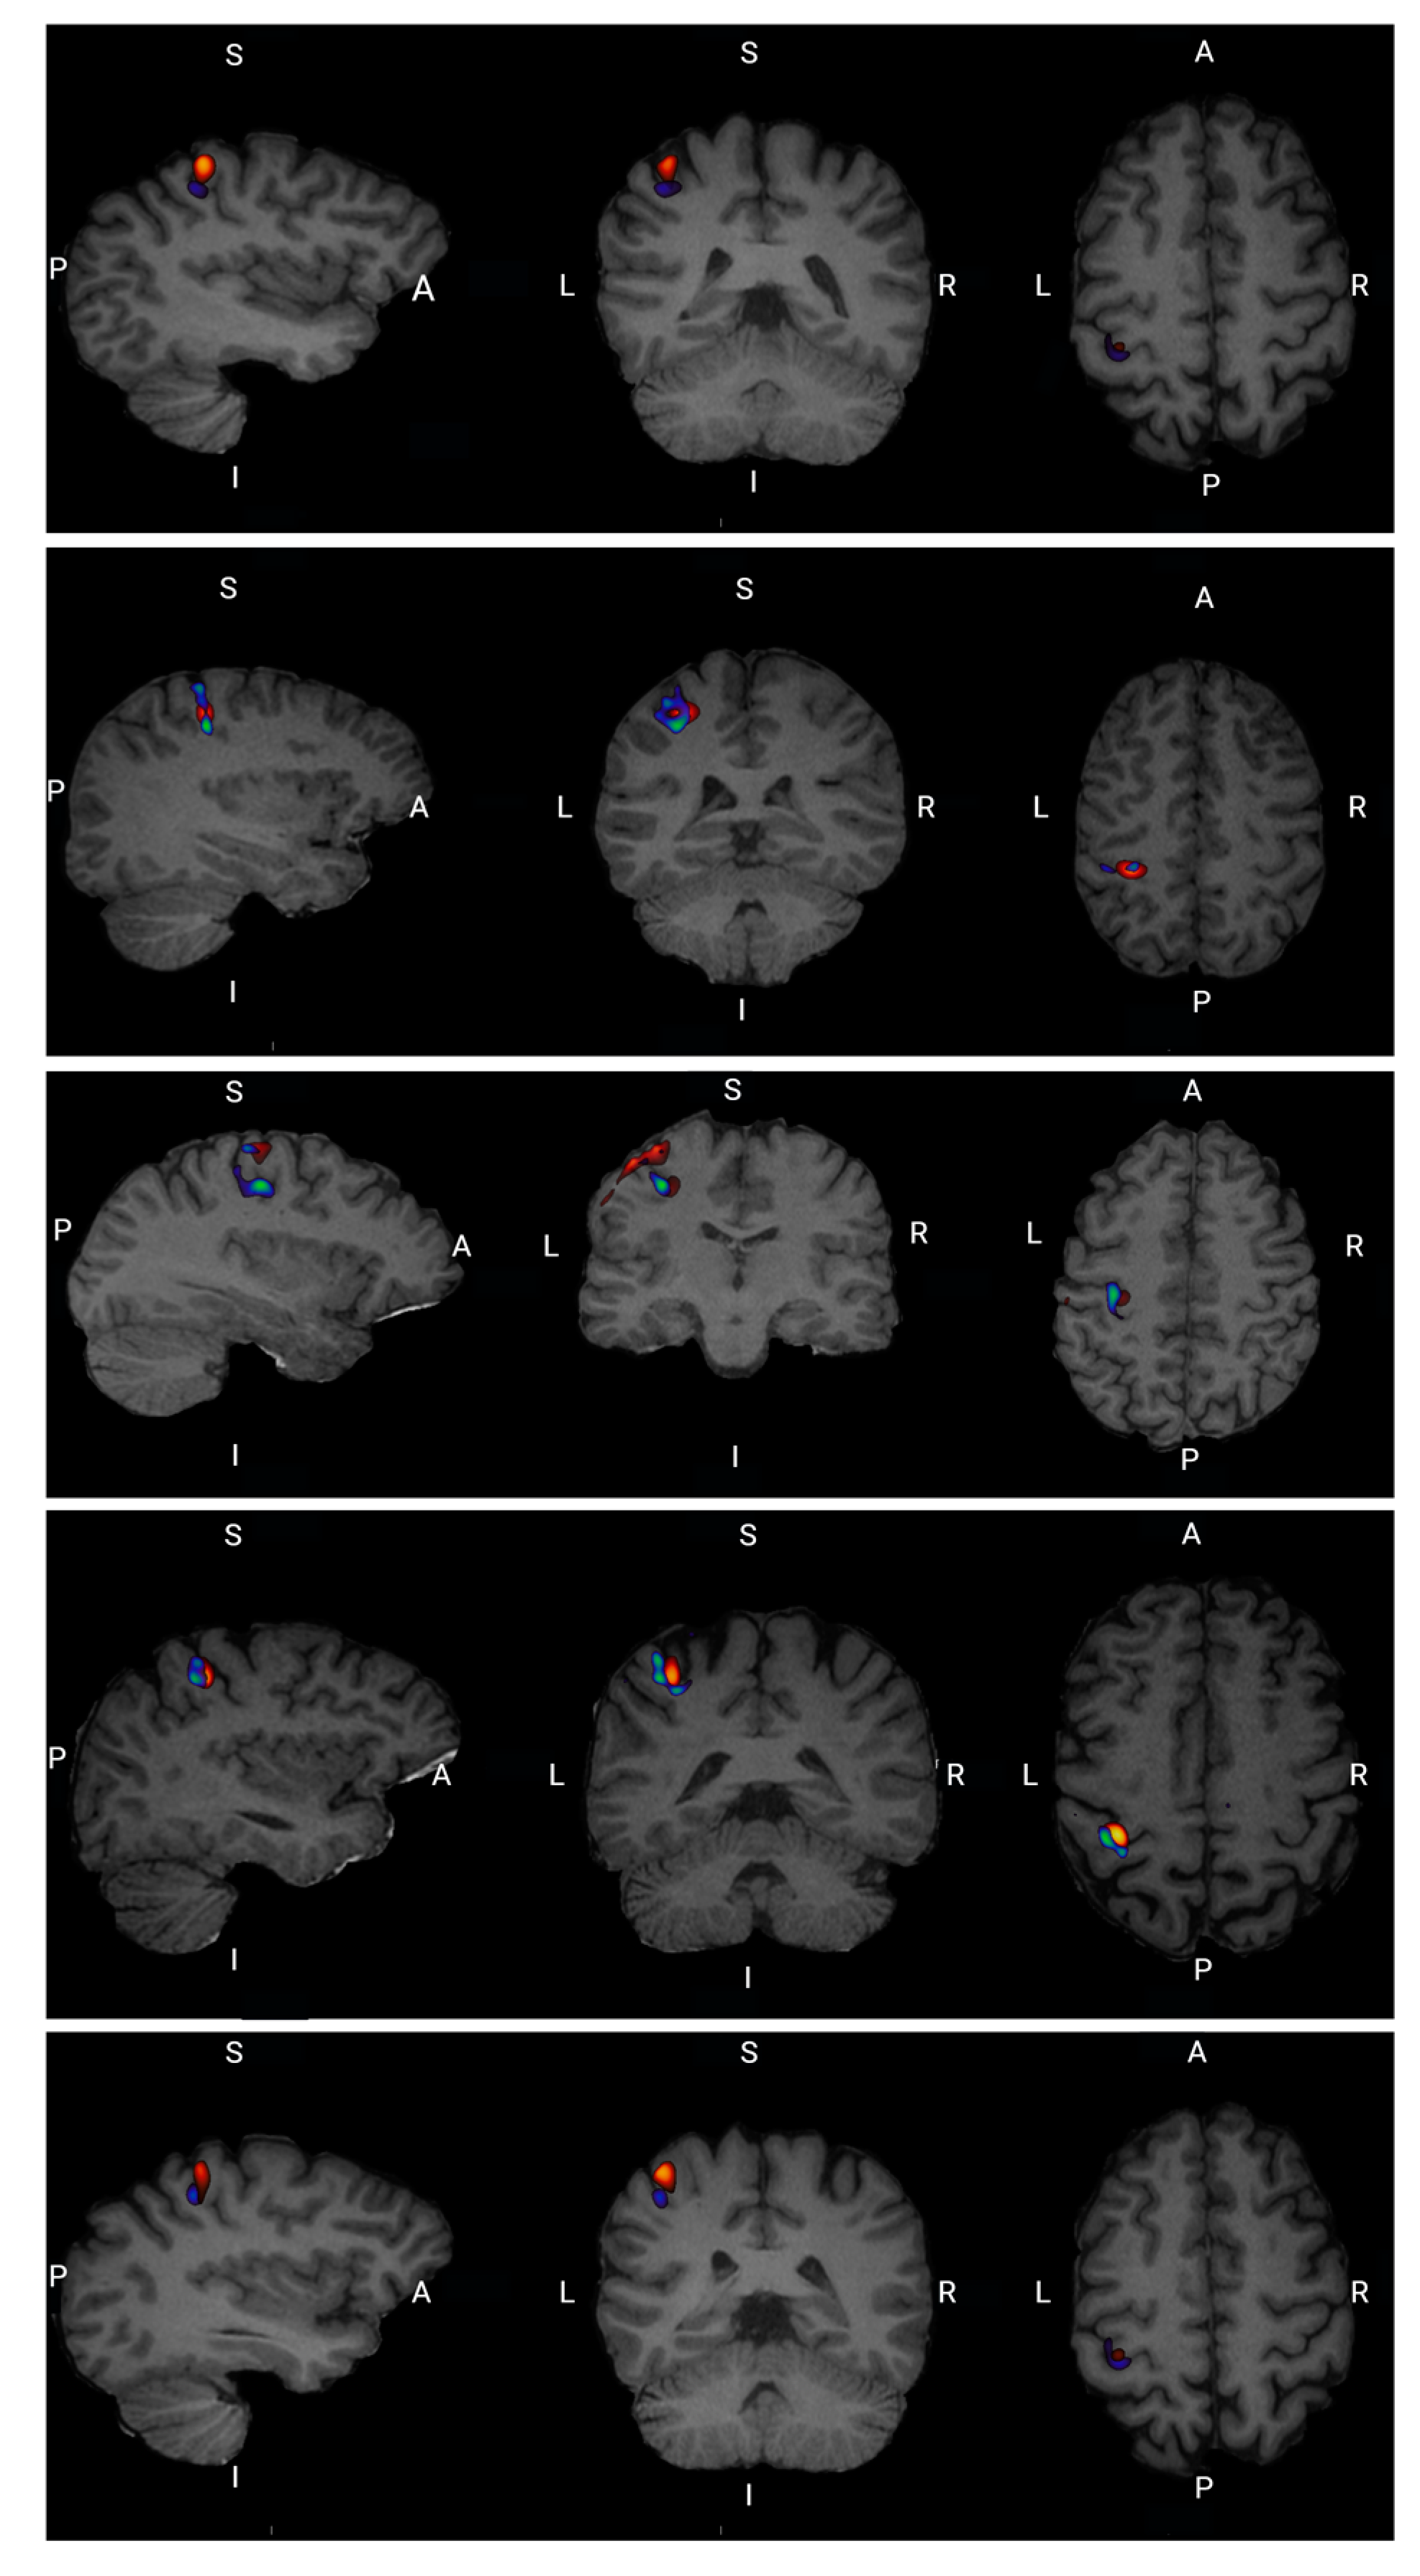
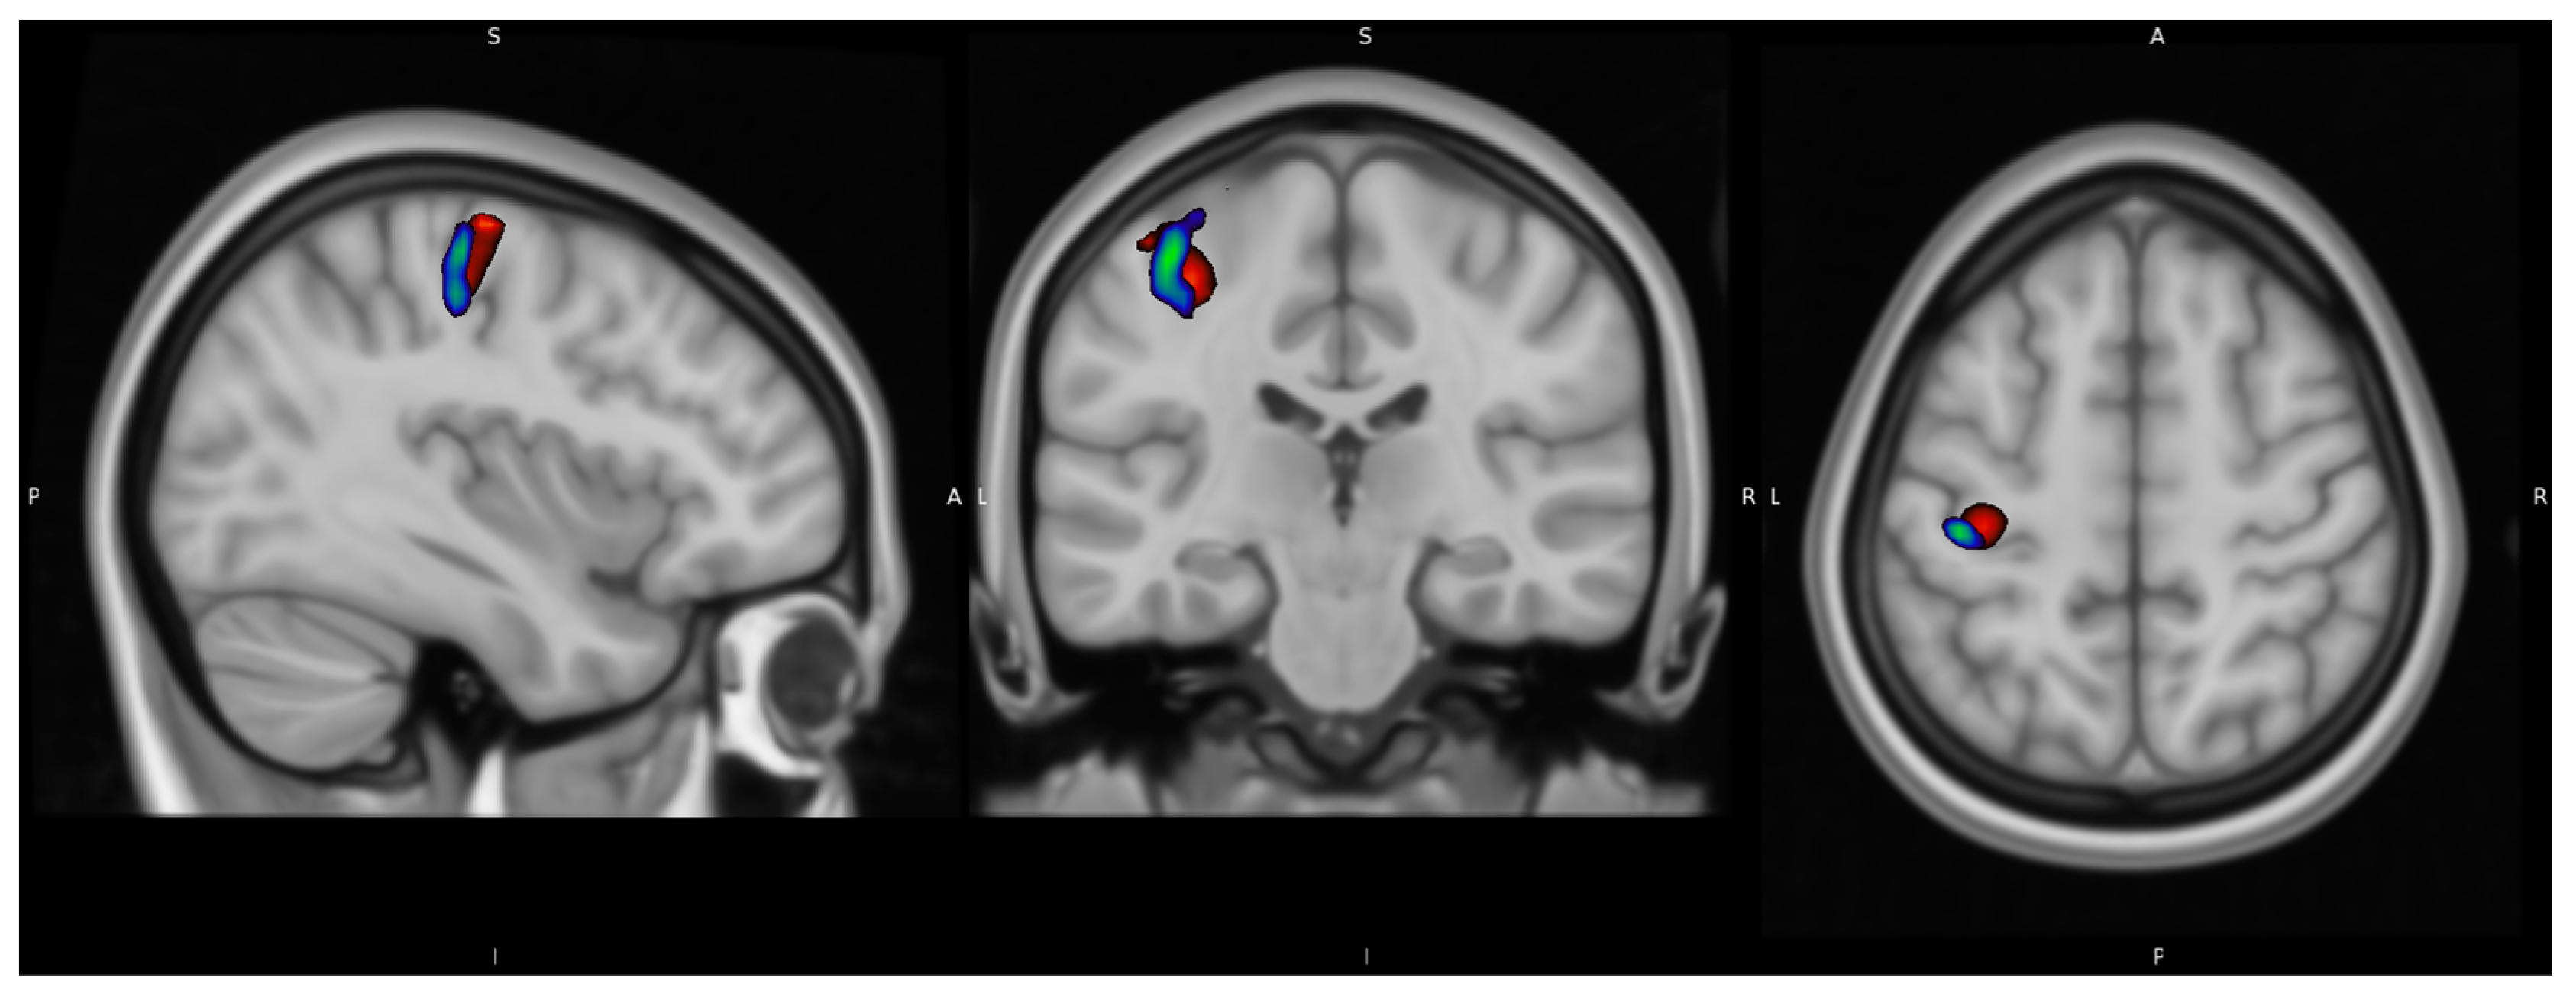
For all five participants there is a visual overlap between task-related neural activation in FDG uptake and the fMRI BOLD signal at the single-subject level as well as at the group level illustrated in
Figure 7.
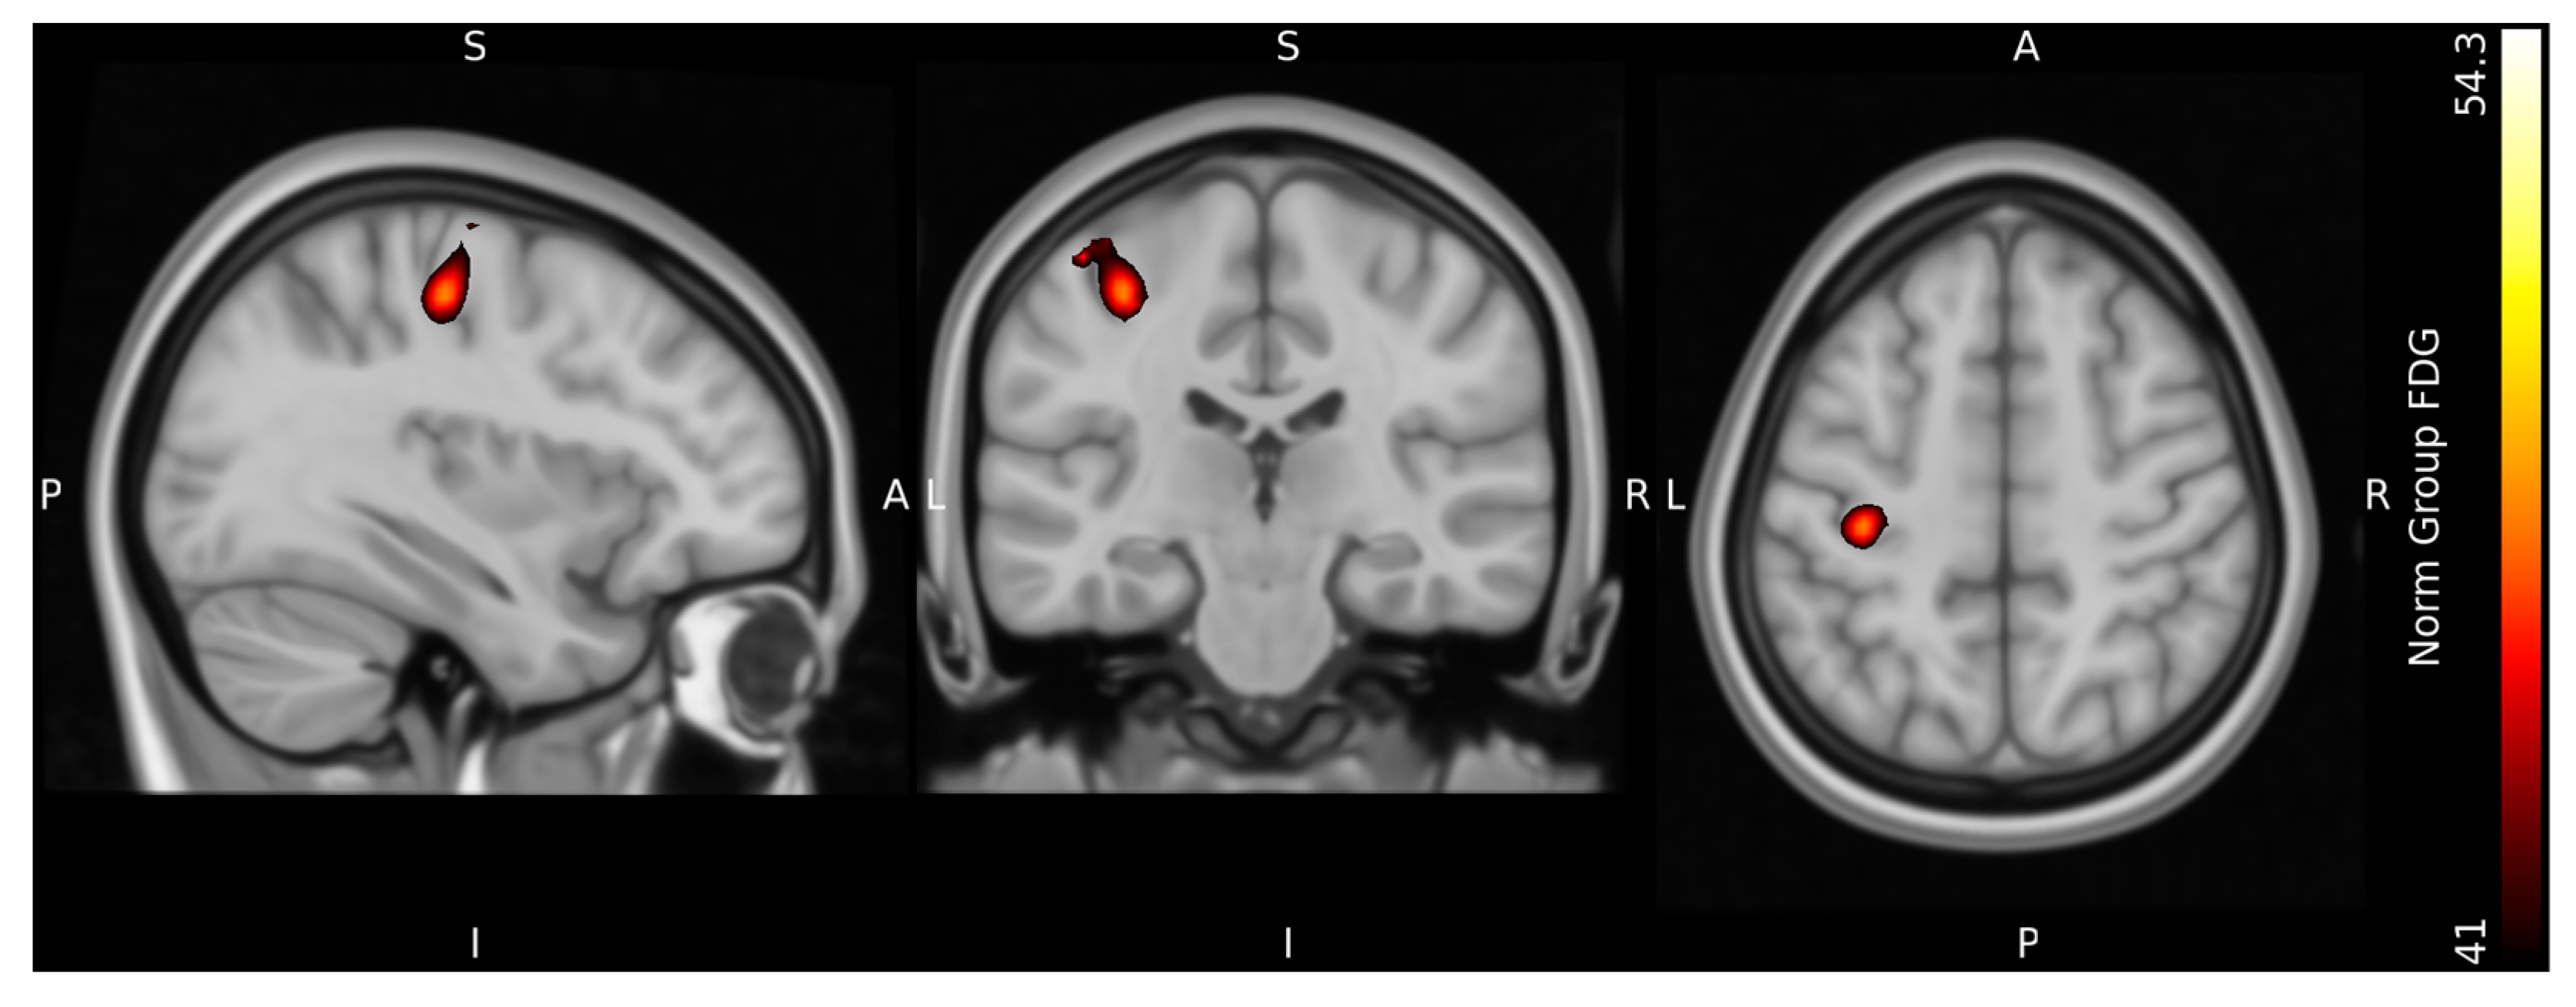
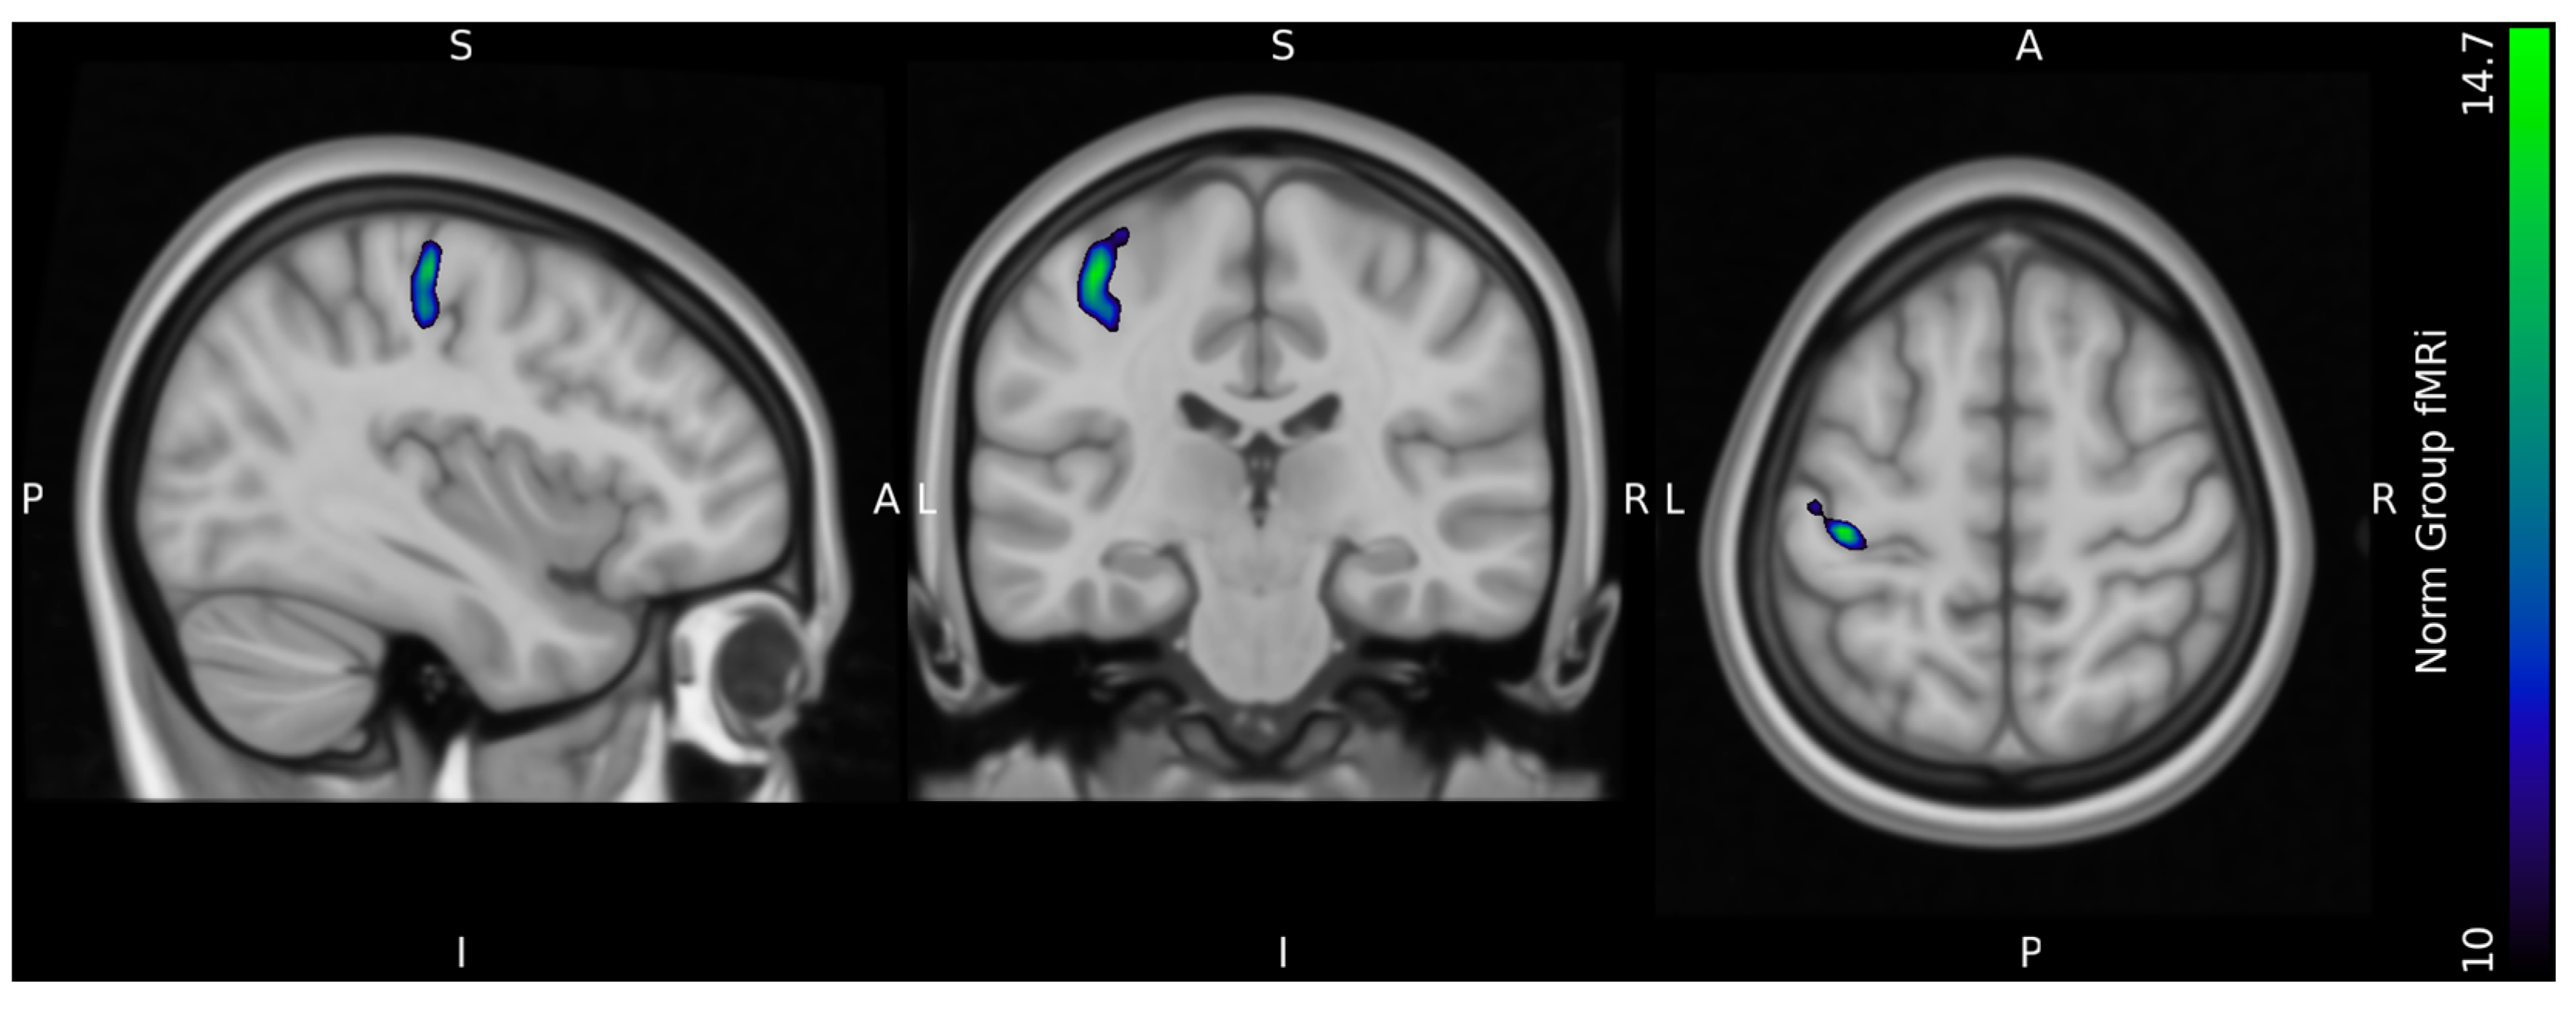
Figure 8 and
Figure 9 show the results at the group level normalized to MNI standard space. At the group level, the resulting peak seed region of both signals were located in the in the dorsal portion of the frontal lobe at the precentral gyrus in Brodmann area 4, in accordance with the M1 motor cortex region of the left cerebrum.
Figure 10 illustrates a merged image of the fFDG and fMRI peak areas, with the same illustrative thresholds as in
Figure 4 and
Figure 5.
Video S1 illustrates both the fFDG and fMRI peak seed regions in T1 MNI standard space.
4. Discussion
In the interest of improving facilities to understand the pathology of disorders such as stress, depression, anxiety and other psychiatric diseases with fluctuating symptoms but no immediate structural changes in the brain, this study applied a novel implementation of a double boli administration of [18F]FDG to investigate the change in FDG uptake between baseline and activation PET acquisition as a measure of glucose consumption evoked by neural activity in a single-scanning session at the single-subject level. The finger-tapping activation paradigm was redesigned for a PET-standalone setup, followed by a conventional fMRI version in the same scanning session.
In the analysis of the fFDG data, we concentrated on the measurement of relative changes in FDG uptake, as a measure of glucose metabolism in accordance with previous research [
27]. As blood input function we have used an image derived input function (IDIF), which, in the case of relative estimation of changes kinetic parameters, is applicable assuming no non-linear bias between the true input function and the selected IDIF. Using this approach our results demonstrated that the double boli approach with [
18F]FDG and an image-derived input function (IDIF) enables quantification of relative changes in K
i, with task-specific changes in glucose metabolism increasing by 36.3–87.9% (max) locally in the brain, on an intra-subject level. The image analysis of the corresponding fMRI paradigm, also based on the finger-tapping paradigm, confirmed the spatial peak area of the fFDG results in the M1 motor cortex region of the human brain. Visual inspection showed minor deviation in the extension of the spatial location of neural activity between the fFDG-PET and fMRI-BOLD paradigm.
Our main objectives of the implementation of the two-tissue compartment kinetic model in our analysis was to apply a method that incorporates the entire dataset by estimating changes in rate constants between baseline and activation, without the need of blood sampling.
The discussion of the optimal tracer administration protocol in the form of bolus vs. constant infusion, as well as applying an initial bolus injections followed by constant infusion of FDG, is ongoing [
28]. In recent years, constant infusion has been praised [
10,
16] as a superior method, creating greater sensitivity over a single administrated bolus, as it offers a constant supply of FDG during baseline and activation sessions. Whereas a single bolus will truly offer reduced quantities of FDG at the time of the activation session after the baseline session, a double bolus fFDG method, which we applied, provides high amounts of tissue-available FDG activity, yielding a strong quantitative measure of cerebral metabolic rate in the baseline as well as the activation session. This enables a powerful approach to characterize functional metabolic responses to stimuli that are presumed to sustain a constant state, including visual, auditory or cognitive tasks, as well as drug administration [
29,
30,
31,
32]. In other studies, the well-known fMRI analysis pipeline has served as inspiration to the fFDG scanning paradigm expressed in a combined simultaneously PET/fMRI-BOLD acquisition block design in a single scan with both baseline and activation [
28].
The variation of tracer administration and scanning paradigm protocols in the fFDG task evoked change in FDG uptake has resulted in various forms of analysis being applied. As the design of the traces administration activation paradigm to some extent dictates the analysis model and vice versa, no gold-standard experimental design setup has been presented. The variation include studies that applies fMRI-BOLD features from the fixed method of the general linear model (GLM), with normalization of the material, as well as the graphical approach by the Patlak model based on the assumption of a steady-state in FDG between compartments and independent component analysis (ICA) [
33]. In the same manner, the blood sampling to support the input function varies from arterial to venous, both automatically and manually acquired [
10]. However, the incorporation of the GLM line introduces indirect components from the HRF in the otherwise quantifiable PET analysis of glucose consumption. The proposed method using a full two-tissue compartment model we process the data of the entire TAC, hence the parameter estimation uses all available time points in opposite to the simple Patlak approach that only uses data from later time points when a quasi-equilibrium between the free and metabolized compartment are reached. Also, the Patlak model does not account for the spatially variable vascular component.
In general, the implementation of the widely available glucose analogue radiotracer FDG to investigate quantifiable neural activity at rest and under activation connected to a specific task related brain function in health and mental disorders holds a vast potential. One of the advantages of our method is, firstly, an easily implementable setup in terms of the double boli tracer administration, without the need for invasive blood sampling, arterial or venous, to support the input function for individual quantification [
15]. An IDIF may have quantitative bias compared to measured arterial blood samples and, hence, produce a bias in our measurements of glucose metabolic rate K
i. However, by adopting a relative change approach, the IDIF approach remains accurate in absence of non-linear bias effects. Even though our study is based on a small sample size, as a proof-of-concept, our results shows that our novel approach of the double-boli application of the two-compartmental model is consistent across all five single subjects included, as well as at the subject level and comparable to the similar studies [
10].
As for the implementation of our adapted two-tissue compartment model in this study, the calculated values related to the change in FDG uptake, are somewhat higher compared to other studies addressing functional FDG scans with task evoked neural activation by other methods. As an example, the results in the other studies range from approximately 20% to 30% [
10,
16] in the peak seed region, compared to our resulting values of 36.3% to 87.9%. These variances in the values could be due to different activation paradigms, the method of addressing the analysis, and whether data is normalized to standard space during analysis. However, the discrepancy could also be associated with an inaccuracy in the input function in our method, rather than an actual difference in the measures of the physiological signal linked to the scans.
Related Associated Anatomical minute differences in the peak area of the fFDG signal and the fMRI can be visually observed, as it has been in other studies [
15]. The deviations in the peak seed regions of the fFDG results and the fMRI results holds the potential to study the physiological relation between glucose consumption and the flow of changes in deoxyhemoglobin in the brain determined by localized changes in blood flow and blood oxygenation in the neurovascular coupling with the PET/MRI modality. This aspect has been observed in other human studies, as well as in rats. It is suggested that FDG uptake could be linked to an additional physiological process or secondary task-related regions not detected by fMRI-BOLD [
28,
34]. Also the characteristics of the signal-to-noise ratio differs between the two methods, which not only affects the statistical power of the methods to detect effects, but also the proportion of voxels/clusters that exceed statistical threshold [
15]. Thus, the relation between the consumption of glucose and oxygen in the brain is a rising area of interest related to understanding abnormal brain activity and disease [
35,
36].
In a future clinical aspect, our method is simple to adapt and implement as a PET stand-alone setup or accompanied by a fMRI sequence, in sites where scanners featuring the only PET scanner facilities or the double PET/MRI modality. The setup with a double boli administration is easily executed and can even be carried out manually. The purely imaging-based approach without the need of blood sampling made possible by the IDIF, further supports this setup. The two-tissue kinetic compartment analysis is compiled in a Python script. New whole-body approximated PET-scanners further support much more sensitivity, hence the absolute and robust quantification of data and better delineation of small vessel and less noisy imaging in general. The two-tissue compartment method uses the full data range and in theory has no lower time limit, relying only on image quality and the derived TAC’s. Our fFDG model improves the overall future clinical aspects within mental health in the study of neural activity related to changes in function and fluctuating symptoms in brain disorders, also including the implications related to brain plasticity and compensations related to lesions and trauma, etc.
One noticeable limitation of this study is the long scan times of the PET stand-alone paradigm in both the baseline period, but in particular the activation period, which could probably cause some fatigue of the hands and fingers of the test subjects and/or habituation effects in neural activation [
37]. We also assume that the rate constants are non-variable during both baseline and activation. The method should be tested with shorter time paradigms. The limiting factor is only image quality. With an increase in scanner sensitivity, we could decrease the scan time proportionally. Furthermore, we are now applying the method in studies of dynamic changes of neural activity measured by dynamic changes in the glucose metabolism in activation paradigms in relation to cognitive functions, including higher-order functions such as attention, memory and executive functions.


