
Improving the Accuracy of Continuous Blood Glucose Measurement Using Personalized Calibration and Machine Learning

Abstract
1. Introduction
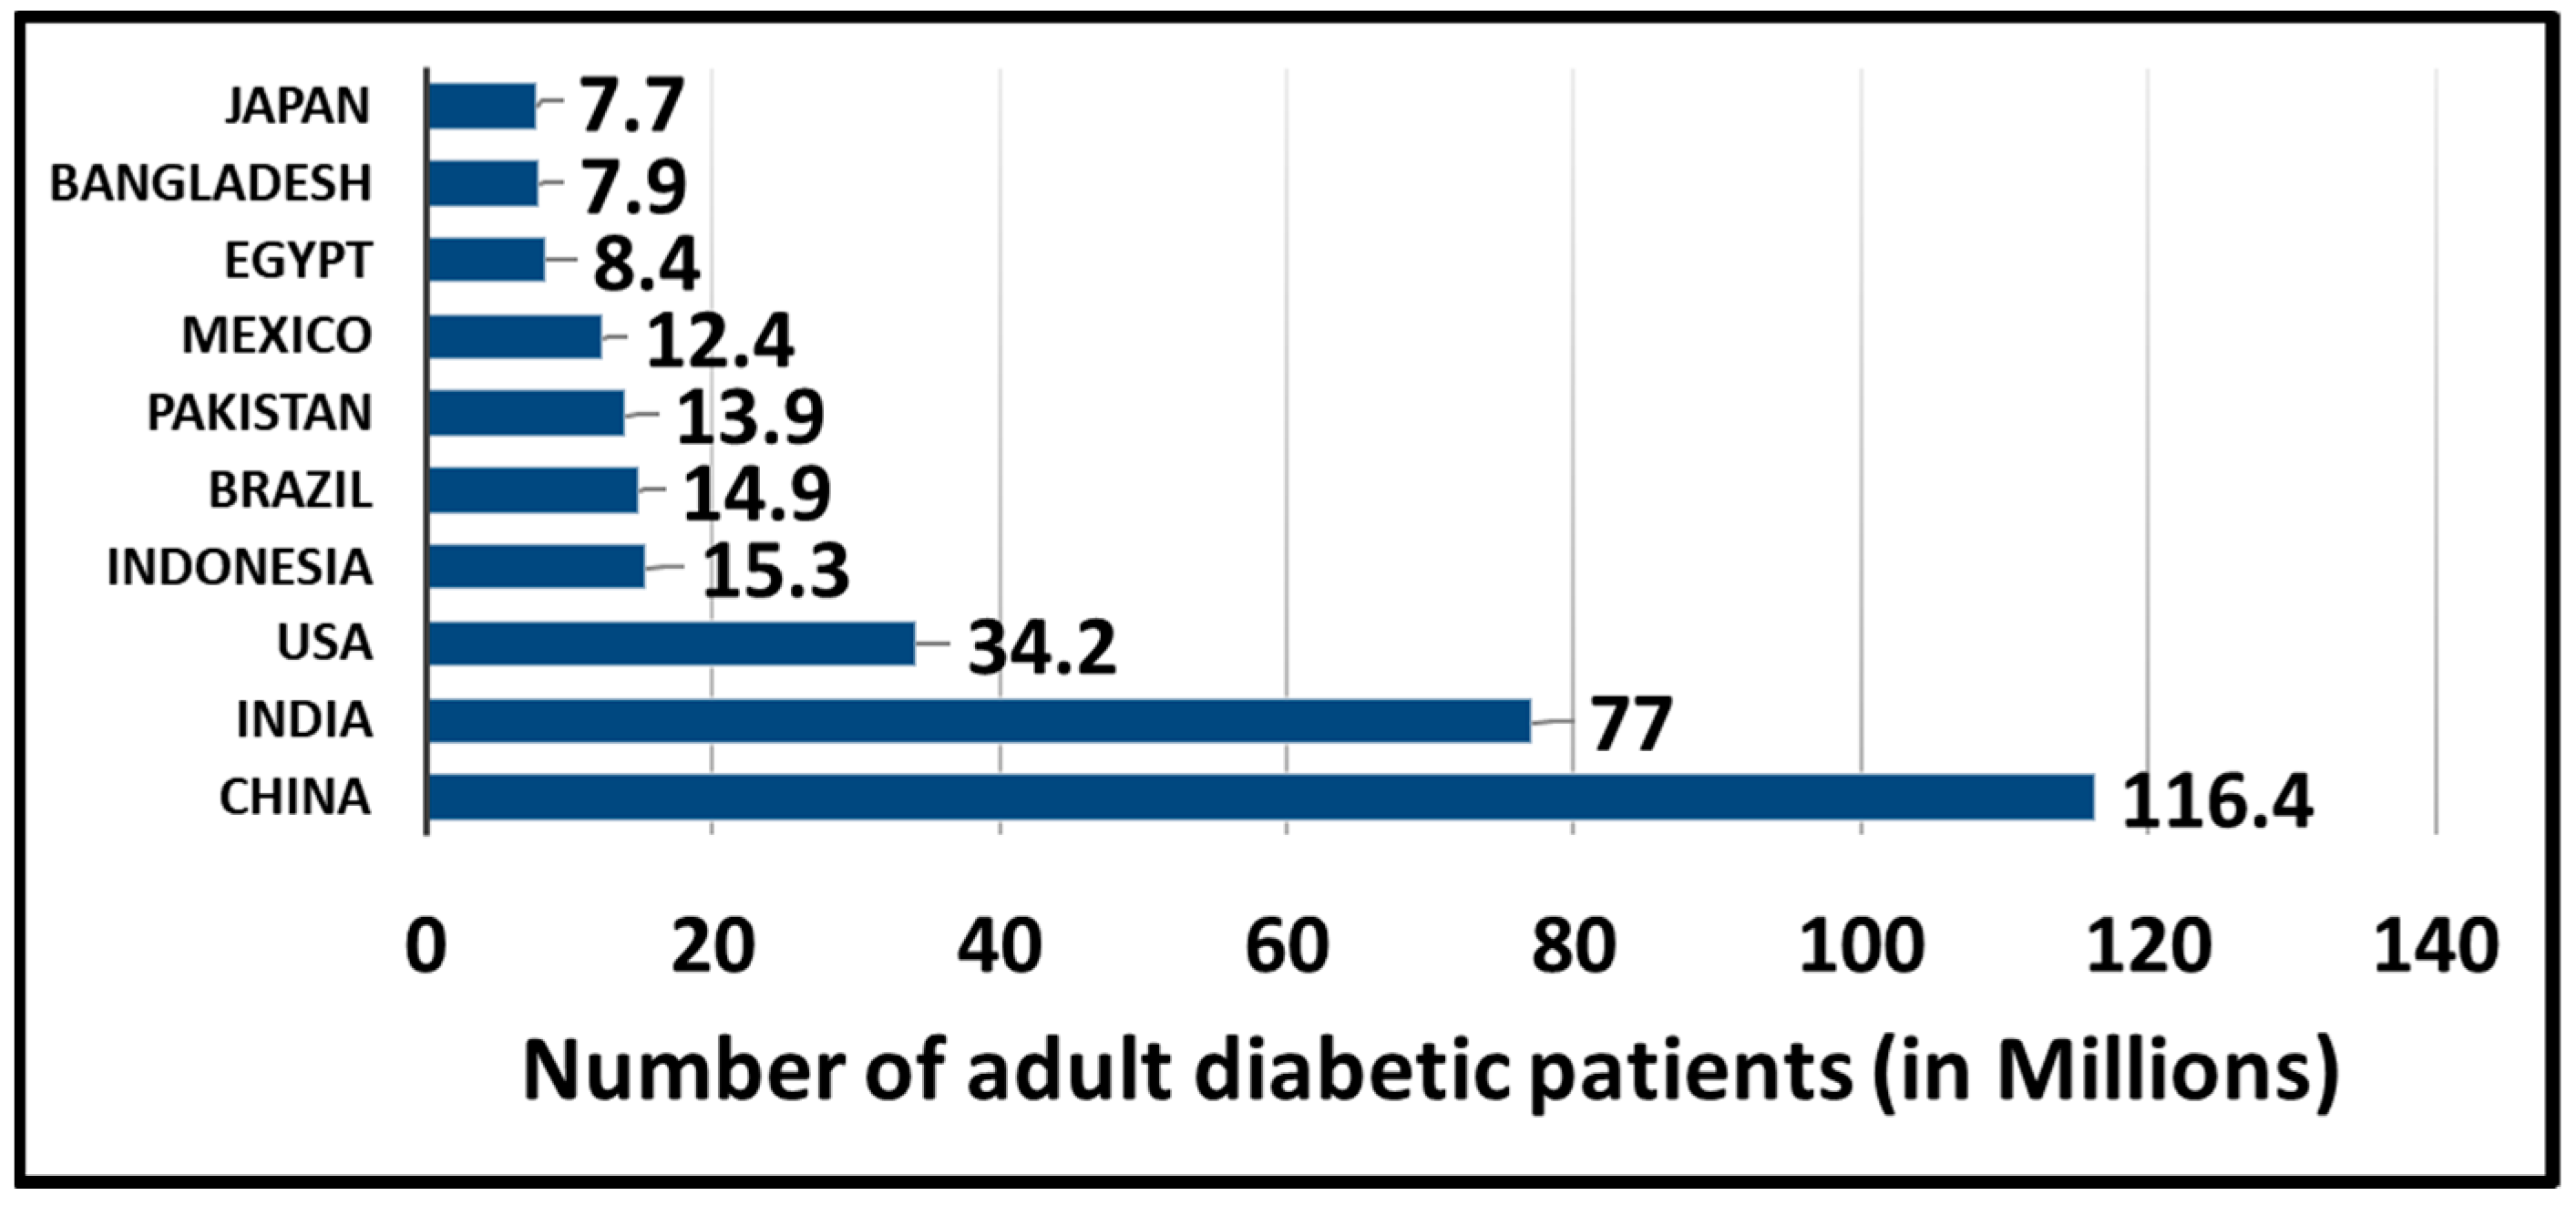
1.1. Causes and Types of Diabetes
1.2. Biological Measurements of Blood Glucose
1.3. Accuracy Assessment and Food and Drug Administration (FDA) Regulation
1.4. Existing Invasive, Minimally Invasive, and Noninvasive Methods for Measuring Blood Glucose
1.5. Role of Machine Learning in Blood Glucose Measurement
1.6. Our Motivation and Contributions
2. Materials and Methods
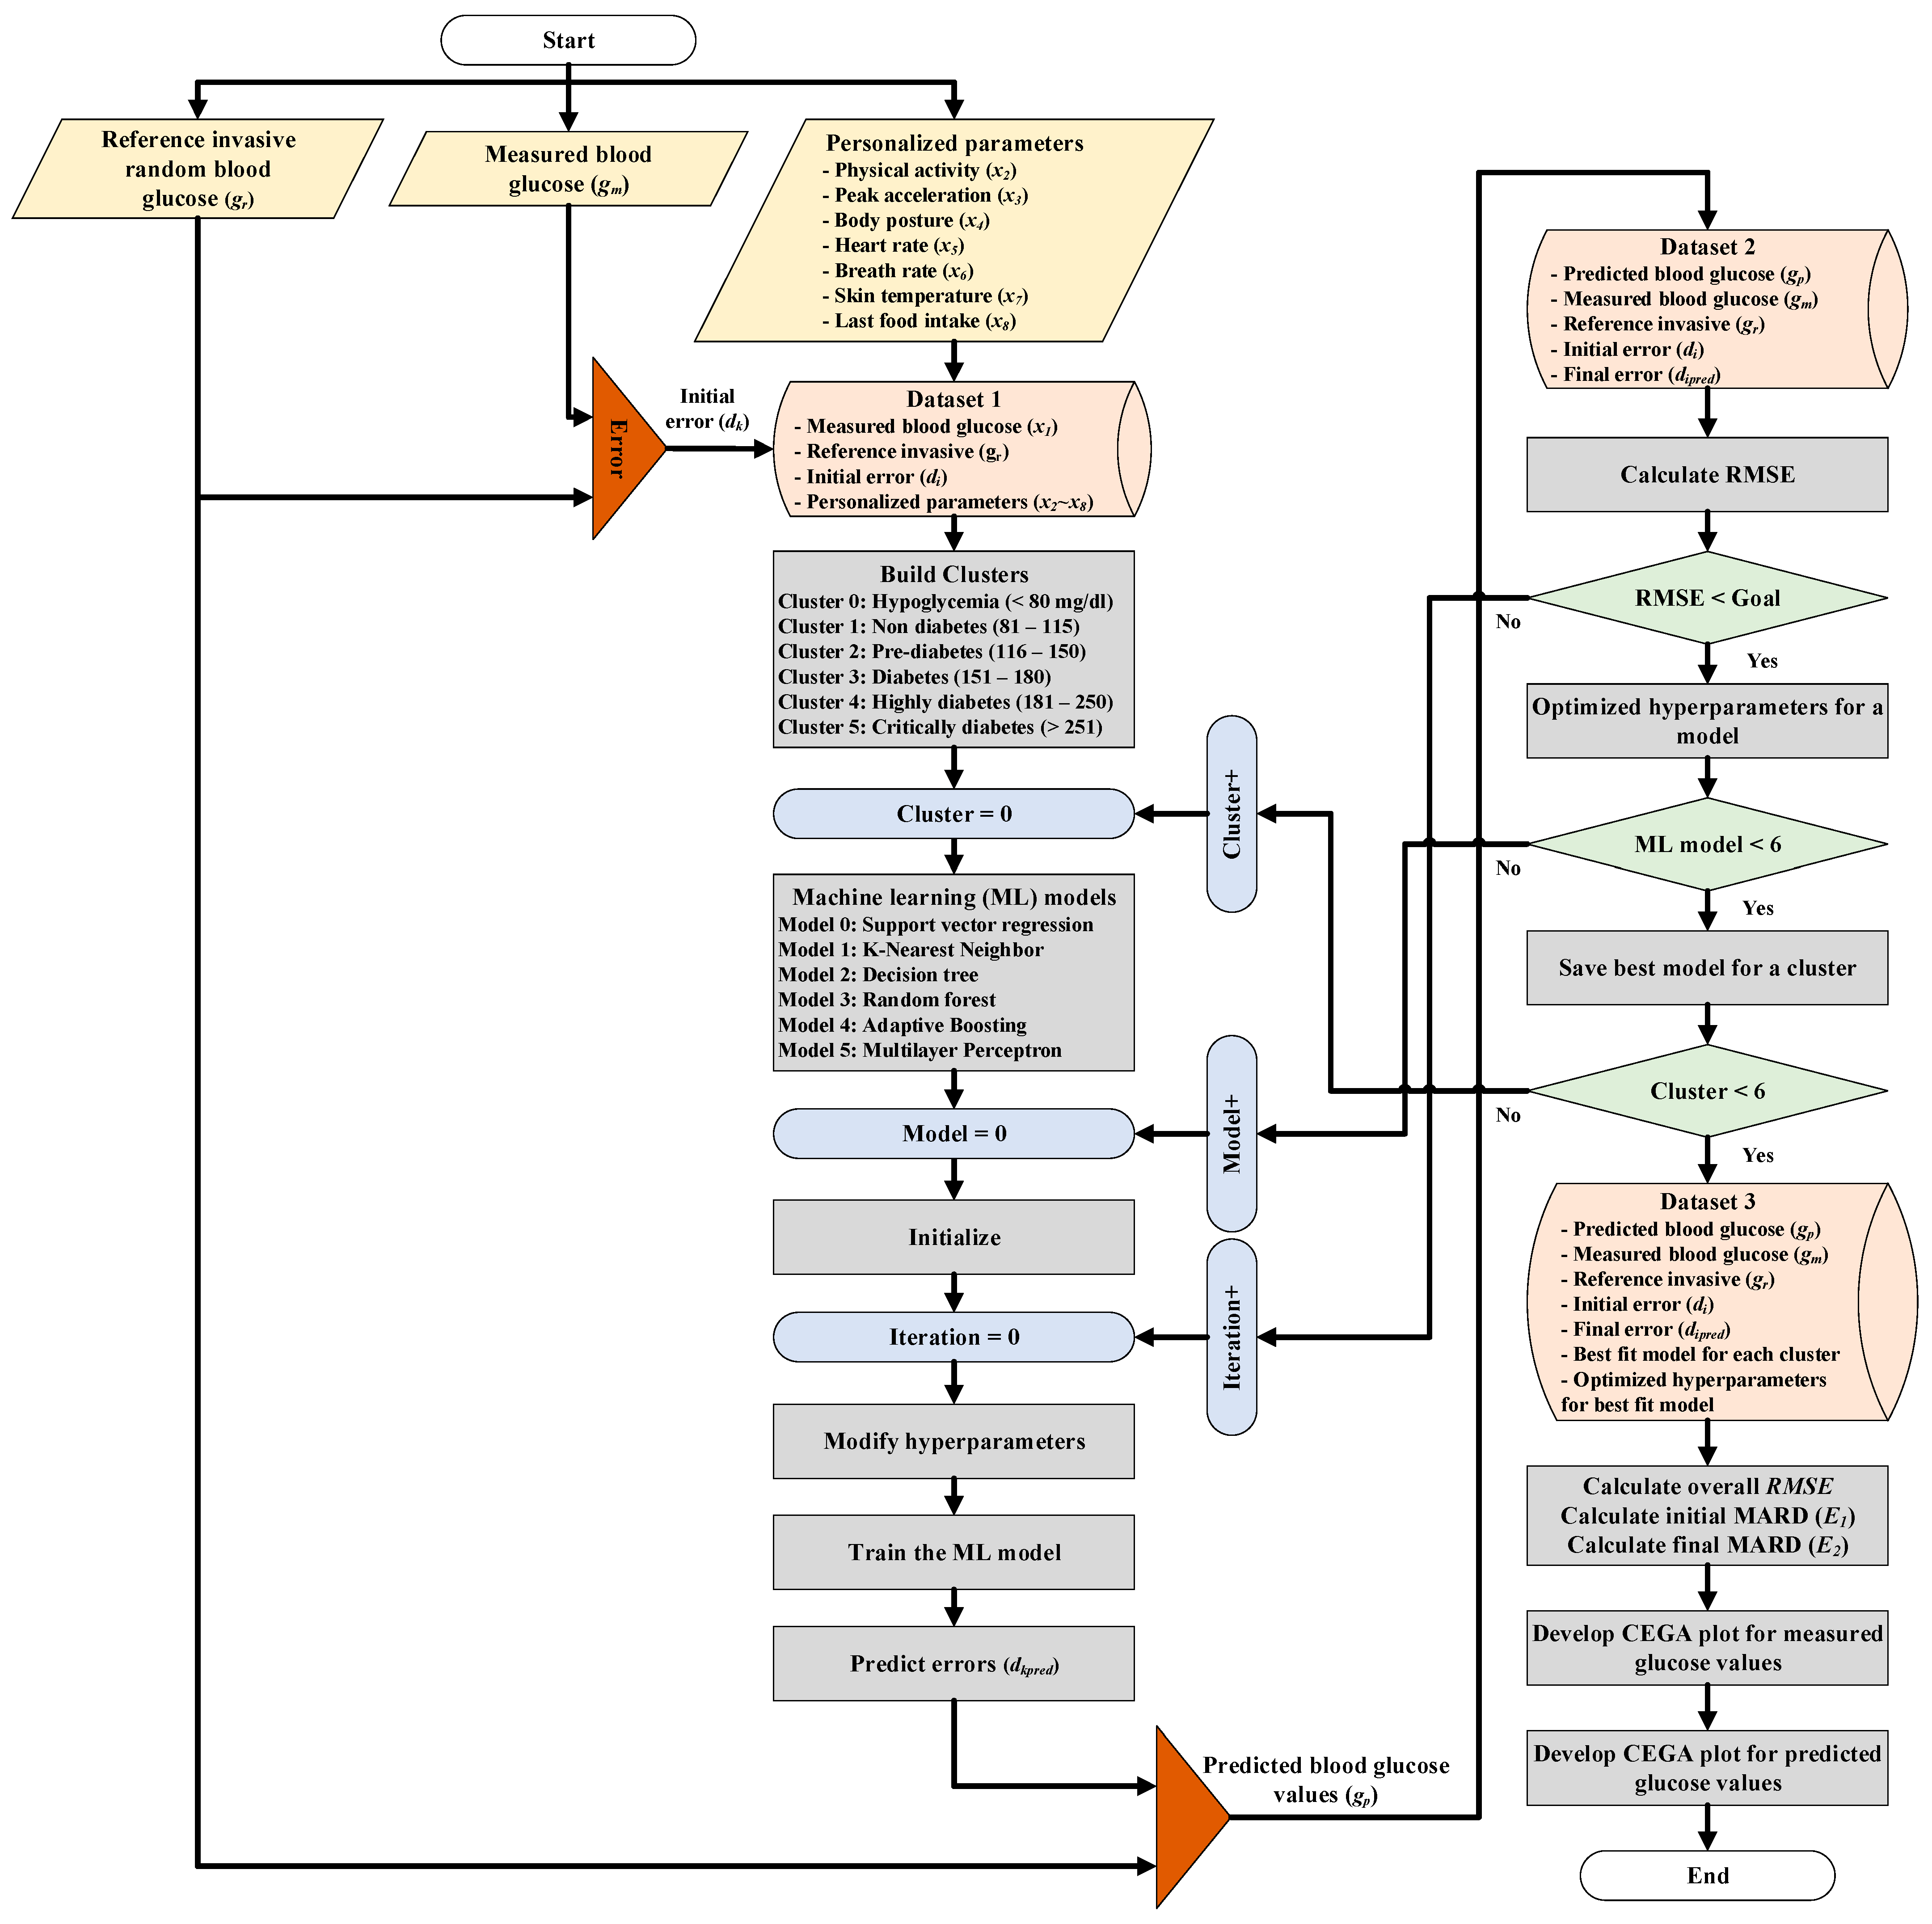
2.1. Multimodel Machine Learning Approach for CBGM
2.2. Experimental Dataset
2.3. Initial Results of Multimodel CBGM Based on the Experimental Dataset
- SVR;
- KNN;
- DT;
- RF;
- AdaBoost;
- MLP.
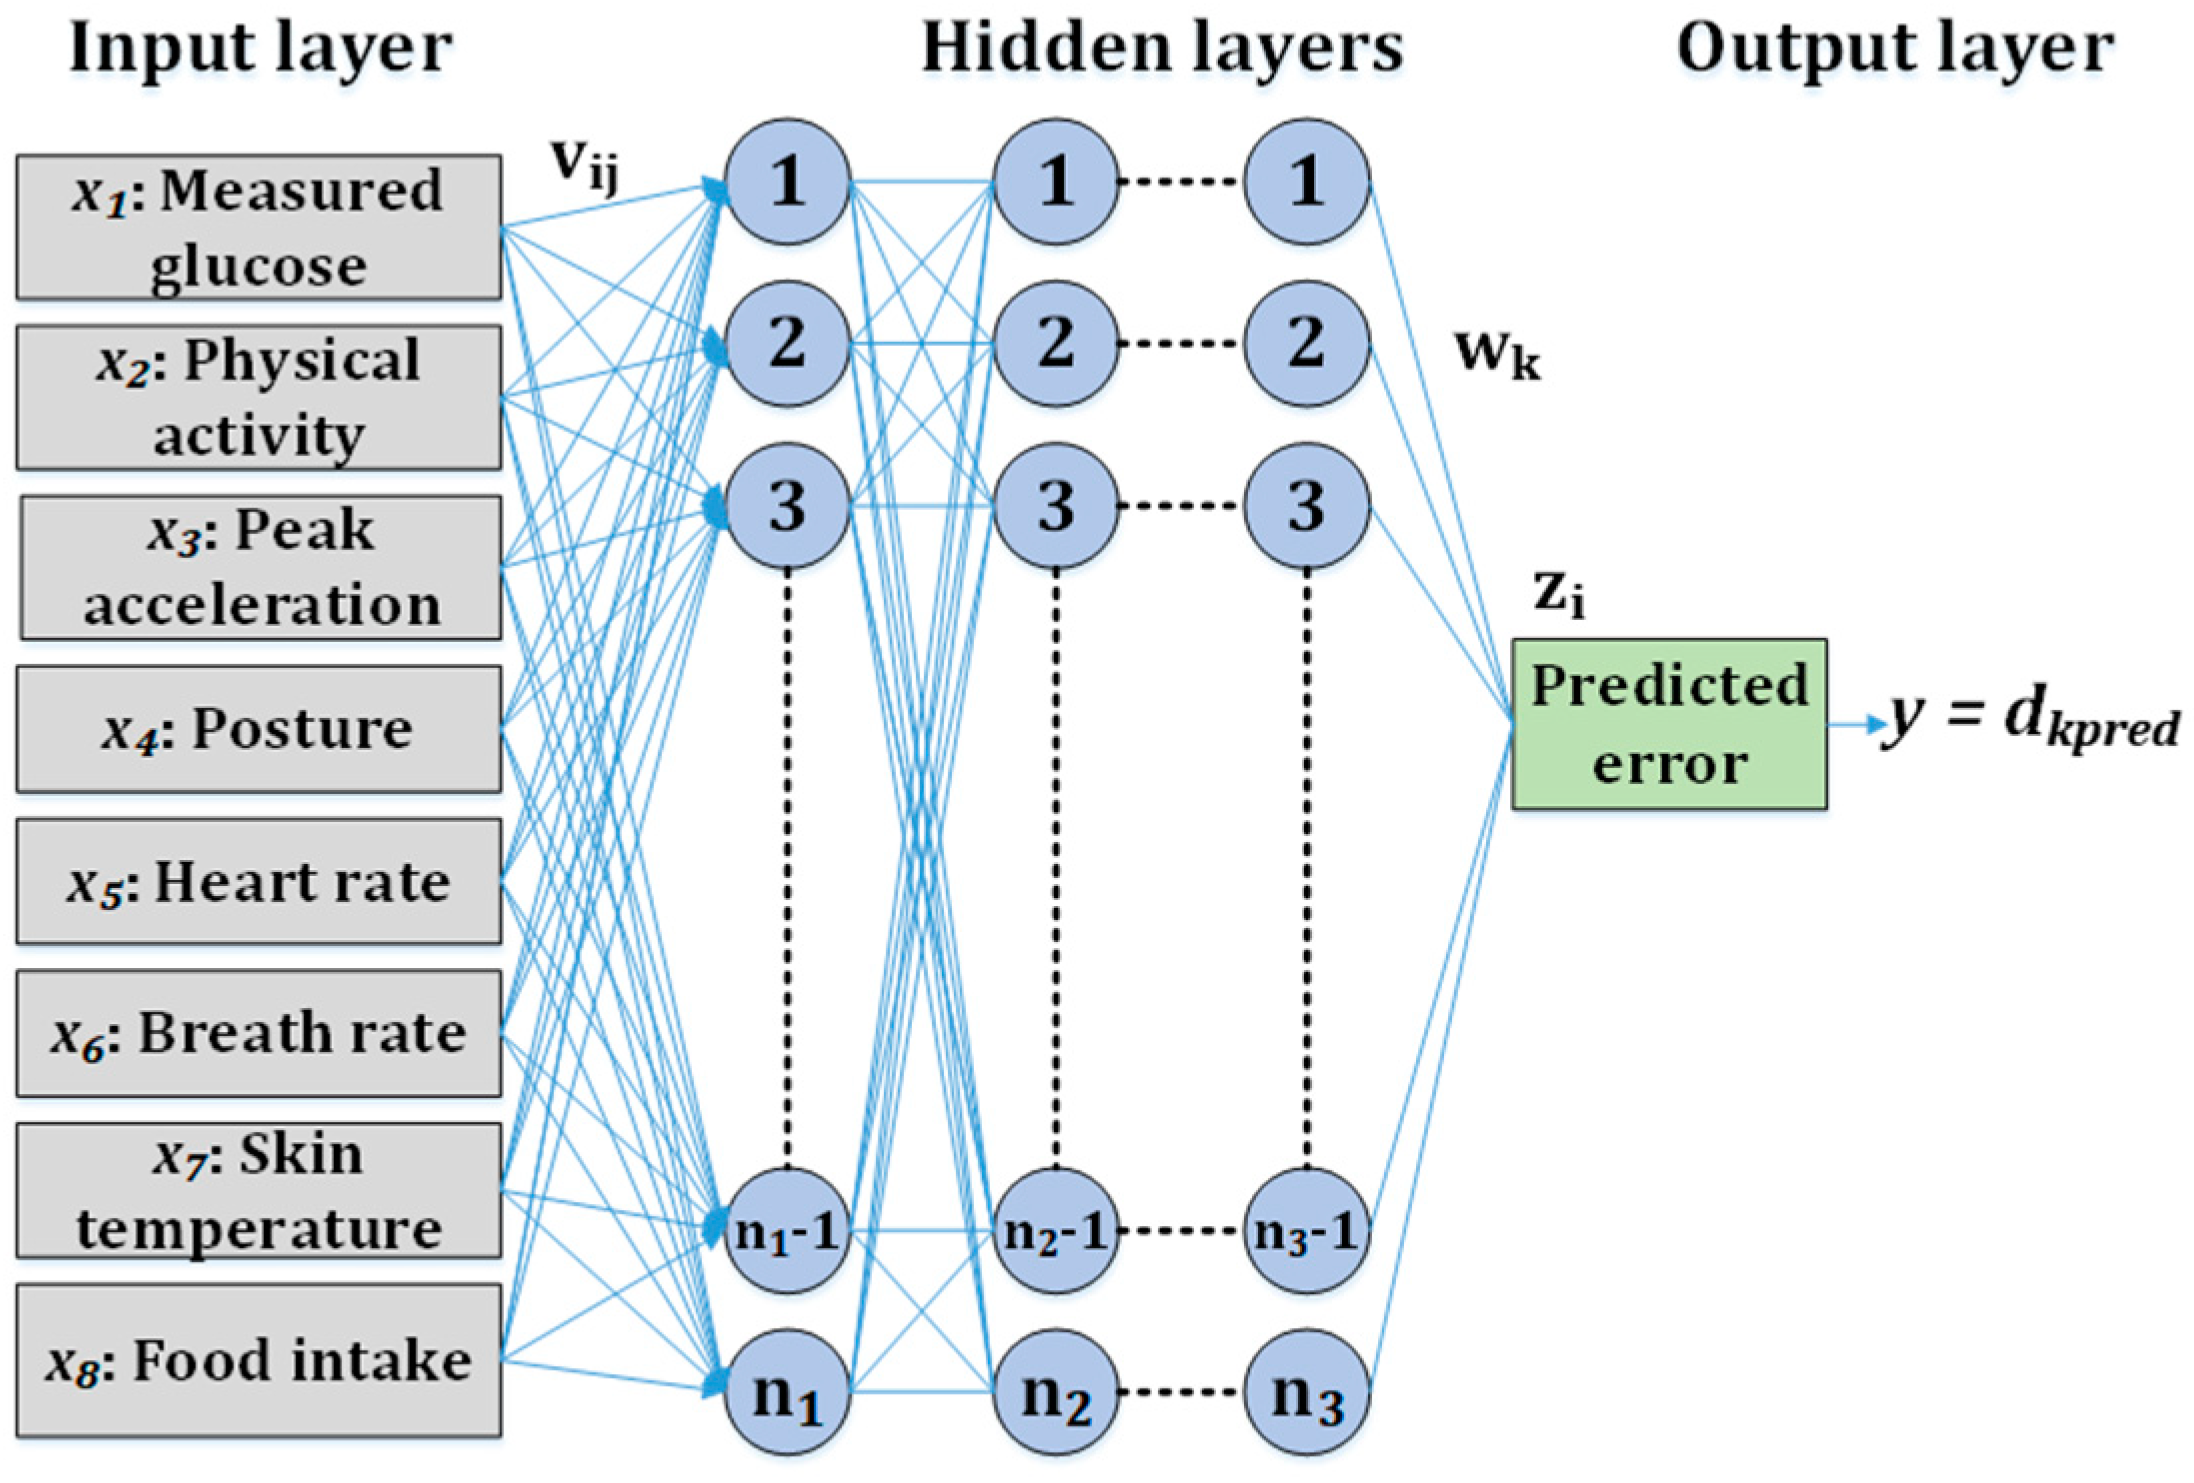
2.4. MLP-Based CBGM
| Algorithm 1 Grid search for hyperparameter optimization. |
| HL: hidden layers
LRI: learning rate initial value LRT: learning rate type AF: activation function MI: maximum iterations Mom: momentum Opt: optimizer MLP: multilayer perceptron D_g: dataset for group g (glucose range based) 1. Input: HL, LRI, LRT, AF, MI, Mom, Opt, MLP, D_g; 2. Initialize: Best_Model = null; model.MARD_temp=0, model.RMSE_temp=0; 3. for D_g in D: 4. for HL_i in HL: 5. for LRI_i in LRI: 6. for LRT_i in LRT: 7. for AF_i in AF: 8. for MI_i in MI: 9. for Mom_i in Mom: 10. for Opt_i in Opt: 11. model = MLP(HL_i, LRI_i, LRT_i, AF_i, MI_i, Mom_i, Opt_i) 12. model.train(D_g_train) 13. model.test(D_g_test) 14. calculate model.MARD 15. calculate model.RMSE 16. model.MARD_temp{ } ← model.MARD 17. model.RMSE_temp{ } ← model.RMSE 18. find (min(model.RMSE_temp)&&min(model.MARD_temp)) 19. Best_Model(D_g) = model 20. end 21. Output: Best_Model |
3. Result
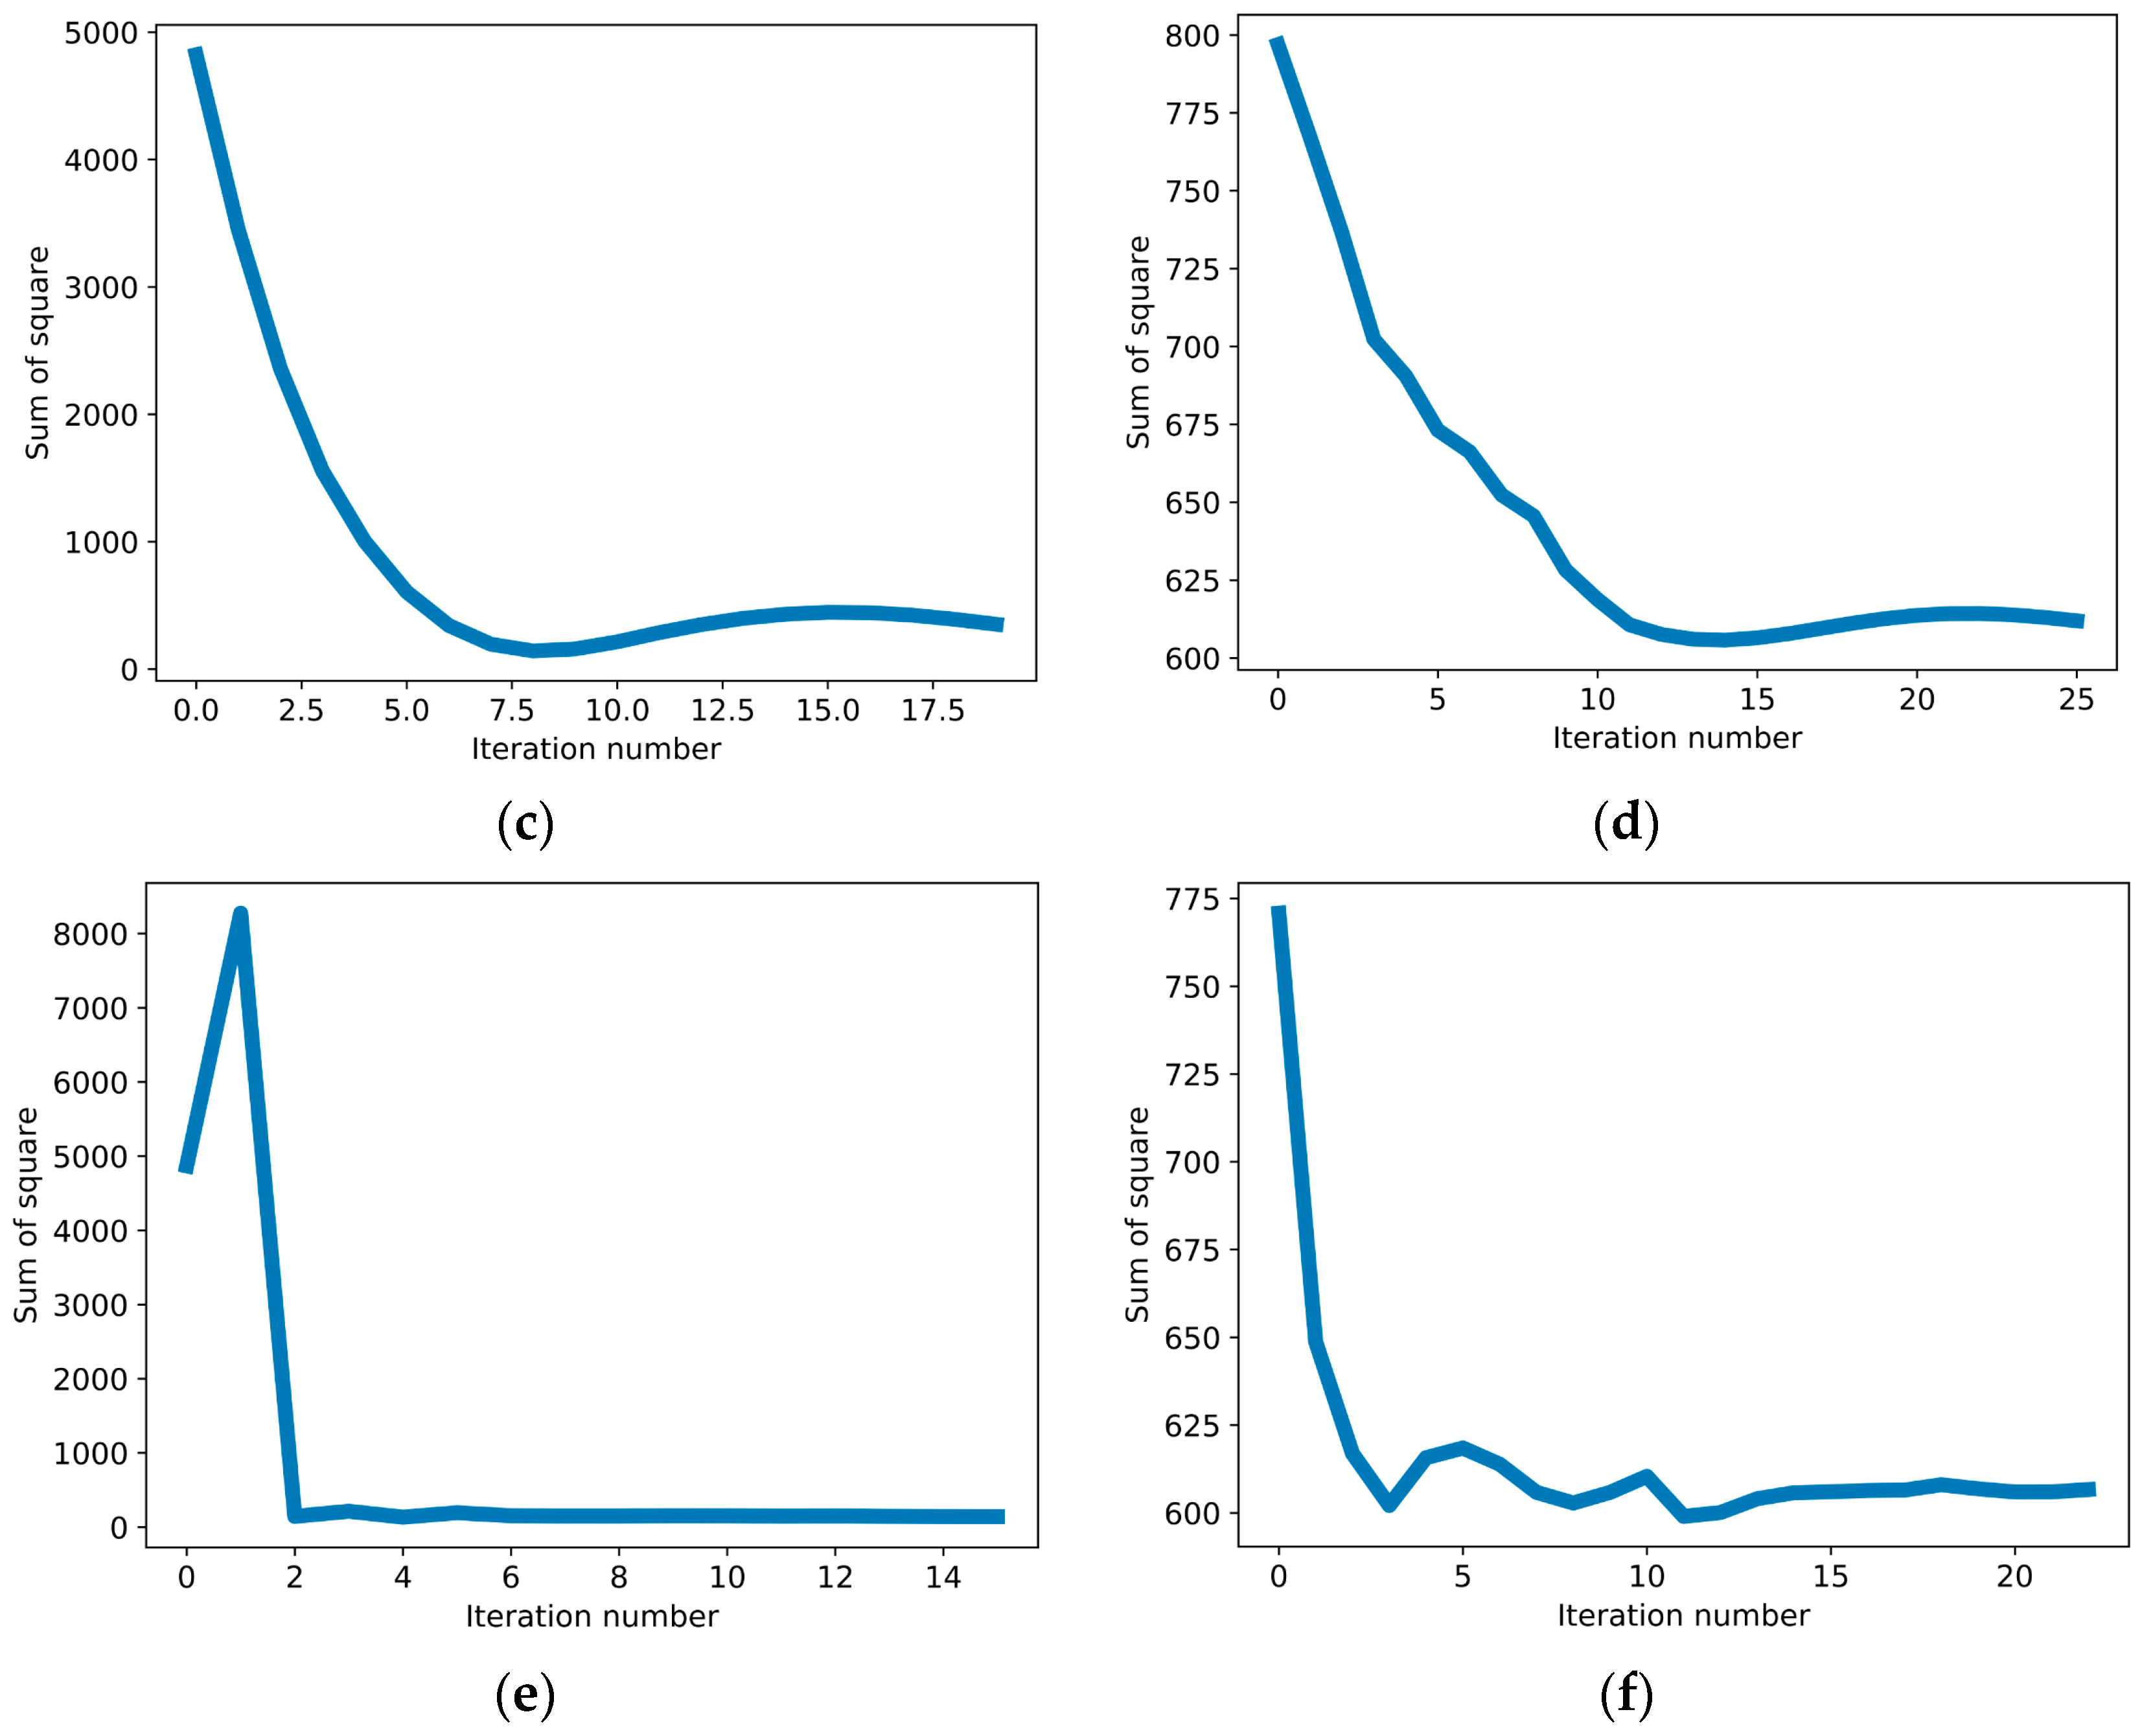
3.1. MLP-Based CBGM Grid Search Results
3.2. MLP-Based CBGM RMSE and MARD Calculations
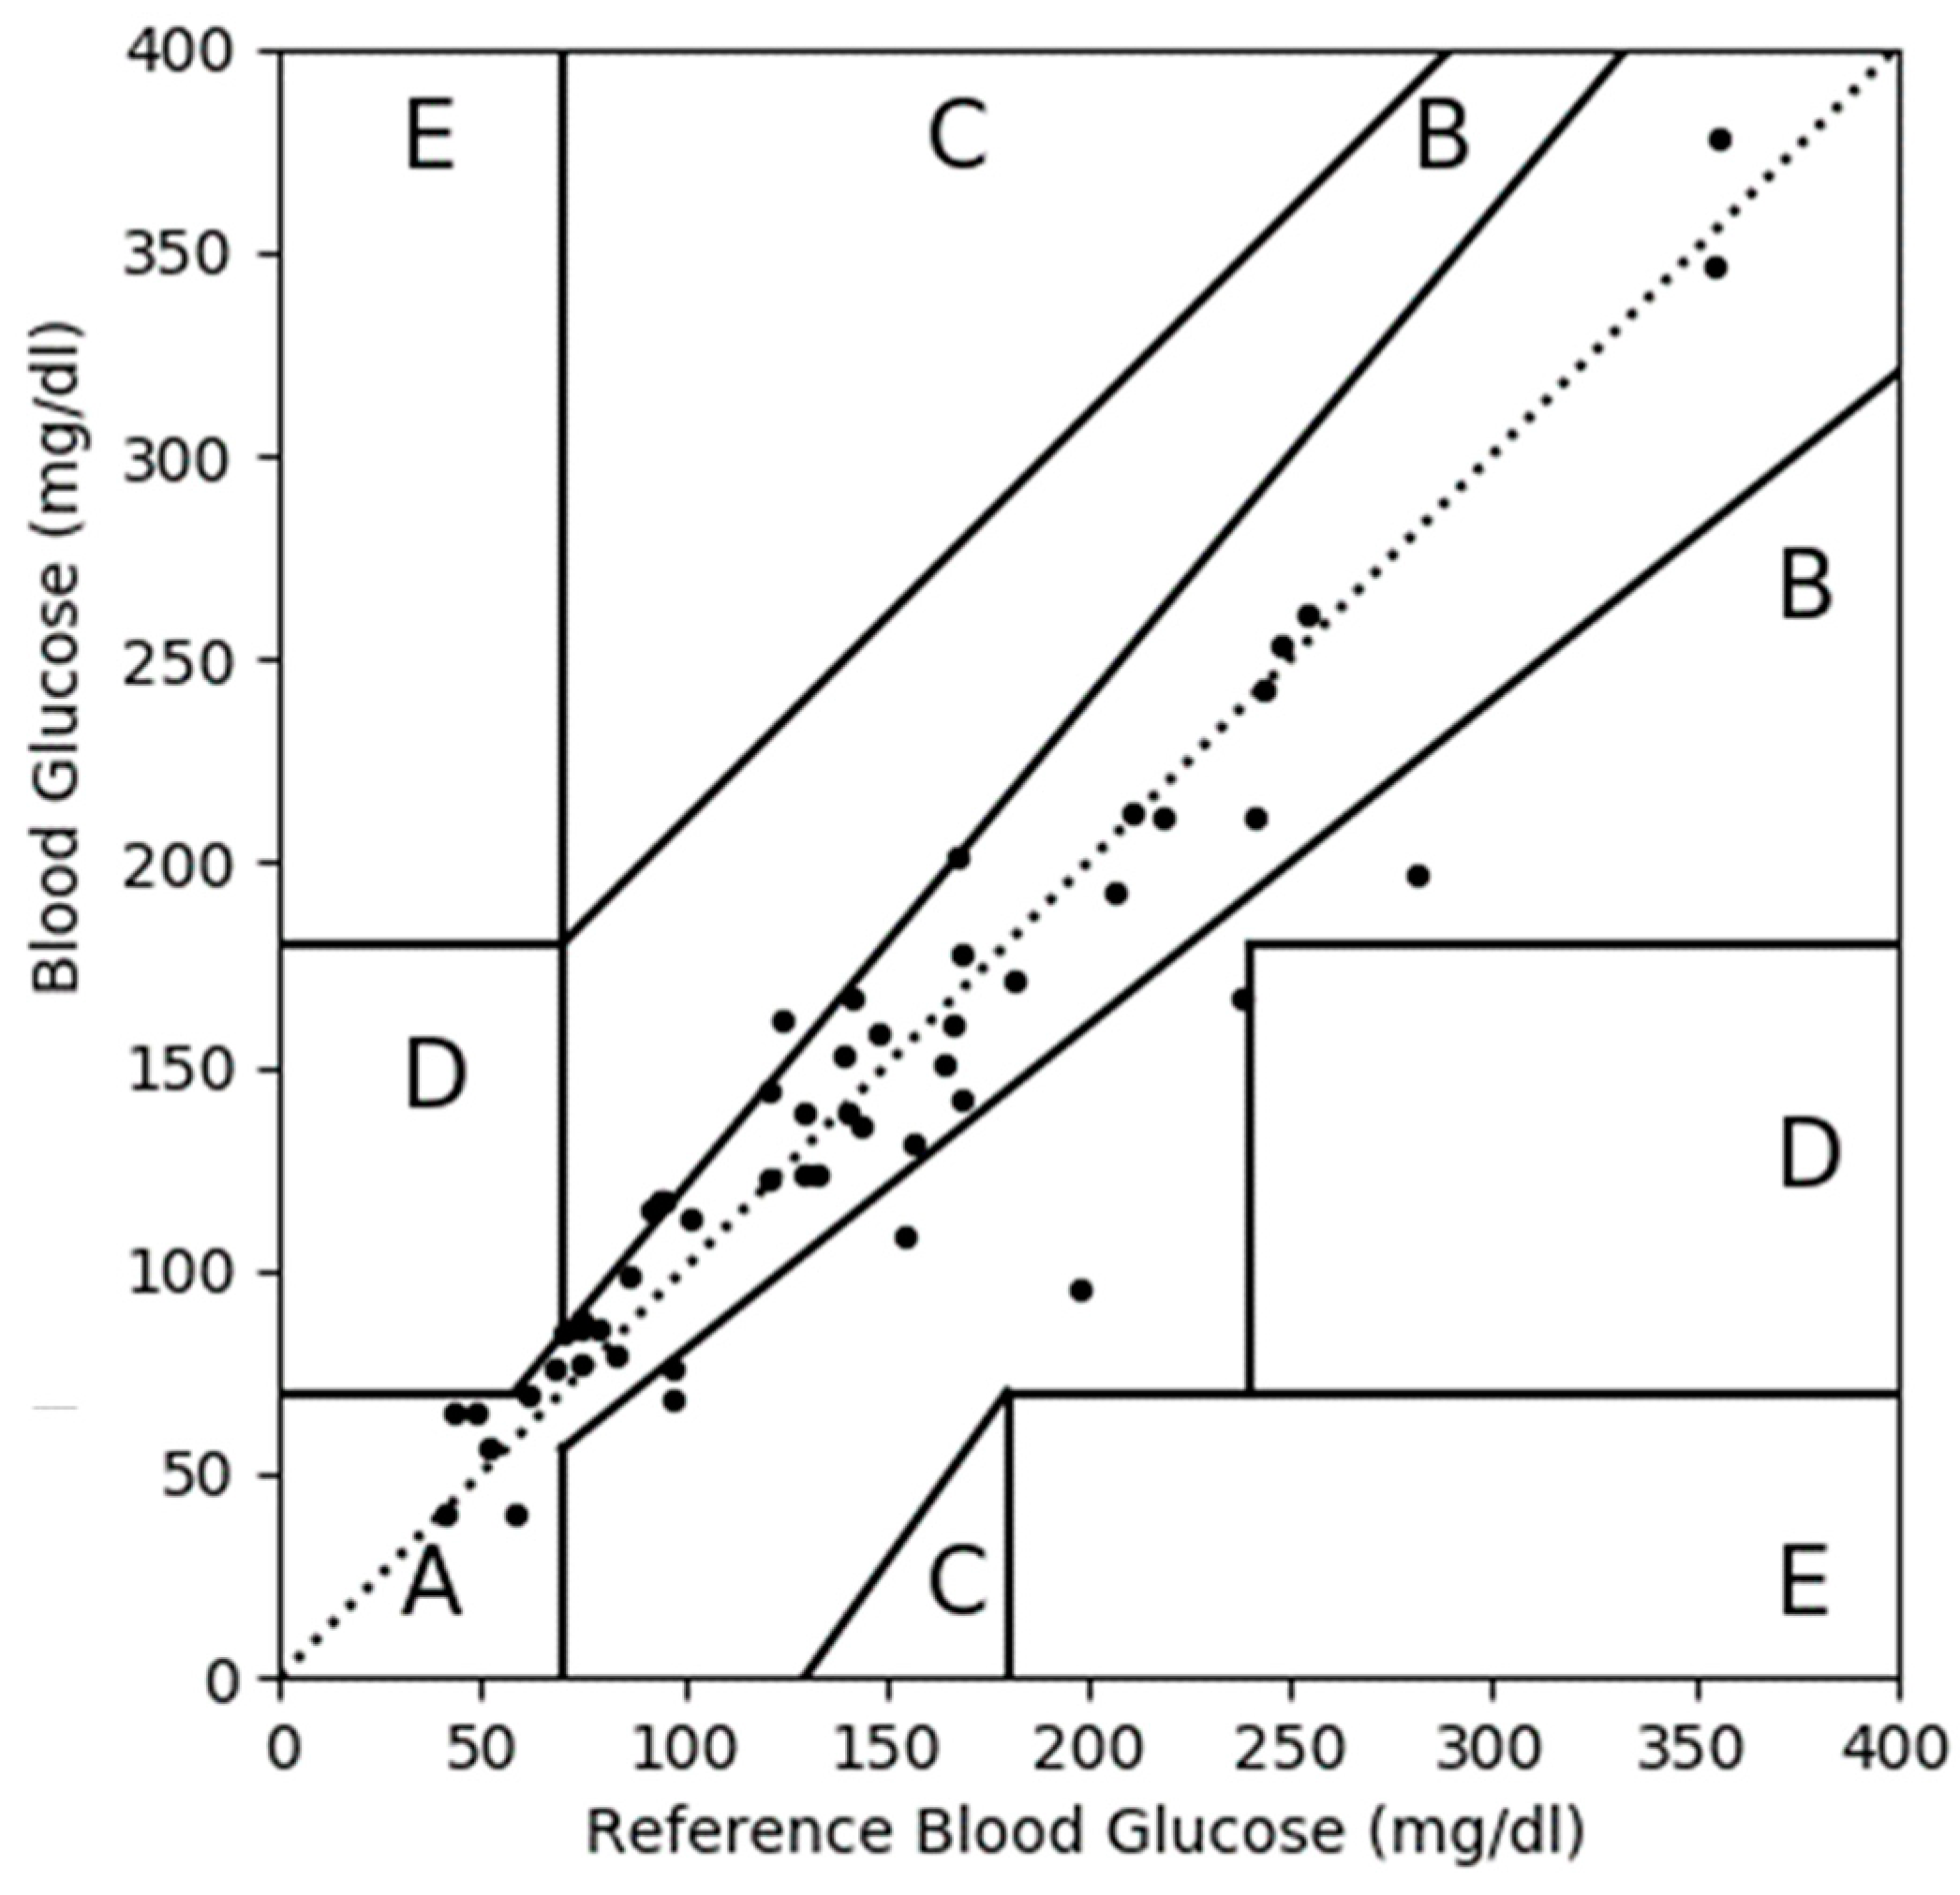
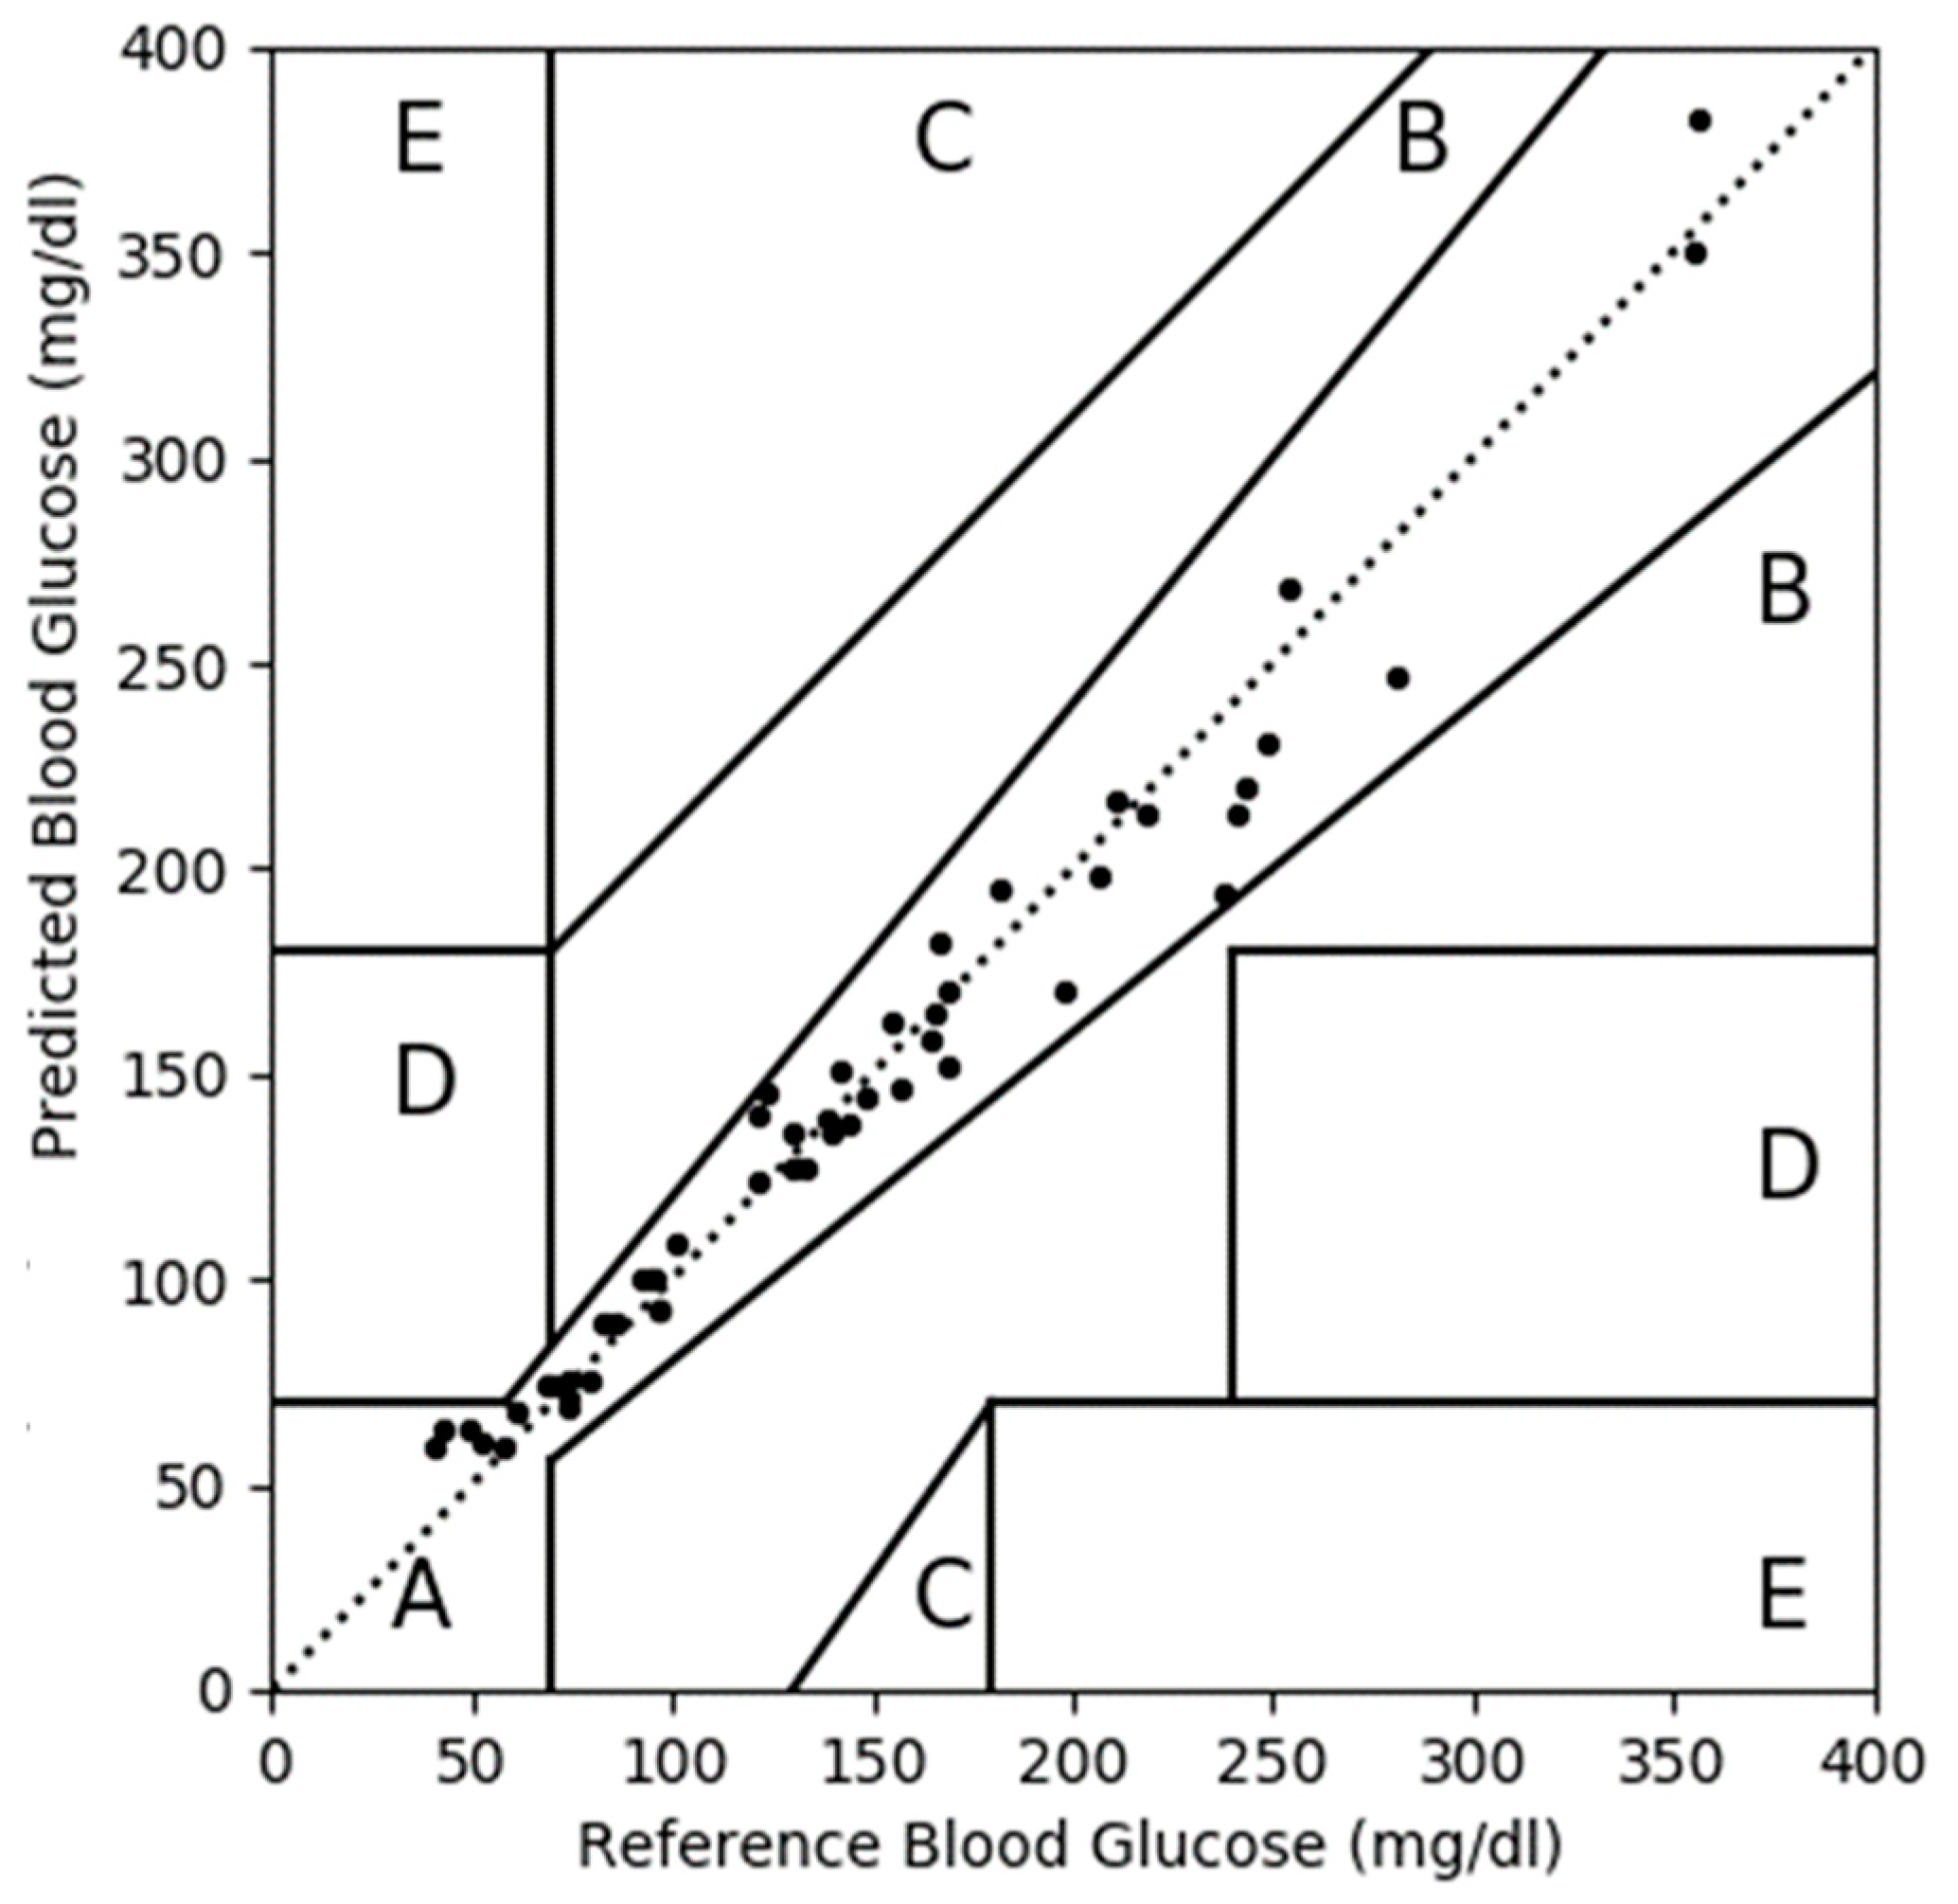
3.3. CEGA Plot
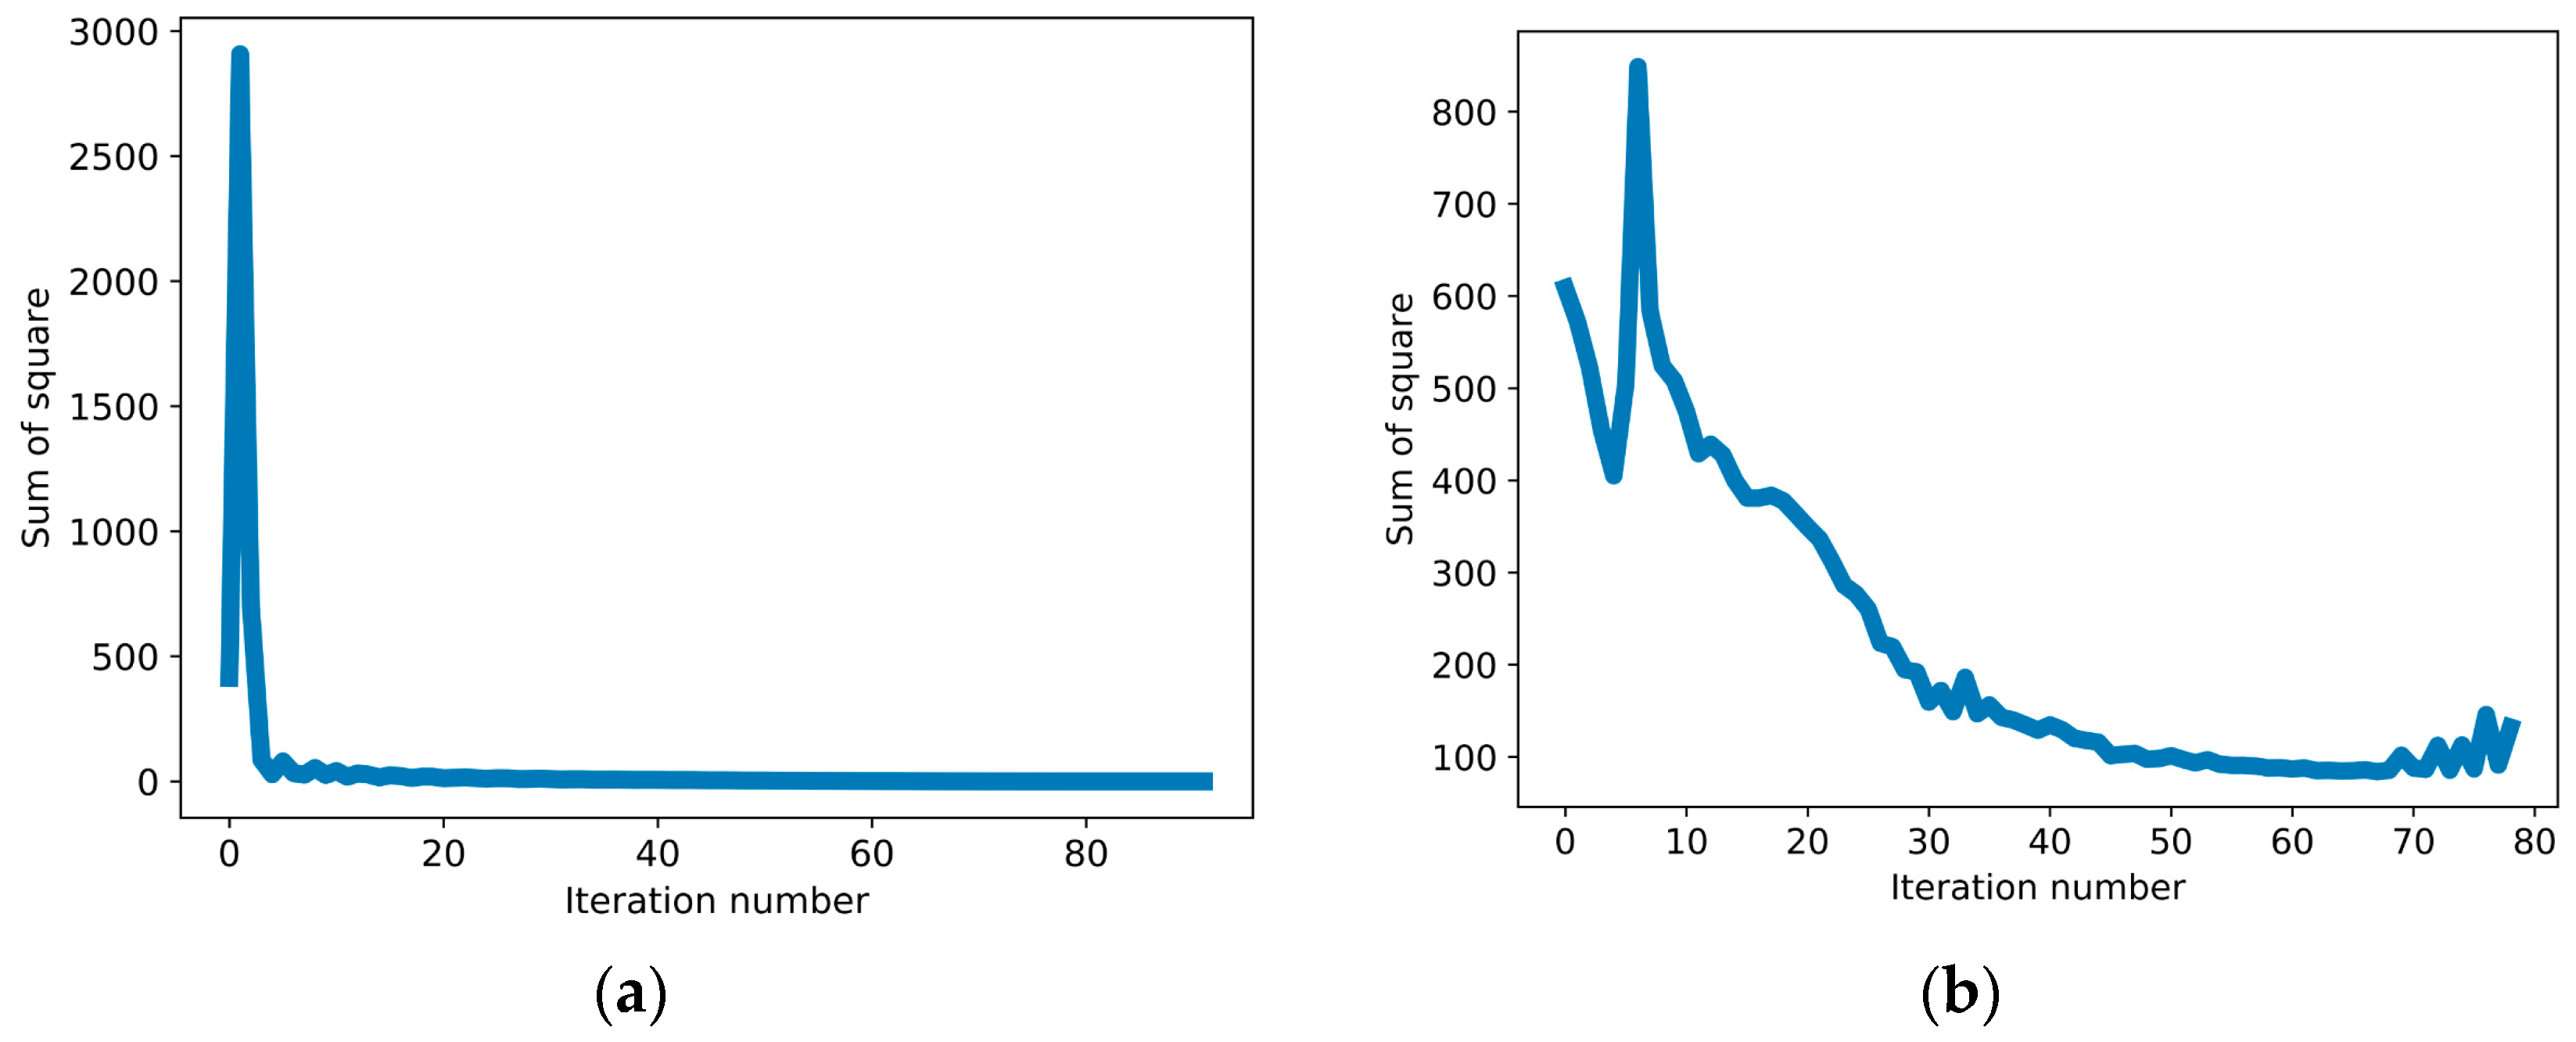
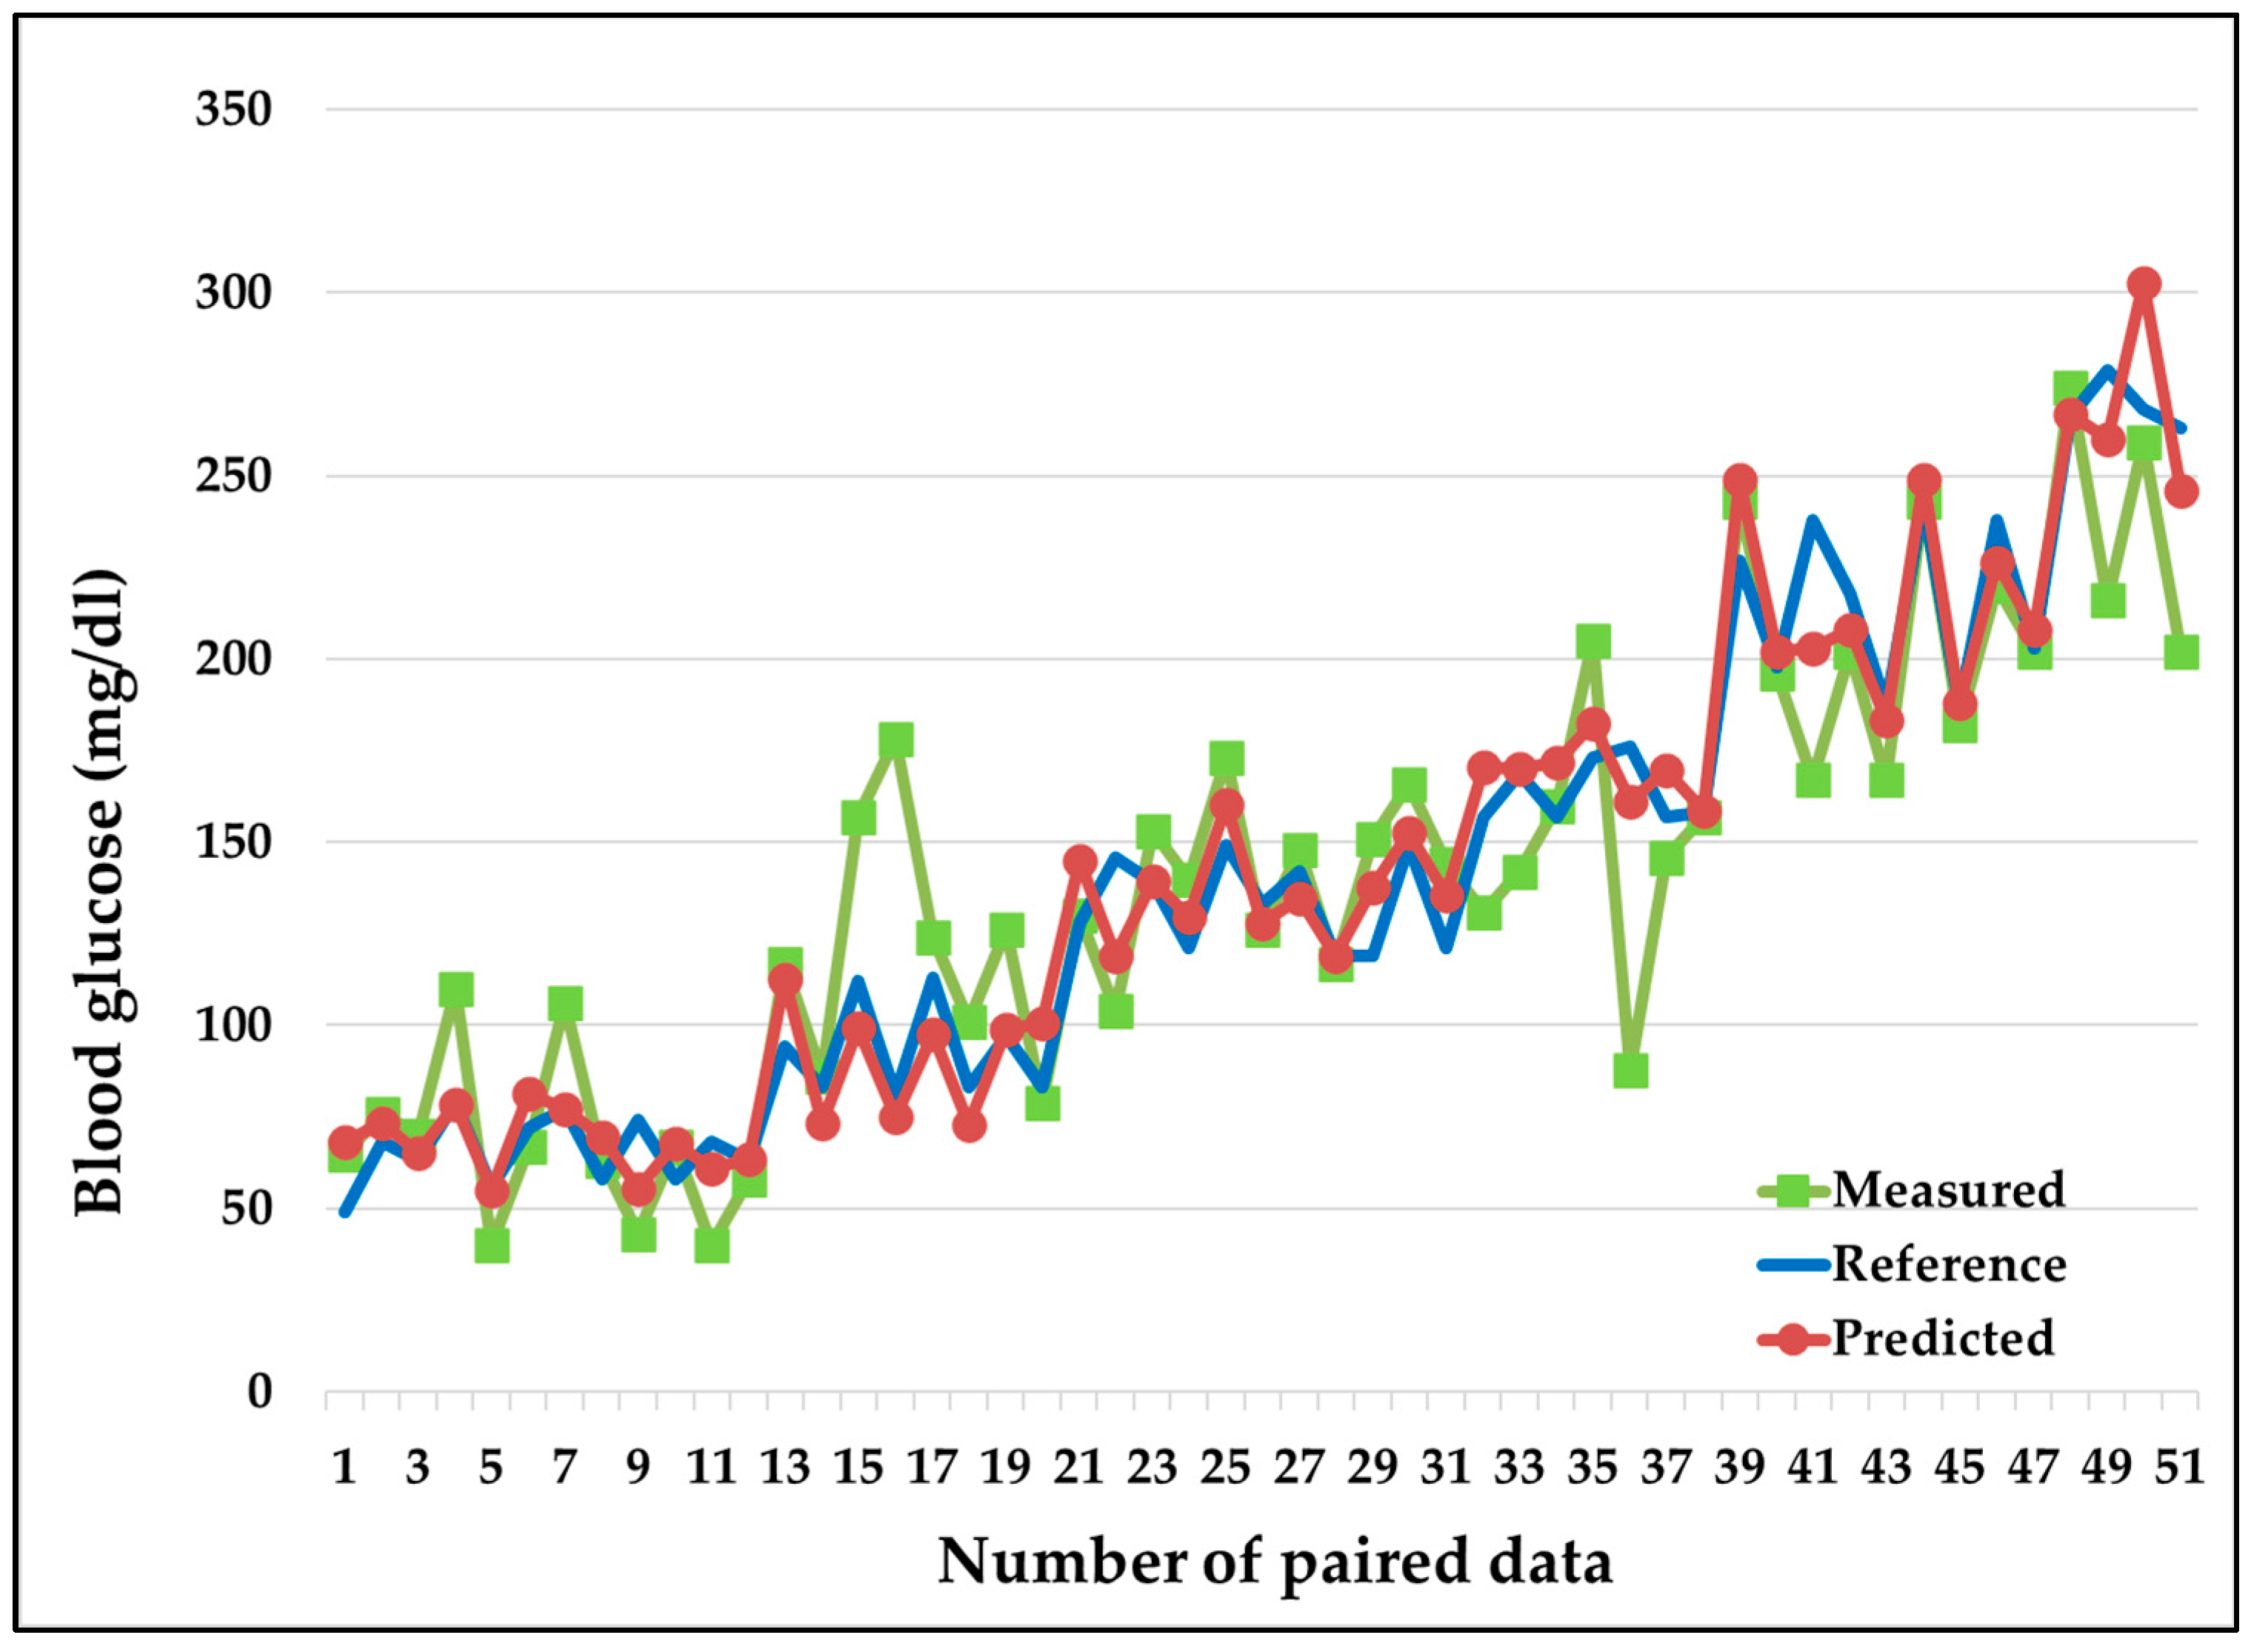
3.4. MLP-Based CBGM Error Plot
4. Discussion
5. Conclusions
6. Patents
Author Contributions
Funding
Institutional Review Board Statement
Informed Consent Statement
Data Availability Statement
Acknowledgments
Conflicts of Interest
References
- Sun, H.; Saeedi, P.; Karuranga, S.; Pinkepank, M.; Ogurtsova, K.; Duncan, B.B.; Stein, C.; Basit, A.; Chan, J.C.; Mbanya, J.C.; et al. IDF diabetes atlas: Global, regional and country-level diabetes prevalence estimates for 2021 and projections for 2045. Diabetes Res. Clin. Pract. 2022, 183, 109119. [Google Scholar]
- International Diabetes Federation (IDF). IDF Diabetes Atlas. 2021. Available online: https://diabetesatlas.org/atlas/tenth-edition/ (accessed on 20 September 2022).
- American Diabetes Association. Diagnosis and classification of diabetes mellitus. Diabetes Care 2005, 28, S37. [Google Scholar] [CrossRef]
- Global Diabetes Diagnostics Market to Reach $41.9 Billion by 2027. Statistic. 2021. Available online: https://www.strategyr.com/market-report-diabetes-diagnostics-forecasts-global-industry-analysts-inc (accessed on 7 June 2021).
- Makaram, P.; Owens, D.; Aceros, J. Trends in nanomaterial-based noninvasive diabetes sensing technologies. Diagnostics 2014, 4, 27–46. [Google Scholar] [PubMed]
- Villena Gonzales, W.; Mobashsher, A.T.; Abbosh, A. The progress of glucose monitoring—A review of invasive to minimally and noninvasive techniques, devices and sensors. Sensors 2019, 19, 800. [Google Scholar] [CrossRef]
- Heinemann, L.; Schoemaker, M.; Schmelzeisen-Redecker, G.; Hinzmann, R.; Kassab, A.; Freckmann, G.; Reiterer, F.; Del Re, L. Benefits and limitations of MARD as a performance parameter for continuous glucose monitoring in the interstitial space. J. Diabetes Sci. Technol. 2020, 14, 135–150. [Google Scholar] [PubMed]
- Clarke, W.L. The original Clarke error grid analysis (EGA). Diabetes Technol. Ther. 2005, 7, 776–779. [Google Scholar] [PubMed]
- Katz, L.B.; Stewart, L.; King, D.; Cameron, H. Meeting the new FDA standard for accuracy of self-monitoring blood glucose test systems intended for home use by lay users. J. Diabetes Sci. Technol. 2020, 14, 912–916. [Google Scholar] [CrossRef]
- Guidance, D. Blood glucose monitoring test systems for prescription point-of care use: Draft guidance for industry and Food and Drug Administration staff. Fed. Regist. 2005, 1988, 1–38. [Google Scholar]
- Foley, M.C.; Padow, V.A.; Schlick, T. The extraordinary ability of DNA pol λ to stabilize misaligned DNA. J. Am. Chem. Soc. 2020, 132, 13403. [Google Scholar] [CrossRef] [PubMed][Green Version]
- Mazzoccoli, G.; Vendemiale, G.; De Cata, A.; Carughi, S.; Tarquini, R. Altered time structure of neuro-endocrine-immune system function in lung cancer patients. BMC Cancer 2010, 10, 1. [Google Scholar]
- Lee, S.; Paudel, O.; Jiang, Y.; Yang, X.R.; Sham, J.S. CD38 mediates angiotensin II–induced intracellular Ca2+ release in rat pulmonary arterial smooth muscle cells. Am. J. Respir. Cell Mol. Biol. 2015, 52, 332–341. [Google Scholar] [PubMed]
- Bourré, G.; Cantrelle, F.X.; Kamah, A.; Chambraud, B.; Landrieu, I.; Smet-Nocca, C. Direct crosstalk between O-GlcNAcylation and phosphorylation of tau protein investigated by NMR spectroscopy. Front. Endocrinol. 2018, 9, 595. [Google Scholar] [CrossRef] [PubMed]
- Perin, P.; Marino, F.; Varela-Nieto, I.; Szczepek, A.J. Neuroimmunology of the inner ear. Front. Neurol. 2021, 12, 635359. [Google Scholar] [PubMed]
- Fan, W.; Jiang, Y.; Zhang, M.; Yang, D.; Chen, Z.; Sun, H.; Lan, X.; Yan, F.; Xu, J.; Yuan, W. Comparative transcriptome analyses reveal the genetic basis underlying the immune function of three amphibians’ skin. PLoS ONE 2017, 12, e0190023. [Google Scholar] [CrossRef]
- Guri, S.; Huber, S.G. Measuring teaching quality, designing tests, and transforming feedback targeting various education actors. Educ. Assess. Eval. Account. 2020, 32, 271–273. [Google Scholar]
- Rabby, M.F.; Tu, Y.; Hossen, M.I.; Lee, I.; Maida, A.S.; Hei, X. Stacked LSTM based deep recurrent neural network with kalman smoothing for blood glucose prediction. BMC Med. Inform. Decis. Mak. 2021, 21, 101. [Google Scholar]
- Mosquera-Lopez, C.; Jacobs, P.G. Incorporating glucose variability into glucose forecasting accuracy assessment using the new glucose variability impact index and the prediction consistency index: An LSTM case example. J. Diabetes Sci. Technol. 2022, 16, 7–18. [Google Scholar] [CrossRef]
- Bogue Jimenez, B.A. Exploring Noninvasive Features for Continuous Glucose Monitoring. Master’s Thesis Dissertations, University of Memphis, Memphis, TN, USA, 2021. [Google Scholar]
- Pai, P.P.; Sanki, P.K.; Sahoo, S.K.; De, A.; Bhattacharya, S.; Banerjee, S. Cloud computing-based noninvasive glucose monitoring for diabetic care. IEEE Trans. Circuits Syst. I Regul. Pap. 2017, 65, 663–676. [Google Scholar]
- Harman-Boehm, I.; Gal, A.; Raykhman, A.M.; Naidis, E.; Mayzel, Y. Noninvasive glucose monitoring: Increasing accuracy by combination of multi-technology and multi-sensors. J. Diabetes Sci. Technol. 2010, 4, 583–595. [Google Scholar] [CrossRef]
- Lin, T.; Mayzel, Y.; Bahartan, K. The accuracy of a non-invasive glucose monitoring device does not depend on clinical characteristics of people with type 2 diabetes mellitus. J. Drug Assess. 2018, 7, 1–7. [Google Scholar] [CrossRef]
- Segman, Y. Device and method for noninvasive glucose assessment. J. Diabetes Sci. Technol. 2018, 12, 1159–1168. [Google Scholar] [CrossRef] [PubMed]
- Hamdi, T.; Ali, J.B.; Di Costanzo, V.; Fnaiech, F.; Moreau, E.; Ginoux, J.M. Accurate prediction of continuous blood glucose based on support vector regression and differential evolution algorithm. Biocybern. Biomed. Eng. 2018, 38, 362–372. [Google Scholar]
- Sarker, I.H.; Faruque, M.F.; Alqahtani, H.; Kalim, A. K-nearest neighbor learning based diabetes mellitus prediction and analysis for eHealth services. EAI Endorsed Trans. Scalable Inf. Syst. 2020, 7, e4. [Google Scholar] [CrossRef]
- Sisodia, D.; Sisodia, D.S. Prediction of diabetes using classification algorithms. Procedia Comput. Sci. 2018, 132, 1578–1585. [Google Scholar] [CrossRef]
- Alexiou, S.; Dritsas, E.; Kocsis, O.; Moustakas, K.; Fakotakis, N. An Approach for Personalized Continuous Glucose Prediction with Regression Trees. In Proceedings of the 2021 6th South-East Europe Design Automation, Computer Engineering, Computer Networks and Social Media Conference (SEEDA-CECNSM), Preveza, Greece, 24–26 September 2021; IEEE: Piscataway, NJ, USA, 2021. [Google Scholar]
- Laila, U.E.; Mahboob, K.; Khan, A.W.; Khan, F.; Taekeun, W. An ensemble approach to predict early-stage diabetes risk using machine learning: An empirical study. Sensors 2022, 22, 5247. [Google Scholar] [CrossRef] [PubMed]
- Bae, T.W.; Kim, M.S.; Park, J.W.; Kwon, K.K.; Kim, K.H. Multilayer perceptron-based real-time intradialytic hypotension prediction using patient baseline information and heart-rate variation. Int. J. Environ. Res. Public Health 2022, 19, 10373. [Google Scholar] [CrossRef]
- Anand, P.K.; Shin, D.R.; Memon, M.L. Adaptive boosting based personalized glucose monitoring system (PGMS) for noninvasive blood glucose prediction with improved accuracy. Diagnostics 2020, 10, 285. [Google Scholar]
- Dubosson, F.; Ranvier, J.E.; Bromuri, S.; Calbimonte, J.P.; Ruiz, J.; Schumacher, M. D1NAMO dataset: A multi-modal dataset for research on noninvasive type 1 diabetes management. Inform. Med. Unlocked 2018, 13, 92–100. [Google Scholar]
- BioHarness 3.0 User Manual. Zephyr Technology. 2012. Available online: https://www.zephyranywhere.com/media/download/bioharness3-usermanual.pdf (accessed on 24 December 2020).
- Medtronic MiniMed Inc. iPro2 Professional Continuous Glucose Monitoring (CGM) System User Guide. 2016. Available online: https://www.medtronicdiabetes.com/sites/default/files/library/download-library/user-guides/iPro2_User_Guide-US-CA-English.pdf (accessed on 28 February 2023).


| Symbol | Unit | Definition |
|---|---|---|
| gr | mg/dL | Reference invasive blood glucose values |
| dk | mg/dL | Error in measured CBGM values |
| gm or x1 | mg/dL | Measured CBGM values |
| x2 | g | Physical activity |
| x3 | g | Peak acceleration |
| x4 | Degrees | Body posture |
| x5 | BPM | Heart rate |
| x6 | BPM | Breath rate |
| x7 | °C | Skin temperature |
| x8 | Calories | Food intake |
| y ordkpred | mg/dL | Predicted error in CBGM values |
| gp | mg/dL | Predicted CBGM value |
| Xj | mg/dL | Set of data for xj |
| Y | mg/dL | Set of data for y |
| Gr | mg/dL | Set of data for gr |
| Gm | mg/dL | Set of data for gm |
| Gp | mg/dL | Set of data for gp |
| E1 | % | Initial MARD before applying MLP |
| E2 | % | Final MARD after applying MLP |
| vij | First hidden layer weights for MLP | |
| wk | Output layer weights for MLP | |
| f(pij(t)) | Activation function in the hidden layer | |
| f(qk(t)) | Activation function in the output layer | |
| E(t) | Sum of square error | |
| zi(t) | Output of hidden layer | |
| l | Number of hidden layers | |
| i | Number of perceptrons in each hidden layer | |
| j | Number of independent variables (input) | |
| α | Learning rate | |
| m | Training momentum | |
| t | Number of iterations |
| ML Model | MARD | CEGA Plot Zone (%) | ||||
|---|---|---|---|---|---|---|
| A | B | C | D | E | ||
| SVR | 24.9 | 55 | 36 | 0 | 9 | 0 |
| KNN | 23.9 | 60 | 32 | 0 | 9 | 0 |
| DT | 17.4 | 70 | 26 | 0 | 4 | 0 |
| RF | 16.6 | 74 | 19 | 0 | 6 | 0 |
| AdaBoost | 15.6 | 79 | 17 | 0 | 4 | 0 |
| MLP | 14.4 | 83 | 15 | 0 | 2 | 0 |
| # | Range | Optimized Hyperparameters |
|---|---|---|
| 0 | <80 | l = 2, i = 10, α = 0.1, adaptive, ReLu, ADAM, t = 200, m = 0.99 |
| 1 | 81–115 | l = 4, i = 10, α = 0.1, adaptive, ReLu, ADAM, t = 500, m = 0.9 |
| 2 | 116–150 | l = 4, i = 20, α = 0.001, adaptive, ReLu, ADAM, t = 500, m = 0.99 |
| 3 | 151–180 | l = 1, i = 20, α = 0.1, invscaling, ReLu, ADAM, t = 1000, m = 0.9 |
| 4 | 181–250 | l = 4, i = 20, α = 0.1, constant, ReLu, ADAM, t = 1000, m = 0.99 |
| 5 | >250 | l = 1, i = 100, α = 0.1, adaptive, Tanh, ADAM, t = 200, m = 0.99 |
| # | RMSE | MARD (%) | Max Error (%) | Min Error (%) | ||||
|---|---|---|---|---|---|---|---|---|
| Initial | Final | Initial | Final | Initial | Final | Initial | Final | |
| 0 | 19.0 | 9.6 | 23.6 | 11.6 | 41.9 | 25.0 | −39.2 | −38.8 |
| 1 | 40.7 | 12.6 | 31.8 | 12.4 | 4.8 | 13.7 | −120 | −21.0 |
| 2 | 21.0 | 13.1 | 12.8 | 7.8 | 28.8 | 18.6 | −26.9 | −15.6 |
| 3 | 38.4 | 11.2 | 15.8 | 5.9 | 50.0 | 8.4 | −18.5 | −9.4 |
| 4 | 26.5 | 15.2 | 7.4 | 4.9 | 29.8 | 14.8 | −7.0 | −9.8 |
| 5 | 44.3 | 21.7 | 13.0 | 6.7 | 23.2 | 6.9 | −3.0 | −13.0 |
| All | 30.3 | 13.3 | 17.8 | 8.5 | 50.0 | 25.0 | −120 | −38.8 |
| Zone | Before 1 | After 2 | ||
|---|---|---|---|---|
| Number | % | Number | % | |
| A | 39 | 76 | 51 | 100 |
| B | 11 | 22 | 0 | 0 |
| C | 0 | 0 | 0 | 0 |
| D | 1 | 2 | 0 | 0 |
| E | 0 | 0 | 0 | 0 |
Disclaimer/Publisher’s Note: The statements, opinions and data contained in all publications are solely those of the individual author(s) and contributor(s) and not of MDPI and/or the editor(s). MDPI and/or the editor(s) disclaim responsibility for any injury to people or property resulting from any ideas, methods, instructions or products referred to in the content. |
© 2023 by the authors. Licensee MDPI, Basel, Switzerland. This article is an open access article distributed under the terms and conditions of the Creative Commons Attribution (CC BY) license (https://creativecommons.org/licenses/by/4.0/).
Share and Cite
Kumari, R.; Anand, P.K.; Shin, J. Improving the Accuracy of Continuous Blood Glucose Measurement Using Personalized Calibration and Machine Learning. Diagnostics 2023, 13, 2514. https://doi.org/10.3390/diagnostics13152514
Kumari R, Anand PK, Shin J. Improving the Accuracy of Continuous Blood Glucose Measurement Using Personalized Calibration and Machine Learning. Diagnostics. 2023; 13(15):2514. https://doi.org/10.3390/diagnostics13152514
Chicago/Turabian StyleKumari, Ranjita, Pradeep Kumar Anand, and Jitae Shin. 2023. "Improving the Accuracy of Continuous Blood Glucose Measurement Using Personalized Calibration and Machine Learning" Diagnostics 13, no. 15: 2514. https://doi.org/10.3390/diagnostics13152514
APA StyleKumari, R., Anand, P. K., & Shin, J. (2023). Improving the Accuracy of Continuous Blood Glucose Measurement Using Personalized Calibration and Machine Learning. Diagnostics, 13(15), 2514. https://doi.org/10.3390/diagnostics13152514