
Comparing Magnetic Resonance Fingerprinting (MRF) and the MAGiC Sequence for Simultaneous T1 and T2 Quantitative Measurements in the Female Pelvis: A Prospective Study
 , , , and
Abstract
:1. Introduction
2. Materials and Methods
2.1. Participant Patients
2.2. MRI Methods
2.3. Image Analysis
2.4. Statistical Analysis
3. Results
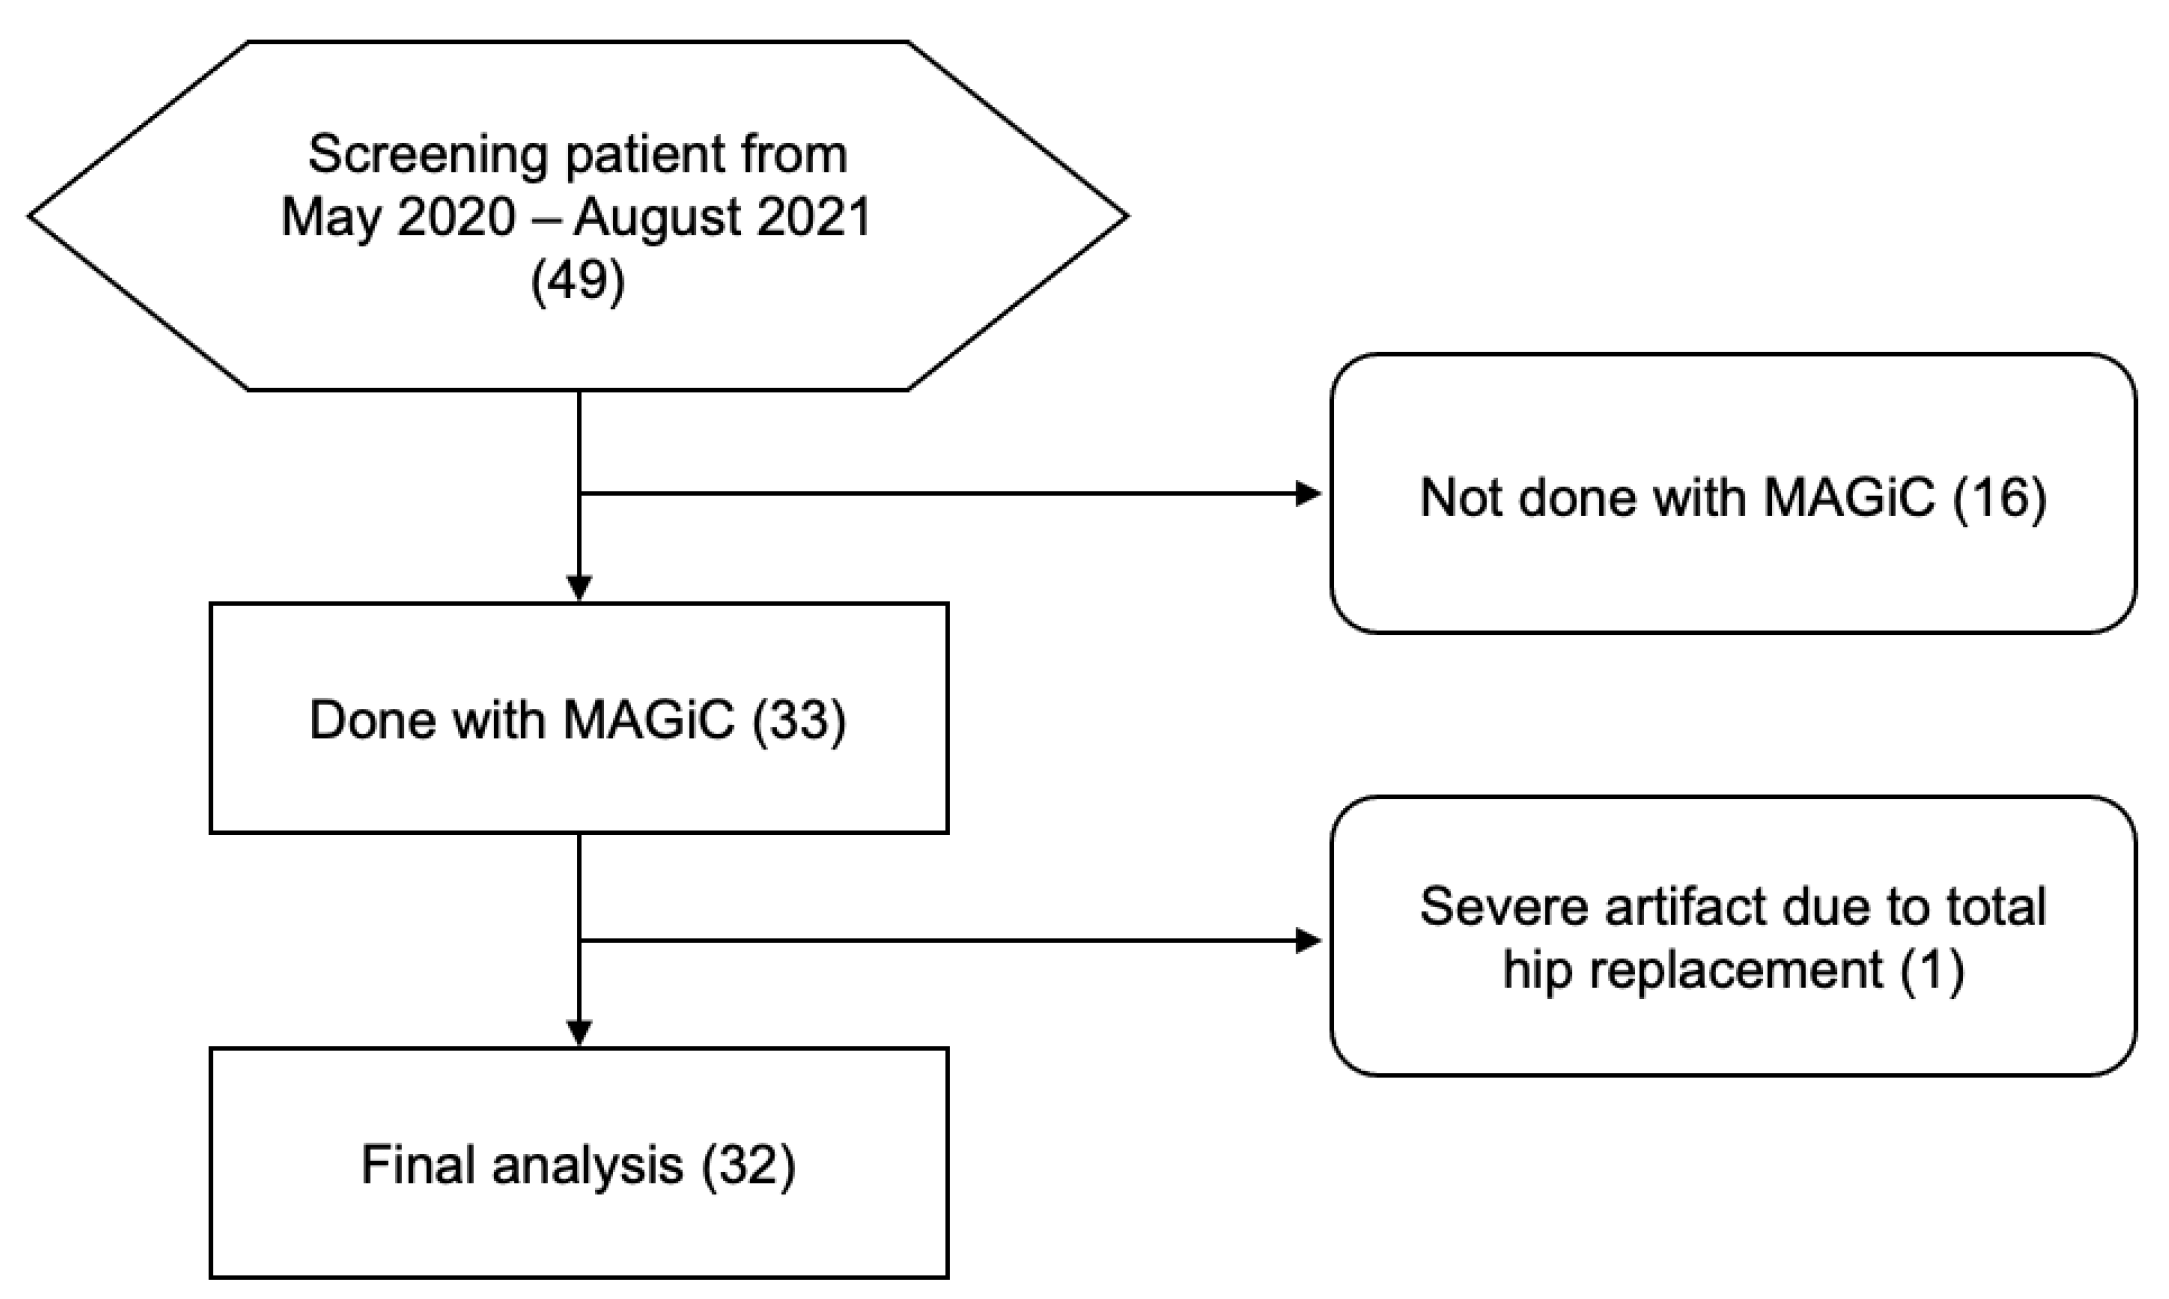
3.1. Patient Cohort
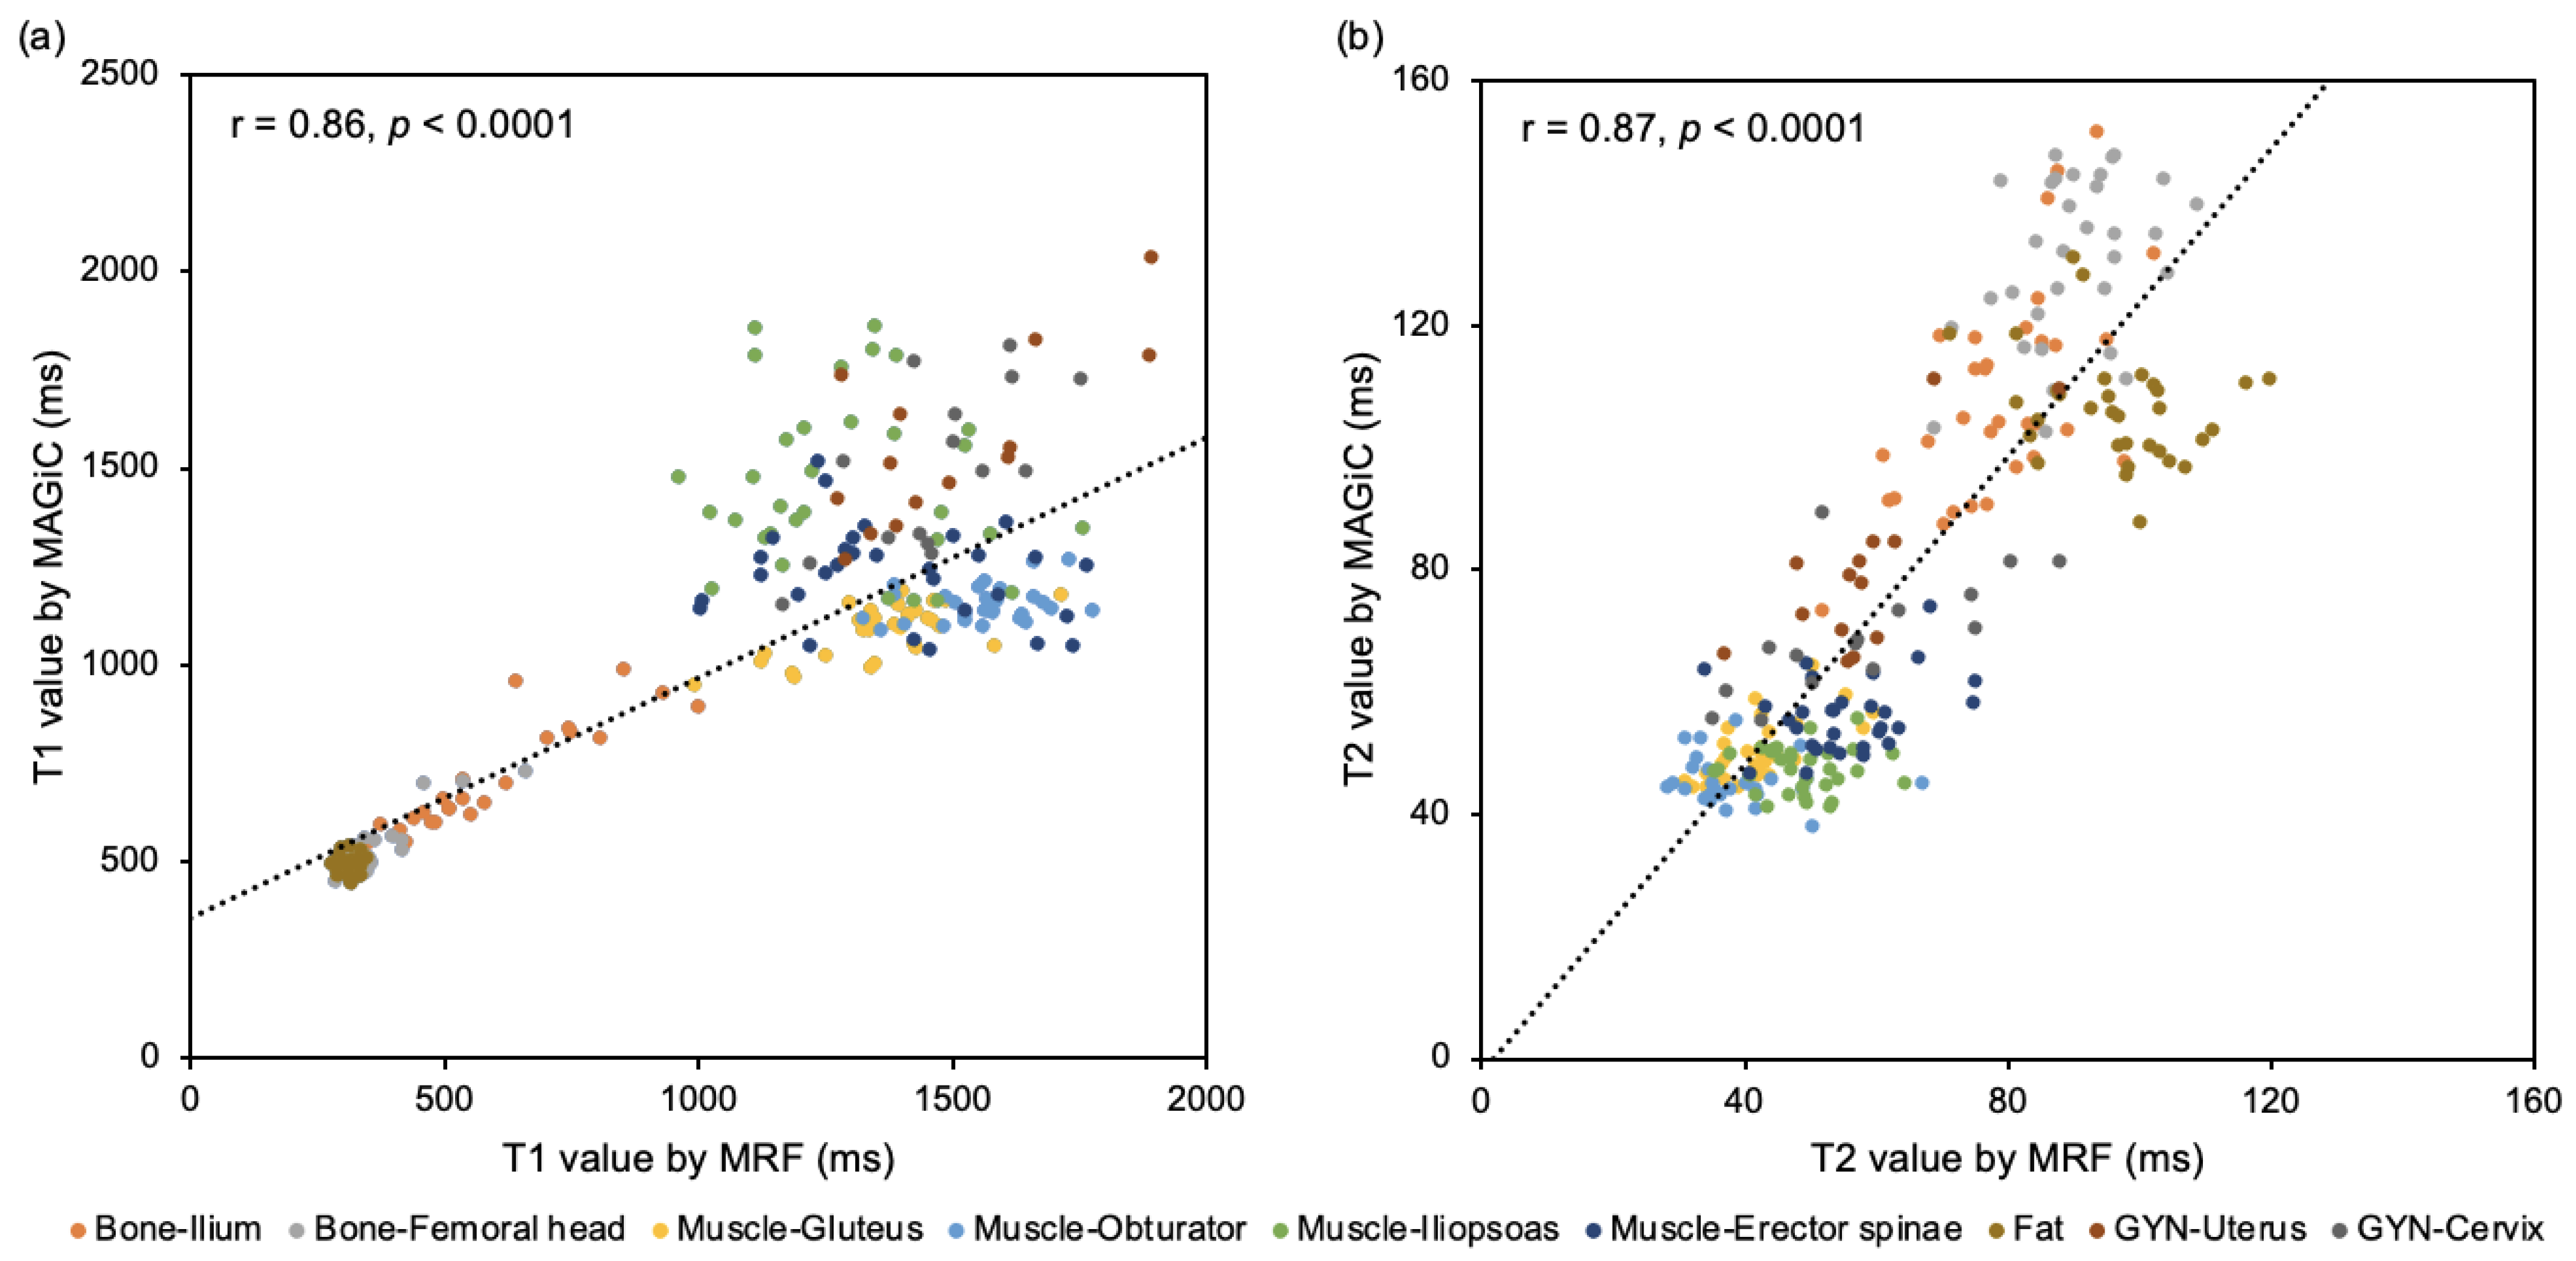
3.2. Quantitative Comparison between MRF and MAGiC
3.3. Quantitative Comparison between MRF-Derived T1 or T2 Value in Patients with and without Radiotherapy
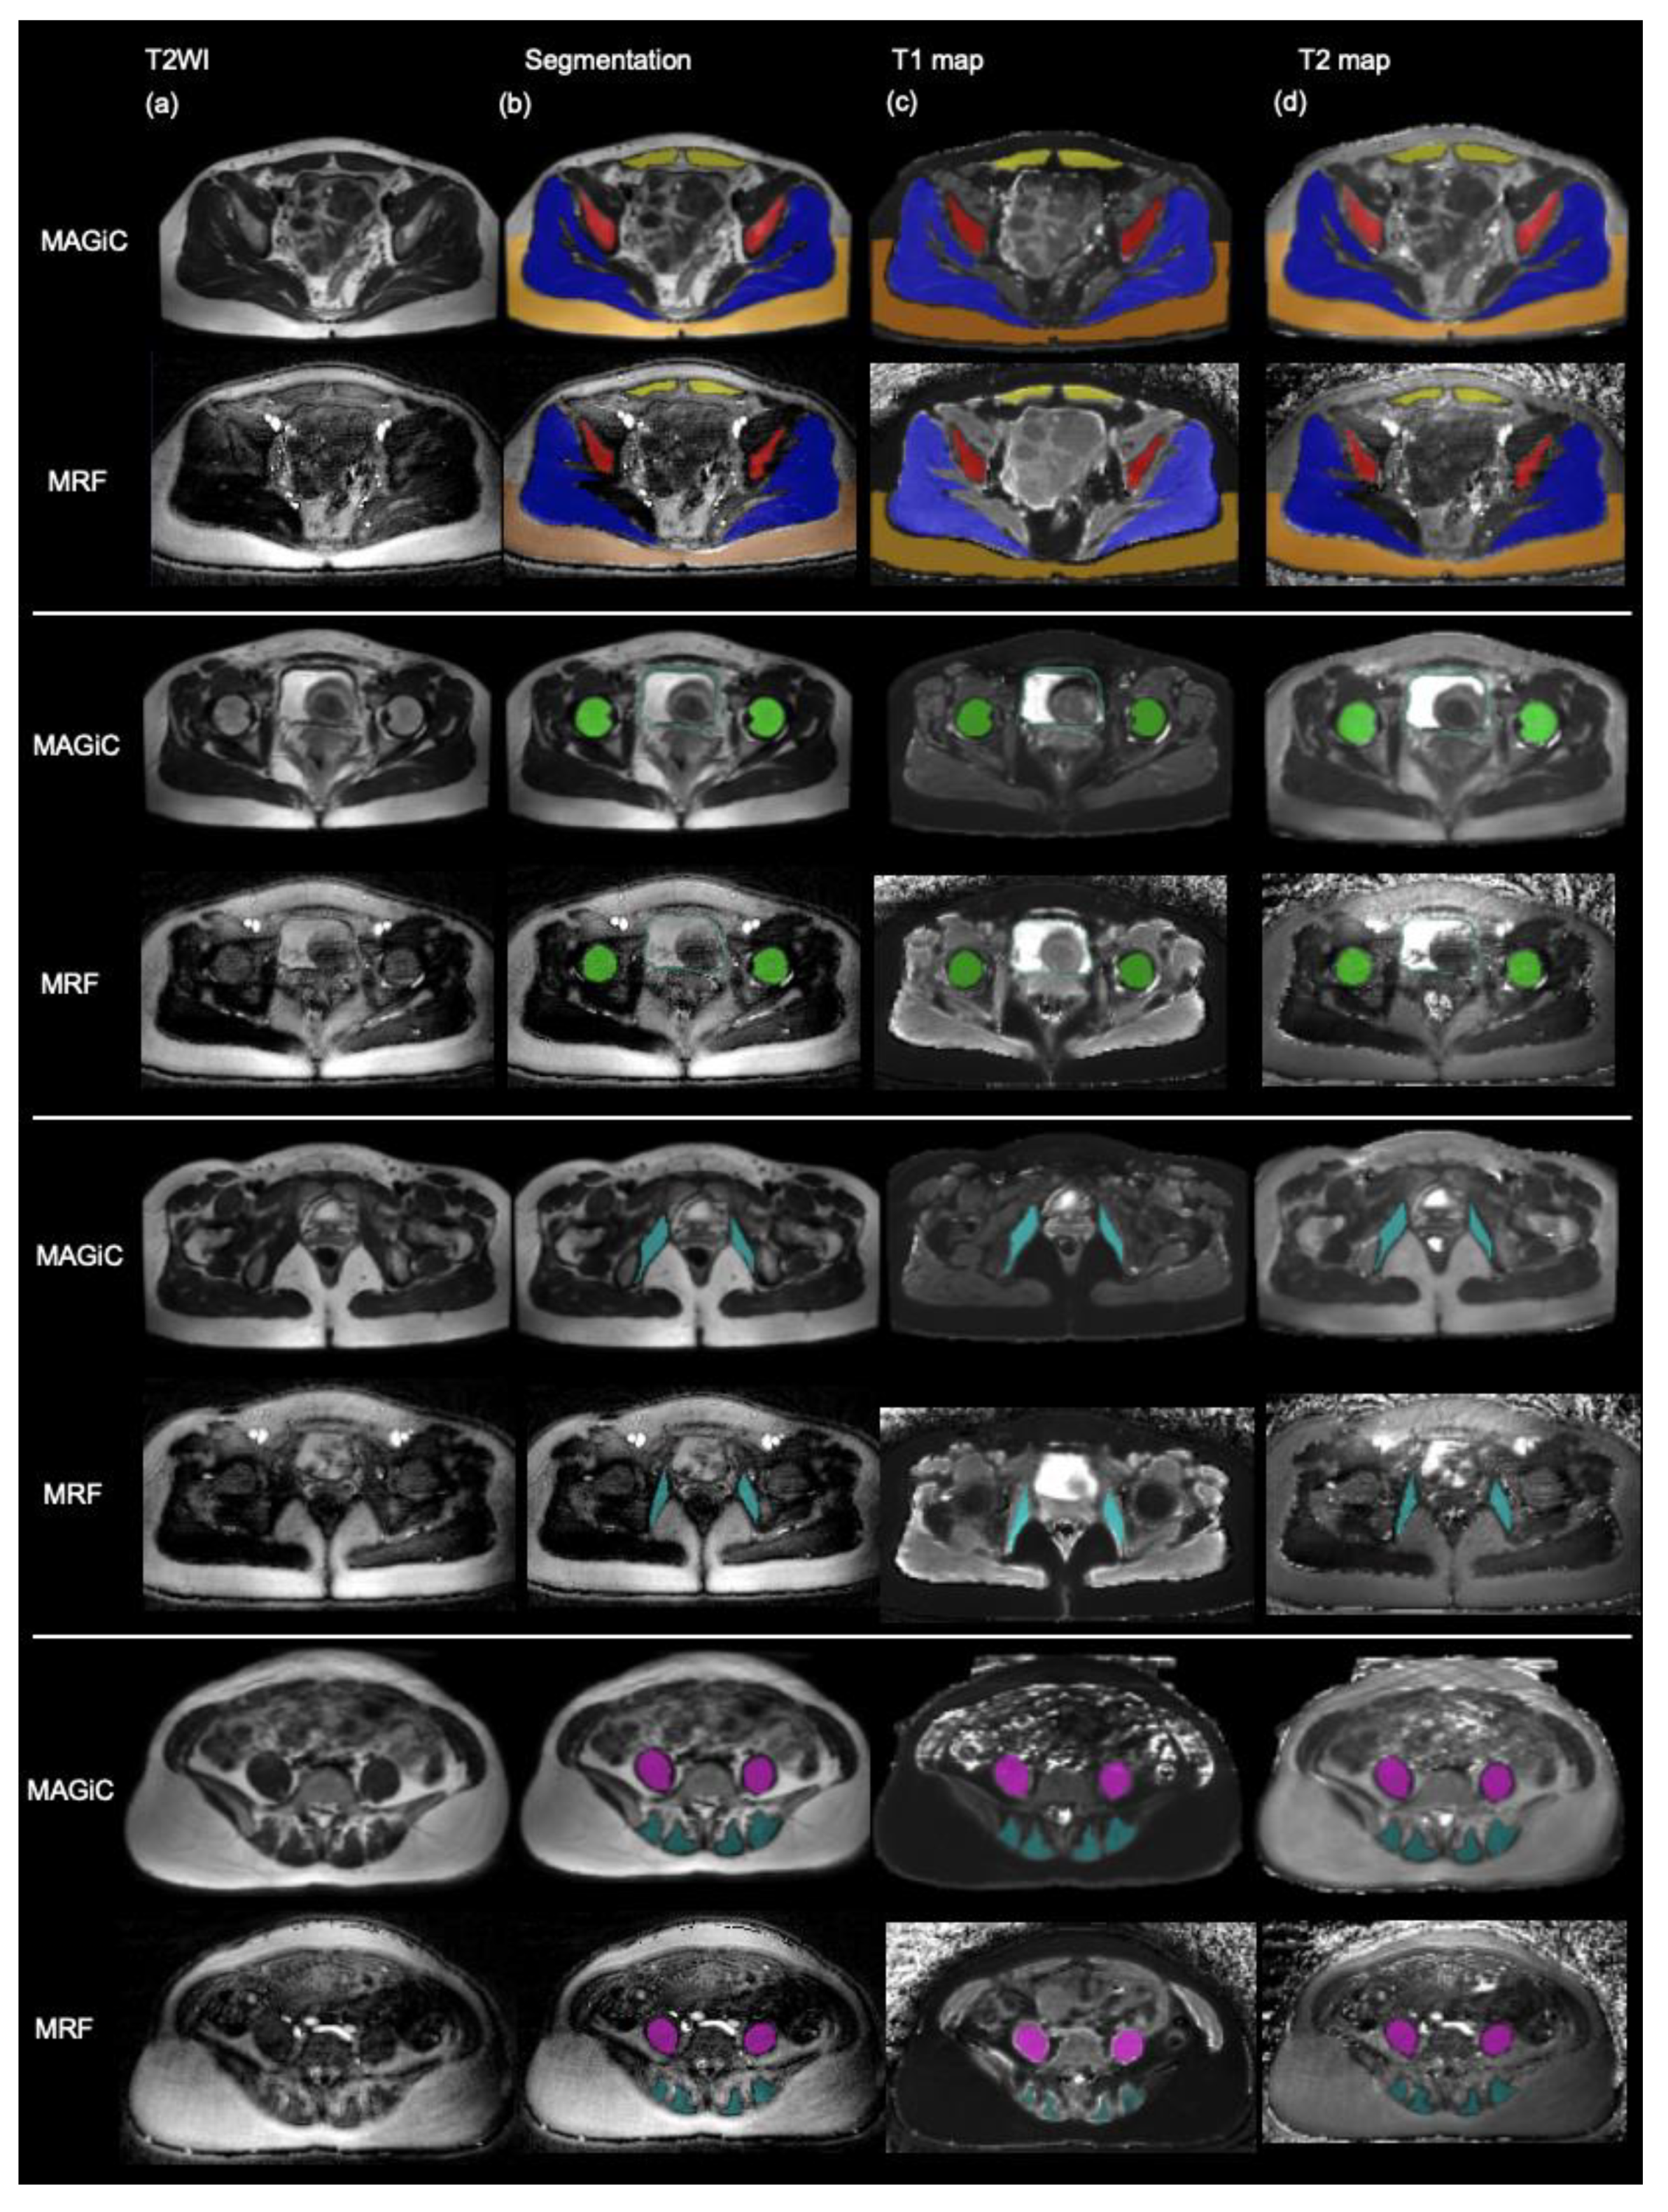
3.4. Qualitative Comparison between MRF and Conventional MRI
4. Discussion
5. Conclusions
Author Contributions
Funding
Institutional Review Board Statement
Informed Consent Statement
Data Availability Statement
Acknowledgments
Conflicts of Interest
References
- Shah, B.; Anderson, S.W.; Scalera, J.; Jara, H.; Soto, J.A. Quantitative MR imaging: Physical principles and sequence design in abdominal imaging. Radiographics 2011, 31, 867–880. [Google Scholar] [CrossRef]
- Lai, C.H.; Lin, G.; Yen, T.C.; Liu, F.Y. Molecular imaging in the management of gynecologic malignancies. Gynecol. Oncol. 2014, 135, 156–162. [Google Scholar] [CrossRef] [PubMed] [Green Version]
- Ma, D.; Gulani, V.; Seiberlich, N.; Liu, K.; Sunshine, J.L.; Duerk, J.L.; Griswold, M.A. Magnetic resonance fingerprinting. Nature 2013, 495, 187–192. [Google Scholar] [CrossRef] [PubMed] [Green Version]
- Badve, C.; Yu, A.; Dastmalchian, S.; Rogers, M.; Ma, D.; Jiang, Y.; Margevicius, S.; Pahwa, S.; Lu, Z.; Schluchter, M.; et al. MR Fingerprinting of Adult Brain Tumors: Initial Experience. AJNR Am. J. Neuroradiol. 2017, 38, 492–499. [Google Scholar] [CrossRef] [Green Version]
- Badve, C.; Yu, A.; Rogers, M.; Ma, D.; Liu, Y.; Schluchter, M.; Sunshine, J.; Griswold, M.; Gulani, V. Simultaneous T1 and T2 Brain Relaxometry in Asymptomatic Volunteers using Magnetic Resonance Fingerprinting. Tomography 2015, 1, 136–144. [Google Scholar] [CrossRef] [PubMed]
- Bai, Y.; Zhang, R.; Zhang, X.; Wang, X.; Nittka, M.; Koerzdoerfer, G.; Gong, Q.; Wang, M. Magnetic Resonance Fingerprinting for Preoperative Meningioma Consistency Prediction. Acad. Radiol. 2021. [Google Scholar] [CrossRef]
- Jaubert, O.; Arrieta, C.; Cruz, G.; Bustin, A.; Schneider, T.; Georgiopoulos, G.; Masci, P.G.; Sing-Long, C.; Botnar, R.M.; Prieto, C. Multi-parametric liver tissue characterization using MR fingerprinting: Simultaneous T1, T2, T2 *, and fat fraction mapping. Magn. Reson. Med. 2020, 84, 2625–2635. [Google Scholar] [CrossRef]
- Velasco, C.; Cruz, G.; Jaubert, O.; Lavin, B.; Botnar, R.M.; Prieto, C. Simultaneous comprehensive liver T1, T2, T 2 *, T1rho, and fat fraction characterization with MR fingerprinting. Magn. Reson. Med. 2022, 87, 1980–1991. [Google Scholar] [CrossRef]
- Hermann, I.; Chacon-Caldera, J.; Brumer, I.; Rieger, B.; Weingartner, S.; Schad, L.R.; Zollner, F.G. Magnetic resonance fingerprinting for simultaneous renal T1 and T 2 * mapping in a single breath-hold. Magn. Reson. Med. 2020, 83, 1940–1948. [Google Scholar] [CrossRef] [Green Version]
- Yu, A.C.; Badve, C.; Ponsky, L.E.; Pahwa, S.; Dastmalchian, S.; Rogers, M.; Jiang, Y.; Margevicius, S.; Schluchter, M.; Tabayoyong, W.; et al. Development of a Combined MR Fingerprinting and Diffusion Examination for Prostate Cancer. Radiology 2017, 283, 729–738. [Google Scholar] [CrossRef] [Green Version]
- Shiradkar, R.; Panda, A.; Leo, P.; Janowczyk, A.; Farre, X.; Janaki, N.; Li, L.; Pahwa, S.; Mahran, A.; Buzzy, C.; et al. T1 and T2 MR fingerprinting measurements of prostate cancer and prostatitis correlate with deep learning-derived estimates of epithelium, lumen, and stromal composition on corresponding whole mount histopathology. Eur. Radiol. 2021, 31, 1336–1346. [Google Scholar] [CrossRef]
- Panda, A.; Chen, Y.; Ropella-Panagis, K.; Ghodasara, S.; Stopchinski, M.; Seyfried, N.; Wright, K.; Seiberlich, N.; Griswold, M.; Gulani, V. Repeatability and reproducibility of 3D MR fingerprinting relaxometry measurements in normal breast tissue. J. Magn. Reson. Imaging 2019, 50, 1133–1143. [Google Scholar] [CrossRef] [PubMed]
- Hamilton, J.I.; Pahwa, S.; Adedigba, J.; Frankel, S.; O’Connor, G.; Thomas, R.; Walker, J.R.; Killinc, O.; Lo, W.C.; Batesole, J.; et al. Simultaneous Mapping of T1 and T2 Using Cardiac Magnetic Resonance Fingerprinting in a Cohort of Healthy Subjects at 1.5T. J. Magn. Reson. Imaging 2020, 52, 1044–1052. [Google Scholar] [CrossRef]
- Tanenbaum, L.N.; Tsiouris, A.J.; Johnson, A.N.; Naidich, T.P.; DeLano, M.C.; Melhem, E.R.; Quarterman, P.; Parameswaran, S.X.; Shankaranarayanan, A.; Goyen, M.; et al. Synthetic MRI for Clinical Neuroimaging: Results of the Magnetic Resonance Image Compilation (MAGiC) Prospective, Multicenter, Multireader Trial. AJNR Am. J. Neuroradiol. 2017, 38, 1103–1110. [Google Scholar] [CrossRef] [Green Version]
- Jung, Y.; Gho, S.M.; Back, S.N.; Ha, T.; Kang, D.K.; Kim, T.H. The feasibility of synthetic MRI in breast cancer patients: Comparison of T(2) relaxation time with multiecho spin echo T(2) mapping method. Br. J. Radiol. 2018, 92, 20180479. [Google Scholar] [CrossRef] [PubMed]
- Zhang, W.; Zhu, J.; Xu, X.; Fan, G. Synthetic MRI of the lumbar spine at 3.0 T: Feasibility and image quality comparison with conventional MRI. Acta Radiol. 2020, 61, 461–470. [Google Scholar] [CrossRef]
- Lian, S.; Liu, H.; Meng, T.; Ma, L.; Zeng, W.; Xie, C. Quantitative synthetic MRI for predicting locally advanced rectal cancer response to neoadjuvant chemoradiotherapy. Eur. Radiol. 2023, 33, 1737–1745. [Google Scholar] [CrossRef]
- Jiang, Y.; Ma, D.; Seiberlich, N.; Gulani, V.; Griswold, M.A. MR fingerprinting using fast imaging with steady state precession (FISP) with spiral readout. Magn. Reson. Med. 2015, 74, 1621–1631. [Google Scholar] [CrossRef] [Green Version]
- Buonincontri, G.; Sawiak, S.J. MR fingerprinting with simultaneous B1 estimation. Magn. Reson. Med. 2016, 76, 1127–1135. [Google Scholar] [CrossRef] [Green Version]
- Yushkevich, P.A.; Piven, J.; Hazlett, H.C.; Smith, R.G.; Ho, S.; Gee, J.C.; Gerig, G. User-guided 3D active contour segmentation of anatomical structures: Significantly improved efficiency and reliability. Neuroimage 2006, 31, 1116–1128. [Google Scholar] [CrossRef] [PubMed] [Green Version]
- Serrao, E.M.; Kessler, D.A.; Carmo, B.; Beer, L.; Brindle, K.M.; Buonincontri, G.; Gallagher, F.A.; Gilbert, F.J.; Godfrey, E.; Graves, M.J.; et al. Magnetic resonance fingerprinting of the pancreas at 1.5 T and 3.0 T. Sci. Rep. 2020, 10, 17563. [Google Scholar] [CrossRef] [PubMed]
- Tanaka, Y.O.; Nishida, M.; Tsunoda, H.; Okamoto, Y.; Yoshikawa, H. Smooth muscle tumors of uncertain malignant potential and leiomyosarcomas of the uterus: MR findings. J. Magn. Reson. Imaging 2004, 20, 998–1007. [Google Scholar] [CrossRef]
- Schober, P.; Boer, C.; Schwarte, L.A. Correlation Coefficients: Appropriate Use and Interpretation. Anesth. Analg. 2018, 126, 1763–1768. [Google Scholar] [CrossRef] [PubMed]
- Fleiss, J.L.; Levin, B.A.; Paik, M.C. Statistical Methods for Rates and Proportions, 3rd ed.; J. Wiley: Hoboken, NJ, USA, 2003. [Google Scholar]
- Kaggie, J.D.; Deen, S.; Kessler, D.A.; McLean, M.A.; Buonincontri, G.; Schulte, R.F.; Addley, H.; Sala, E.; Brenton, J.; Graves, M.J.; et al. Feasibility of Quantitative Magnetic Resonance Fingerprinting in Ovarian Tumors for T1 and T2 Mapping in a PET/MR Setting. IEEE Trans. Radiat. Plasma Med. Sci. 2019, 3, 509–515. [Google Scholar] [CrossRef]
- Stout, J.N.; Liao, C.; Gagoski, B.; Turk, E.A.; Feldman, H.A.; Bibbo, C.; Barth, W.H., Jr.; Shainker, S.A.; Wald, L.L.; Grant, P.E.; et al. Quantitative T1 and T2 mapping by magnetic resonance fingerprinting (MRF) of the placenta before and after maternal hyperoxia. Placenta 2021, 114, 124–132. [Google Scholar] [CrossRef]
- Wang, M.; Perucho, J.A.U.; Cao, P.; Vardhanabhuti, V.; Cui, D.; Wang, Y.; Khong, P.L.; Hui, E.S.; Lee, E.Y.P. Repeatability of MR fingerprinting in normal cervix and utility in cervical carcinoma. Quant. Imaging Med. Surg. 2021, 11, 3990–4003. [Google Scholar] [CrossRef]
- Malek, M.; Rahmani, M.; Seyyed Ebrahimi, S.M.; Tabibian, E.; Alidoosti, A.; Rahimifar, P.; Akhavan, S.; Gandomkar, Z. Investigating the diagnostic value of quantitative parameters based on T2-weighted and contrast-enhanced MRI with psoas muscle and outer myometrium as internal references for differentiating uterine sarcomas from leiomyomas at 3T MRI. Cancer Imaging 2019, 19, 20. [Google Scholar] [CrossRef] [Green Version]
- Verpalen, I.M.; Anneveldt, K.J.; Vos, P.C.; Edens, M.A.; Heijman, E.; Nijholt, I.M.; Dijkstra, J.R.; Schutte, J.M.; Franx, A.; Bartels, L.W.; et al. Use of multiparametric MRI to characterize uterine fibroid tissue types. MAGMA 2020, 33, 689–700. [Google Scholar] [CrossRef]
- Yalcin, A.; Gultekin, M.H.; Erdogan, A.; Cankaya, B.Y. Signal Abnormalities of the Bladder Wall Detected by Native T1 mapping in Patients with Overactive Bladder. NMR Biomed. 2022, e4748. [Google Scholar] [CrossRef]
- Endo, K.; Takahata, M.; Sugimori, H.; Yamada, S.; Tadano, S.; Wang, J.; Todoh, M.; Ito, Y.M.; Takahashi, D.; Kudo, K.; et al. Magnetic resonance imaging T1 and T2 mapping provide complementary information on the bone mineral density regarding cancellous bone strength in the femoral head of postmenopausal women with osteoarthritis. Clin. Biomech. 2019, 65, 13–18. [Google Scholar] [CrossRef]
- Ma, D.; Jiang, Y.; Chen, Y.; McGivney, D.; Mehta, B.; Gulani, V.; Griswold, M. Fast 3D magnetic resonance fingerprinting for a whole-brain coverage. Magn. Reson. Med. 2018, 79, 2190–2197. [Google Scholar] [CrossRef]
- Asslander, J.; Glaser, S.J.; Hennig, J. Pseudo Steady-State Free Precession for MR-Fingerprinting. Magn. Reson. Med. 2017, 77, 1151–1161. [Google Scholar] [CrossRef]
- Gloor, M.; Scheffler, K.; Bieri, O. Quantitative magnetization transfer imaging using balanced SSFP. Magn. Reson. Med. 2008, 60, 691–700. [Google Scholar] [CrossRef]
- Ma, D.; Coppo, S.; Chen, Y.; McGivney, D.F.; Jiang, Y.; Pahwa, S.; Gulani, V.; Griswold, M.A. Slice profile and B1 corrections in 2D magnetic resonance fingerprinting. Magn. Reson. Med. 2017, 78, 1781–1789. [Google Scholar] [CrossRef]
- Afzali, M.; Mueller, L.; Sakaie, K.; Hu, S.; Chen, Y.; Szczepankiewicz, F.; Griswold, M.A.; Jones, D.K.; Ma, D. MR Fingerprinting with b-Tensor Encoding for Simultaneous Quantification of Relaxation and Diffusion in a Single Scan. Magn. Reson. Med. 2022, 88, 2043–2057. [Google Scholar] [CrossRef]
- Chen, Y.; Jiang, Y.; Pahwa, S.; Ma, D.; Lu, L.; Twieg, M.D.; Wright, K.L.; Seiberlich, N.; Griswold, M.A.; Gulani, V. MR Fingerprinting for Rapid Quantitative Abdominal Imaging. Radiology 2016, 279, 278–286. [Google Scholar] [CrossRef] [Green Version]


| Variable | Patients |
|---|---|
| Number | 32 (100) |
| Age, median (y) a | 49 (26–83) |
| 18–49 | 15 (47) |
| 50~ | 17 (53) |
| Cancer | |
| Cervical | 5 (16) |
| Endometrial | 11 (34) |
| Ovarian | 4 (13) |
| Leiomyoma | 10 (31) |
| Others | 2 (6) |
| Operative status | |
| Pre-operative | 15 (47) |
| Post-operative | 17 (53) |
| Radiotherapy | |
| With | 5 (16) |
| Without | 27 (84) |
| Tissue | T1 Value | T2 Value | ||||||
|---|---|---|---|---|---|---|---|---|
| MRF (ms) | MAGiC (ms) | r | p = | MRF (ms) | MAGiC (ms) | r | p = | |
| Bone–Ilium | 525.2 [± 188.4] | 662.2 [± 145.8] | 0.93 | <0.001 | 79.13 [± 11.0] | 108.5 [± 7.6] | 0.63 | <0.001 |
| Bone–Femoral head | 353.2 [± 74.9] | 526.2 [± 67.0] | 0.89 | <0.001 | 90.3 [± 9.3] | 130.7 [± 13.5] | 0.39 | 0.027 |
| Muscle–Gluteus | 1359.0 [± 135.4] | 1088.3 [± 64.9] | 0.65 | <0.001 | 41.7 [± 7.0] | 50.3 [± 4.9] | 0.68 | <0.001 |
| Muscle–Obturator | 1563.9 [± 113.9] | 1156.4 [± 45.5] | 0.30 | 0.115 | 39.1 [± 8.1] | 45.5 [± 3.8] | 0.16 | 0.404 |
| Muscle–Iliopsoas | 1283.4 [± 194.7] | 1467.0 [± 212.9] | 0.13 | 0.491 | 49.0 [± 7.1] | 47.4 [± 3.6] | 0.02 | 0.931 |
| Muscle–Erector spinae | 1351.9 [± 252.2] | 1227.4 [± 121.2] | 0.22 | 0.243 | 56.9 [± 11.2] | 56.6 [± 6.3] | 0.27 | 0.150 |
| Fat | 313.5 [± 17.1] | 492.8 [± 22.4] | <0.01 | 0.998 | 97.1 [± 10.8] | 106.3 [± 9.1] | 0.29 | 0.103 |
| GYN–Uterus | 1484.1 [± 119.0] | 1522.1 [± 245.1] | 0.74 | 0.003 | 62.2 [± 18.5] | 77.1 [± 15.7] | 0.76 | 0.001 |
| GYN–Cervix | 1455.9 [± 163.1] | 1495.8 [± 217.5] | 0.69 | 0.004 | 57.1 [± 15.6] | 68.7 [± 11.4] | 0.68 | 0.005 |
| Radiotherapy | p = | ||
|---|---|---|---|
| With (ms) | Without (ms) | ||
| Bone–Ilium | |||
| T1 | 322.2 [± 16.0] | 561.0 [± 185.2] | <0.001 * |
| T2 | 83.7 [± 5.2] | 78.1 [± 11.8] | 0.097 |
| Bone–Femoral head | |||
| T1 | 316.9 [± 12.0] | 361.0 [± 80.7] | 0.034 * |
| T2 | 87.7 [± 5.7] | 90.3 [± 9.6] | 0.251 |
| Bone overall | |||
| T1 | 319.5 [± 13.6] | 461.0 [± 173.8] | <0.001 * |
| T2 | 85.7 [± 5.6] | 84.2 [± 12.3] | 0.352 |
Disclaimer/Publisher’s Note: The statements, opinions and data contained in all publications are solely those of the individual author(s) and contributor(s) and not of MDPI and/or the editor(s). MDPI and/or the editor(s) disclaim responsibility for any injury to people or property resulting from any ideas, methods, instructions or products referred to in the content. |
© 2023 by the authors. Licensee MDPI, Basel, Switzerland. This article is an open access article distributed under the terms and conditions of the Creative Commons Attribution (CC BY) license (https://creativecommons.org/licenses/by/4.0/).
Share and Cite
Huang, B.-S.; Hsieh, C.-Y.; Chai, W.-Y.; Lin, Y.; Huang, Y.-L.; Lu, K.-Y.; Chiang, H.-J.; Schulte, R.F.; Lin, C.-Y.E.; Lin, G. Comparing Magnetic Resonance Fingerprinting (MRF) and the MAGiC Sequence for Simultaneous T1 and T2 Quantitative Measurements in the Female Pelvis: A Prospective Study. Diagnostics 2023, 13, 2147. https://doi.org/10.3390/diagnostics13132147
Huang B-S, Hsieh C-Y, Chai W-Y, Lin Y, Huang Y-L, Lu K-Y, Chiang H-J, Schulte RF, Lin C-YE, Lin G. Comparing Magnetic Resonance Fingerprinting (MRF) and the MAGiC Sequence for Simultaneous T1 and T2 Quantitative Measurements in the Female Pelvis: A Prospective Study. Diagnostics. 2023; 13(13):2147. https://doi.org/10.3390/diagnostics13132147
Chicago/Turabian StyleHuang, Bo-Syuan, Ching-Yi Hsieh, Wen-Yen Chai, Yenpo Lin, Yen-Ling Huang, Kuan-Ying Lu, Hsin-Ju Chiang, Rolf F. Schulte, Chien-Yuan Eddy Lin, and Gigin Lin. 2023. "Comparing Magnetic Resonance Fingerprinting (MRF) and the MAGiC Sequence for Simultaneous T1 and T2 Quantitative Measurements in the Female Pelvis: A Prospective Study" Diagnostics 13, no. 13: 2147. https://doi.org/10.3390/diagnostics13132147
APA StyleHuang, B.-S., Hsieh, C.-Y., Chai, W.-Y., Lin, Y., Huang, Y.-L., Lu, K.-Y., Chiang, H.-J., Schulte, R. F., Lin, C.-Y. E., & Lin, G. (2023). Comparing Magnetic Resonance Fingerprinting (MRF) and the MAGiC Sequence for Simultaneous T1 and T2 Quantitative Measurements in the Female Pelvis: A Prospective Study. Diagnostics, 13(13), 2147. https://doi.org/10.3390/diagnostics13132147