Communication

Cell-Free Methylated PTGER4 and SHOX2 Plasma DNA as a Biomarker for Therapy Monitoring and Prognosis in Advanced Stage NSCLC Patients

1
Klinik für Innere Medizin—Schwerpunkt Pneumologie und Schlafmedizin, DRK Kliniken Berlin/Mitte, 13359 Berlin, Germany
2
Lungenarztpraxis Berlin-Reinickendorf, 13403 Berlin, Germany
3
Department für Innere Medizin, Universitätsklinikum Halle/Saale, 06120 Halle (Saale), Germany
4
Lungenklinik Heckeshorn, Helios Klinikum Emil von Behring, 14165 Berlin, Germany
5
Klinik und Poliklinik für Innere Medizin B, Universitätsmedizin Greifswald, 17475 Greifswald, Germany
6
Gemeinschaftskrankenhaus Havelhöhe, Pneumologie und Lungenkrebszentrum, 14089 Berlin, Germany
7
Department of Computer Science, Ostfalia University, 38302 Wolfenbüttel, Germany
8
Biostatistics, Helmholtz Centre for Infection Research, 38124 Braunschweig, Germany
9
Munich Biomarker Research Center, Institute of Laboratory Medicine, German Heart Centre, Technical University Munich, Lazarettstraße 36, 80636 Munich, Germany
*
Author to whom correspondence should be addressed.
These authors contributed equally to this work.
Diagnostics 2023, 13(13), 2131; https://doi.org/10.3390/diagnostics13132131
Submission received: 3 May 2023 / Revised: 13 June 2023 / Accepted: 15 June 2023 / Published: 21 June 2023

Abstract

:
Notwithstanding some improvement in the earlier detection of patients with lung cancer, most of them still present with a late-stage disease at the time of diagnosis. Next to the most frequently utilized factors affecting the prognosis of lung cancer patients (stage, performance, and age), the recent application of biomarkers obtained by liquid profiling has gained more acceptance. In our study, we aimed to answer these questions: (i) Is the quantification of free-circulating methylated PTGER4 and SHOX2 plasma DNA a useful method for therapy monitoring, and is this also possible for patients treated with different therapy regimens? (ii) Is this approach possible when blood-drawing tubes, which allow for a delayed processing of blood samples, are utilized? Baseline values for mPTGER4 and mSHOX2 do not allow for clear discrimination between different response groups. In contrast, the combination of the methylation values for both genes shows a clear difference between responders vs. non-responders at the time of re-staging. Furthermore, blood drawing into tubes stabilizing the sample allows researchers more flexibility.

1. Introduction

The last years have seen some progress in the treatment of advanced-stage lung cancer patients, specifically, for patients harboring druggable genetic alterations like activating EGFR gene mutations, mutations in BRAF and MET genes, and variants of ALK and ROS1 [1]. This applies to non-small cell (NSCLC) and small-cell (SCLC) lung cancer patients who are treated with targeted or immunotherapeutic agents [2]. Notwithstanding, different resistance mechanisms are in place, leading to a therapy failure for these novel treatments as well. This underscores the need for searching out and establishing reliable tumor markers for therapy monitoring.
Recently, liquid profiling has emerged as a promising tool for a longitudinal analysis of response to a given therapy, particularly because it can be performed in real time. After the first description of cell-free nucleic acids detectable in human plasma and serum [3], the group of Anker and Stroun laid the foundation for the current interest in this method [4,5,6,7]. Currently, several methods exist for the analysis of extracellular nucleic acids quantitatively and qualitatively with whole genome sequencing, exon sequencing, genome-wide methylation analysis, and others [8,9].
An easy, fast, and straightforward approach is the quantitative measurement of a smaller gene panel of methylated sequences in cell-free DNA with real-time PCR. The usefulness of this approach to demonstrate a relationship between the presence of methylated plasma DNA and therapy response in lung cancer patients has been shown in several papers [10,11,12,13].
Together with Wang et al. [14], our group was among the first in demonstrating the potential of a longitudinal analysis of methylated, cell-free DNA for therapy monitoring. We demonstrated a good correlation between the longitudinal measurement of extracellular plasma mSHOX2 DNA and the response to cytotoxic treatment in late-stage lung cancer patients [15]. In this study we used EDTA tubes processed within one to two hours after blood drawing. Previous studies had demonstrated that EDTA blood should not be stored for more than six hours because longer storage leads to cell lysis and a ”contamination“ of cell-free DNA with genomic DNA. To allow for an extended storage of blood tubes (including shipping to a remote laboratory), it is necessary to stabilize the blood sample with special additives. Several companies have developed specially designed blood-drawing tubes such as the PAXgene Blood ccfDNA tubes that received market approval in 2016.
In this investigation, we extended our former study as we included more patients from several hospitals (multicenter) and utilized PAXgene Blood ccfDNA tubes (Qiagen, Hilden, Germany) for blood sampling. Furthermore, we employed a modified marker panel for the detection of methylated cell-free circulating DNA in the plasma of late-stage lung cancer patients undergoing systemic therapy.

2. Materials and Methods

2.1. Patients

In total, 96 patients, among them 78 from the DRK Kliniken Berlin-Mitte and 18 from the other participating clinics, with late-stage histologically confirmed non-small cell lung cancer (NSCLC) who received a first-line treatment consisting of chemo +/− radiotherapy, anti-EGFR therapy, or immunotherapy were enrolled prospectively in the present study. The patients were consecutively referred to the participating clinics for diagnosis and treatment from August 2016 to October 2020. The study was approved by the Ethics Committee of the University Halle/Saale on 19 June 2014 (Reference number 2014-52), and all patients gave informed written consent prior to inclusion in the study. This study was set up as a multicentric trial, and most patients were treated at the DRK Kliniken Berlin-Mitte (78 patients). The blood of these 78 patients was drawn in PAXgene Blood ccfDNA tubes (Qiagen, Hilden, Germany), while EDTA tubes were used for the 18 patients treated in the other participating centers. For the evaluation of the therapy response, the data from all 96 patients were used, while the analysis for the prognostic relevance was limited to the 78 patients enrolled at the DRK Kliniken Berlin-Mitte.
The details of the clinical data of the patients are shown in Table 1. The re-staging was done after the first two therapy cycles of chemo +/− radiotherapy or 6–8 weeks after start of therapy, respectively. The response evaluation was carried out according to the RECIST v1.1 criteria.

2.2. Plasma Preparation

Blood was taken from the patients at the time of diagnosis (pre-treatment) and thereafter in intervals of 7 to 10 days until the time of re-staging. The samples obtained at the DRK Kliniken Berlin-Mitte were collected in PAXgene Blood ccfDNA tubes and shipped by regular mail or transported via courier (at room temperature in both instances) to the laboratory in Halle/Saale. The range of delay in processing the blood was 0 to 8 days (median 5 days). The blood was spun once at 1500 rpm for 10 min, and the supernatant was carefully transferred into a new tube and re-centrifuged at 3500 rpm for 10 min. The cell-free plasma was aliquoted and stored at −80 °C before processing. The blood samples drawn at the other three participating study centers were processed as described above, and the plasma was stored at −80 °C and shipped on dry ice to the laboratory in Halle/Saale.

2.3. DNA Isolation, Purification, and Bisulfite Conversion

We employed the Epi Bis-kits (Epigenomics, Berlin, Germany) according to the protocol of the manufacturer with an initial input of 3.5 mL plasma for the isolation, purification, and bisulfite treatment of the DNA. For the detection and quantification of the gene products, a PCR kit developed by Epigenomics for the simultaneous quantification of mSHOX2, mPTGER4, and ß-actin as a reference gene [16] was employed. All samples were measured in triplicate. The quantification of mSHOX2, mPTGER4 and ß-actin (as the reference gene for the calculation) was performed according to Kneip et al. [17]. The quantification of the cell-free methylated sequences was performed after all prospectively collected plasma samples were complete, i.e., making this analysis an observational study.

2.4. Statistical Analysis

The distribution of PTGER4 and SHOX2 methylation values is demonstrated as boxplots for all response groups at the time of first radiological staging; the values were partial remission (PR), stable disease (SD), and progressive disease (PD). The prediction of the therapy response was evaluated in two settings: For detection of progression, PD was compared with SD + PR, while for detection of response, PR was compared with SD + PD. The power of discrimination was calculated as an area under the curve (AUC) of the receiver-operating characteristic (ROC) curves, and sensitivity was recorded at 90% specificity. The significance of statistical differences was calculated by the Wilcoxon-test. For the combination of markers, decision-tree models were established utilizing appropriate cutoffs and marker order, and probabilities for therapy response were shown at every node. Survival was evaluated by the Kaplan-Meier-curves and log-rank test. All comparisons were performed two-sided, and statistical significance was set at p < 0.05. Data analysis was performed using R (version 4.2.0; https://www.R-project.org, (accessed on 15 February 2023), free software foundation, Inc., Strongsville, OH, USA).

3. Results

All patients received serial sample collections during the treatment, with an average of 6 samples per patient. Treatment was performed for a minimum of 6 months; the median follow-up of the patients was 22 months, with a range from 6 to 58 months. We evaluated the biomarker values before the start of therapy and at re-staging exams; the relative changes were considered and correlated with the radiological response to treatment and the survival of the patients.
Of those 96 patients with advanced NSCLC, 83 received regular chemo +/− radiotherapy, 9 received a combination of chemo- and immunotherapy, and 4 patients, immuntherapy only. Thirty-four patients responded well to the treatment at staging exams and showed partial remission (PR), 15 had stable disease (SD), and 33 had progressive disease (PD). The therapy response of 14 patients is unknown. The median overall survival (OS) was 8.5 months with a range from 1 to 37 months (Table 1).

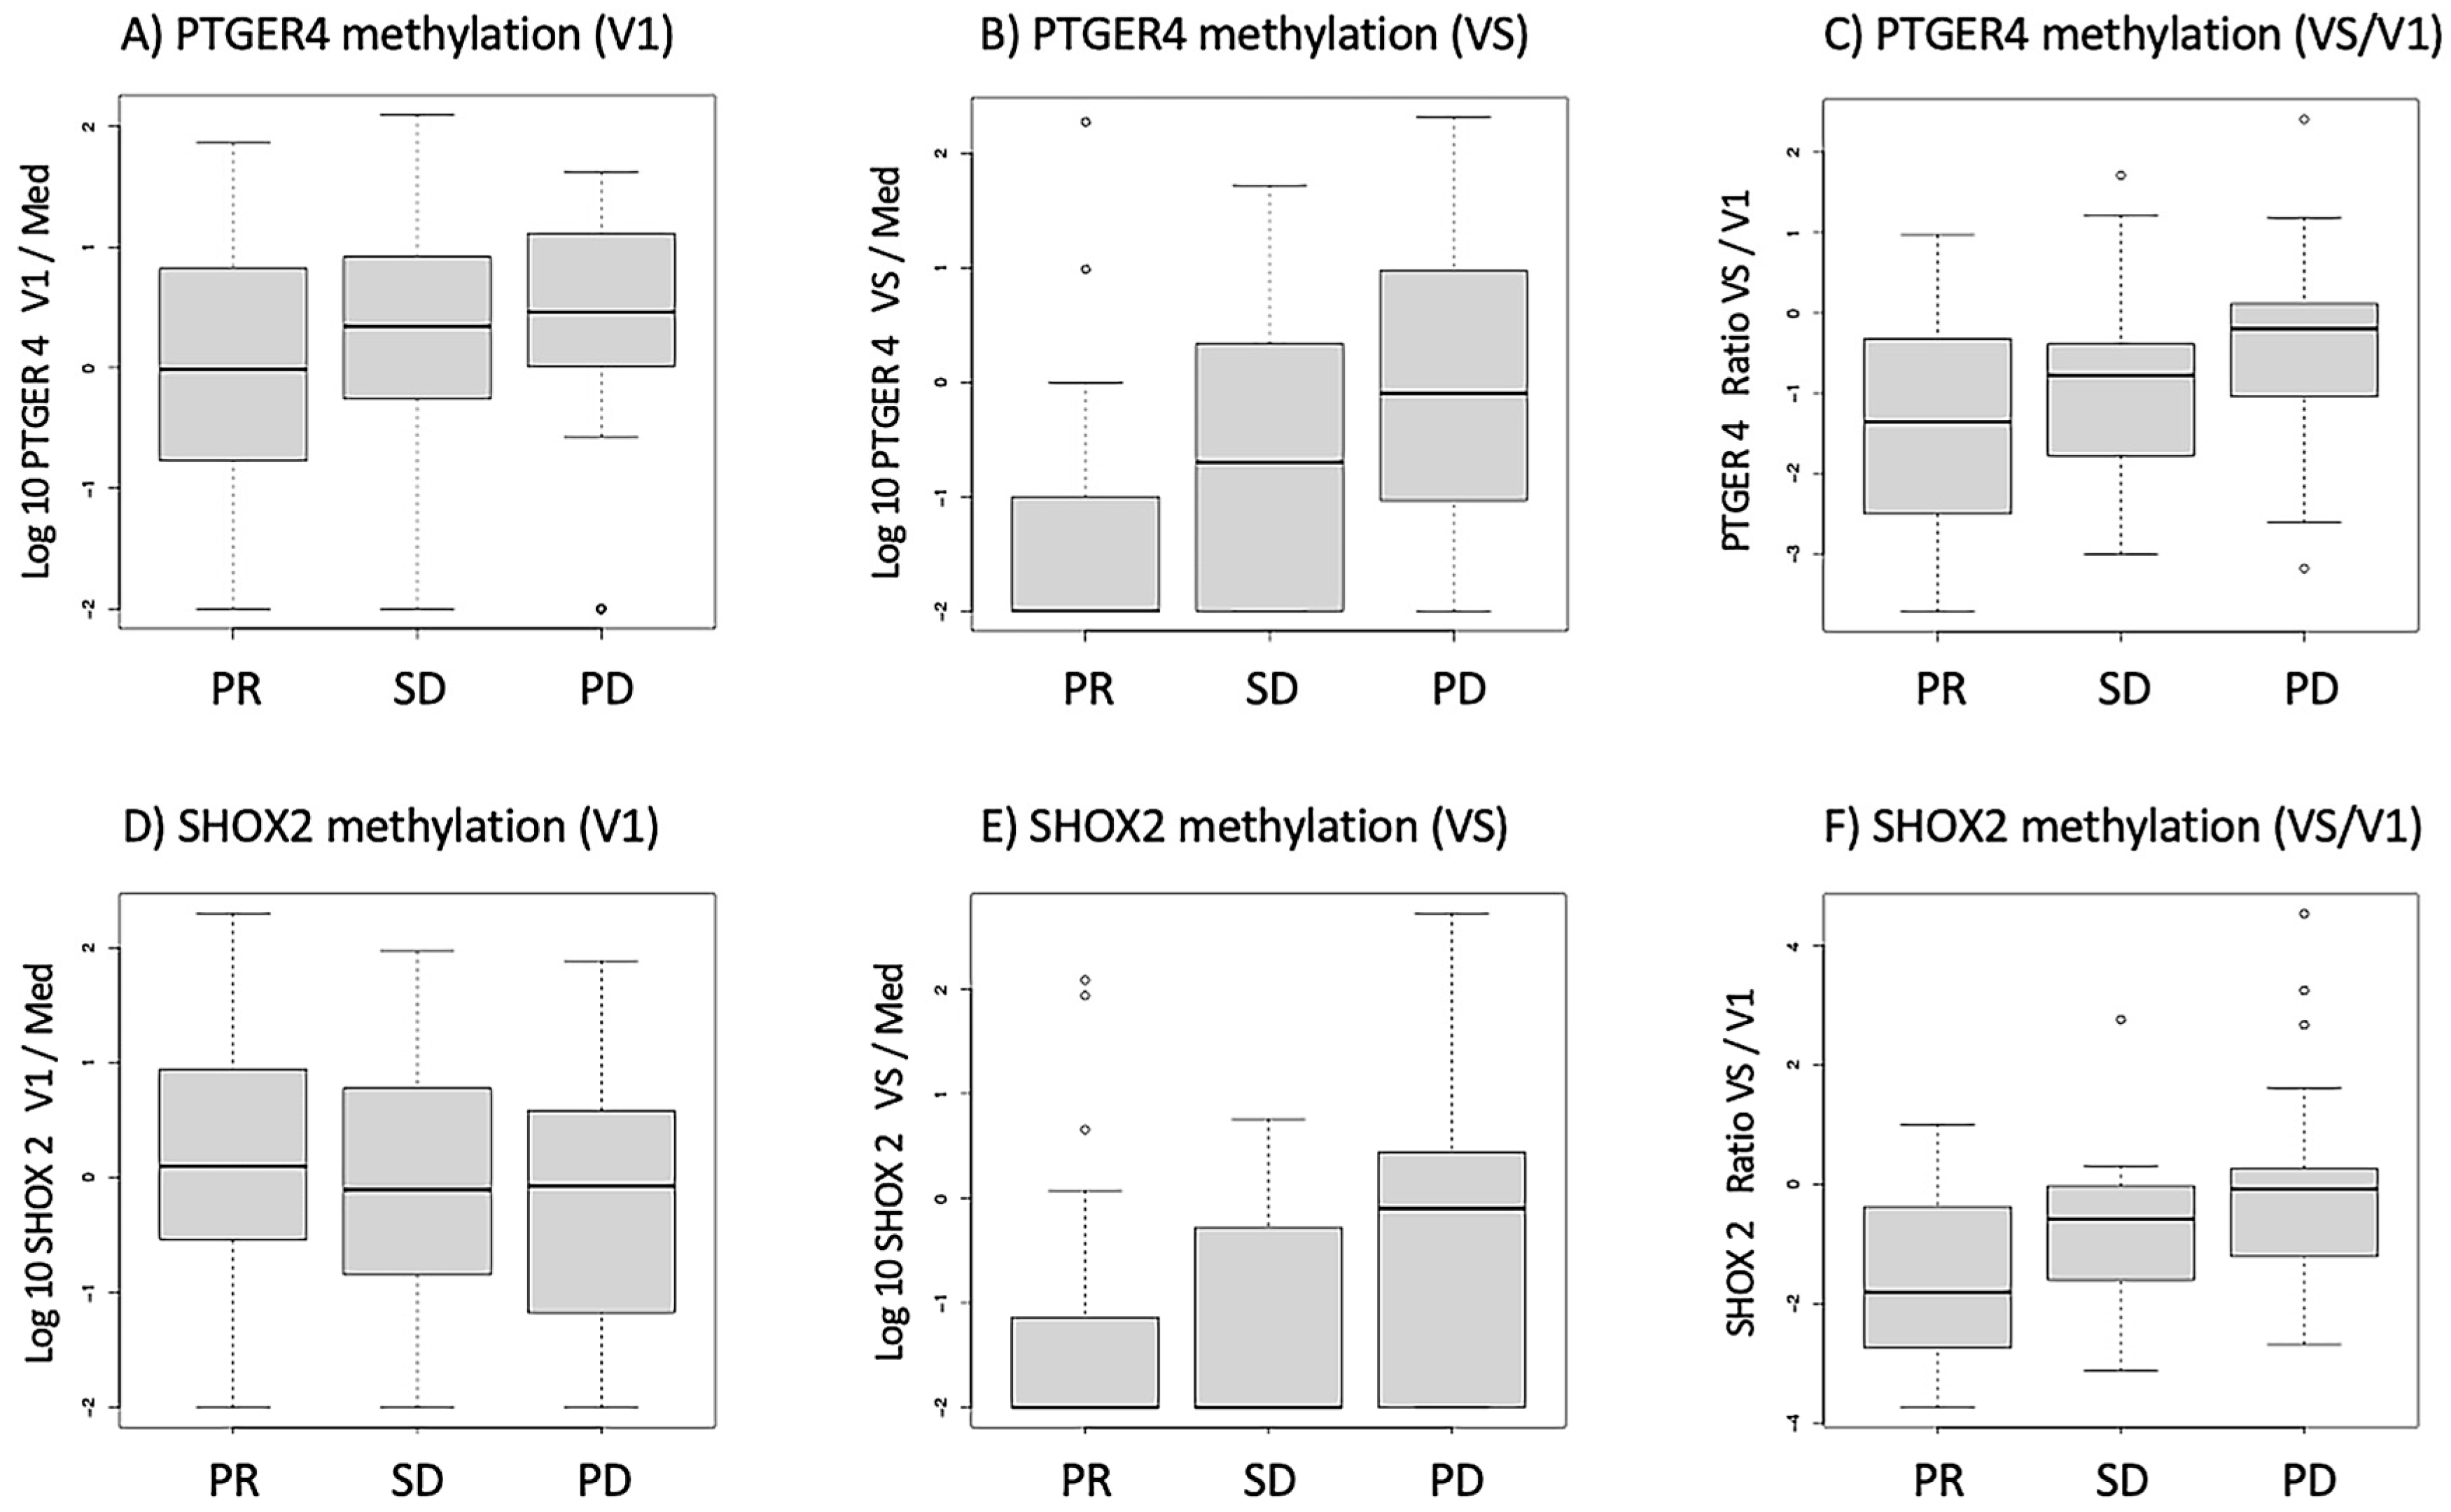
3.1. Distribution of mPTGER4 and mSHOX2 Methylation Values in Response Groups

Before the start of therapy (V1), patients who showed partial remission had slightly lower methylated PTGER4 levels than SD and PD patients, but this difference was not statistically significant. However, at the time of the re-staging exam (VS), mPTGER4 levels of PR patients were significantly lower than those of SD and even more than those of PD patients—and the ratio of mPTGER4 VS/V1 was also significantly different among the response groups (Figure 1A–C). Similar tendencies were observed for SHOX2 methylation with no significant differences between response groups for the pre-therapeutic assessment and lower values for PR and SD than for PD patients. In contrast, comparable to the mPTGER4 values, the differences seen for the ratio of mSHOX2 at VS and VS/V1 values reached a low significance level (Figure 1D–F).

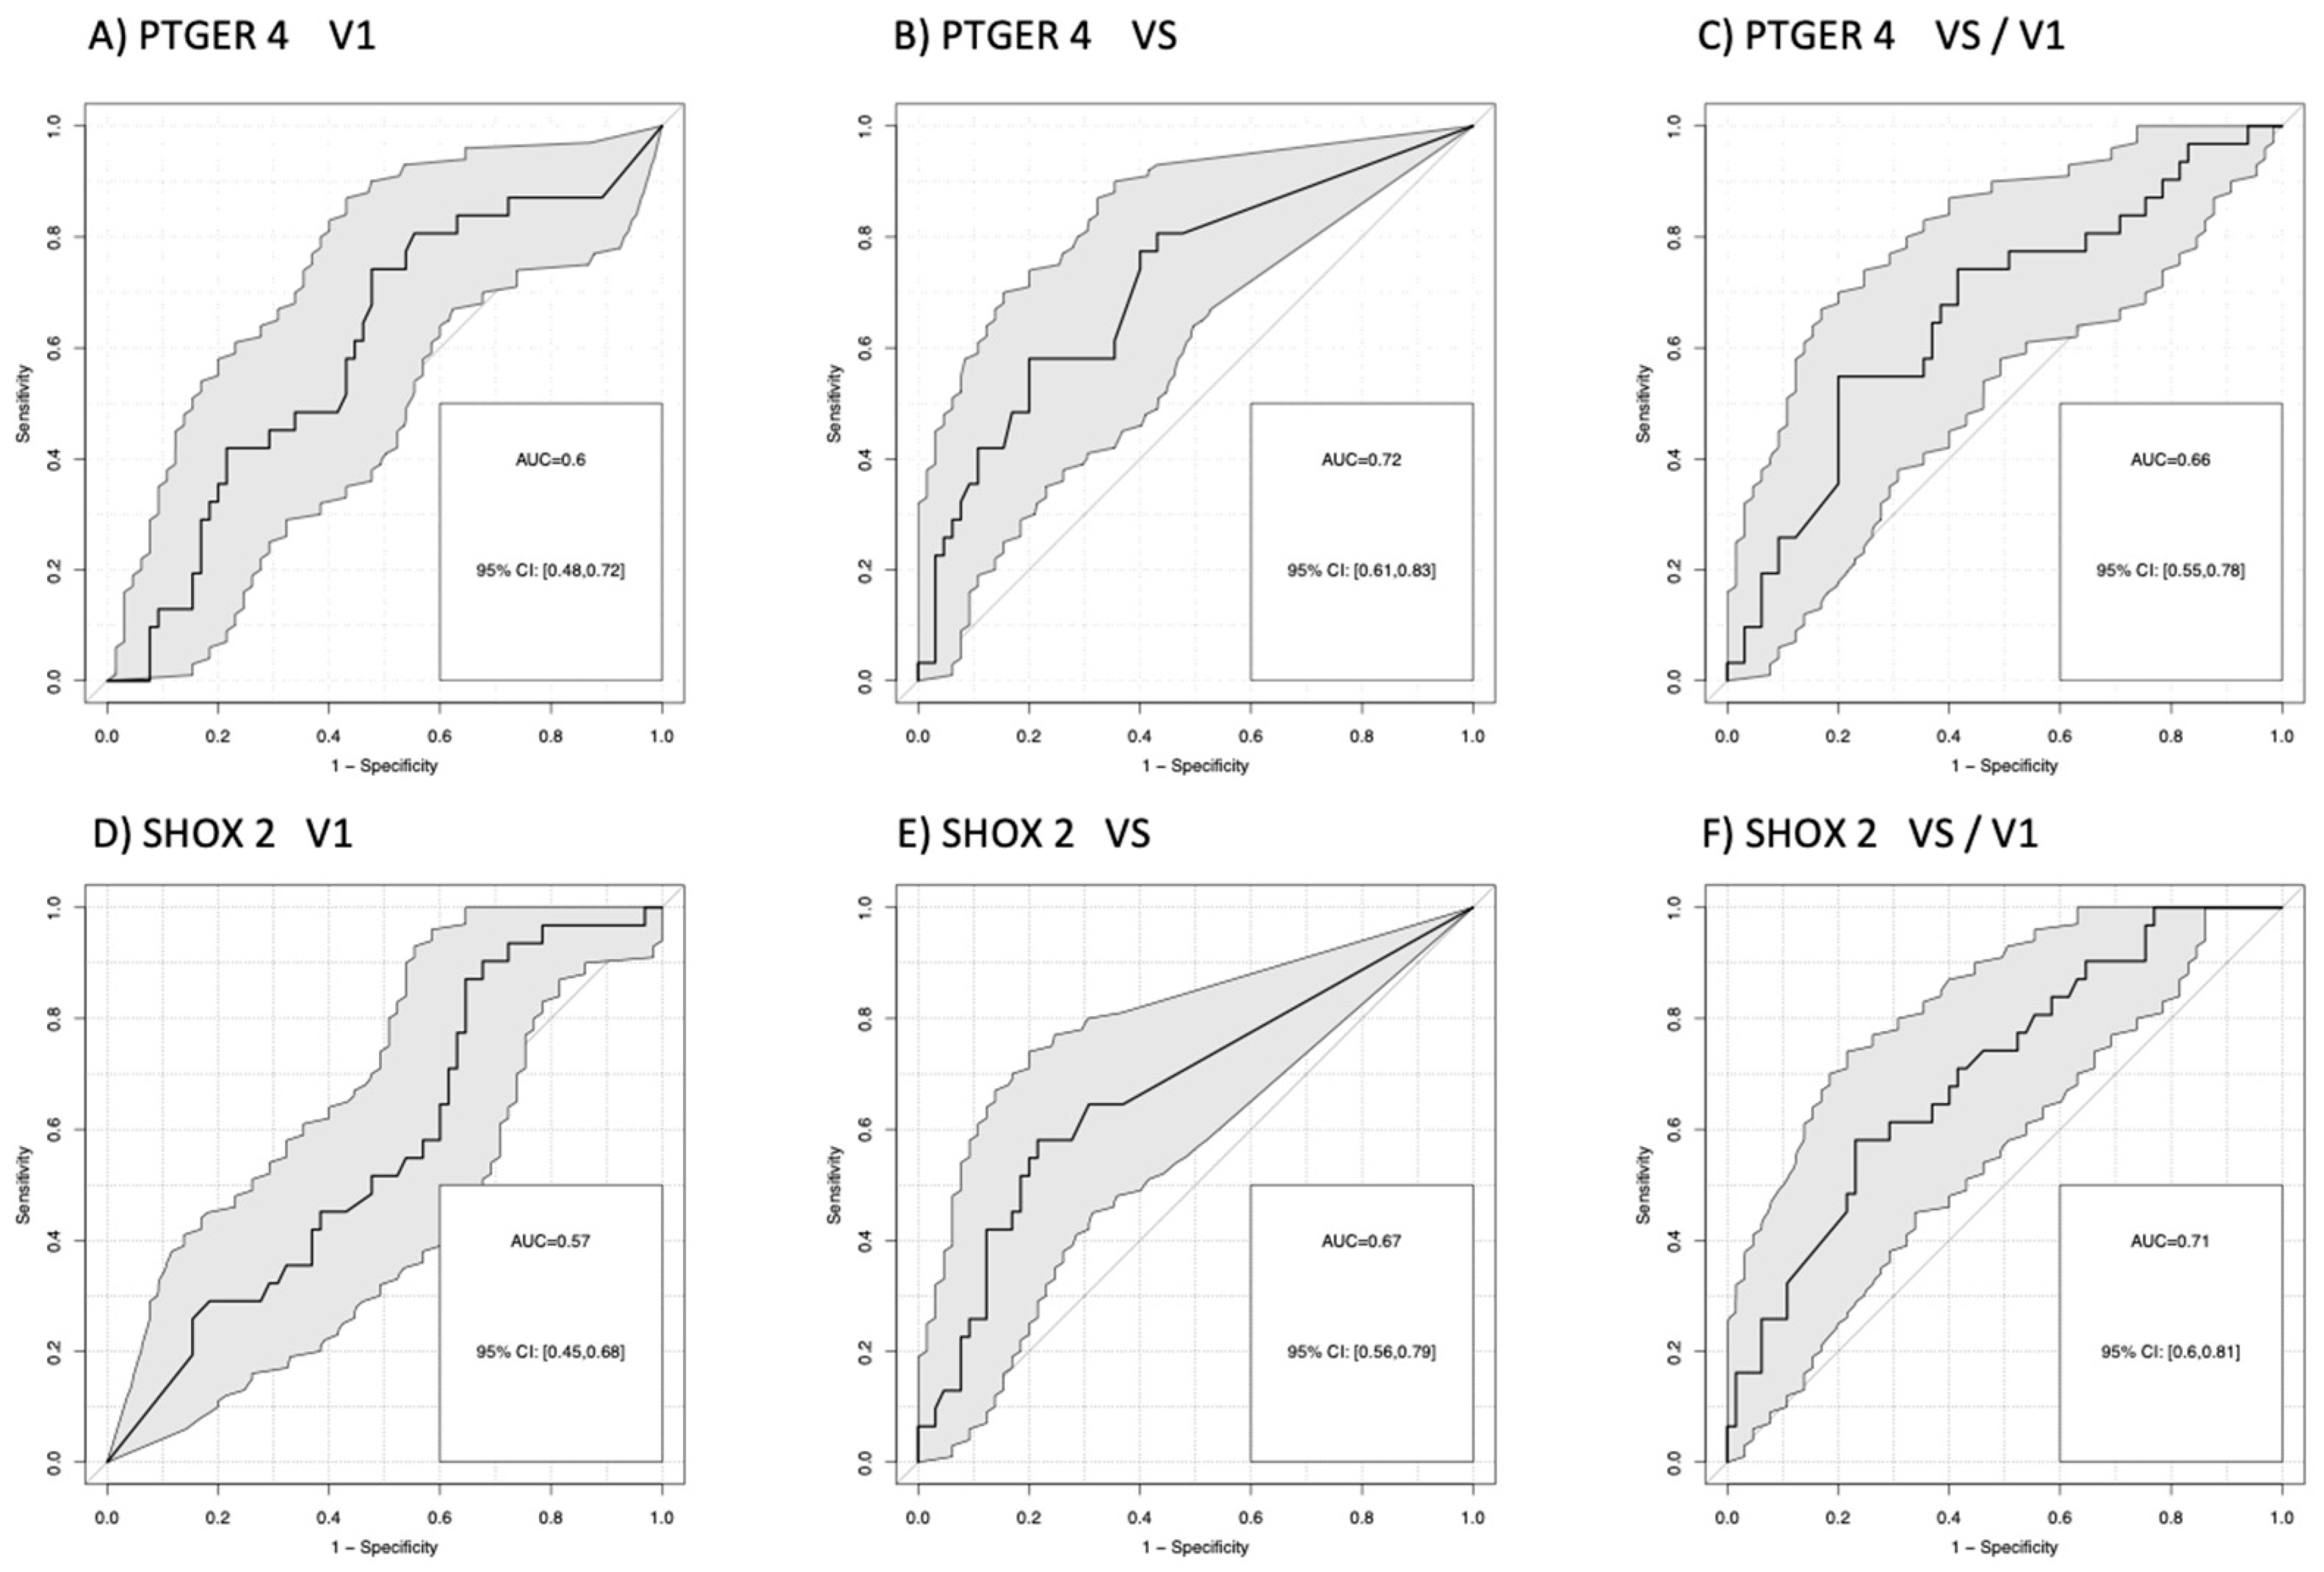
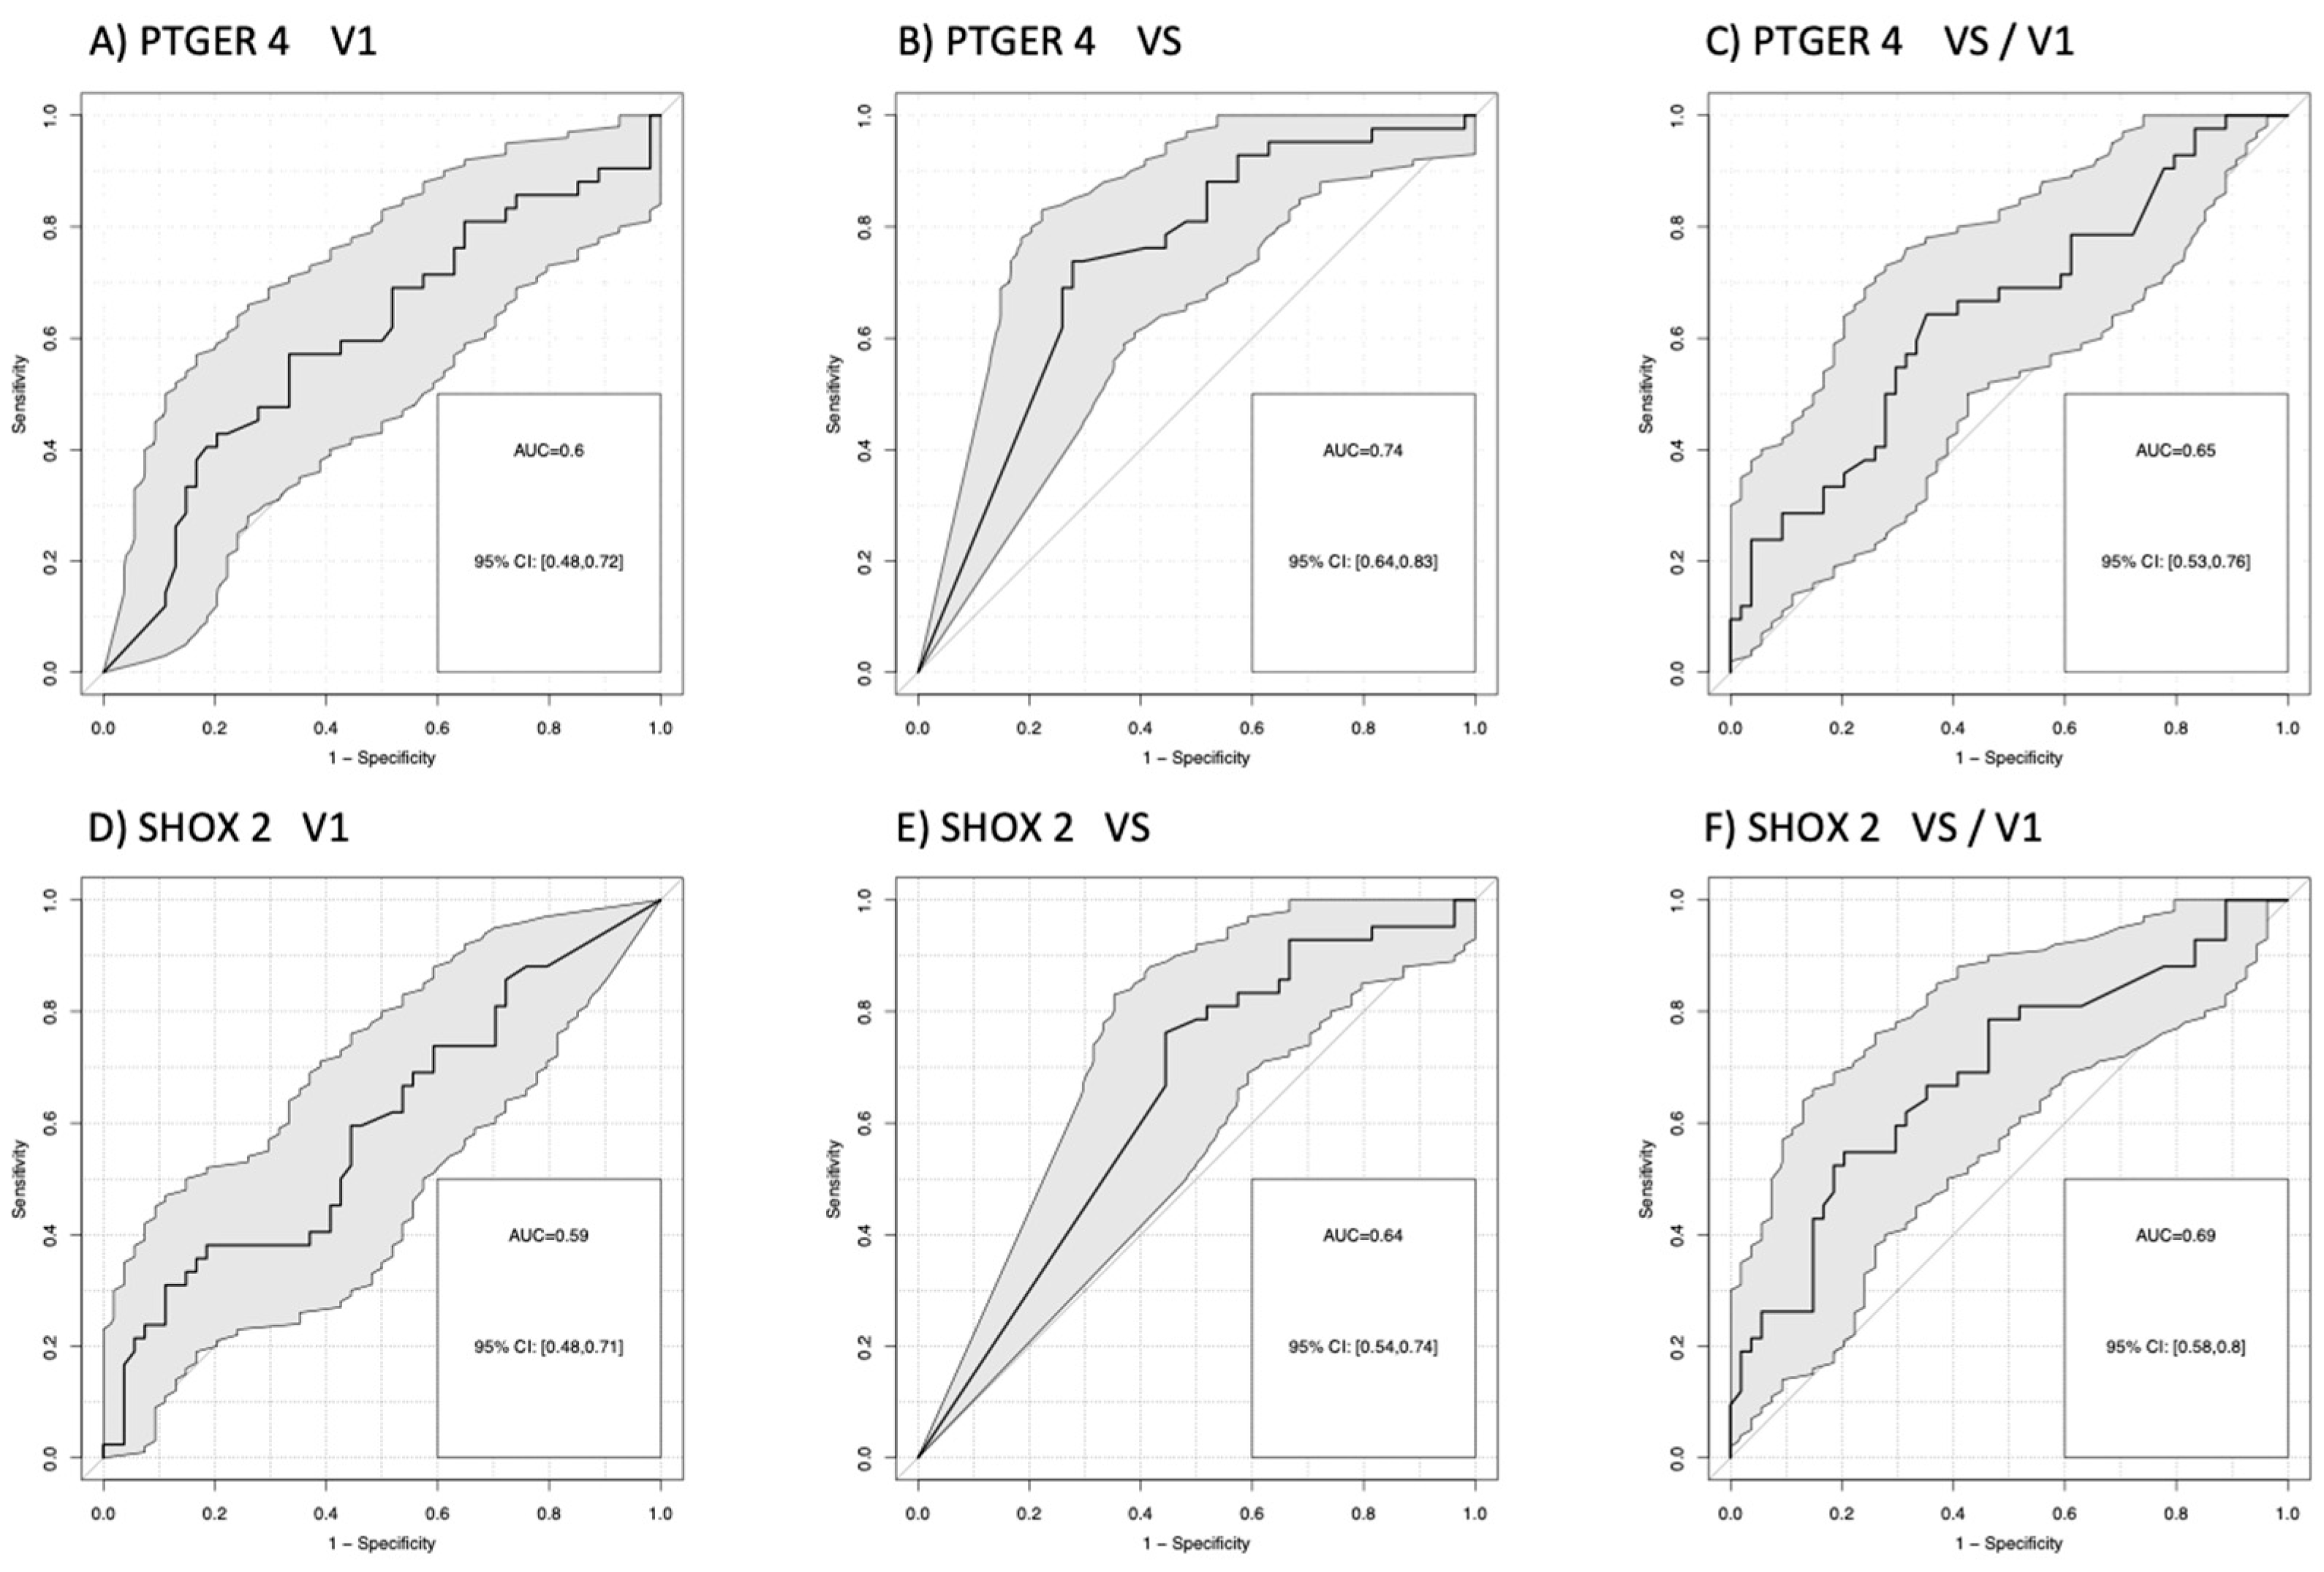
3.2. Differentiation of Patients According to Their Therapy Response

The power of discrimination between patients with good and poor response to therapy was objectified by areas under the curves (AUC) of receiver operating characteristic (ROC) curves.
For the comparison of patients with progression (PD) versus no progression (PR + SD), AUCs for mPTGER4 were AUC = 0.60 (V1), AUC = 0.72 (VS), and AUC = 0.66 (VS/V1) and for mSHOX2 AUC = 0.57 (V1), AUC = 0.67 (VS), and AUC = 0.71 (VS/V1). Sensitivities for the detection of progression at a 90% specificity vs. non-progression were for mPTGER4 0.60 at V1, 0.74 at VS and 0.65 for VS/V1 (Figure 2A–C) as well as for mSHOX2 0,59 at V1, 0.64 at VS and 0.69 for VS/V1, respectively (Figure 2D–F). For the comparison of patients with remission (PR) at a 90% specificity versus no remission (SD + PD), AUCs for mPTGER4 were AUC = 0.60 (V1), AUC = 0.74 (VS), and AUC = 0.65 (VS/V1) (Figure 3A–C) and for mSHOX2 AUC = 0.59 (V1), AUC = 0.64 (VS), and AUC = 0.69 (VS/V1) (Figure 3D–F).
We also tested whether the patient’s age and sex had any influence on the therapy response but did not find any correlation.

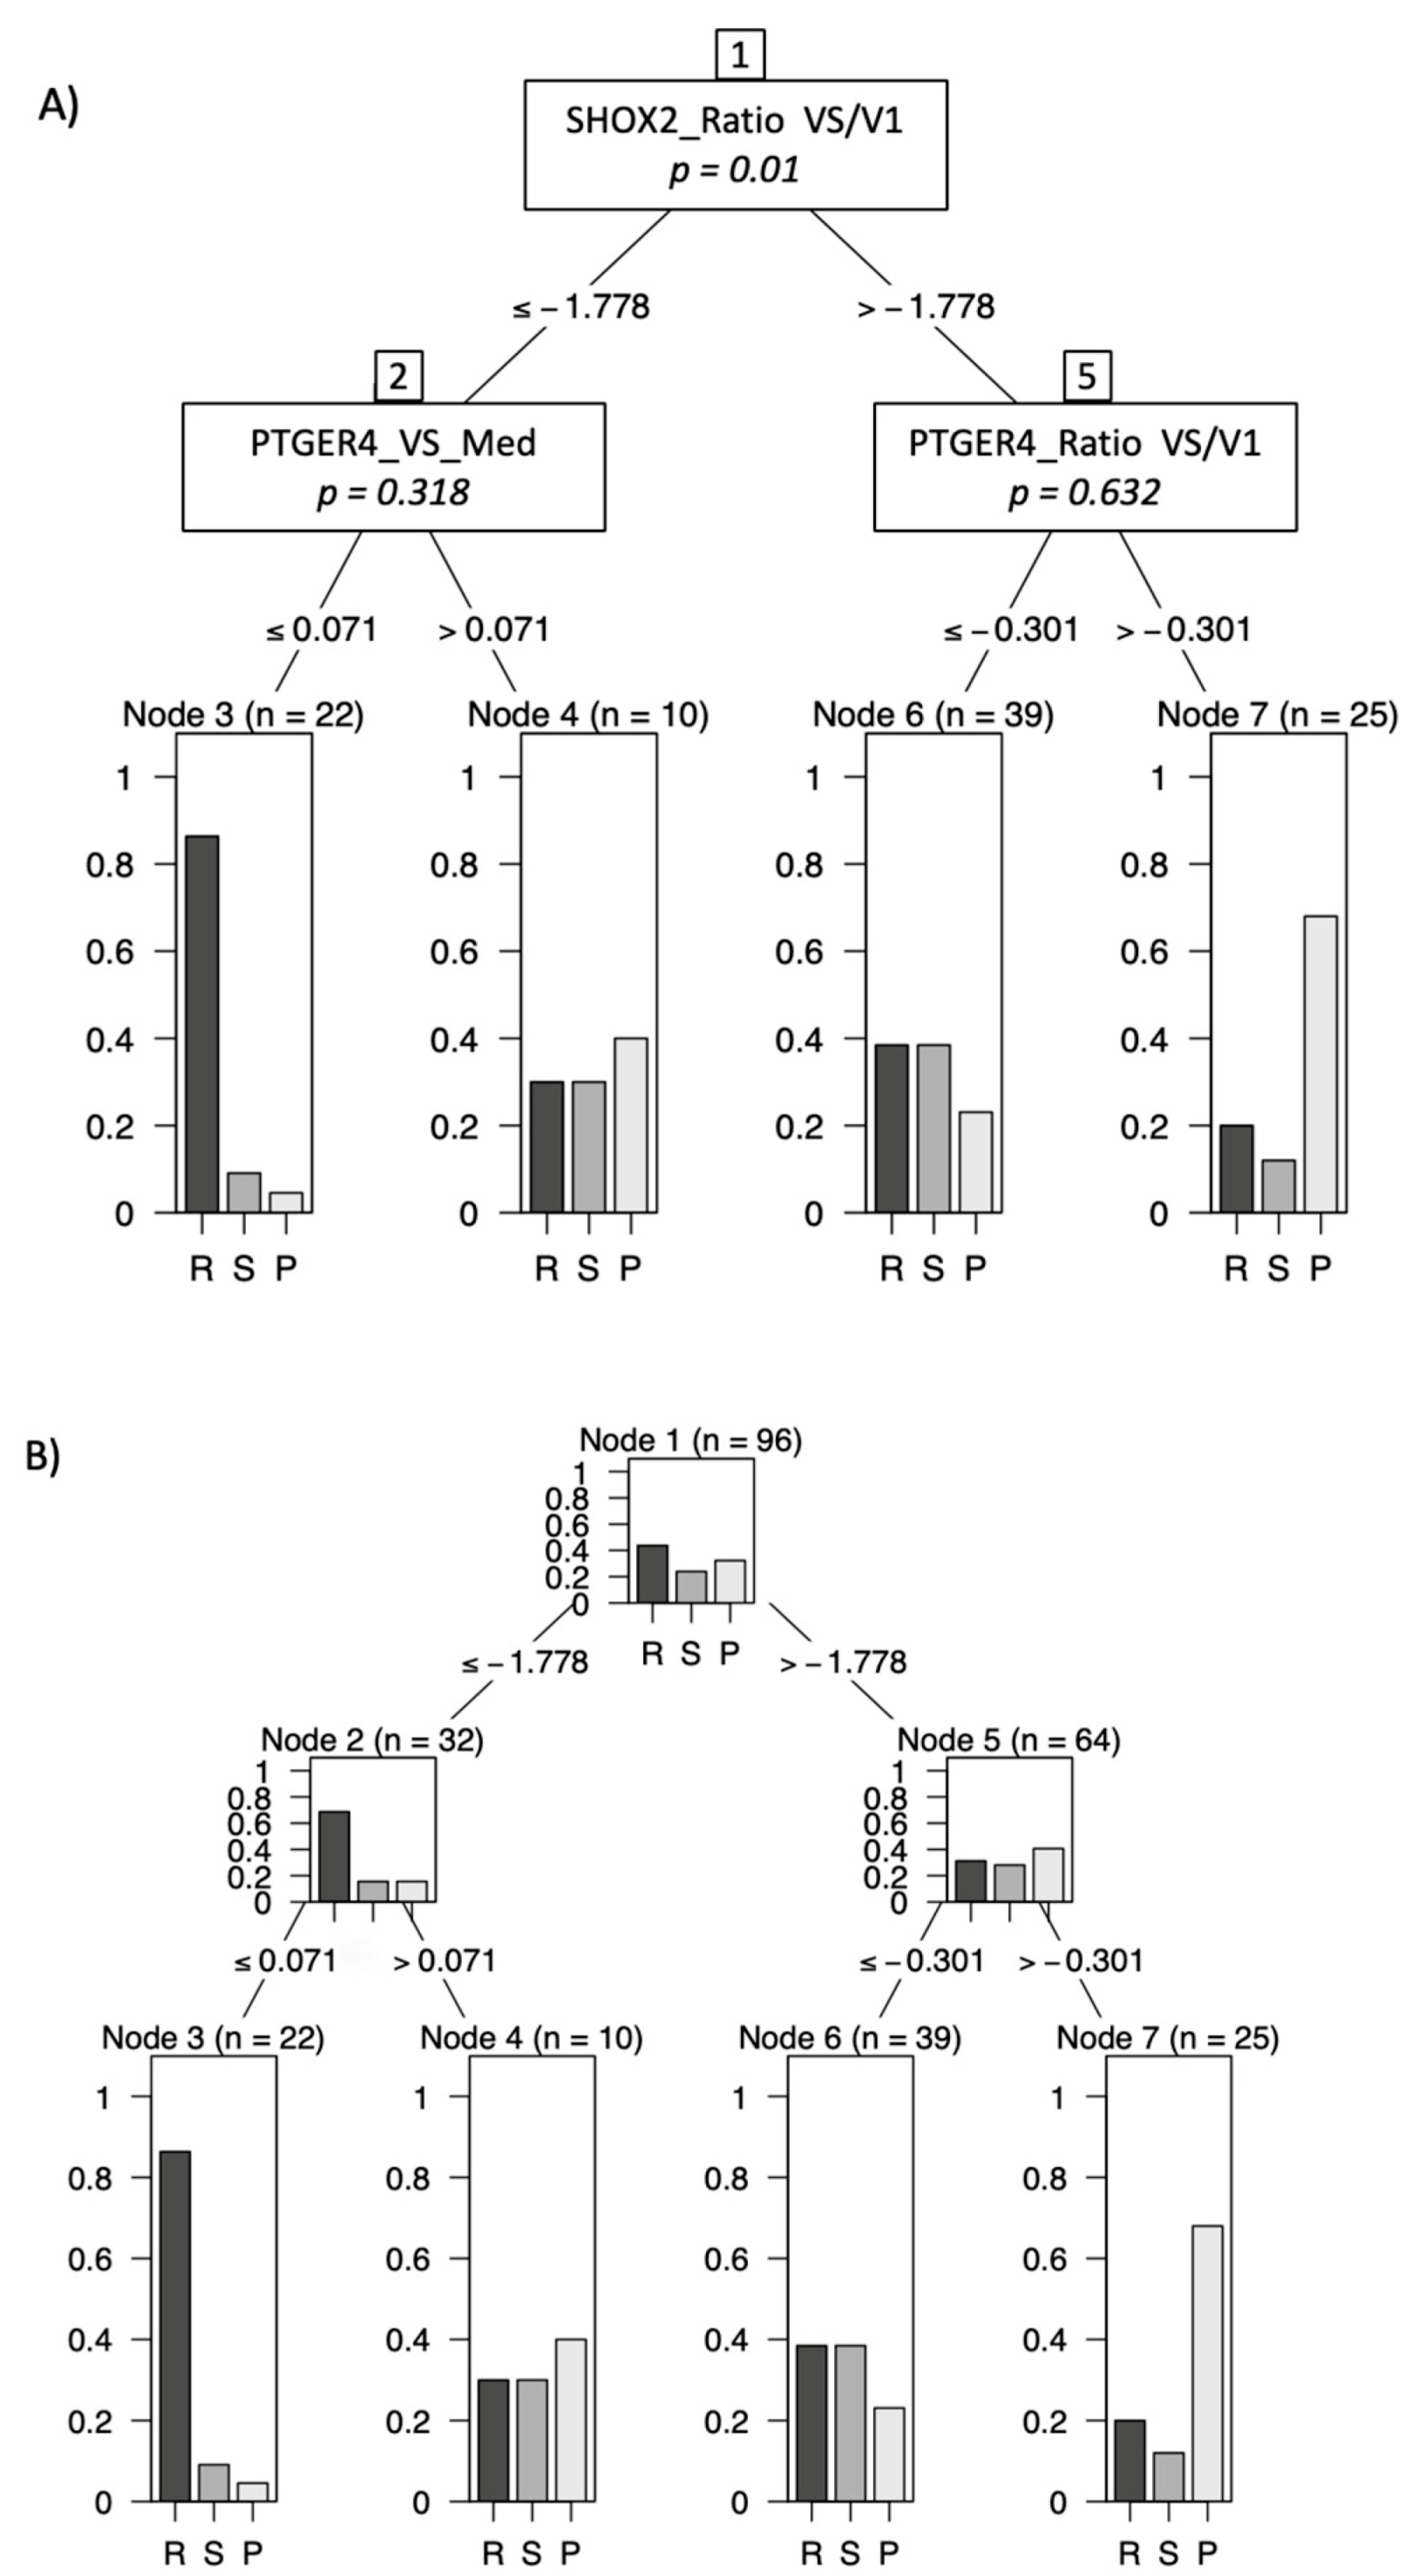
3.3. Combination of Markers in Decision Trees

To maximize the information for a therapy prediction, markers were combined in a decision-tree model by employing appropriate cutoffs and marker order. In using this model, we demonstrated that patients with a low mSHOX2 ratio (VS/V1) and low mPTGER4 levels at the time of staging (VS) had a high chance of achieving PR at staging exams (Figure 4, Node 3). In contrast, patients with a high mSHOX2 ratio (VS/V1) and a high mPTGER4 ratio (VS/V1) had a high probability of demonstrating a progressive disease (Figure 4, Node 7). Patients with either a low mSHOX2 ratio (VS/V1) and high mPTGER4 (VS) levels or, alternatively, a high mSHOX2 ratio (VS/V1) and a low mPTGER4 ratio (VS/V1) were in the intermediate range(Figure 4, Nodes 4 and 6).

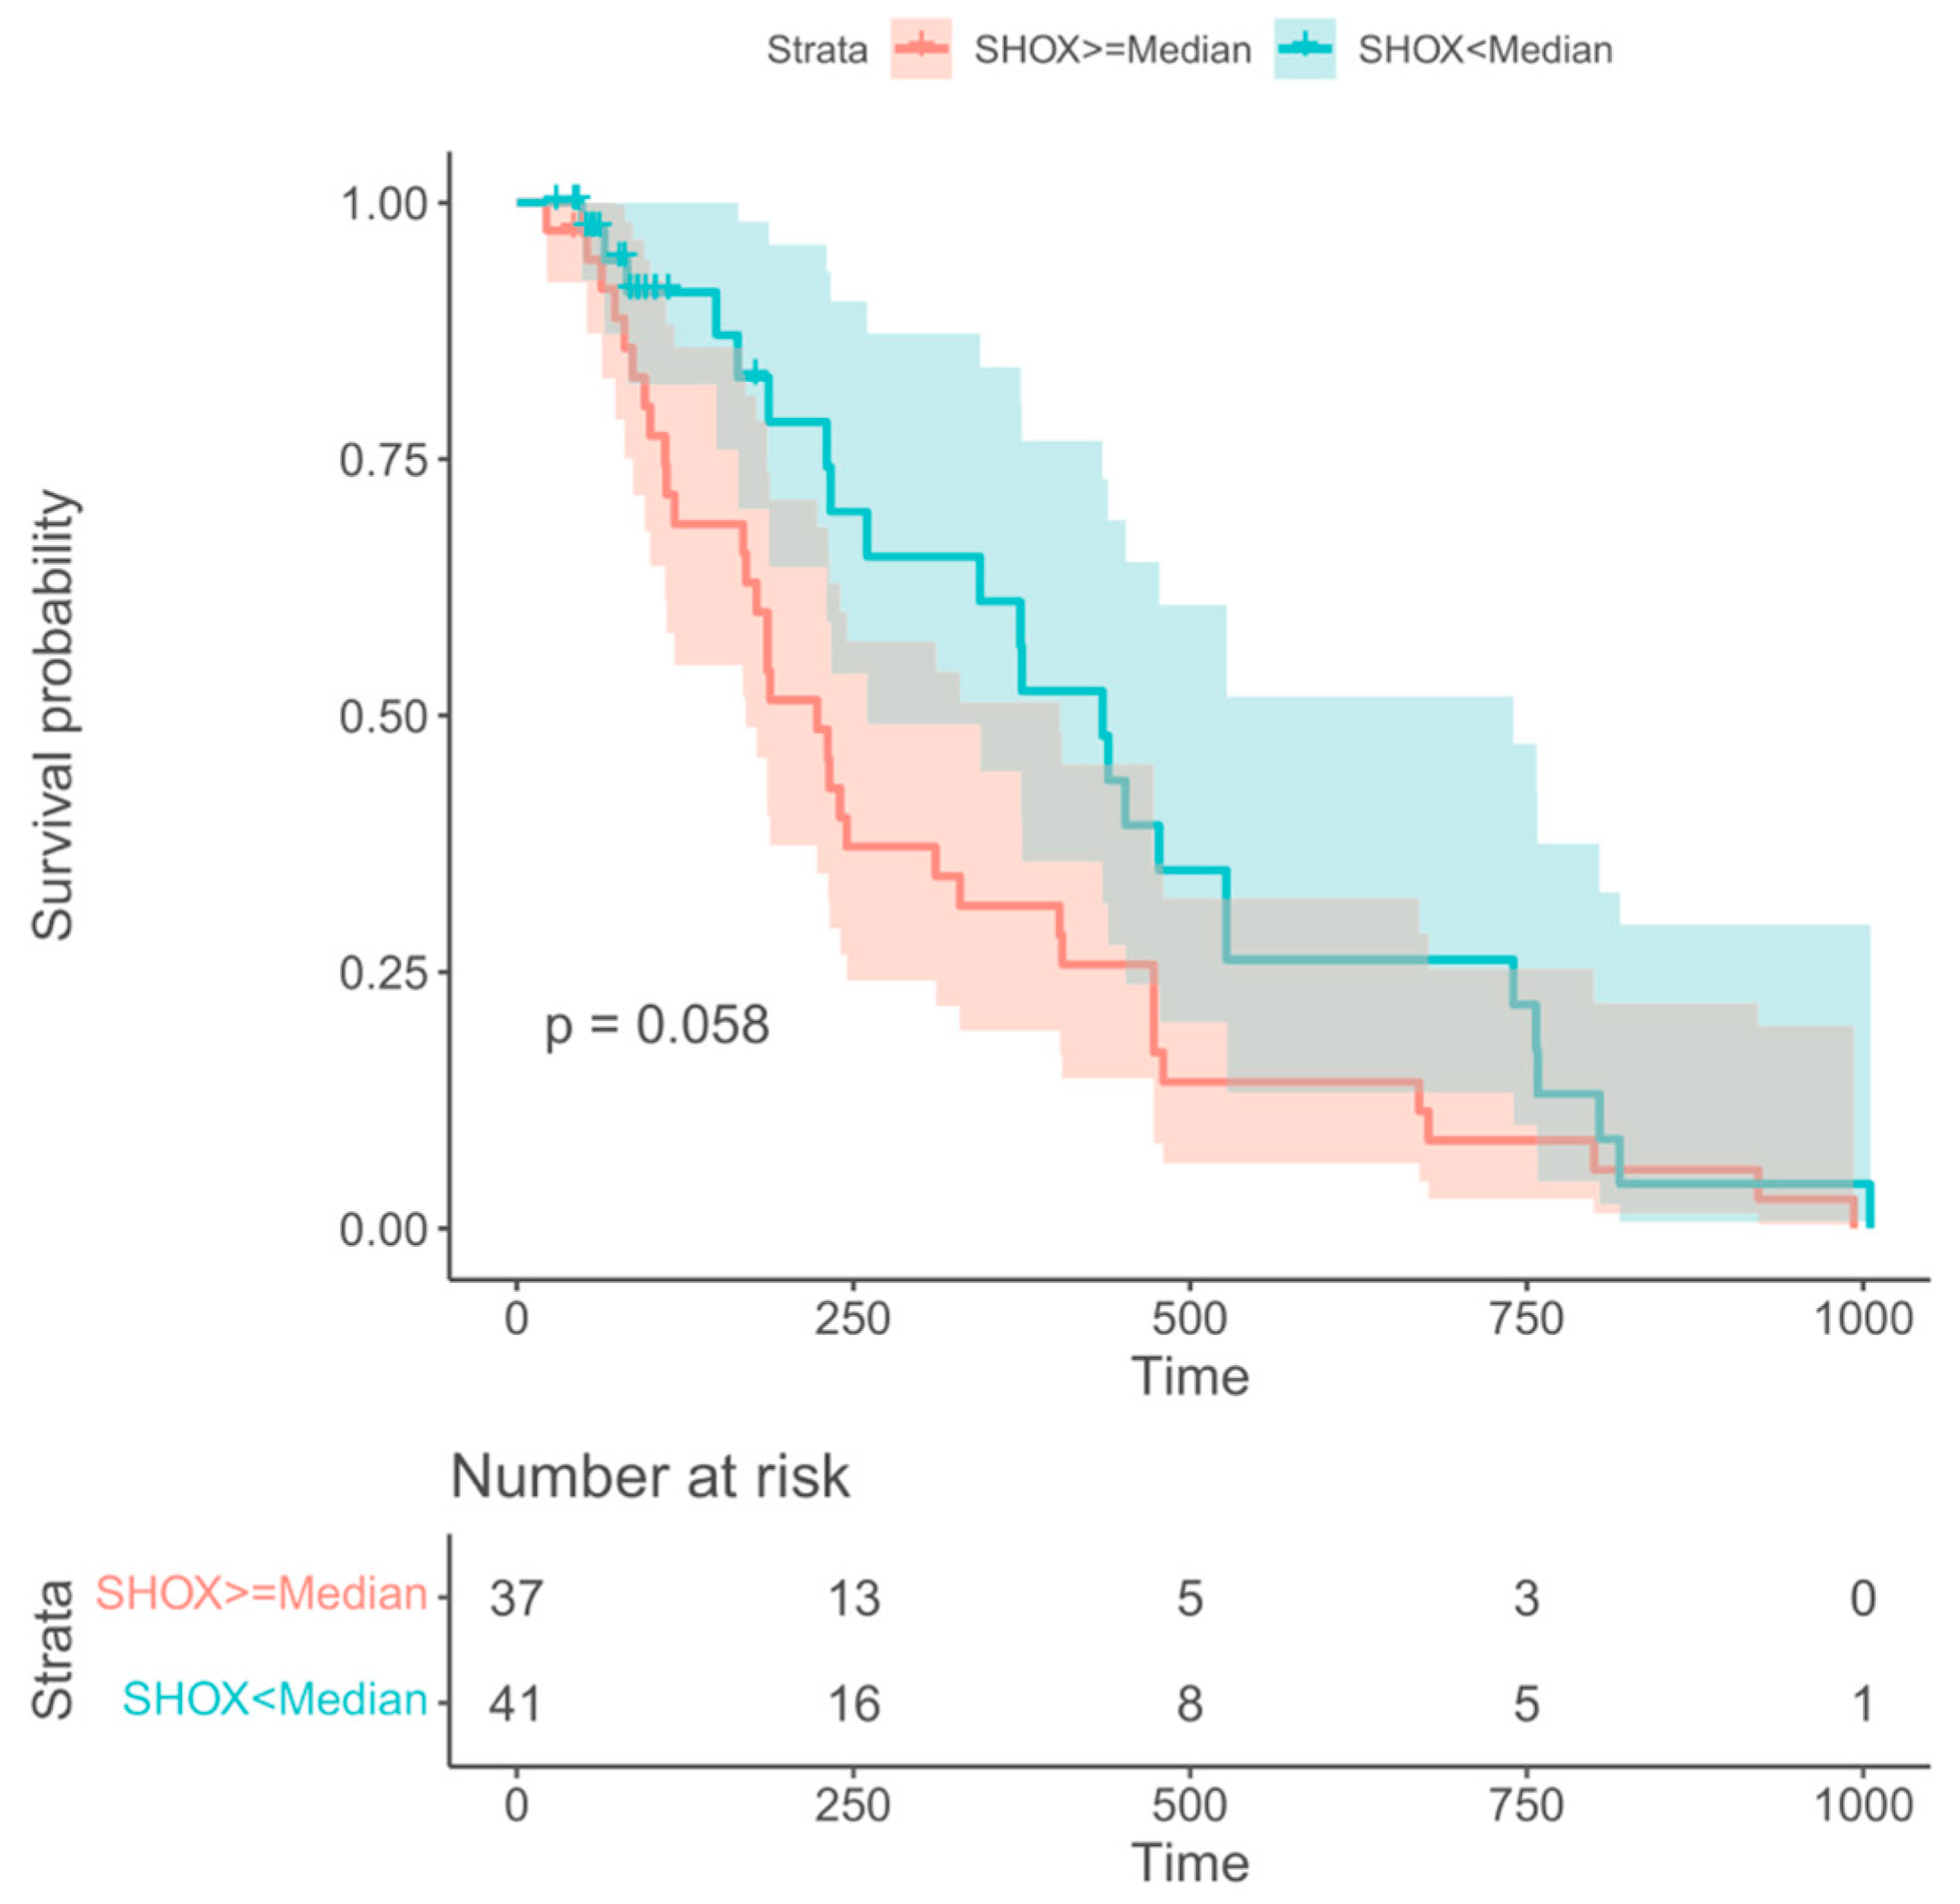
3.4. Relevance of PTGER4 and SHOX2 for Prognosis

Information regarding overall survival (OS) was available for 78 out of the 96 NSCLC patients. For prediction of OS only, SHOX2 methylation at the time of staging (VS) showed borderline-significant prognostic information. All other markers and time points did not. Patients with SHOX2 methylation levels below the median tended to longer survival with a median OS of 11 months as compared with patients with SHOX2 methylation levels above the median who had a median OS of 8 months. This difference showed a trend but was not statistically significant with a value of p = 0.058 (Figure 5).

4. Discussion

According to the latest US cancer statistics, 46% of the newly diagnosed lung cancer patients demonstrate a late-stage disease [18]. Furthermore, a recent survey showed that almost 49% of 210,000 newly diagnosed lung cancer patients died within 2 months after receiving their diagnosis [19]. Thus, it is of utmost importance to differentiate between patients with a high risk for early death and patients with a better prognosis.
Since our group and other researchers demonstrated that the detection and quantification of methylated ctDNA is a useful approach for therapy monitoring in lung cancer patients [14,15,16], more papers on this subject were published [20,21]. Moreover, the incorporation of liquid profiling as an additional clinical tool for the diagnosis, treatment stratification, detection of resistance mechanisms, and prognostic indication in lung cancer patients has been shown [22,23,24,25].
To confirm and extend the results of our original analysis [15] and to demonstrate the robustness of the method, we performed the present study. Apart from increasing the number of patients, we included patients who had received different treatment regimens, i.e., chemotherapy with/without radiotherapy, chemotherapy plus immunotherapy, and immunotherapy exclusively. Furthermore, we changed the pre-analytical process and applied a modified marker panel.
It is known that blood drawn into EDTA tubes should not be stored for more than 4–6 h before being processed [26]. A delay of more than 6 h can lead to irregular results due to lysis of blood cells and “contamination” of cell-free DNA with genomic DNA. Several studies have demonstrated that storage of blood drawn into PAXgene Blood ccfDNA Tubes for up to 7 days does not change the quantity and quality of plasma DNA [27,28].Moreover, we applied a modified marker panel which included the detection of cell-free methylated SHOX2 and PTGER4 plasma DNA [27]. All these factors plus a different patient population might explain the different results obtained in this study compared to those of our previous paper [15].
It is interesting to note that the baseline values for mPTGER4 and mSHOX2 do not allow for a clear discrimination between different response groups (Figure 1). In contrast, the methylation values for both genes show a clear difference between responders vs. non-responders at the time of re-staging (Figure 1). This observation still holds true when the ratios of the methylation values (VS/V1) for both genes are plotted (Figure 1E,F). These data corroborate our initial observation [15] that the methylation values at the time of diagnosis do not allow a differentiation between the two groups, while this is possible at the time of re-staging (i.e., 8 to 12 weeks after therapy start). When this study was commenced, Epigenomics AG (Berlin, Germany) had introduced a modified kit for DNA methylation analysis. This new kit included mSHOX2 as well as a second marker, mPTGER4 [27]. Currently, no comparative data exist for the two kits in a head-to-head approach. However, promising results have been published that advocate for the inclusion of a second marker. Indeed, the grouping of patients with a low mSHOX2 ratio (VS/V1) plus low mPTGER4 levels at the time of re-staging (VS) in decision trees allowed the discrimination of patients responding to the therapy from non-responding patients (Figure 3). When patients with a high mSHOX2 ratio (VS/V1) and high mPTGER4 levels at the time of staging (VS) were combined, we were able to differentiate patients not responding to the therapy, but with less statistical power. When the methylation levels of both genes at the time of re-staging were used for Kaplan-Meier curves only, mSHOX2 demonstrated a trend for statistical significance, but not mPTGER4 (Figure 4). SHOX2 belongs to the homeobox family and is coding for a transcriptional regulator involved in pattern formation in both the invertebrate and vertebrate species. In contrast, PTGER4 is a protein-coding gene and belongs to the G-protein coupled receptor family. As for both genes, no role in the development of lung cancer has been described so far; thus, we assume that only the former has a functional relationship in lung cancer patients.
In conclusion, our findings demonstrate that quantifying extracellular free-circulating methylated DNA in plasma could be a valuable tool to monitor the response of lung cancer patients undergoing various treatment regimens. The use of specialized blood- drawing tubes to stabilize samples at room temperature allows their collection and transport to a remote laboratory without cooling. This approach gives researchers the possibility of enrolling many patients in future studies to confirm the validity of our current findings.

Author Contributions

E.A., D.R., S.E., G.T., J.K., C.S. and C.G. contributed to data acquisition. M.F., J.K., F.K., S.H. and B.S. contributed to the data analysis and writing of the paper. All authors have read and agreed to the published version of the manuscript.

Funding

No funding was received specifically for this work. The supporters of this project had no role in the design and conduct of the study; collection, management, analysis, and interpretation of the data; preparation, review, or approval of the manuscript; and decision to submit the manuscript for publication.

Institutional Review Board Statement

The study was conducted in accordance with the Declaration of Helsinki and has been approved by the Institutional Review Board (IRB) at the University Hospital of Halle/Saale. Informed consent (written) was obtained from all donors (Reference number 2014-52).

Informed Consent Statement

Informed written consent was obtained from all subjects involved in the study.

Data Availability Statement

Not applicable.

Acknowledgments

We would like to thank Epigenomics AG who supported this project by supplying us with isolation and detection kits and Qiagen who supplied us with PAXgene ccfDNA tubes.

Conflicts of Interest

Michael Fleischhacker and Bernd Schmidt are coinventors of the patent: “Methods for assessing the treatment response of cancer patients and for treating cancer patients by analysing CpG methylation” (Application Number: 62076674, patent pending). There are no further patents, products in development, or marketed products to declare. This does not alter the authors’ adherence to all the publication policies on sharing data and materials.

References

  1. Fois, S.S.; Paliogiannis, P.; Zinellu, A.; Fois, A.G.; Cossu, A.; Palmieri, G. Molecular Epidemiology of the Main Druggable Genetic Alterations in Non-Small Cell Lung Cancer. Int. J. Mol. Sci. 2021, 22, 612. [Google Scholar] [CrossRef] [PubMed]
  2. S3-Leitlinie Prävention, Diagnostik, Therapie und Nachsorge des Lungenkarzinoms. Available online: https://www.leitlinienprogramm-onkologie.de/leitlinien/lungenkarzinom/ (accessed on 28 February 2023).
  3. Mandel, P.; Metais, P. Les Acides nucleiques du plasma sangiun chez l’Homme. C. R. Seances Soc. Biol. Fil. 1948, 142, 241–243. [Google Scholar]
  4. Stroun, M.; Anker, P.; Maurice, P.; Gahan, P.B. Circulating nucleic acids in higher organisms. Int. Rev. Cytol. 1977, 51, 1–48. [Google Scholar] [PubMed]
  5. Stroun, M.; Anker, P.; Lyautey, J.; Lederrey, C.; Maurice, P.A. Isolation and characterization of DNA from the plasma of cancer patients. Eur. J. Cancer Clin. Oncol. 1987, 23, 707–712. [Google Scholar] [CrossRef] [PubMed]
  6. Stroun, M.; Anker, P.; Maurice, P.; Lyautey, J.; Lederrey, C.; Beljanski, M. Neoplastic characteristics of the DNA found in the plasma of cancer patients. Oncology 1989, 46, 318–322. [Google Scholar] [CrossRef] [PubMed]
  7. Chen, X.Q.; Stroun, M.; Magnenat, J.-L.; Nicod, L.P.; Kurt, A.-M.; Lyautey, J.; Lederrey, C.; Anker, P. Microsatellite alterations in plasma DNA of small cell lung cancer patients. Nat. Med. 1996, 2, 1033–1035. [Google Scholar] [CrossRef]
  8. Huang, J.; Wang, L. Cell-Free DNA Methylation Profiling Analysis—Technologies and Bioinformatics. Cancers 2019, 11, 1741. [Google Scholar] [CrossRef] [Green Version]
  9. Hasenleithner, S.O.; Speicher, M.R. A clinician’s handbook for using ctDNA throughout the patient journey. Mol. Cancer 2022, 21, 81. [Google Scholar] [CrossRef]
  10. Barault, L.; Amatu, A.; Bleeker, F.E.; Moutinho, C.; Falcomatà, C.; Fiano, V.; Cassingena, A.; Siravegna, G.; Milione, M.; Cassoni, P.; et al. Digital PCR quantification of MGMT methylation refines prediction of clinical benefit from alkylating agents in glioblastoma and metastatic colorectal cancer. Ann. Oncol. 2015, 26, 1994–1999. [Google Scholar] [CrossRef]
  11. Huang, G.; Krocker, J.D.; Kirk, J.L.; Merwat, S.N.; Ju, H.; Soloway, R.D.; Wieck, L.R.; Li, A.; Okorodudu, A.O.; Petersen, J.R.; et al. Evaluation of INK4A promoter methylation using pyrosequencing and circulating cell-free DNA from patients with hepatocellular carcinoma. Clin. Chem. Lab. Med. 2014, 52, 899–909. [Google Scholar] [CrossRef] [Green Version]
  12. Li, Y.; Zheng, Y.; Wu, L.; Li, J.; Ji, J.; Yu, Q.; Dai, W.; Feng, J.; Wu, J.; Guo, C. Current status of ctDNA in precision oncology for hepatocellular carcinoma. J. Exp. Clin. Canc. Res. 2021, 40, 140. [Google Scholar] [CrossRef] [PubMed]
  13. Panagopoulou, M.; Karaglani, M.; Balgkouranidou, I.; Biziota, E.; Koukaki, T.; Karamitrousis, E.; Nena, E.; Tsamardinos, I.; Kolios, G.; Lianidou, E.; et al. Circulating cell-free DNA in breast cancer: Size profiling, levels, and methylation patterns lead to prognostic and predictive classifiers. Oncogene 2018, 38, 3387–3401. [Google Scholar] [CrossRef] [PubMed]
  14. Wang, H.; Zhang, B.; Chen, D.; Xia, W.; Zhang, J.; Wang, F.; Xu, J.; Zhang, Y.; Zhang, M.; Zhang, L.; et al. Real-time monitoring efficiency and toxicity of chemotherapy in patients with advanced lung cancer. Clin. Epigenetics 2015, 7, 119. [Google Scholar] [CrossRef] [PubMed] [Green Version]
  15. Schmidt, B.; Beyer, J.; Dietrich, D.; Bork, I.; Liebenberg, V.; Fleischhacker, M. Quantification of Cell-Free mSHOX2 Plasma DNA for Therapy Monitoring in Advanced Stage Non-Small Cell (NSCLC) and Small-Cell Lung Cancer (SCLC) Patients. PLoS ONE 2015, 10, e0118195. [Google Scholar] [CrossRef] [PubMed] [Green Version]
  16. Weiss, G.; Schlegel, A.; Kottwitz, D.; König, T.; Tetzner, R. Validation of the SHOX2/PTGER4 DNA Methylation Marker Panel for Plasma-Based Discrimination between Patients with Malignant and Nonmalignant Lung Disease. J. Thorac. Oncol. 2017, 12, 77–84. [Google Scholar] [CrossRef] [Green Version]
  17. Kneip, C.; Schmidt, B.; Seegebarth, A.; Weickmann, S.; Fleischhacker, M.; Liebenberg, V.; Field, J.K.; Dietrich, D. SHOX2 DNA Methylation Is a Biomarker for the Diagnosis of Lung Cancer in Plasma. J. Thorac. Oncol. 2011, 6, 1632. [Google Scholar] [CrossRef] [PubMed] [Green Version]
  18. Siegel, R.L.; Miller, K.D.; Fuchs, H.E.; Jemal, A. Cancer statistics, 2022. CA Cancer J. Clin. 2022, 72, 7–33. [Google Scholar] [CrossRef]
  19. Globus, O.; Sagie, S.; Lavine, N.; Barchana, D.I.; Urban, D. Early death after a diagnosis of metastatic solid cancer—Raising awareness and identifying risk factors from the SEER database. medRxiv 2023. [Google Scholar] [CrossRef]
  20. Ponomaryova, A.A.; Rykova, E.Y.; Cherdyntseva, N.V.; Skvortsova, T.E.; Dobrodeev, A.Y.; Zav’yalov, A.A.; Bryzgalov, L.O.; Tuzikov, S.A.; Vlassov, V.V.; Laktionov, P.P. Potentialities of aberrantly methylated circulating DNA for diagnostics and post-treatment follow-up of lung cancer patients. Lung Cancer 2013, 81, 397–403. [Google Scholar] [CrossRef]
  21. Janke, F.; Angeles, A.K.; Riediger, A.L.; Bauer, S.; Reck, M.; Stenzinger, A.; Schneider, M.A.; Muley, T.; Thomas, M.; Christopoulos, P.; et al. Longitudinal monitoring of cell-free DNA methylation in ALK-positive non-small cell lung cancer patients. Clin. Epigenetics 2022, 14, 163. [Google Scholar] [CrossRef]
  22. Metzenmacher, M.; Hegedues, B.; Forster, J.; Schramm, A.; Horn, P.A.; Klein, C.A.; Bielefeld, N.; Ploenes, T.; Aigner, C.; Theegarten, D.; et al. Combined multimodal ctDNA analysis and radiological imaging for tumor surveillance in Non-small cell lung cancer. Transl. Oncol. 2022, 15, 101279. [Google Scholar] [CrossRef] [PubMed]
  23. Pisapia, P.; Malapelle, U.; Troncone, G. Liquid Biopsy and Lung Cancer. Acta Cytol. 2019, 63, 489–496. [Google Scholar] [CrossRef] [PubMed]
  24. Gray, J.; Thompson, J.C.; Carpenter, E.L.; Elkhouly, E.; Aggarwal, C. Plasma Cell-Free DNA Genotyping: From an Emerging Concept to a Standard-of-Care Tool in Metastatic Non-Small Cell Lung Cancer. Oncologist 2021, 26, e1812–e1821. [Google Scholar] [CrossRef] [PubMed]
  25. Shields, M.D.; Chen, K.; Dutcher, G.; Patel, I.; Pellini, B. Making the Rounds: Exploring the Role of Circulating Tumor DNA (ctDNA) in Non-Small Cell Lung Cancer. Int. J. Mol. Sci. 2022, 23, 9006. [Google Scholar] [CrossRef] [PubMed]
  26. Jung, M.; Klotzek, S.; Lewandowski, M.; Fleischhacker, M.; Jung, K. Changes in Concentration of DNA in Serum and Plasma during Storage of Blood Samples. Clin. Chem. 2003, 49, 1028–1029. [Google Scholar] [CrossRef] [Green Version]
  27. Warton, K.; Yuwono, N.L.; Cowley, M.J.; McCabe, M.J.; So, A.; Ford, C.E. Evaluation of Streck BCT and PAXgene Stabilised Blood Collection Tubes for Cell- Free Circulating DNA Studies in Plasma. Mol. Diagn. Ther. 2017, 21, 563–570. [Google Scholar] [CrossRef]
  28. Schmidt, B.; Reinicke, D.; Reindl, I.; Bork, I.; Wollschläger, B.; Lambrecht, N.; Fleischhacker, M. Liquid biopsy—Performance of the PAXgene® Blood ccfDNA Tubes for the isolation and characterization of cell-free plasma DNA from tumor patients. Clin. Chim. Acta 2017, 469, 94–98. [Google Scholar] [CrossRef]
Figure 1. Boxplots for the distribution of methylated PTGER4 (AC) and SHOX2 (DF) before the start of therapy (V1), at the time of first radiological staging (VS) and the ratio between both time points (VS/V1) for patients with partial remission (PR), stable disease (SD), and progressive disease (PD) in the staging exams.
Diagnostics 13 02131 g001
Figure 2. Receiver-operating characteristic (ROC) curves (dark line) and respective 95% confidence intervals (CI; grey area) for the discrimination of patients with progressive disease (PD) from patients with no progression (stable disease + partial remission) for methylated PTGER4 (AC) and SHOX2 (DF) before start of therapy (V1), at time of first radiological staging (VS) and the ratio between both time points (VS/V1).
Diagnostics 13 02131 g002
Figure 3. Receiver-operating characteristic (ROC) curves for the discrimination of patients with remission (PR) from patients with no remission (stable + progressive disease) for methylated PTGER4 (AC) and SHOX2 (DF) before start of therapy (V1), at time of first radiological staging (VS) and the ratio between both time points (VS/V1).
Diagnostics 13 02131 g003
Figure 4. Decision-tree model using a combination of markers mSHOX2 ratio (VS/V1), mPTGER4 at staging (VS) and mPTGER4 ratio (VS/V1) for best prediction of therapy response. Patients with low mSHOX2 VS/V1 and low mPTGER4 VS had a high chance of achieving partial remission (R), whereas patients with high mSHOX2 VS/V1 and high mPTGER4 VS/V1 had a high probability for progressive disease (P). (A) shows the decision rules; and (B) the distribution of responses at every decision node.
Diagnostics 13 02131 g004
Figure 5. Kaplan-Meier survival curves for the mSHOX2 at time of staging (VS) showing borderline longer survival for patients with low levels (green) than those with high levels (red).
Diagnostics 13 02131 g005
Table 1. Clinical data for all enrolled patients.
PatientNumber
Sex
     female62
     male34
Age
     range48–81
     median63
Smoker
     yes41
     no4
     ex-smoker30
     unknown21
Histology
     NSCLC (unclassified)25
     Adenocarcinoma54
     Squamous cell carcinoma17
Treatment
     Chemo +/− Radiotherapy83
     Chemo + Immunotherapy9
     Immunotherapy4
Therapy response
     partial remission42
     stable disease23
     progressive disease31
Disclaimer/Publisher’s Note: The statements, opinions and data contained in all publications are solely those of the individual author(s) and contributor(s) and not of MDPI and/or the editor(s). MDPI and/or the editor(s) disclaim responsibility for any injury to people or property resulting from any ideas, methods, instructions or products referred to in the content.

