
Lung Ultrasound to Determine the Effect of Lower vs. Higher PEEP on Lung Aeration in Patients without ARDS—A Substudy of a Randomized Clinical Trial

 ,
,  , , ,
, , ,
Abstract
1. Introduction
2. Materials and Methods
2.1. Study Design and Patients
2.2. Ventilation with a Higher versus Lower PEEP
2.3. Lung Ultrasound
2.4. Blinding and Masking
2.5. Endpoints
2.6. Power Calculation
2.7. Statistical Analysis
3. Results
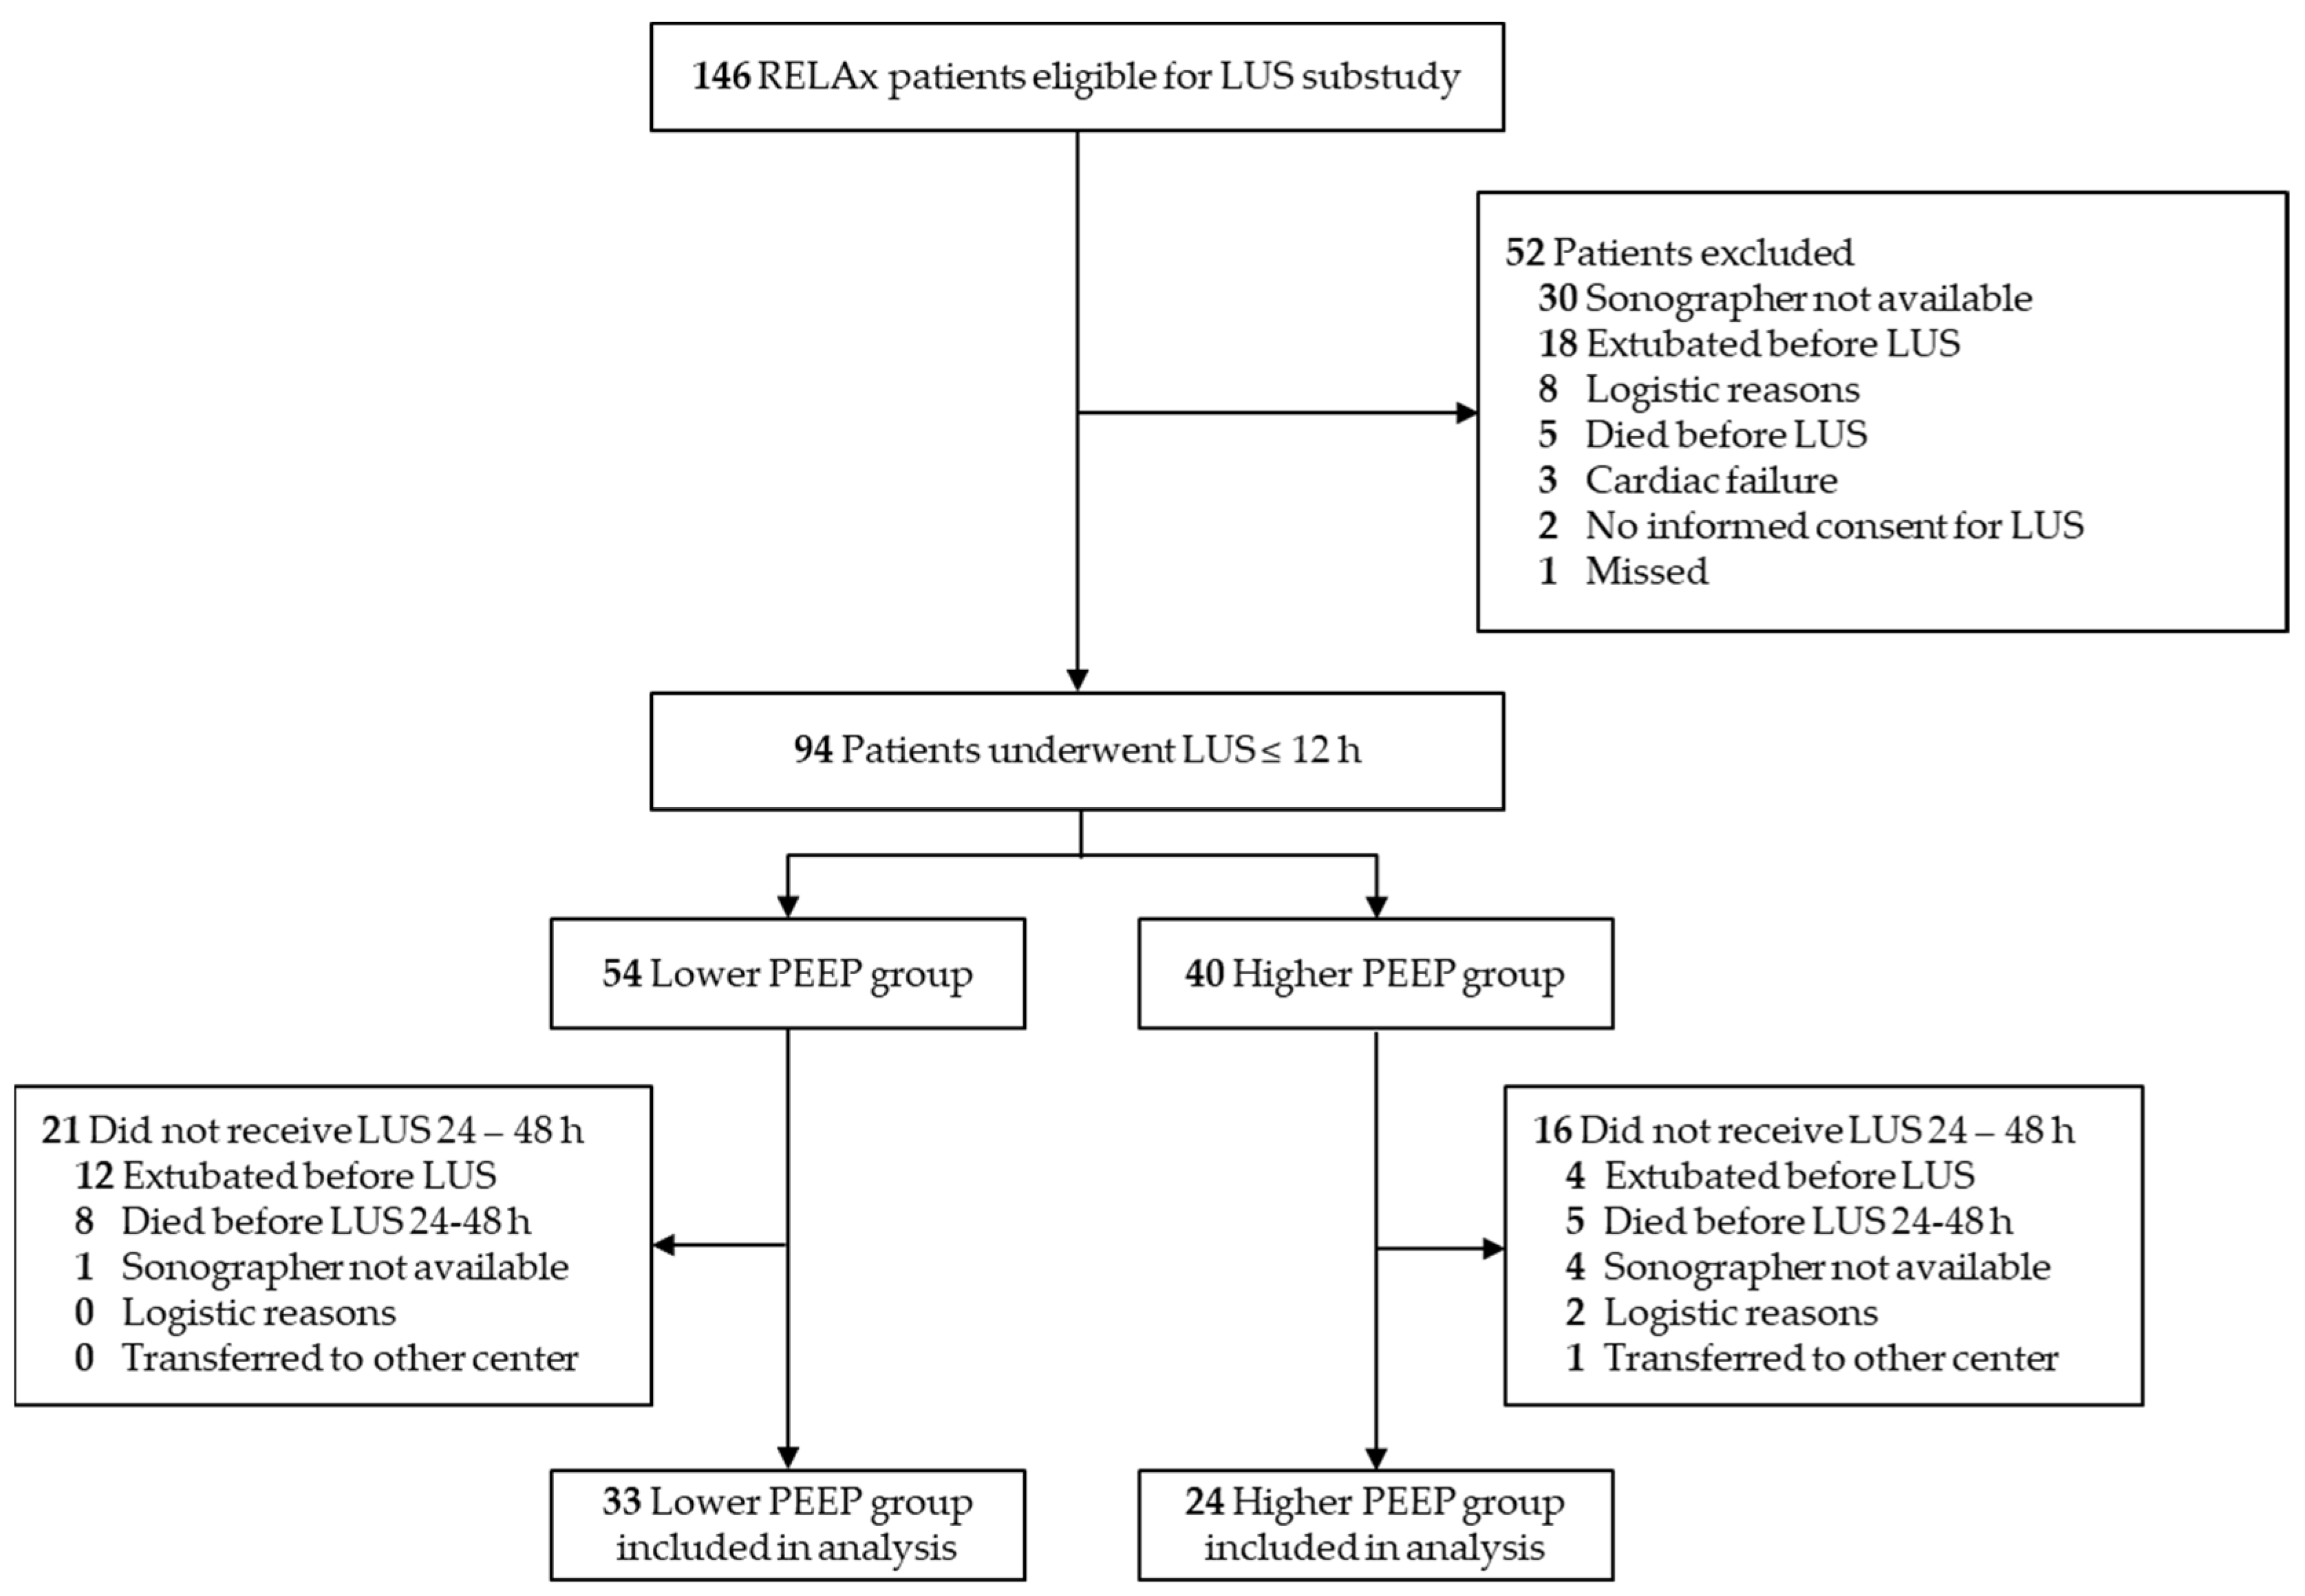
3.1. Patients
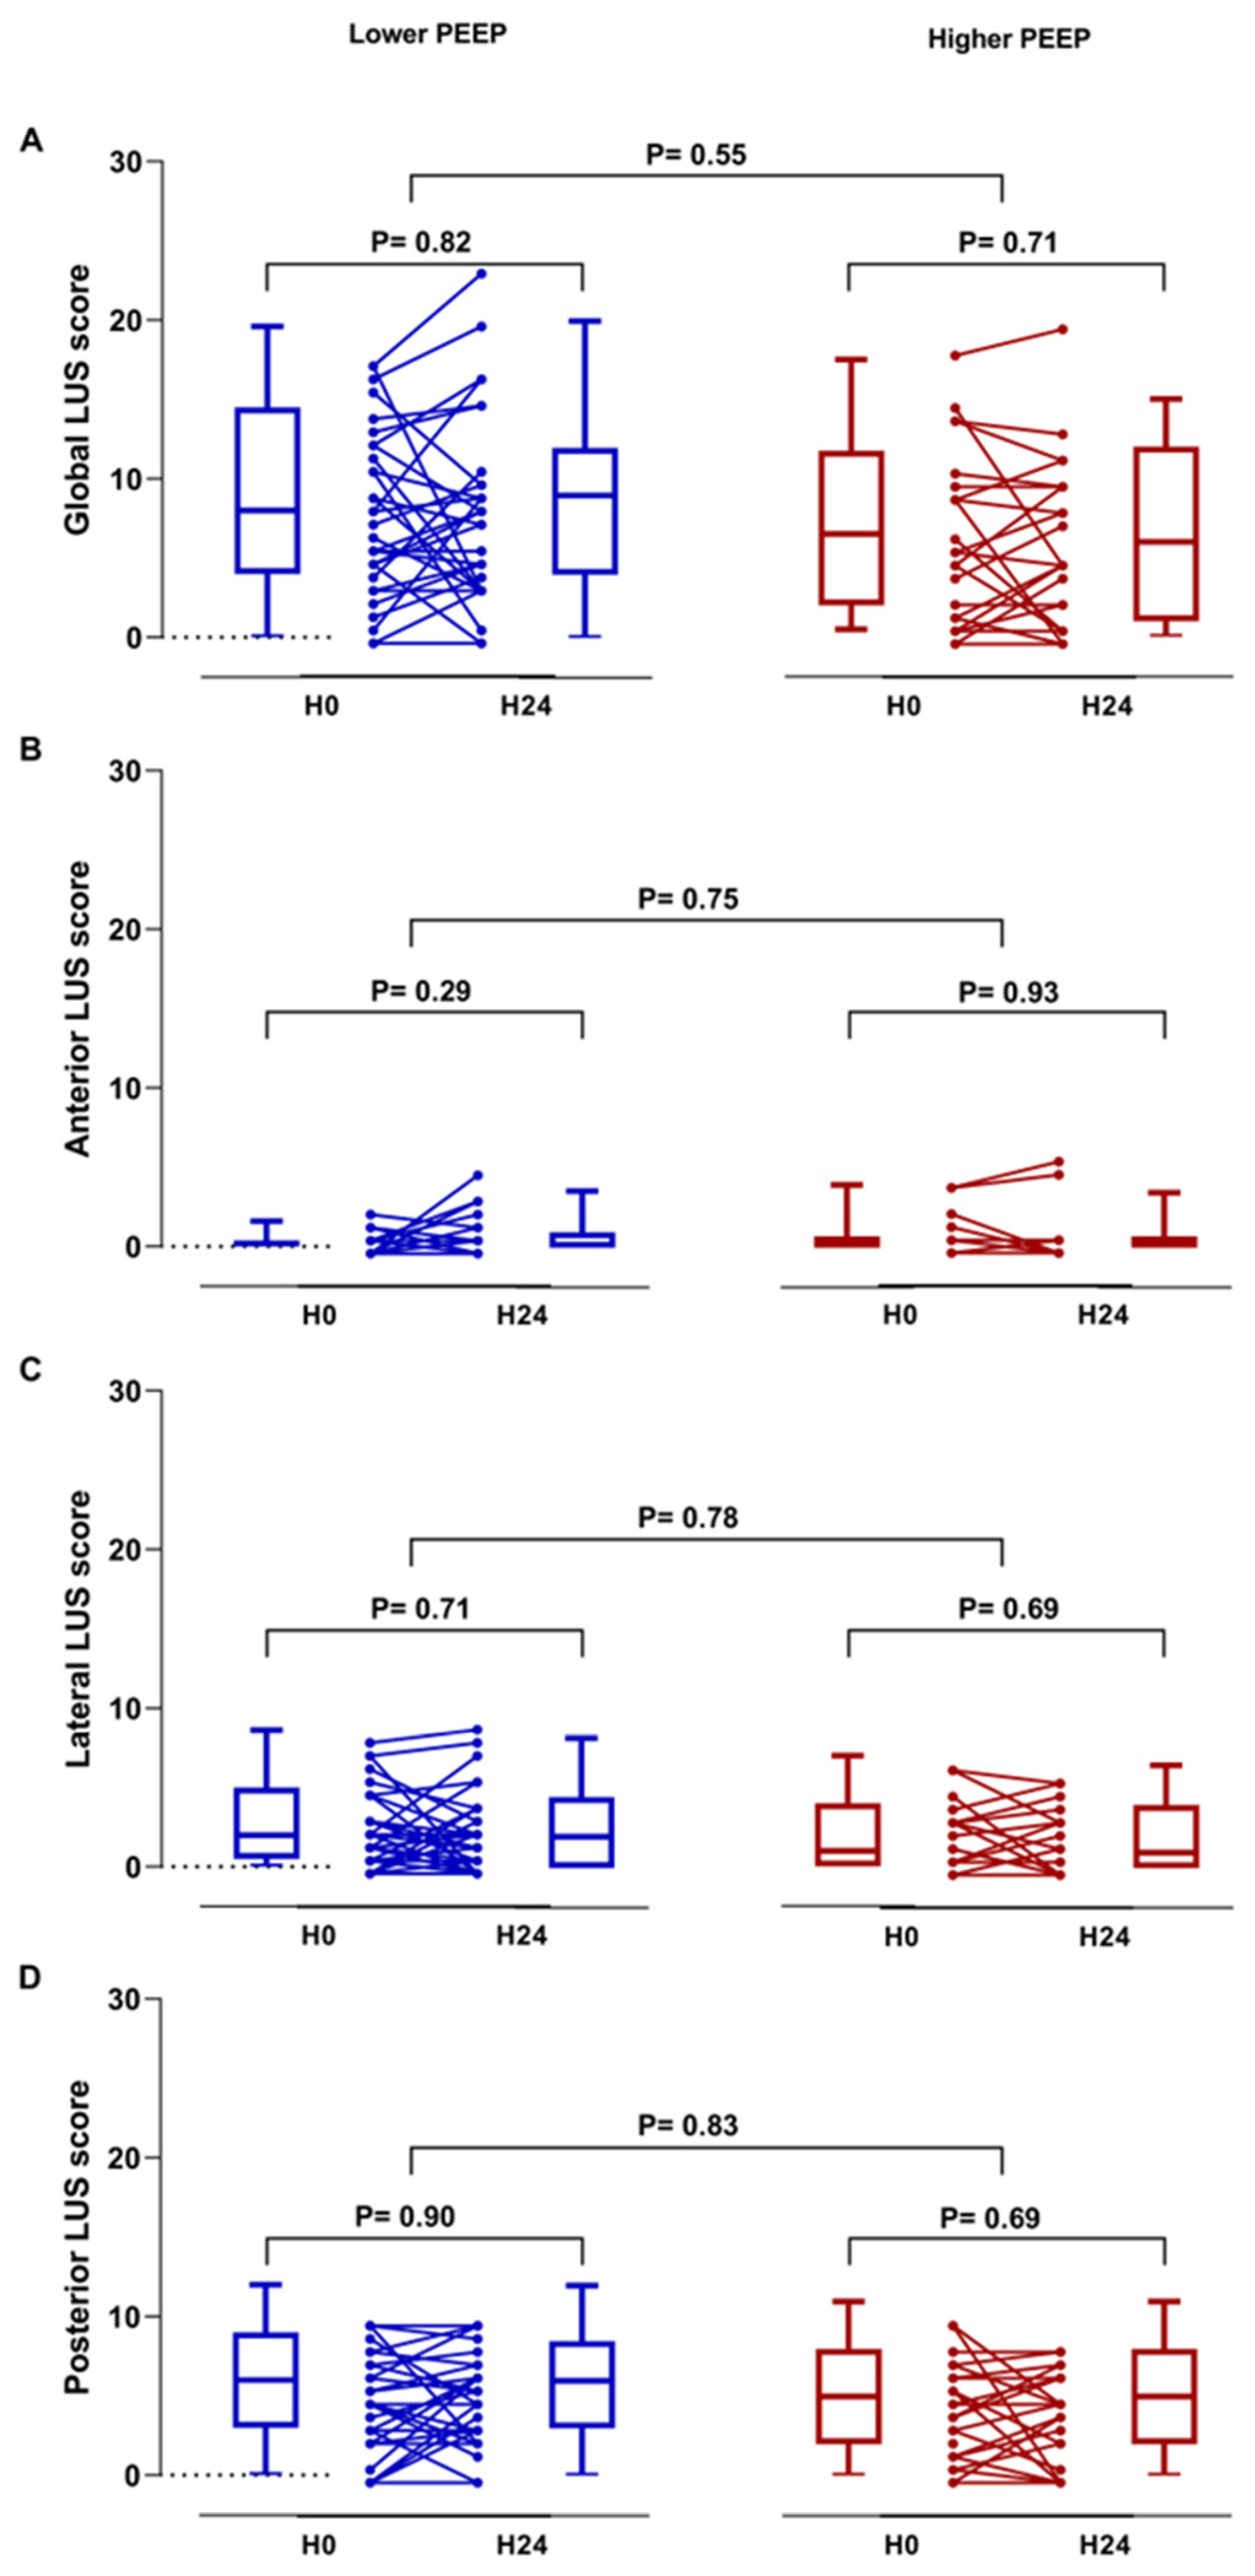
3.2. Lung Ultrasound
4. Discussion
5. Conclusions
Supplementary Materials
Author Contributions
Funding
Institutional Review Board Statement
Informed Consent Statement
Data Availability Statement
Conflicts of Interest
Appendix A
References
- Briel, M.; Meade, M.; Mercat, A.; Brower, R.G.; Talmor, D.; Walter, S.D.; Slutsky, A.S.; Pullenayegum, E.; Zhou, Q.; Cook, D.; et al. Higher vs lower positive end-expiratory pressure in patients with acute lung injury and acute respiratory distress syndrome: Systematic review and meta-analysis. JAMA 2010, 303, 865–873. [Google Scholar] [CrossRef] [PubMed]
- Serpa Neto, A.; Filho, R.R.; Cherpanath, T.; Determann, R.; Dongelmans, D.A.; Paulus, F.; Tuinman, P.R.; Pelosi, P.; de Abreu, M.G.; Schultz, M.J.; et al. Associations between positive end-expiratory pressure and outcome of patients without ARDS at onset of ventilation: A systematic review and meta-analysis of randomized controlled trials. Ann. Intensive Care 2016, 6, 109. [Google Scholar] [CrossRef] [PubMed]
- Neto, A.S.; Barbas, C.S.; Simonis, F.D.; Artigas-Raventós, A.; Canet, J.; Determann, R.M.; Anstey, J.; Hedenstierna, G.; Hemmes, S.N.; Hermans, G.; et al. Epidemiological characteristics, practice of ventilation, and clinical outcome in patients at risk of acute respiratory distress syndrome in intensive care units from 16 countries (PRoVENT): An international, multicentre, prospective study. Lancet Respir. Med. 2016, 4, 882–893. [Google Scholar] [CrossRef] [PubMed]
- Algera, A.G.; Pisani, L.; Neto, A.S.; den Boer, S.S.; Bosch, F.F.; Bruin, K.; Klooster, P.M.; Van der Meer, N.J.; Nowitzky, R.O.; Purmer, I.M.; et al. Effect of a Lower vs Higher Positive End-Expiratory Pressure Strategy on Ventilator-Free Days in ICU Patients Without ARDS: A Randomized Clinical Trial. JAMA 2020, 324, 2509–2520. [Google Scholar] [PubMed]
- Bouhemad, B.; Brisson, H.; Le-Guen, M.; Arbelot, C.; Lu, Q.; Rouby, J.J. Bedside ultrasound assessment of positive end-expiratory pressure-induced lung recruitment. Am. J. Respir. Crit. Care Med. 2011, 183, 341–347. [Google Scholar] [CrossRef]
- Chiumello, D.; Mongodi, S.; Algieri, I.; Vergani, G.L.; Orlando, A.; Via, G.; Crimella, F.; Cressoni, M.; Mojoli, F. Assessment of Lung Aeration and Recruitment by CT Scan and Ultrasound in Acute Respiratory Distress Syndrome Patients. Crit. Care Med. 2018, 46, 1761–1768. [Google Scholar] [CrossRef]
- Pierrakos, C.; Smit, M.R.; Pisani, L.; Paulus, F.; Schultz, M.J.; Constantin, J.M.; Chiumello, D.; Mojoli, F.; Mongodi, S.; Bos, L.D. Lung Ultrasound Assessment of Focal and Non-focal Lung Morphology in Patients With Acute Respiratory Distress Syndrome. Front. Physiol. 2021, 12, 1482. [Google Scholar] [CrossRef]
- Pierrakos, C.; Lieveld, A.; Pisani, L.; Smit, M.R.; Heldeweg, M.; Hagens, L.A.; Smit, J.; Haaksma, M.; Veldhuis, L.; Schmidt, R.W.; et al. A Lower Global Lung Ultrasound Score Is Associated with Higher Likelihood of Successful Extubation in Invasively Ventilated COVID-19 Patients. Am. J. Trop. Med. Hyg. 2021, 105, 1490–1497. [Google Scholar] [CrossRef] [PubMed]
- Algera, A.G.; Pisani, L.; Bergmans, D.C.; den Boer, S.; de Borgie, C.A.; Bosch, F.H.; Bruin, K.; Cherpanath, T.G.; Determann, R.M.; Dondorp, A.M.; et al. RELAx—REstricted versus Liberal positive end-expiratory pressure in patients without ARDS: Protocol for a randomized controlled trial. Trials 2018, 19, 272. [Google Scholar] [CrossRef]
- Mongodi, S.; Bouhemad, B.; Orlando, A.; Stella, A.; Tavazzi, G.; Via, G.; Iotti, G.A.; Braschi, A.; Mojoli, F. Modified Lung Ultrasound Score for Assessing and Monitoring Pulmonary Aeration. Ultraschall Med. 2017, 38, 530–537. [Google Scholar] [CrossRef]
- Smit, M.R.; Hagens, L.A.; Heijnen, N.F.; Pisani, L.; Cherpanath, T.G.; Dongelmans, D.A.; de Grooth, H.J.S.; Pierrakos, C.; Tuinman, P.R.; Zimatore, C.; et al. Lung Ultrasound Prediction Model for Acute Respiratory Distress Syndrome: A Multicenter Prospective Observational Study. Am. J. Respir. Crit. Care Med. 2023. [Google Scholar] [CrossRef] [PubMed]
- Bouhemad, B.; Liu, Z.H.; Arbelot, C.; Zhang, M.; Ferarri, F.; Le-Guen, M.; Girard, M.; Lu, Q.; Rouby, J.J. Ultrasound assessment of antibiotic-induced pulmonary reaeration in ventilator-associated pneumonia. Crit. Care Med. 2010, 38, 84–92. [Google Scholar] [CrossRef] [PubMed]
- Lichtenstein, D.; Mezière, G.; Seitz, J. The dynamic air bronchogram. A lung ultrasound sign of alveolar consolidation ruling out atelectasis. Chest 2009, 135, 1421–1425. [Google Scholar] [CrossRef] [PubMed]
- Esteban, A.; Frutos-Vivar, F.; Muriel, A.; Ferguson, N.D.; Peñuelas, O.; Abraira, V.; Raymondos, K.; Rios, F.; Nin, N.; Apezteguía, C.; et al. Evolution of mortality over time in patients receiving mechanical ventilation. Am. J. Respir. Crit. Care Med. 2013, 188, 220–230. [Google Scholar] [CrossRef]
- Peñuelas, O.; Muriel, A.; Abraira, V.; Frutos-Vivar, F.; Mancebo, J.; Raymondos, K.; Du, B.; Thille, A.W.; Ríos, F.; González, M.; et al. Muriel Inter-country variability over time in the mortality of mechanically ventilated patients. Intensive Care Med. 2020, 46, 444–453. [Google Scholar] [CrossRef] [PubMed]
- Cammarota, G.; Bruni, A.; Morettini, G.; Vitali, L.; Brunelli, F.; Tinarelli, F.; Simonte, R.; Rossi, E.; Bellucci, M.; De Girolamo, G.; et al. Lung ultrasound to evaluate aeration changes in response to recruitment maneuver and prone positioning in intubated patients with COVID-19 pneumonia: Preliminary study. Ultrasound J. 2023, 15, 3. [Google Scholar] [CrossRef] [PubMed]
- Monastesse, A.; Girard, F.; Massicotte, N.; Chartrand-Lefebvre, C.; Girard, M. Lung Ultrasonography for the Assessment of Perioperative Atelectasis: A Pilot Feasibility Study. Anesth. Analg. 2017, 124, 494–504. [Google Scholar] [CrossRef]
- Bouhemad, B.; Mongodi, S.; Via, G.; Rouquette, I. Ultrasound for ‘lung monitoring’ of ventilated patients. Anesthesiology 2015, 122, 437–447. [Google Scholar] [CrossRef] [PubMed]
- Vetrugno, L.; Boero, E.; Bignami, E.; Cortegiani, A.; Raineri, S.M.; Spadaro, S.; Moro, F.; D’Incà, S.; D’Orlando, L.; Agrò, F.E.; et al. Association between preoperative evaluation with lung ultrasound and outcome in frail elderly patients undergoing orthopedic surgery for hip fractures: Study protocol for an Italian multicenter observational prospective study (LUSHIP). Ultrasound J. 2021, 13, 30. [Google Scholar] [CrossRef]
- Généreux, V.; Chassé, M.; Girard, F.; Massicotte, N.; Chartrand-Lefebvre, C.; Girard, M. Effects of positive end-expiratory pressure/recruitment manoeuvres compared with zero end-expiratory pressure on atelectasis during open gynaecological surgery as assessed by ultrasonography: A randomised controlled trial. Br. J. Anaesth. 2020, 124, 101–109. [Google Scholar] [CrossRef]
- Neuteboom, O.B.; Heldeweg, M.L.; Pisani, L.; Smit, M.R.; Lagrand, W.K.; Cherpanath, T.G.; Dondorp, A.M.; Schultz, M.J.; Tuinman, P.R. Assessing Extravascular Lung Water in Critically Ill Patients Using Lung Ultrasound: A Systematic Review on Methodological Aspects in Diagnostic Accuracy Studies. Ultrasound Med. Biol. 2020, 46, 1557–1564. [Google Scholar] [CrossRef] [PubMed]
- Heldeweg, M.L.; Smit, M.R.; Kramer-Elliott, S.R.; Haaksma, M.E.; Smit, J.M.; Hagens, L.A.; Heijnen, N.F.; Jonkman, A.H.; Paulus, F.; Schultz, M.J.; et al. Lung Ultrasound Signs to Diagnose and Discriminate Interstitial Syndromes in ICU Patients: A Diagnostic Accuracy Study in Two Cohorts. Crit. Care Med. 2022, 50, 1607–1617. [Google Scholar] [CrossRef] [PubMed]
- Pisani, L.; De Nicolo, A.; Schiavone, M.; Adeniji, A.O.; De Palma, A.; Di Gennaro, F.; Emuveyan, E.E.; Grasso, S.; Henwood, P.C.; Koroma, A.P.; et al. Lung Ultrasound for Detection of Pulmonary Complications in Critically Ill Obstetric Patients in a Resource-Limited Setting. Am. J. Trop. Med. Hyg. 2020, 104, 478–486. [Google Scholar] [CrossRef] [PubMed]


| Lower PEEP (n = 33) | Higher PEEP (n = 24) | p Value | |
|---|---|---|---|
| Demographics | |||
| Age | 64 (52–72) | 66 (59–71) | 0.94 |
| Female | 14 (42%) | 6 (25%) | 0.28 |
| Weight, kg | 80 (71–89) | 81 (68–91) | 0.94 |
| Height, cm | 174 (168–184) | 178 (172–180) | 0.45 |
| BMI, kg/height in m2 | 28 (23–31) | 25 (66–75) | 0.38 |
| Fluid balance, in ml | 387 (−106–2007) | 945 (−45–3011) | 0.35 |
| APACHE II a | 24 (17–27) | 25 (20–28) | 0.37 |
| APACHE IV b | 77 (56–92) | 89 (63–102) | 0.37 |
| SOFA c | 10 (7–12) | 10 (8–12) | 0.42 |
| Comorbidities | |||
| Myocardial infarct | 4 (12%) | 4 (17%) | 0.65 |
| Heart failure | 2 (6%) | 0 (0%) | 0.62 |
| AKI | 6 (18%) | 1 (4.2%) | 0.24 |
| Surgical procedure in last 7 days | 13 (39%) | 7 (29%) | 0.60 |
| Stroke | 10 (30%) | 4 (17%) | 0.38 |
| Neurologic pulmonary edema | 0 (0%) | 0 (0%) | NA |
| Pancreatitis | 0 (0%) | 1 (4%) | 0.87 |
| None | 6 (18%) | 11 (46%) | 0.82 |
| Reason for intubation | 0.82 | ||
| Respiratory failure | 10 (30%) | 9 (38%) | |
| Pneumonia | 4 (12%) | 5 (21%) | |
| Cardiogenic pulmonary edema | 3 (9%) | 1 (5%) | |
| Sepsis non pulmonary | 2 (6%) | 1 (5%) | |
| COPD | 0 (0%) | 1 (5%) | |
| Other cause respiratory failure | 1(3%) | 1 (5%) | |
| Depressed consciousness | 10 (30%) | 7 (29%) | |
| OHCA | 4 (12%) | 4 (17%) | |
| Planned ventilation post-surgery | 6 (18%) | 2 (8%) | |
| Securing airway | 2 (6%) | 2 (8%) | |
| Trauma | 1 (3%) | 0 (0%) |
| LUS 12 h | LUS 24–48 h | |||||
|---|---|---|---|---|---|---|
| Lower PEEP (n = 33) | Higher PEEP (n = 24) | p Value | Lower PEEP (n = 33) | Higher PEEP (n = 24) | p Value | |
| Mode of Ventilation | 0.54 | 0.06 | ||||
| PCV | 14 (42%) | 14 (58%) | 6 (18%) | 9 (38%) | ||
| VCV | 2 (6%) | 1 (4%) | 0 (0%) | 0 (0%) | ||
| PSV | 14 (42%) | 6 (25%) | 26 (79%) | 12 (50%) | ||
| ASV | 3 (9%) | 3 (13%) | 1 (3%) | 3 (13%) | ||
| Ventilatory variables | ||||||
| Pmax, cm H2O | 15 (13–21) | 22 (19–24) | <0.001 | 13 (10–17) | 19 (16–21) | <0.001 |
| PEEP, cm H2O | 1.0 (0.0–5.0) | 8.0 (8.0–8.0) | <0.001 | 0 (0–1) | 8 (8–8) | <0.001 |
| FiO2, % | 40 (30–50) | 30 (24–40) | 0.03 | 30 (25–40) | 25 (21–35) | 0.05 |
| SpO2, % | 98 (97–100) | 98 (96–99) | 0.34 | 96 (94–98) | 96 (94–99) | 0.91 |
| PaO2/FiO2 ratio | 281 (210–375) | 314 (226–403) | 0.28 | 255 (201–318) | 334 (208–393) | 0.17 |
| Tidal volume, mL/kg PBW | 7.0 (5.8–8.1) | 6.7 (6.1–7.3) | 0.65 | 7.5 (6.6–8.3) | 6.4 (5.6–8.9) | 0.31 |
| Respiratory rate, breaths/min | 18 (17–22) | 20 (18–22) | 0.56 | 18 (15–22) | 20 (17–25) | 0.12 |
| Minute volume, L/min | 8.7 (8–10) | 9.9 (8–11) | 0.42 | 9 (8–11) | 10 (9–12) | 0.14 |
| Blood gas | ||||||
| pH | 7.4 (7.4–7.5) | 7.4 (7.4–7.5) | 0.88 | 7.4 (7.4–7.5) | 7.4 (7.4–7.5) | 0.44 |
| PaO2, mmHg | 98 (84–113) | 89 (82–113) | 0.69 | 81 (67–97) | 83 (77–88) | 0.90 |
| PaCO2, mmHg | 38 (33–42) | 37 (32–42) | 0.67 | 39 (35–42) | 36 (32–41) | 0.42 |
| Hemodynamics | ||||||
| Heart rate, bpm | 84 (67–96) | 83 (70–94) | 0.79 | 81 (67–97) | 82 (66–98) | 0.88 |
| MAP, mmHg | 78 (71–91) | 77 (72–83) | 0.99 | 78 (72–86) | 87 (75–91) | 0.34 |
| SBP, mmHg | 112 (102–137) | 112 (101–120) | 0.50 | 122 (109–147) | 125 (104–140) | 0.73 |
| DBP, mmHg | 59 (53–67) | 60 (56–70) | 0.29 | 59 (51–67) | 65 (56–69) | 0.20 |
| Fluid balance, mL | 387 (−106–2007) | 945 (−45–3011) | 0.35 | 803 (−124–1666) | 1610 (874–2528) | 0.02 |
| LUS 12 h | LUS 24–48 h | |||||
|---|---|---|---|---|---|---|
| Lower PEEP (n = 33) | Higher PEEP (n = 24) | p Value | Lower PEEP (n = 33) | Higher PEEP (n = 24) | p Value | |
| Subpleural consolidation | ||||||
| Global | ||||||
| All regions | 1 (0–3) | 2 (0–2) | 0.80 | 1 (0–2) | 1 (0–2) | 0.45 |
| Regional | ||||||
| Anterior | 0 (0–0) | 0 (0–0) | 0.88 | 0 (0–0) | 0 (0–0) | 1.00 |
| Lateral | 0 (0–1) | 0 (0–1) | 0.97 | 0 (0–1) | 0 (0–1) | 0.50 |
| Posterior | 1 (0–2) | 1 (0–1) | 0.45 | 1 (0–1) | 0 (0–1) | 0.27 |
| B-lines | ||||||
| Global | ||||||
| All regions | 3 (0–5) | 3 (1–4) | 0.85 | 3 (1–6) | 2 (1–5) | 0.56 |
| Regional | ||||||
| Anterior | 0 (0–0) | 0 (0–0) | 0.94 | 0 (0–1) | 0 (0–0) | 0.60 |
| Lateral | 1 (0–2) | 1 (0–2) | 0.84 | 1 (0–2) | 1 (0–2) | 0.29 |
| Posterior | 2 (0–3) | 2 (1–3) | 0.89 | 2 (0–3) | 2 (0–2) | 0.90 |
| Static Air Bronchogram | ||||||
| Global | ||||||
| All regions | 0 (0–0) | 0 (0–0) | 0.96 | 0 (0–0) | 0 (0–0) | 0.74 |
| Regional | ||||||
| Anterior | 0 (0–0) | 0 (0–0) | NA | 0 (0–0) | 0 (0–0) | 0.39 |
| Lateral | 0 (0–0) | 0 (0–0) | 0.47 | 0 (0–0) | 0 (0–0) | NA |
| Posterior | 0 (0–0) | 0 (0–0) | 0.69 | 0 (0–0) | 0 (0–0) | 0.54 |
Disclaimer/Publisher’s Note: The statements, opinions and data contained in all publications are solely those of the individual author(s) and contributor(s) and not of MDPI and/or the editor(s). MDPI and/or the editor(s) disclaim responsibility for any injury to people or property resulting from any ideas, methods, instructions or products referred to in the content. |
© 2023 by the authors. Licensee MDPI, Basel, Switzerland. This article is an open access article distributed under the terms and conditions of the Creative Commons Attribution (CC BY) license (https://creativecommons.org/licenses/by/4.0/).
Share and Cite
Zimatore, C.; Algera, A.G.; Botta, M.; Pierrakos, C.; Serpa Neto, A.; Grasso, S.; Schultz, M.J.; Pisani, L.; Paulus, F.; on behalf of the RELAx–Investigators. Lung Ultrasound to Determine the Effect of Lower vs. Higher PEEP on Lung Aeration in Patients without ARDS—A Substudy of a Randomized Clinical Trial. Diagnostics 2023, 13, 1989. https://doi.org/10.3390/diagnostics13121989
Zimatore C, Algera AG, Botta M, Pierrakos C, Serpa Neto A, Grasso S, Schultz MJ, Pisani L, Paulus F, on behalf of the RELAx–Investigators. Lung Ultrasound to Determine the Effect of Lower vs. Higher PEEP on Lung Aeration in Patients without ARDS—A Substudy of a Randomized Clinical Trial. Diagnostics. 2023; 13(12):1989. https://doi.org/10.3390/diagnostics13121989
Chicago/Turabian StyleZimatore, Claudio, Anna Geke Algera, Michela Botta, Charalampos Pierrakos, Ary Serpa Neto, Salvatore Grasso, Marcus J. Schultz, Luigi Pisani, Frederique Paulus, and on behalf of the RELAx–Investigators. 2023. "Lung Ultrasound to Determine the Effect of Lower vs. Higher PEEP on Lung Aeration in Patients without ARDS—A Substudy of a Randomized Clinical Trial" Diagnostics 13, no. 12: 1989. https://doi.org/10.3390/diagnostics13121989
APA StyleZimatore, C., Algera, A. G., Botta, M., Pierrakos, C., Serpa Neto, A., Grasso, S., Schultz, M. J., Pisani, L., Paulus, F., & on behalf of the RELAx–Investigators. (2023). Lung Ultrasound to Determine the Effect of Lower vs. Higher PEEP on Lung Aeration in Patients without ARDS—A Substudy of a Randomized Clinical Trial. Diagnostics, 13(12), 1989. https://doi.org/10.3390/diagnostics13121989