
Diagnostic Accuracy of Machine Learning Models on Mammography in Breast Cancer Classification: A Meta-Analysis


Abstract
:1. Introduction
2. Materials and Methods
2.1. Overview
2.2. Search Strategy
2.3. Selection Criteria
2.4. Data Extraction
2.5. Quality Assessment
2.6. Outcomes
2.7. Statistical Analysis
3. Results
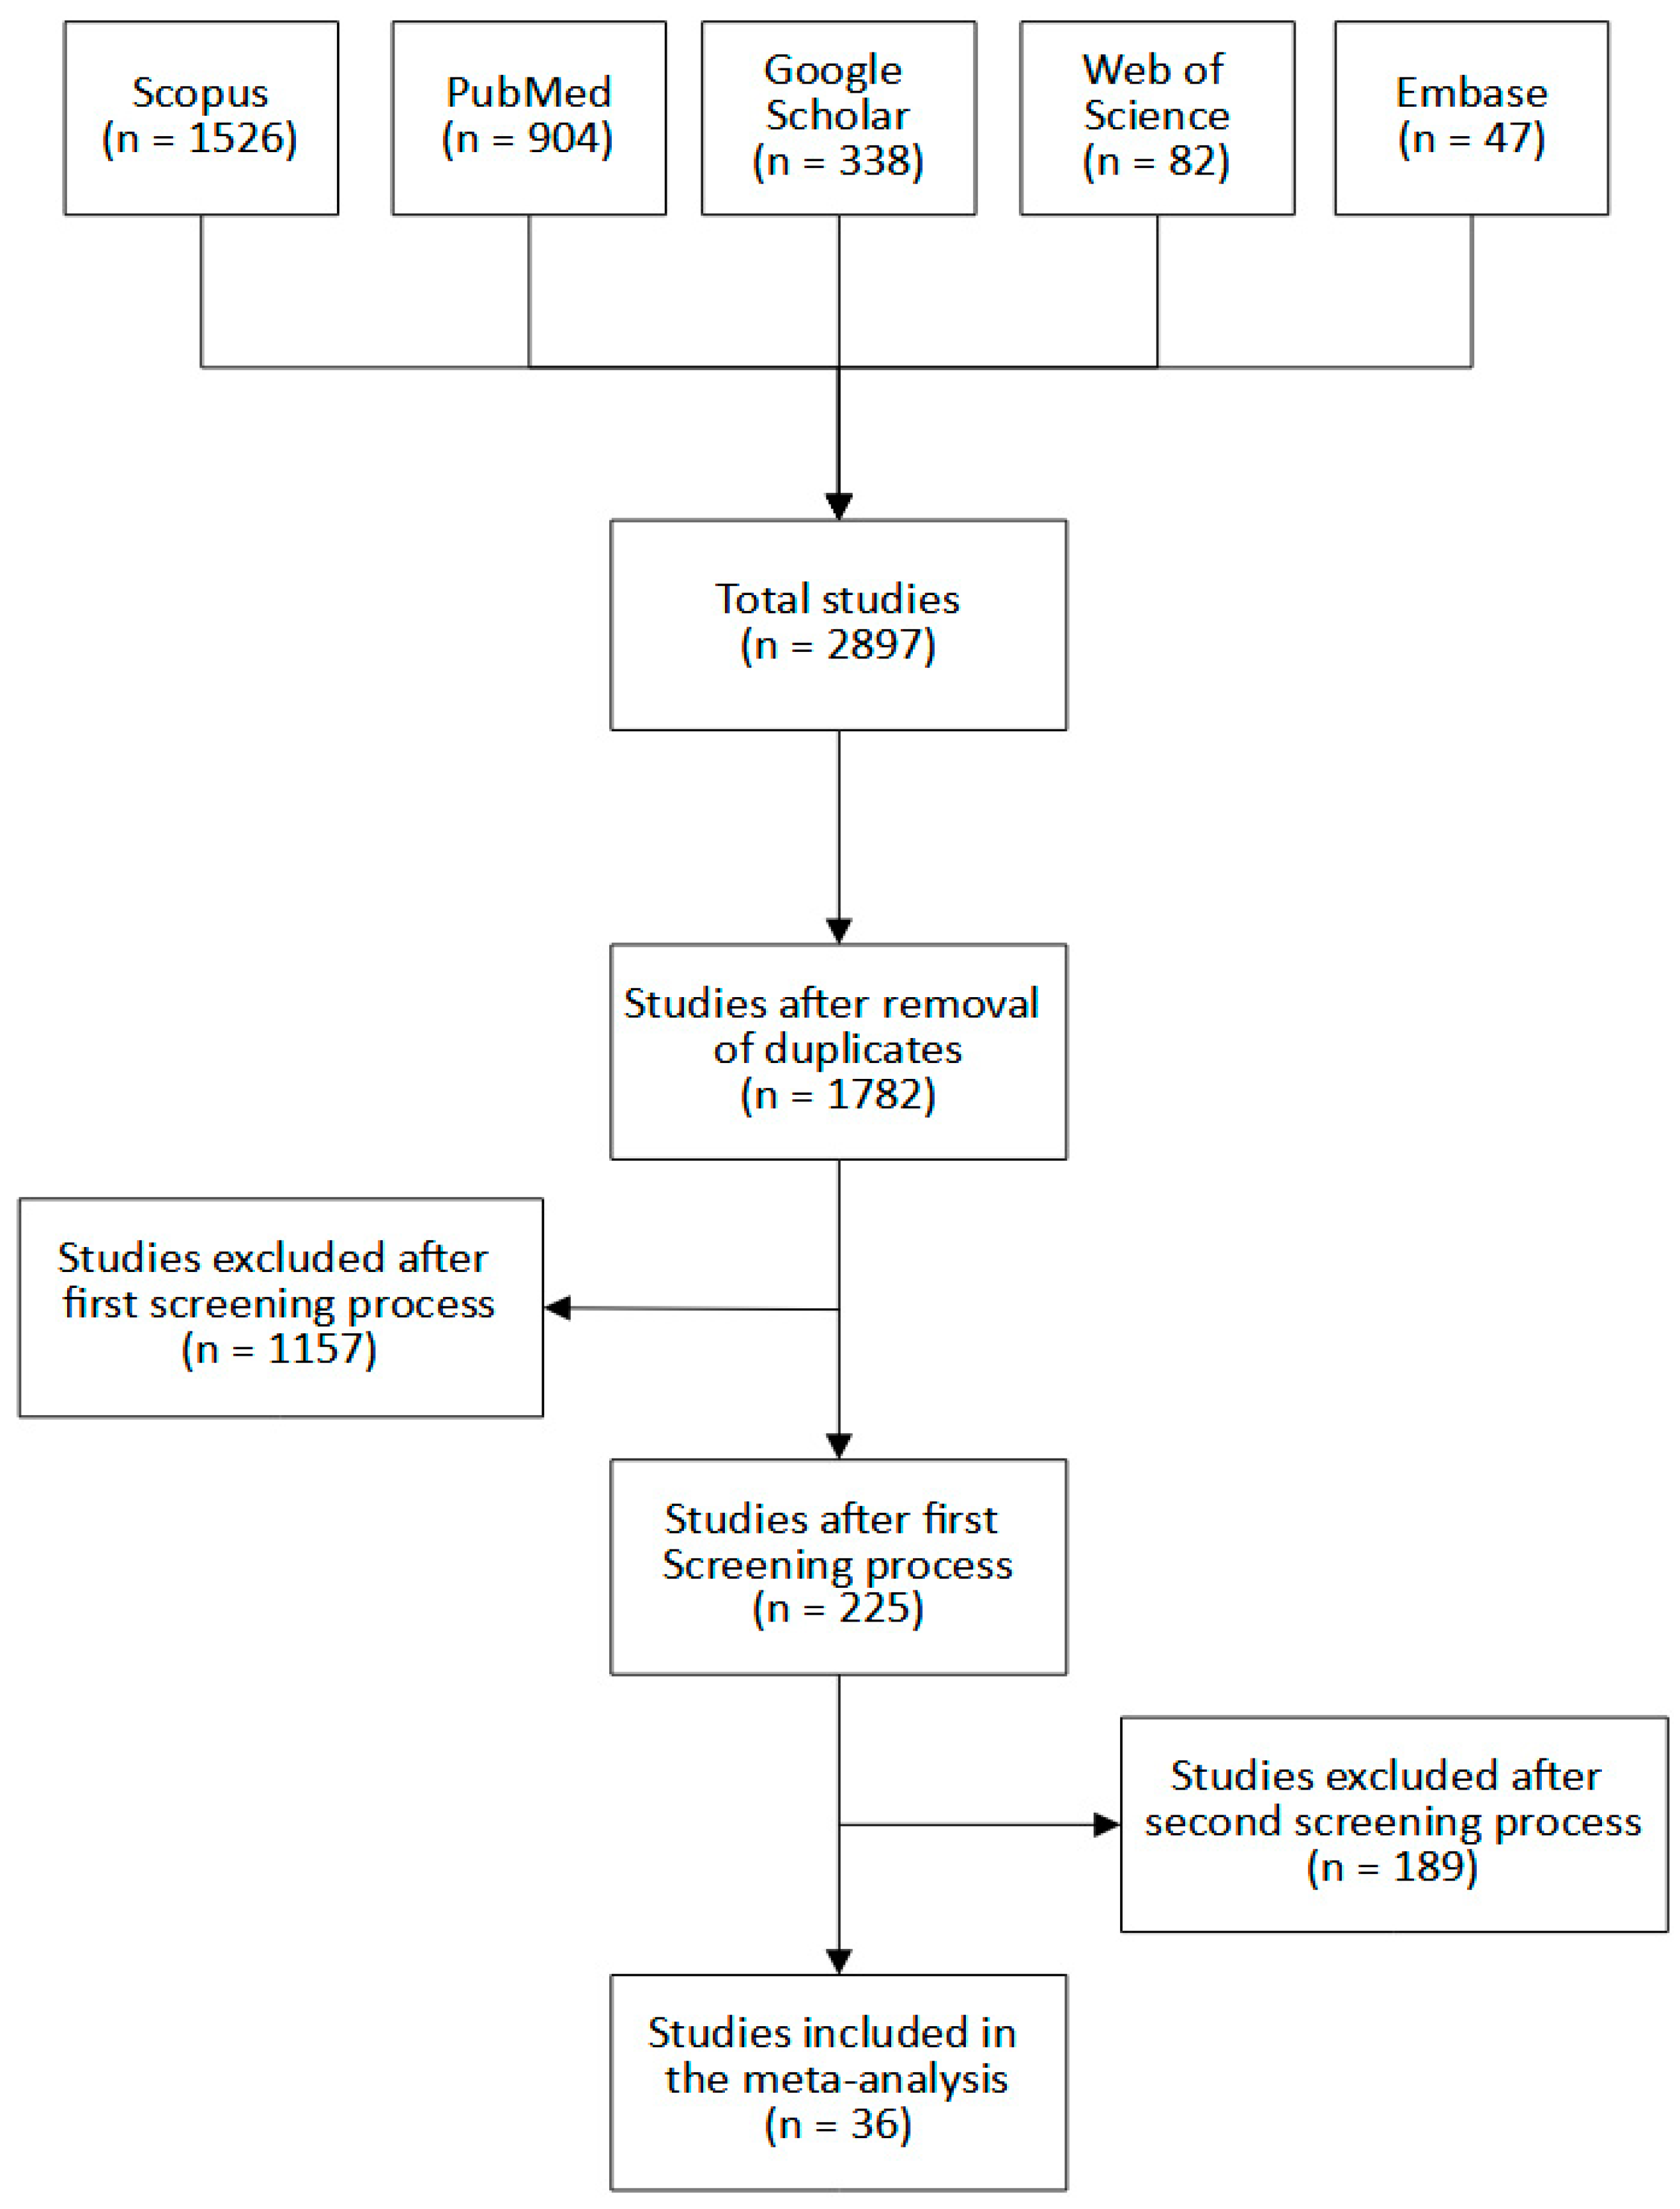
3.1. Eligible Studies
3.2. Study Characteristics
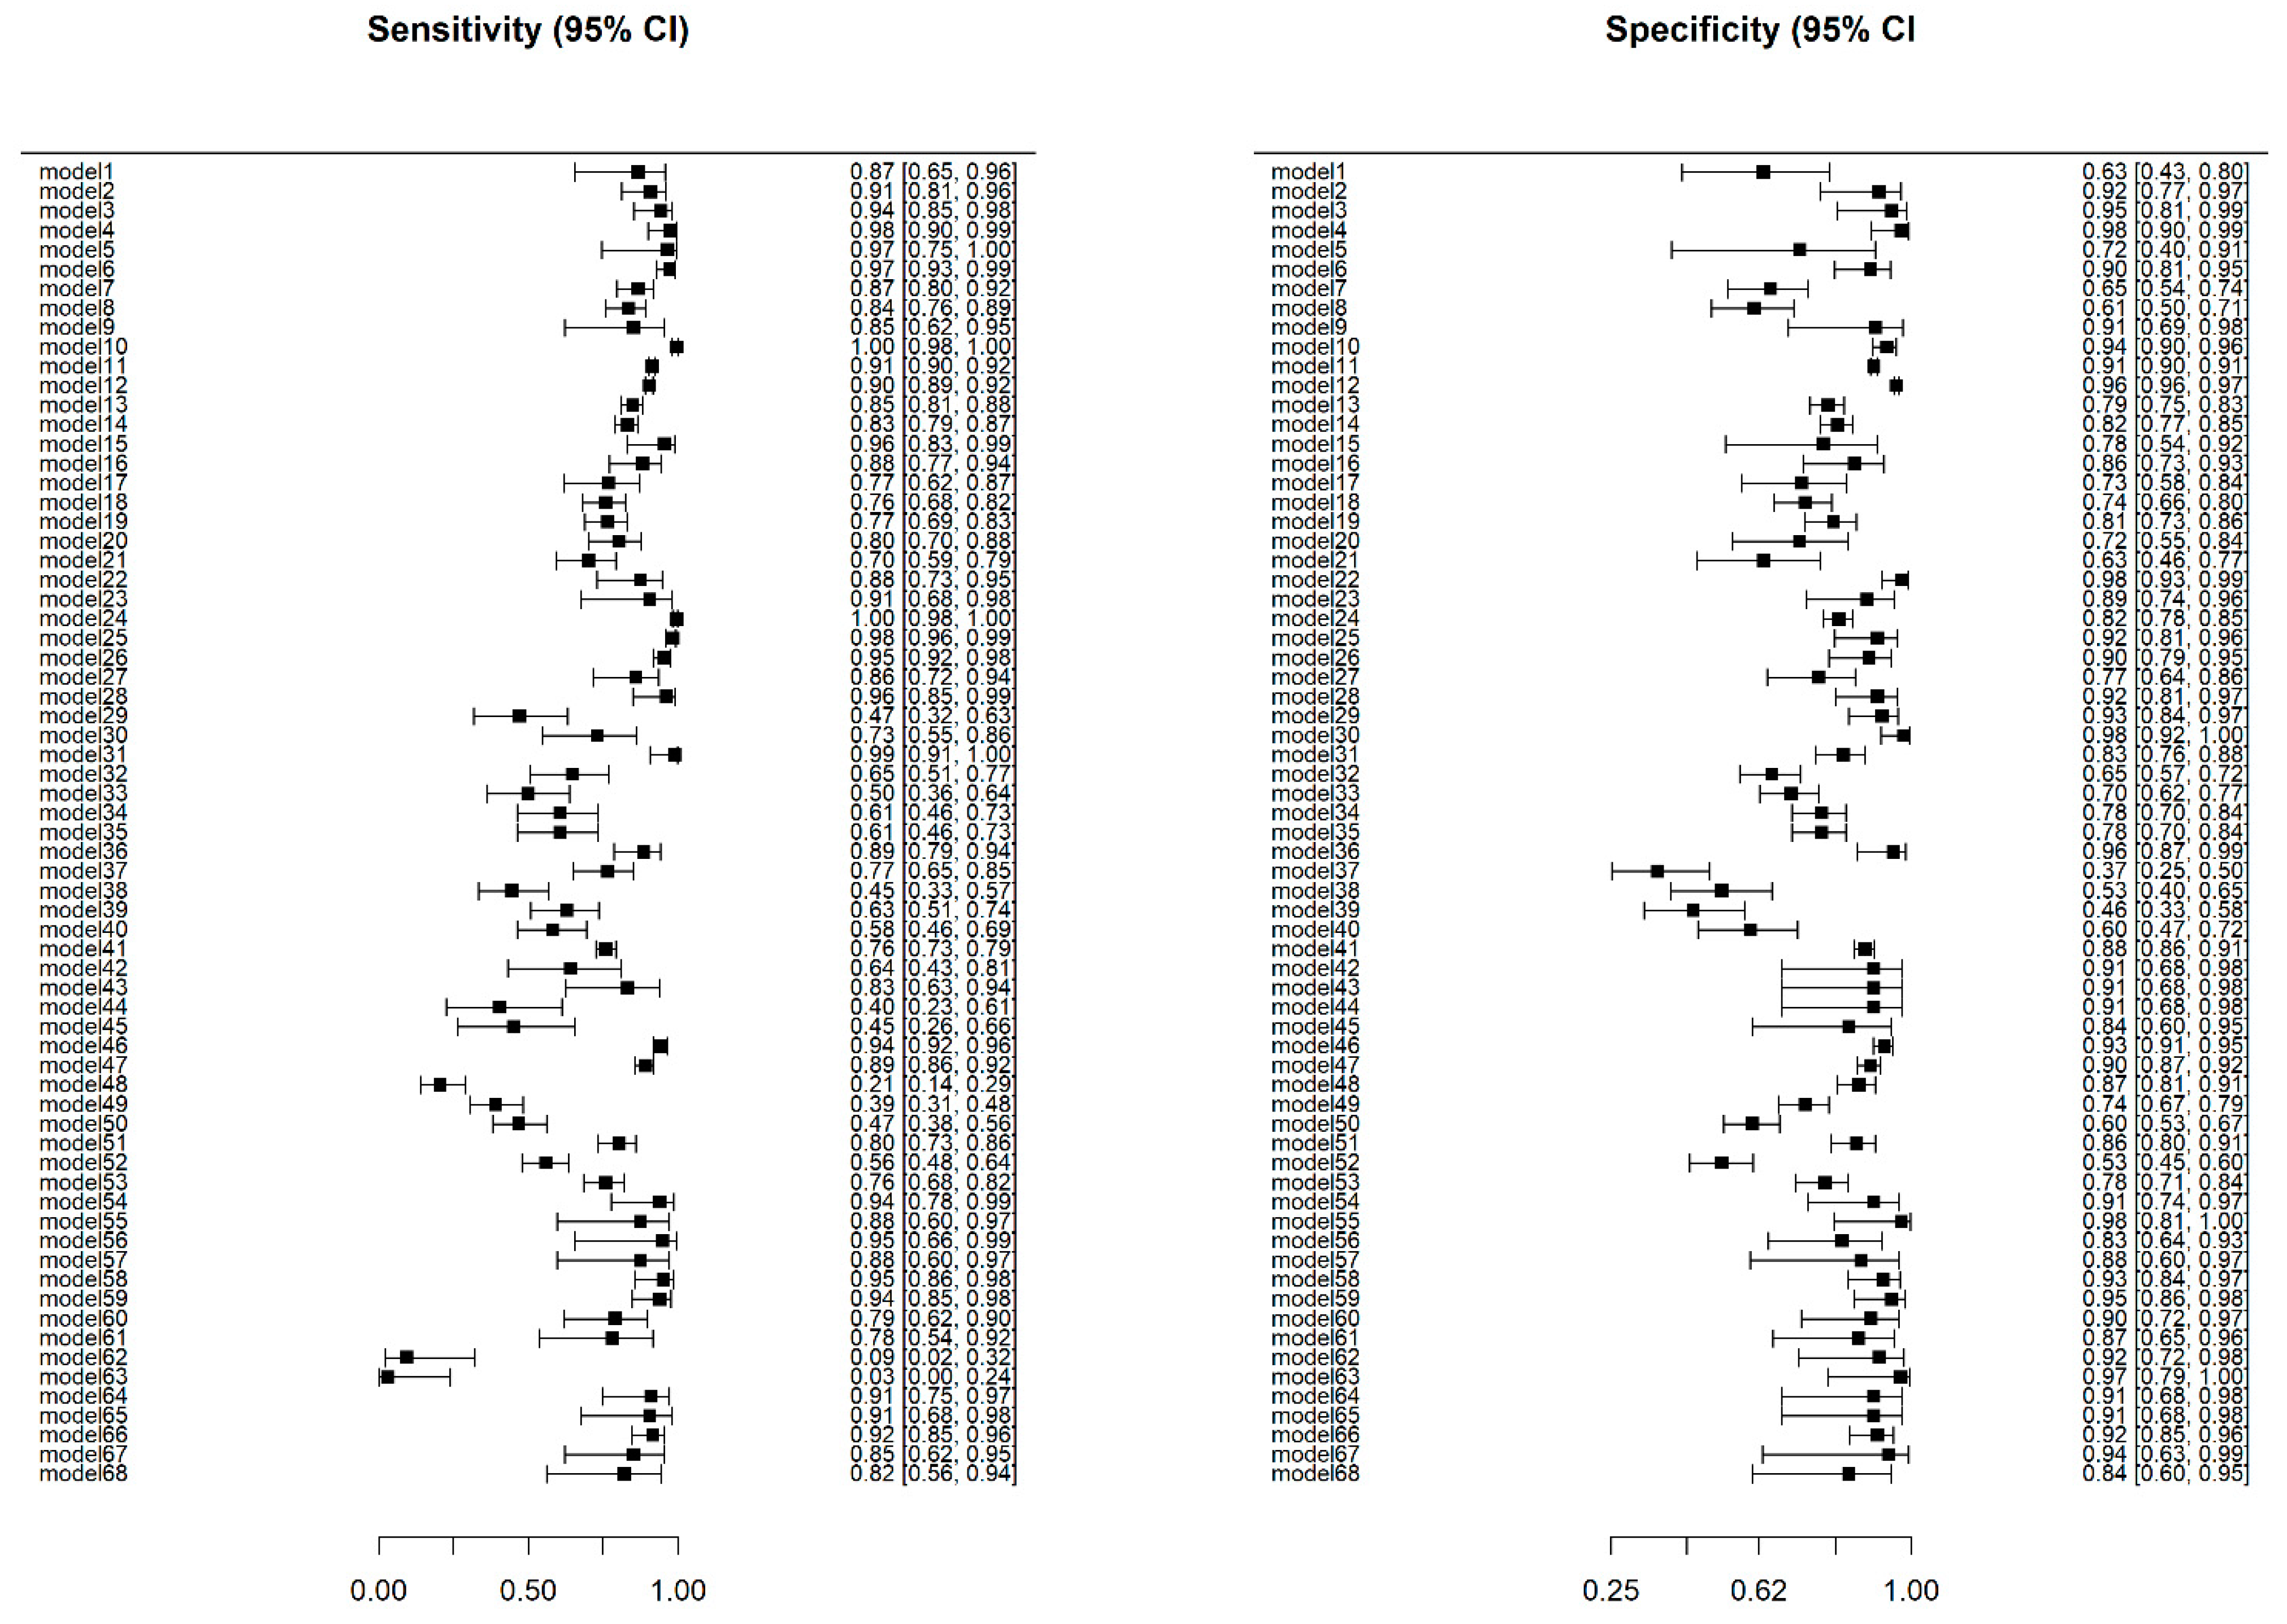
3.3. Descriptive Statistics
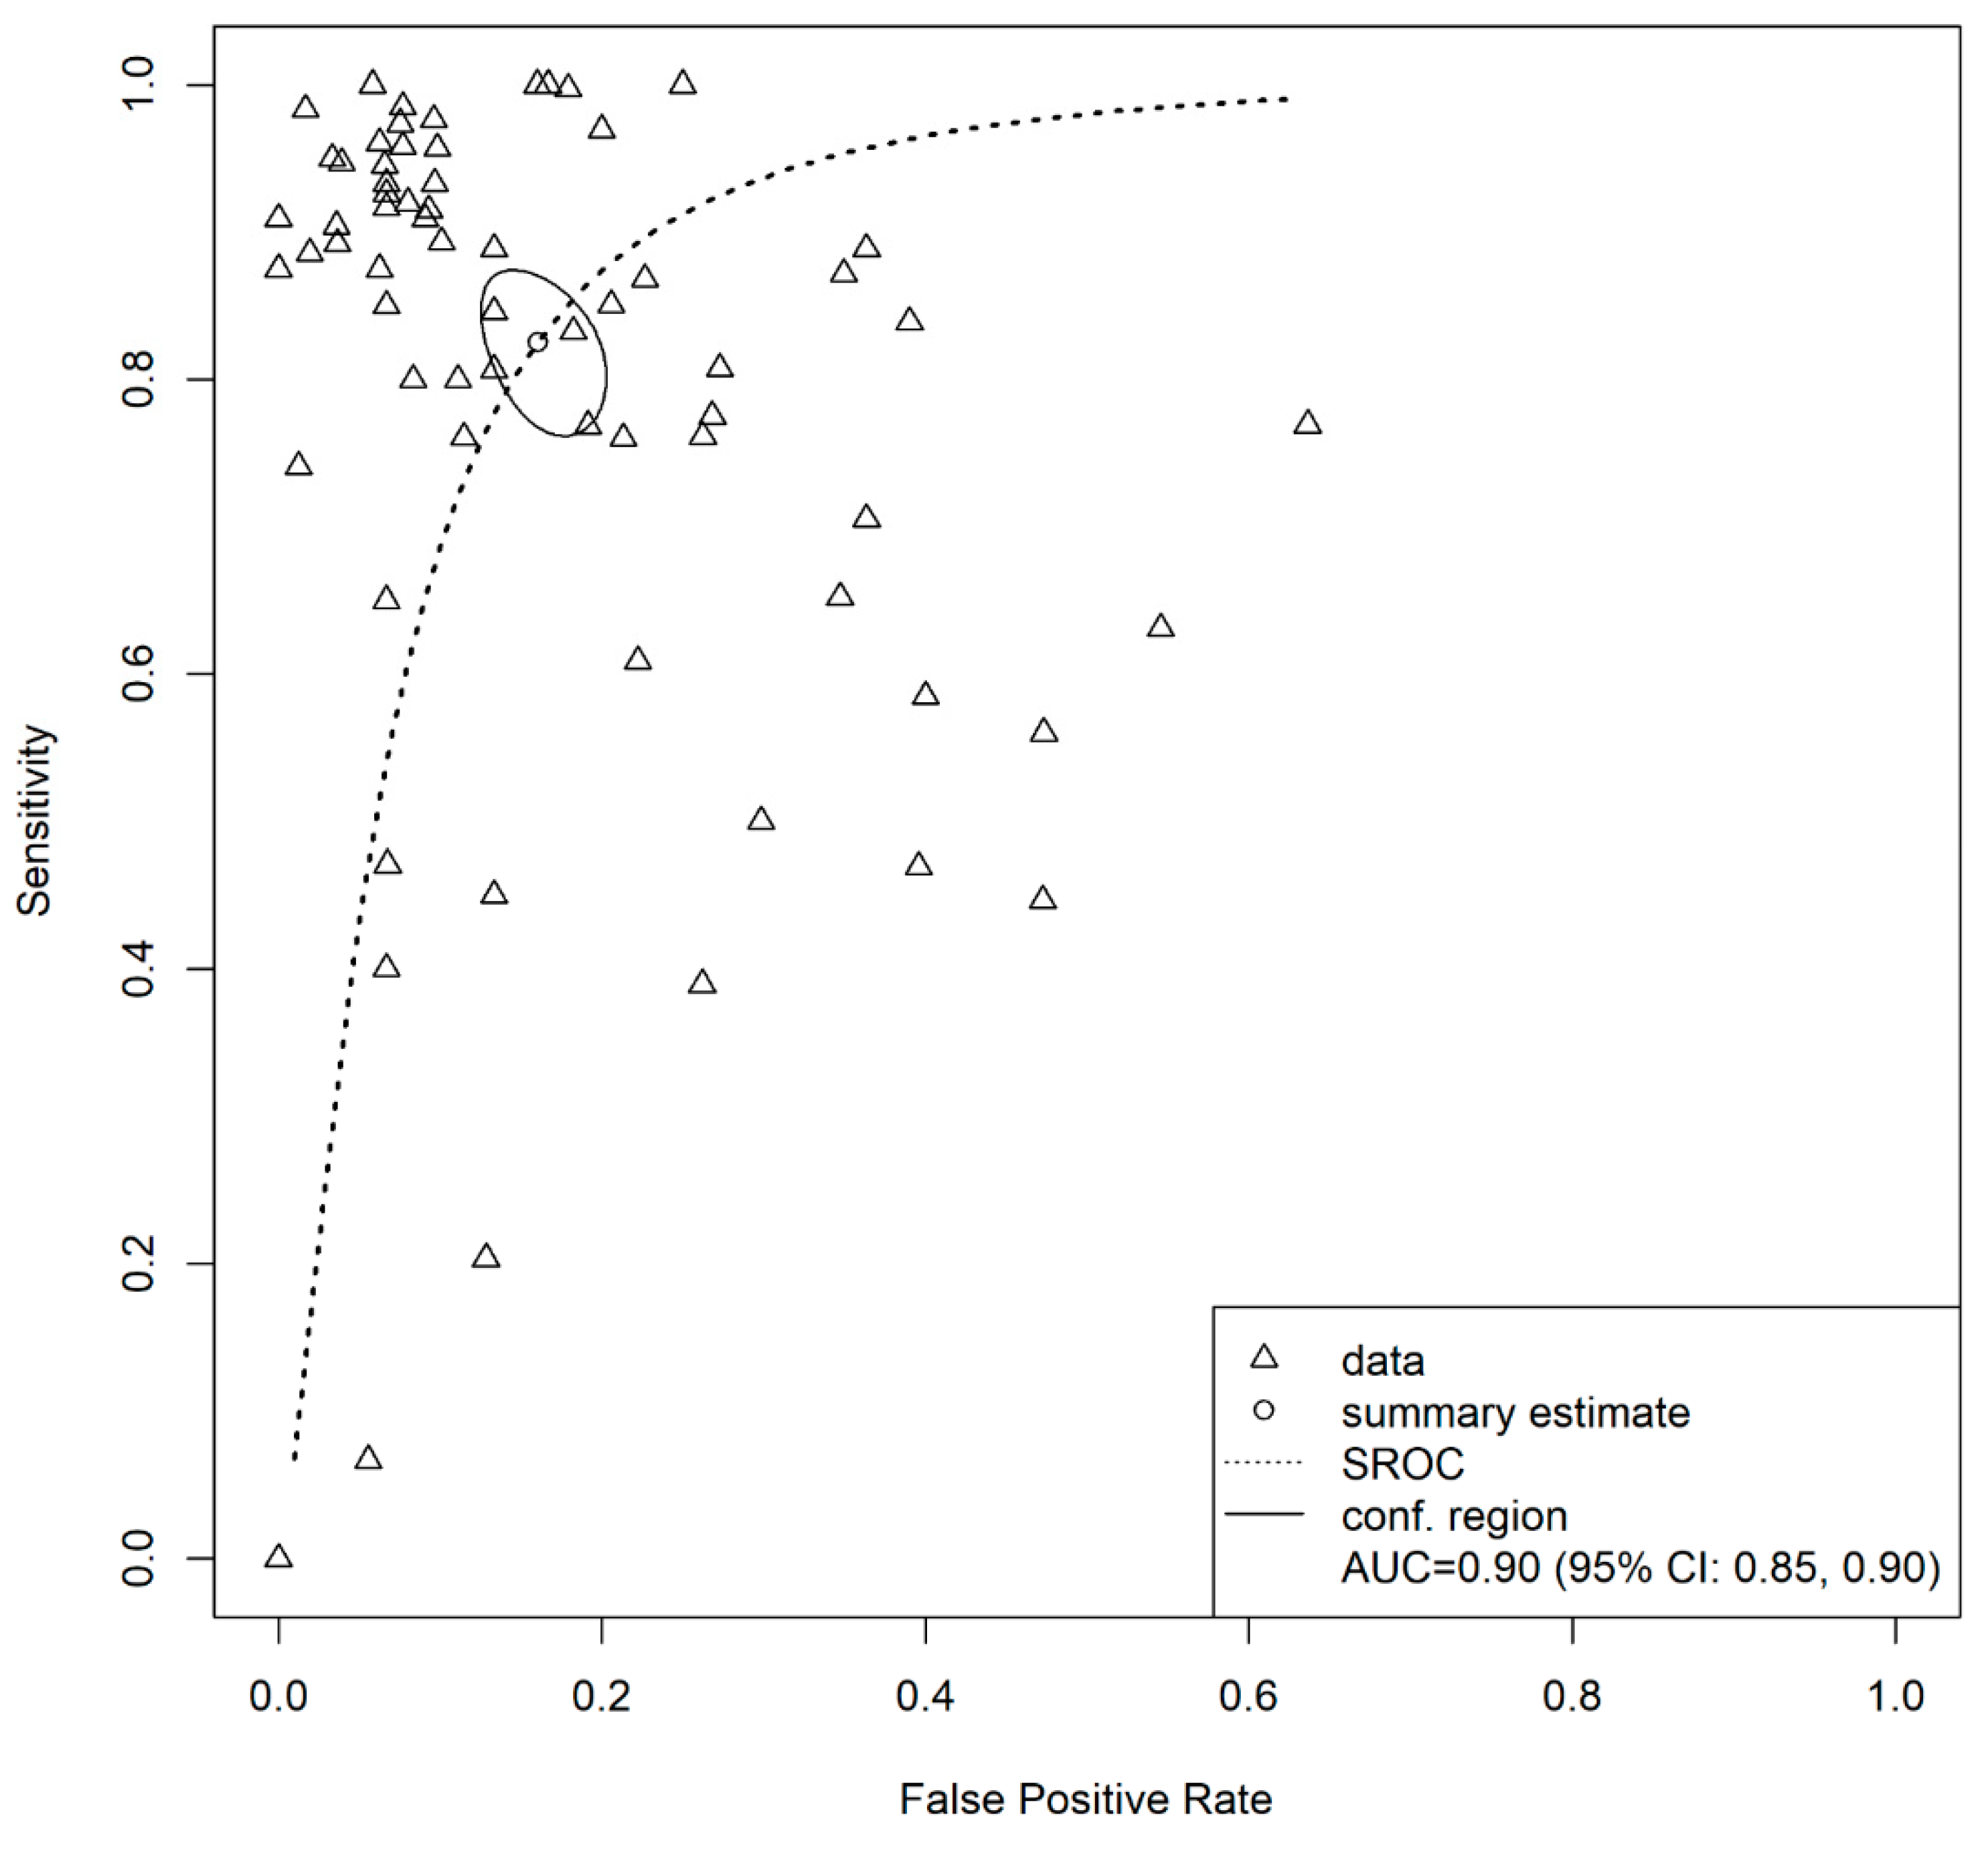
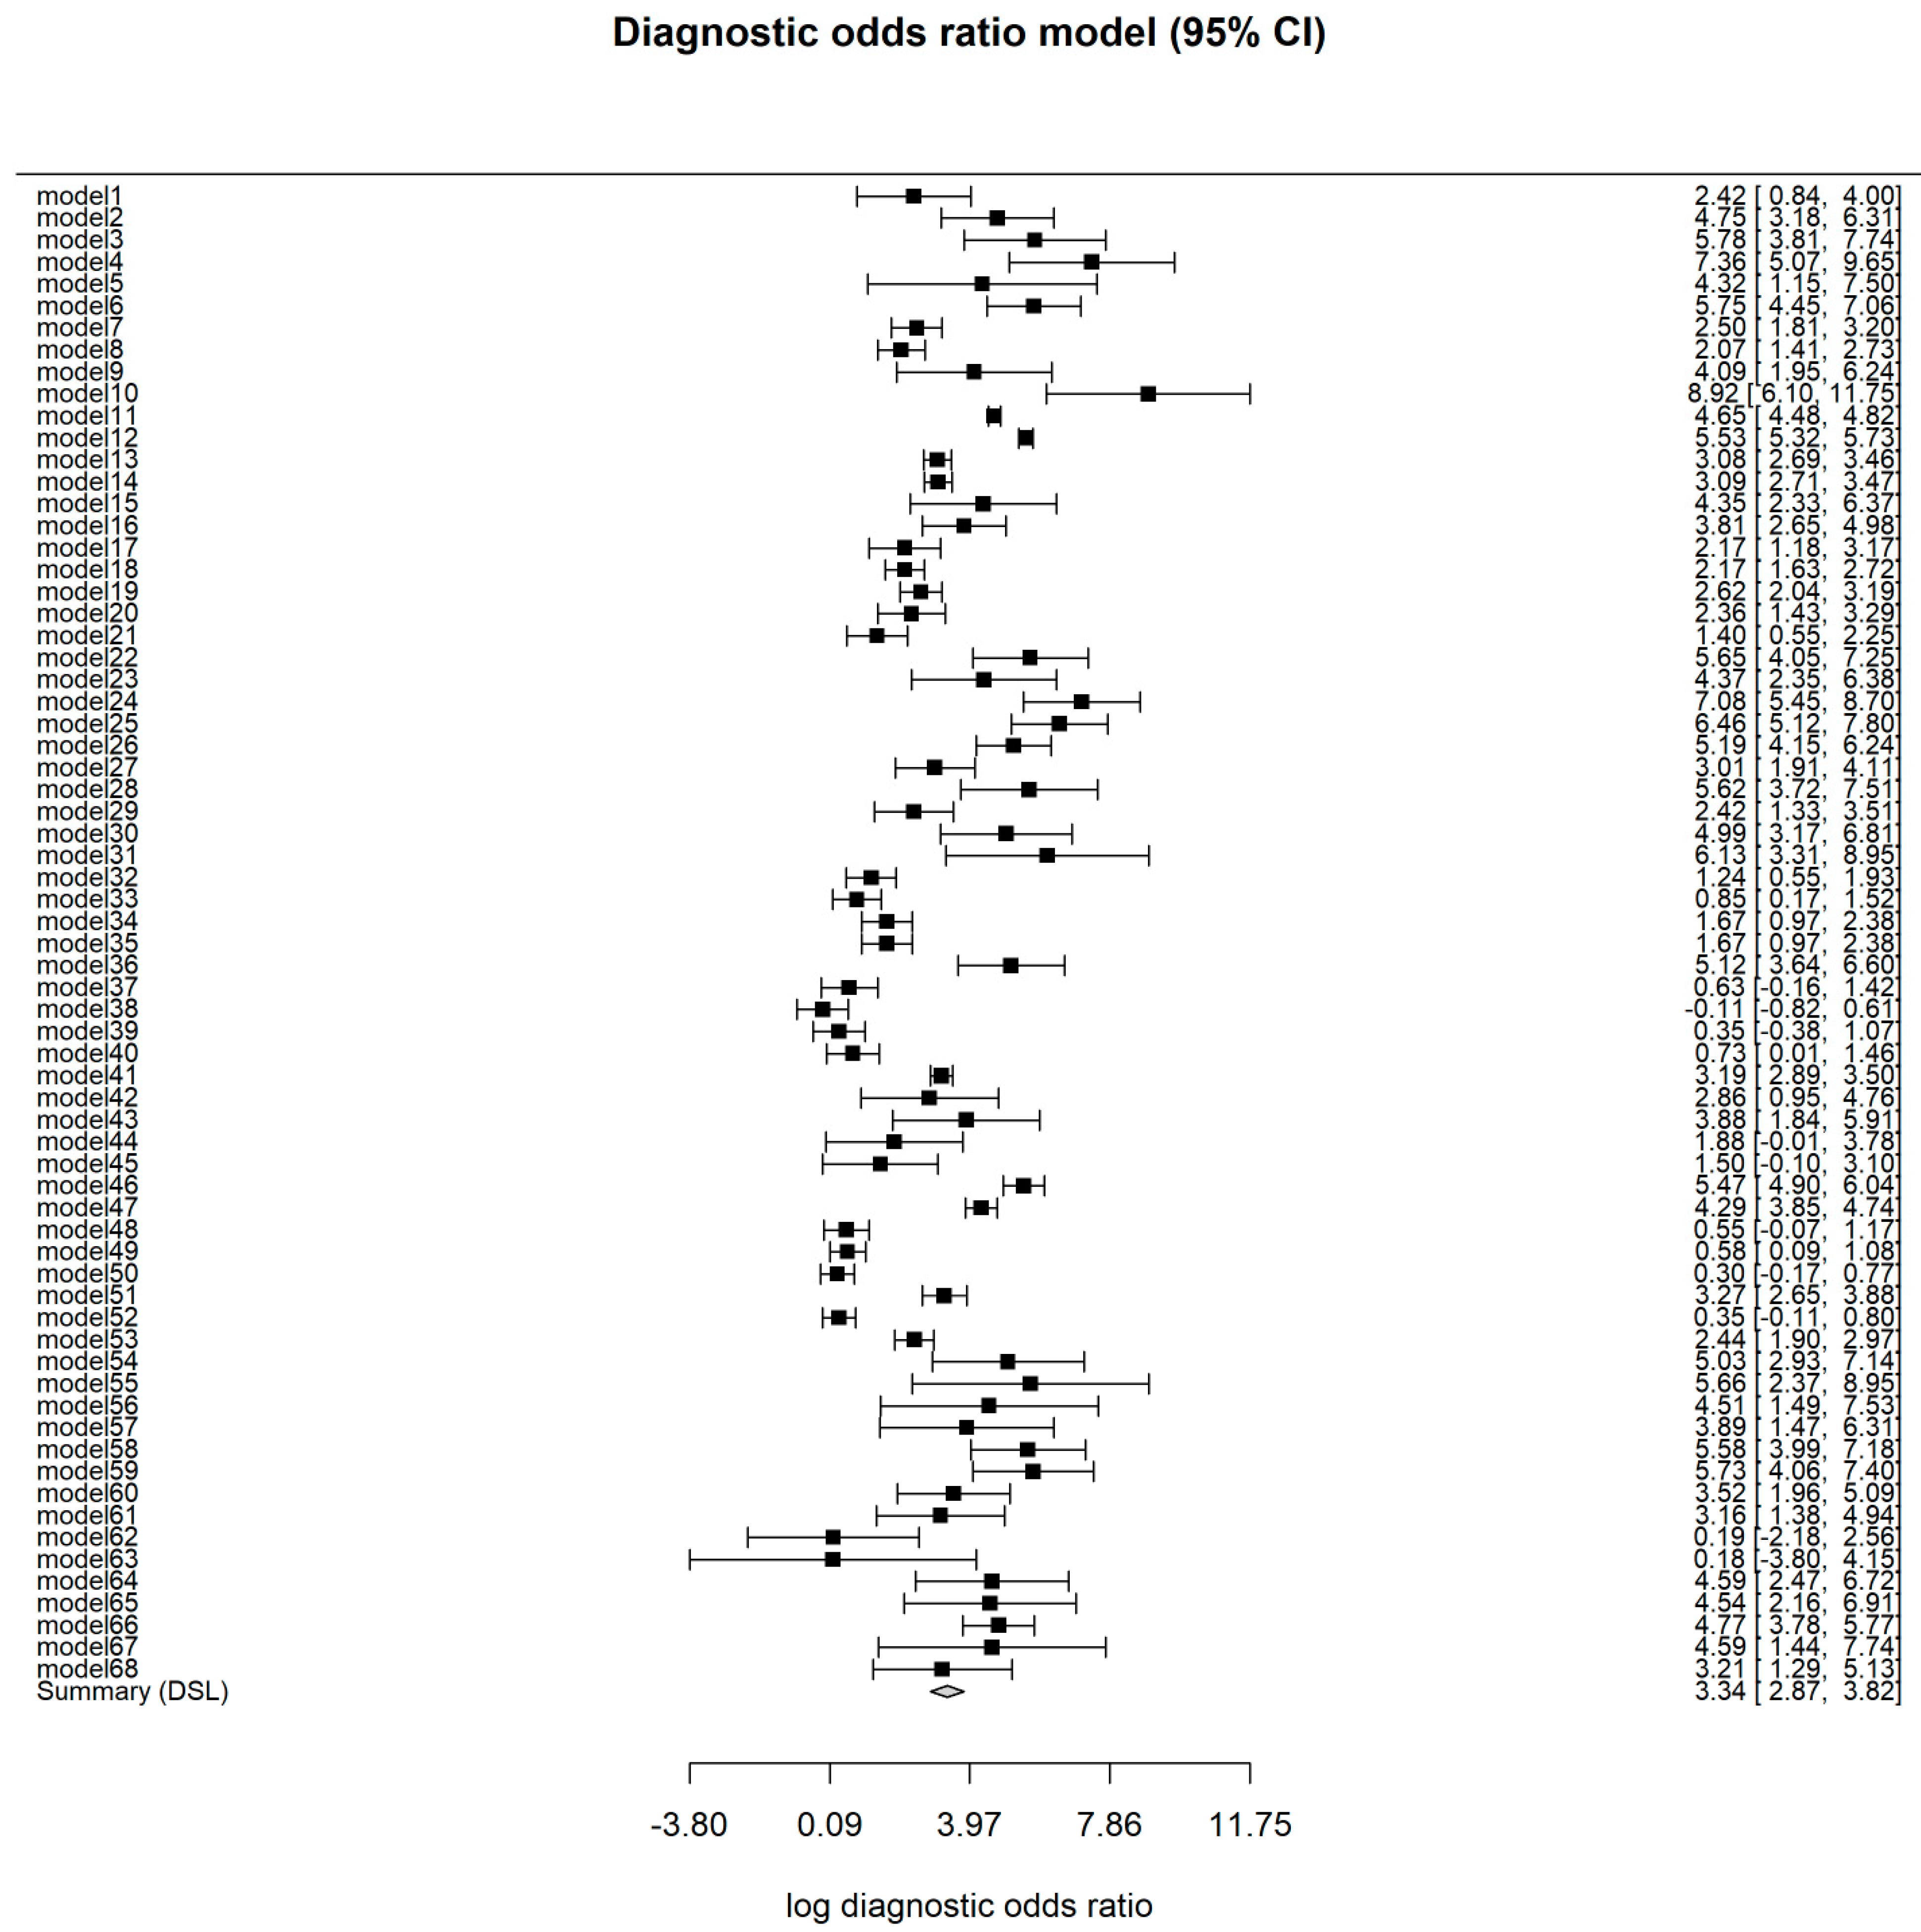
3.4. Overall Model
3.5. Test for Heterogeneity and Influential Diagnostics
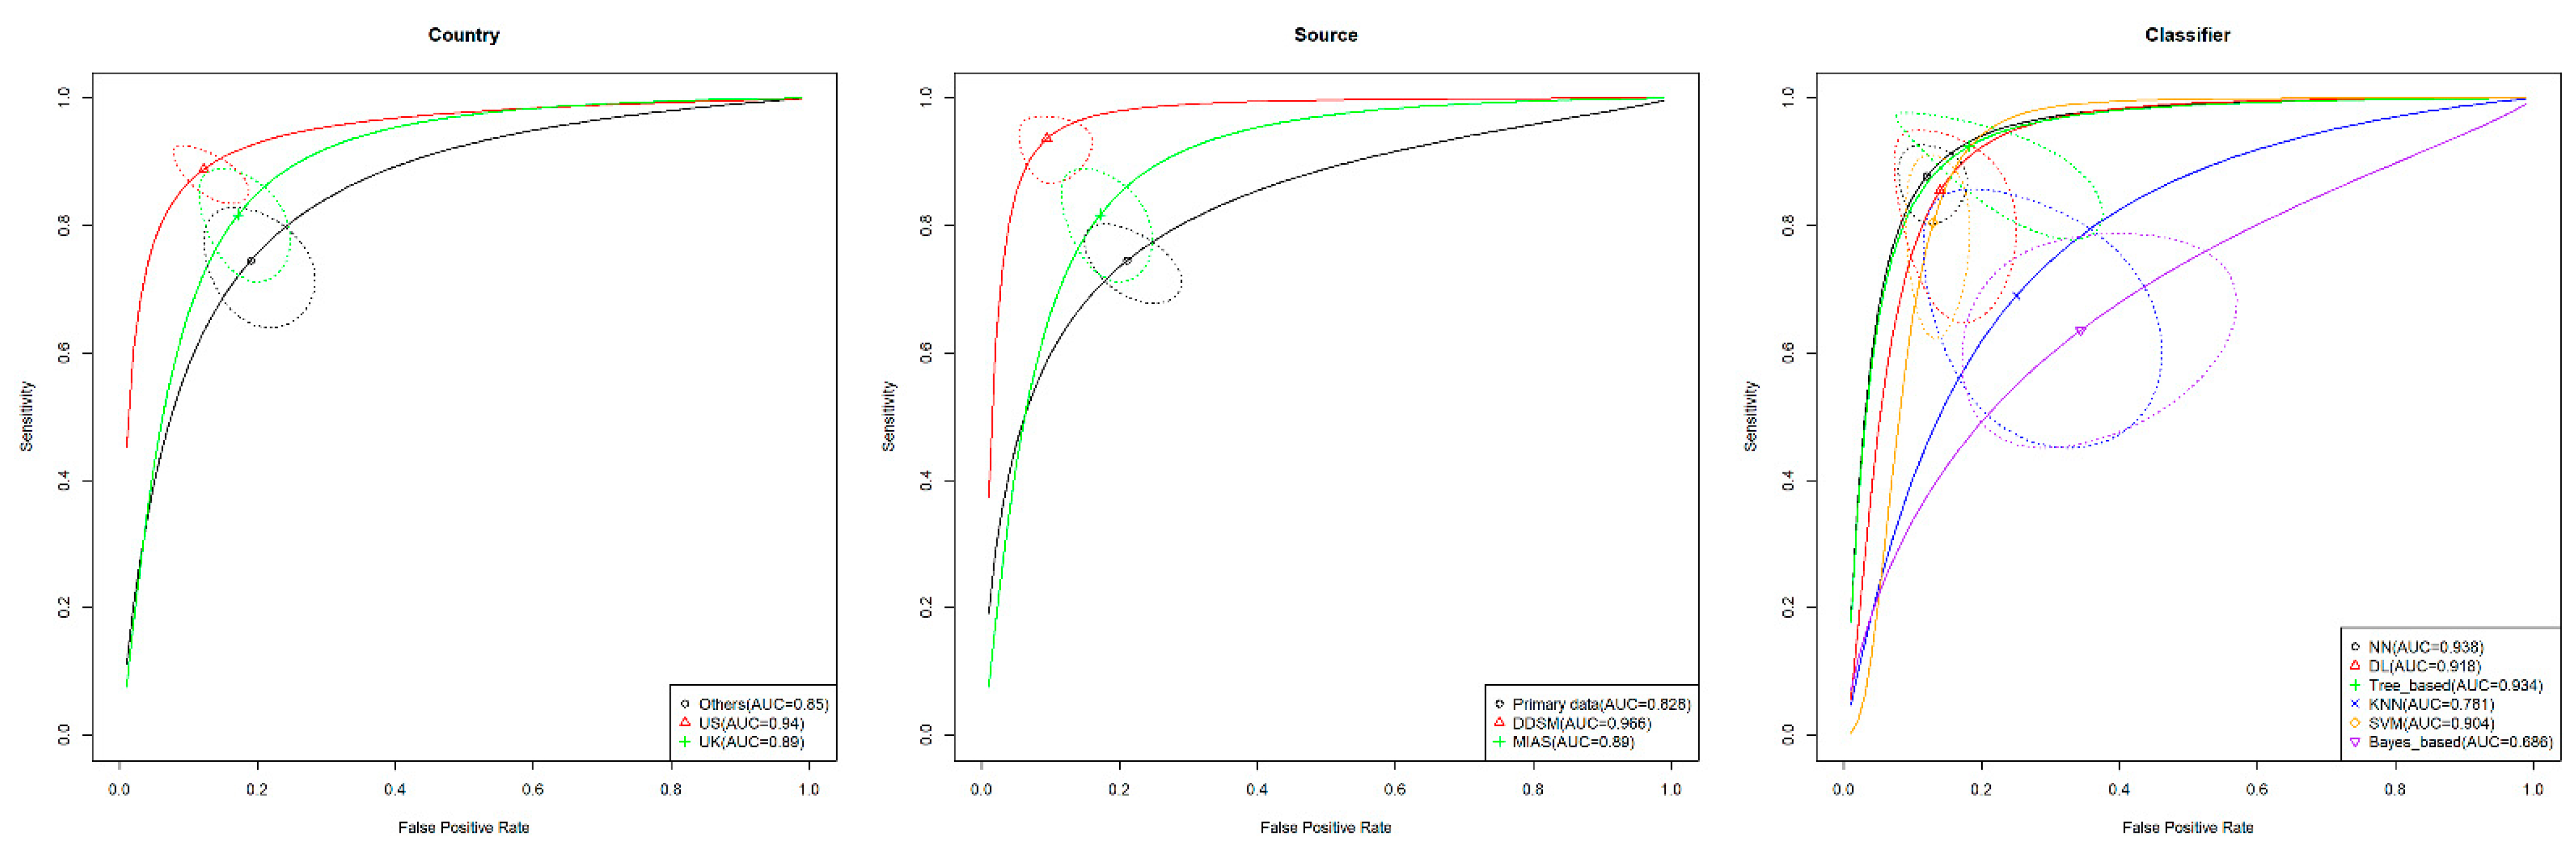
3.6. Subgroup Analysis
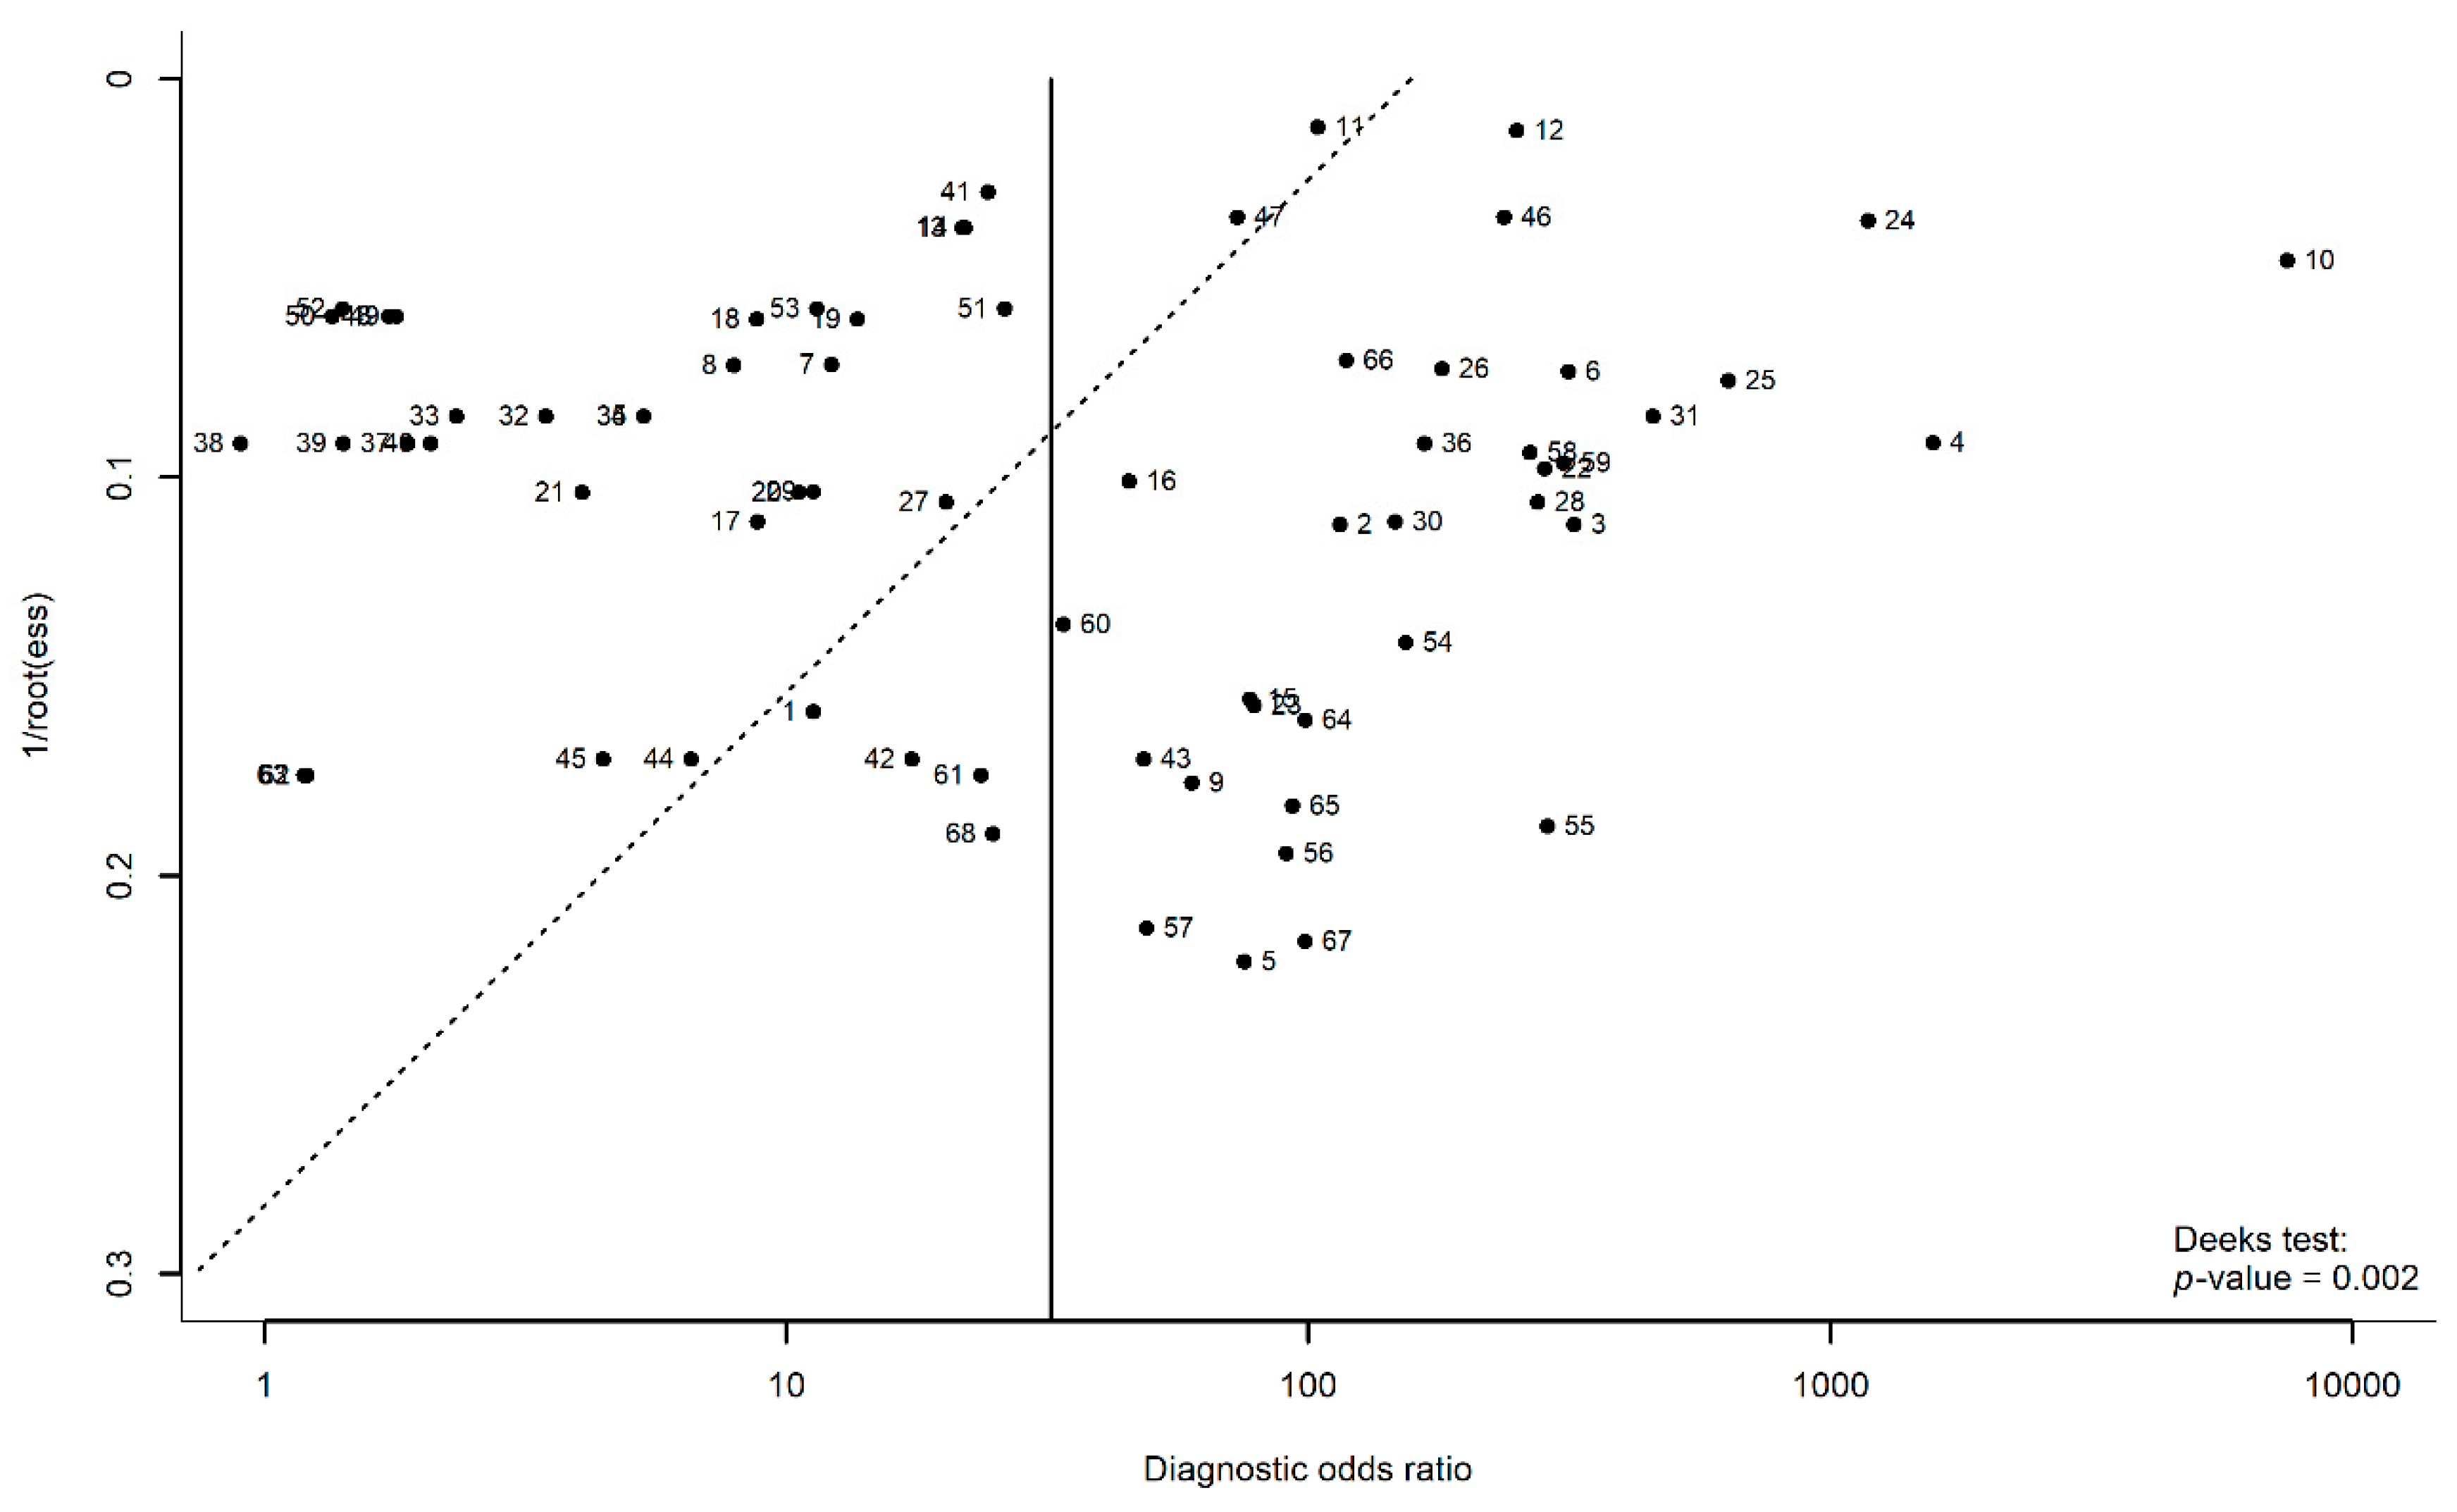
3.7. Publication Bias
3.8. Quality Assessment
4. Discussion
5. Conclusions
Supplementary Materials
Author Contributions
Funding
Institutional Review Board Statement
Informed Consent Statement
Data Availability Statement
Conflicts of Interest
References
- Sung, H.; Ferlay, J.; Siegel, R.L.; Laversanne, M.; Soerjomataram, I.; Jemal, A.; Bray, F. Global cancer statistics 2020: GLOBOCAN estimates of incidence and mortality worldwide for 36 cancers in 185 countries. CA Cancer J. Clin. 2021, 71, 209–249. [Google Scholar] [CrossRef] [PubMed]
- World Health Organization. Breast Cancer. Available online: https://www.who.int/news-room/fact-sheets/detail/breast-cancer (accessed on 19 July 2021).
- Hamashima, C.; Hattori, M.; Honjo, S.; Kasahara, Y.; Katayama, T.; Nakai, M.; Nakayama, T.; Morita, T.; Ohta, K.; Ohnuki, K.; et al. The Japanese guidelines for breast cancer screening. Jpn. J. Clin. Oncol. 2016, 46, 482–492. [Google Scholar] [CrossRef] [PubMed] [Green Version]
- Duffy, S.W.; Tabár, L.; Yen, A.M.F.; Dean, P.B.; Smith, R.A.; Jonsson, H.; Törnberg, S.; Chen, S.L.S.; Chiu, S.Y.H.; Fann, J.C.Y.; et al. Mammography screening reduces rates of advanced and fatal breast cancers: Results in 549,091 women. Cancer 2020, 126, 2971–2979. [Google Scholar] [CrossRef] [PubMed]
- Wang, L. Early diagnosis of breast cancer. Sensors 2017, 17, 1572. [Google Scholar] [CrossRef] [Green Version]
- Gilbert, F.J.; Pinker-Domening, K. Diagnosis and staging of breast cancer: When and how to use mammography, tomosynthesis, ultrasound, contrast-enhanced mammography, and magnetic resonance imaging. In Diseases of the Chest, Breast, Heart and Vessels 2019–2022 Diagnostic and Interventional Imaging; Hodler, J., Kubik-Huch, R.A., Von Schulthess, G.K., Eds.; Springer: Zurich, Switzerland, 2019; pp. 155–166. ISBN 9783030111496. [Google Scholar]
- Hofvind, S.; Holen, Å.S.; Aase, H.S.; Houssami, N.; Sebuødegård, S.; Moger, T.A.; Haldorsen, I.S.; Akslen, L.A. Two-view digital breast tomosynthesis versus digital mammography in a population-based breast cancer screening programme (To-Be): A randomised, controlled trial. Lancet Oncol. 2019, 20, 795–805. [Google Scholar] [CrossRef]
- Ahuja, A.S. The impact of artificial intelligence in medicine on the future role of the physician. PeerJ 2019, 7, e7702. [Google Scholar] [CrossRef]
- Abdullah, R.; Fakieh, B. Health care employees’ perceptions of the use of artificial intelligence applications: Survey study. J. Med. Internet Res. 2020, 22, 1–8. [Google Scholar] [CrossRef]
- Doraiswamy, P.M.; Blease, C.; Bodner, K. Artificial intelligence and the future of psychiatry: Insights from a global physician survey. Artif. Intell. Med. 2020, 102, 101753. [Google Scholar] [CrossRef]
- Blease, C.; Kaptchuk, T.J.; Bernstein, M.H.; Mandl, K.D.; Halamka, J.D.; DesRoches, C.M. Artificial intelligence and the future of primary care: Exploratory qualitative study of UK general practitioners’ views. J. Med. Internet Res. 2019, 21, 1–10. [Google Scholar] [CrossRef]
- Meskó, B.; Görög, M. A short guide for medical professionals in the era of artificial intelligence. NPJ Digit. Med. 2020, 3, 126. [Google Scholar] [CrossRef]
- Kelly, C.J.; Karthikesalingam, A.; Suleyman, M.; Corrado, G.; King, D. Key challenges for delivering clinical impact with artificial intelligence. BMC Med. 2019, 17, 195. [Google Scholar] [CrossRef] [PubMed] [Green Version]
- Asan, O.; Bayrak, A.E.; Choudhury, A. Artificial intelligence and human trust in healthcare: Focus on clinicians. J. Med. Internet Res. 2020, 22, 1–7. [Google Scholar] [CrossRef] [PubMed]
- Sadoughi, F.; Kazemy, Z.; Hamedan, F.; Owji, L.; Rahmanikatigari, M.; Azadboni, T.T. Artificial intelligence methods for the diagnosis of breast cancer by image processing: A review. Breast Cancer 2018, 10, 219–230. [Google Scholar] [CrossRef] [PubMed] [Green Version]
- Abreu, P.H.; Santos, M.S.; Abreu, M.H.; Andrade, B.; Silva, D.C. Predicting breast cancer recurrence using machine learning techniques: A systematic review. ACM Comput. Surv. 2016, 49, 1–40. [Google Scholar] [CrossRef]
- Li, J.; Zhou, Z.; Dong, J.; Fu, Y.; Li, Y.; Luan, Z.; Peng, X. Predicting breast cancer 5-year survival using machine learning: A systematic review. PLoS ONE 2021, 16, 1–23. [Google Scholar] [CrossRef]
- Tabl, A.A.; Alkhateeb, A.; ElMaraghy, W.; Rueda, L.; Ngom, A. A Machine Learning Approach for Identifying Gene Biomarkers Guiding the Treatment of Breast Cancer. Front. Genet. 2019, 10, 256. [Google Scholar] [CrossRef] [Green Version]
- Alaa, A.M.; Gurdasani, D.; Harris, A.L.; Rashbass, J.; van der Schaar, M. Machine learning to guide the use of adjuvant therapies for breast cancer. Nat. Mach. Intell. 2021, 3, 716–726. [Google Scholar] [CrossRef]
- Yassin, N.I.R.; Omran, S.; El Houby, E.M.F.; Allam, H. Machine learning techniques for breast cancer computer aided diagnosis using different image modalities: A systematic review. Comput. Methods Programs Biomed. 2018, 156, 25–45. [Google Scholar] [CrossRef]
- McInnes, M.D.F.; Moher, D.; Thombs, B.D.; McGrath, T.A.; Bossuyt, P.M.; Clifford, T.; Cohen, J.F.; Deeks, J.J.; Gatsonis, C.; Hooft, L.; et al. Preferred reporting items for a systematic review and meta-analysis of diagnostic test accuracy studies. JAMA 2018, 319, 388. [Google Scholar] [CrossRef]
- Sotiriadis, A.; Papatheodorou, S.I.; Martins, W.P. Synthesizing evidence from diagnostic accuracy tests: The SEDATE guideline. Ultrasound Obstet. Gynecol. 2016, 47, 386–395. [Google Scholar] [CrossRef] [Green Version]
- Reitsma, J.B.; Leeflang, M.M.G.; Sterne, J.A.C.; Bossuyt, P.M.M.; Whiting, P.F.; Rutjes, A.W.S.S.; Westwood, M.E.; Mallet, S.; Deeks, J.J.; Reitsma, J.B.; et al. QUADAS-2: A revised tool for the quality assessment of diagnostic accuracy studies. Ann. Intern. Med. 2011, 155, 529–536. [Google Scholar]
- R Core Team. R: A Language and Environment for Statistical Computing. 2021. [Google Scholar]
- R codes for “Diagnostic Accuracy of Machine Learning Models on Mammography in Breast Cancer Classification: A Meta-Analysis”. Available online: https://doi.org/10.5281/zenodo.6786424 (accessed on 1 July 2022).
- Doebler, P. MADA: Meta-Analysis of Diagnostic Accuracy. 2020. [Google Scholar]
- Viechtbauer, W. Conducting meta-analyses in R with the metafor package. J. Stat. Softw. 2010, 36, 1–48. [Google Scholar] [CrossRef] [Green Version]
- Reitsma, J.B.; Glas, A.S.; Rutjes, A.W.S.; Scholten, R.J.P.M.; Bossuyt, P.M.; Zwinderman, A.H. Bivariate analysis of sensitivity and specificity produces informative summary measures in diagnostic reviews. J. Clin. Epidemiol. 2005, 58, 982–990. [Google Scholar] [CrossRef] [PubMed]
- Noma, H.; Matsushima, Y.; Ishii, R. Confidence interval for the AUC of SROC curve and some related methods using bootstrap for meta-analysis of diagnostic accuracy studies. Commun. Stat. Case Stud. Data Anal. Appl. 2021, 7, 1–15. [Google Scholar] [CrossRef]
- Shim, S.R.; Kim, S.-J.; Lee, J. Diagnostic test accuracy: Application and practice using R software. Epidemiol. Health 2019, 41, 1–8. [Google Scholar] [CrossRef]
- Lee, J.; Kim, K.W.; Choi, S.H.; Huh, J.; Park, S.H. Systematic review and meta-analysis of studies evaluating diagnostic test accuracy: A practical review for clinical researchers-Part II. Statistical methods of meta-analysis. Korean J. Radiol. 2015, 16, 1188. [Google Scholar] [CrossRef] [Green Version]
- Deeks, J.J.; Macaskill, P.; Irwig, L. The performance of tests of publication bias and other sample size effects in systematic reviews of diagnostic test accuracy was assessed. J. Clin. Epidemiol. 2005, 58, 882–893. [Google Scholar] [CrossRef]
- van Enst, W.A.; Ochodo, E.; Scholten, R.J.; Hooft, L.; Leeflang, M.M. Investigation of publication bias in meta-analyses of diagnostic test accuracy: A meta-epidemiological study. BMC Med. Res. Methodol. 2014, 14, 70. [Google Scholar] [CrossRef] [Green Version]
- Abdolmaleki, P.; Guiti, M.; Tahmasebi, M. Neural network analysis of breast cancer from mammographic evaluation. Iran. J. Radiol. 2006, 3, 155–162. [Google Scholar]
- Acharya, U.R.; Ng, E.Y.K.; Chang, Y.H.; Yang, J.; Kaw, G.J.L. Computer-based identification of breast cancer using digitized mammograms. J. Med. Syst. 2008, 32, 499–507. [Google Scholar] [CrossRef]
- Al-Antari, M.A.; Han, S.-M.; Kim, T.-S. Evaluation of deep learning detection and classification towards computer-aided diagnosis of breast lesions in digital X-ray mammograms. Comput. Methods Programs Biomed. 2020, 196, 105584. [Google Scholar] [CrossRef] [PubMed]
- Alfifi, M.; Shady, M.; Bataineh, S.; Mezher, M. Enhanced artificial intelligence system for diagnosing and predicting breast cancer using deep learning. Int. J. Adv. Comput. Sci. Appl. 2020, 11, 498–513. [Google Scholar] [CrossRef]
- Al-Hiary, H.; Alhadidi, B.; Braik, M. An implemented approach for potentially breast cancer detection using extracted features and artificial neural networks. Comput. Inform. 2012, 31, 225–244. [Google Scholar]
- Al-masni, M.A.; Al-antari, M.A.; Park, J.-M.; Gi, G.; Kim, T.-Y.; Rivera, P.; Valarezo, E.; Choi, M.-T.; Han, S.-M.; Kim, T.-S. Simultaneous detection and classification of breast masses in digital mammograms via a deep learning YOLO-based CAD system. Comput. Methods Programs Biomed. 2018, 157, 85–94. [Google Scholar] [CrossRef] [PubMed]
- Bandeira Diniz, J.O.; Bandeira Diniz, P.H.; Azevedo Valente, T.L.; Corrêa Silva, A.; de Paiva, A.C.; Gattass, M. Detection of mass regions in mammograms by bilateral analysis adapted to breast density using similarity indexes and convolutional neural networks. Comput. Methods Programs Biomed. 2018, 156, 191–207. [Google Scholar] [CrossRef]
- Barkana, B.D.; Saricicek, I. Classification of breast masses in mammograms using 2D homomorphic transform features and supervised classifiers. J. Med. Imaging Health Inform. 2017, 7, 1566–1571. [Google Scholar] [CrossRef]
- Biswas, R.; Roy, S.; Biswas, A. Mammogram classification using curvelet coefficients and gray level co-occurrence matrix for detection of breast cancer. Int. J. Innov. Technol. Explor. Eng. 2019, 8, 4819–4824. [Google Scholar] [CrossRef]
- Cai, H.; Huang, Q.; Rong, W.; Song, Y.; Li, J.; Wang, J.; Chen, J.; Li, L. Breast microcalcification diagnosis using deep convolutional neural network from digital mammograms. Comput. Math. Methods Med. 2019, 2019, 2717454. [Google Scholar] [CrossRef]
- Chen, S.; Guan, X.; Shu, Z.; Li, Y.; Cao, W.; Dong, F.; Zhang, M.; Shao, G.; Shao, F. A new application of multimodality radiomics improves diagnostic accuracy of nonpalpable breast lesions in patients with microcalcifications-only in mammography. Med. Sci. Monit. 2019, 25, 9786–9793. [Google Scholar] [CrossRef]
- Chen, X.; Zargari, A.; Hollingsworth, A.B.; Liu, H.; Zheng, B.; Qiu, Y. Applying a new quantitative image analysis scheme based on global mammographic features to assist diagnosis of breast cancer. Comput. Methods Programs Biomed. 2019, 179, 104995. [Google Scholar] [CrossRef]
- Danala, G.; Patel, B.; Aghaei, F.; Heidari, M.; Li, J.; Wu, T.; Zheng, B. Classification of breast masses using a computer-aided diagnosis scheme of contrast enhanced digital mammograms. Ann. Biomed. Eng. 2018, 46, 1419–1431. [Google Scholar] [CrossRef] [PubMed]
- Daniel López-Cabrera, J.; Alberto López Rodriguez, L.; Pérez-Díaz, M.; López-Cabrera, J.D.; Rodríguez, L.A.L.; Pérez-Díaz, M. Classification of Breast Cancer from Digital Mammography Using Deep Learning. Intel. Artif. 2020, 23, 56–66. [Google Scholar] [CrossRef]
- Fathy, W.E.; Ghoneim, A.S. A deep learning approach for breast cancer mass detection. Int. J. Adv. Comput. Sci. Appl. 2019, 10, 175–182. [Google Scholar] [CrossRef]
- Girija, O.K.; Sudheep Elayiodm, M. Hybrid method of local binary pattern and classification tree for early breast cancer detection by mammogram classification. Int. J. Recent Technol. Eng. 2019, 8, 139–145. [Google Scholar] [CrossRef]
- Jebamony, J.; Jacob, D. Classification of benign and malignant breast masses on mammograms for large datasets using core vector machines. Curr. Med. Imaging Former. Curr. Med. Imaging Rev. 2020, 16, 703–710. [Google Scholar] [CrossRef]
- Junior, G.B.; Martins, L.D.O.; Silva, A.C.; Paiva, A.C. Comparison of support vector machines and bayesian neural networks performance for breast tissues using geostatistical functions in mammographic images. Int. J. Comput. Intell. Appl. 2010, 9, 271–288. [Google Scholar] [CrossRef]
- Kanchanamani, M.; Perumal, V. Performance evaluation and comparative analysis of various machine learning techniques for diagnosis of breast cancer. Biomed. Res. 2016, 27, 623–631. [Google Scholar]
- Kim, E.-K.E.-K.; Kim, H.-E.H.-E.; Han, K.; Kang, B.J.; Sohn, Y.-M.; Woo, O.H.; Lee, C.W. Applying data-driven imaging biomarker in mammography for breast cancer screening: Preliminary study. Sci. Rep. 2018, 8, 2762. [Google Scholar] [CrossRef] [Green Version]
- Mao, N.; Yin, P.; Wang, Q.; Liu, M.; Dong, J.; Zhang, X.; Xie, H.; Hong, N. Added value of radiomics on mammography for breast cancer diagnosis: A feasibility study. J. Am. Coll. Radiol. 2019, 16, 485–491. [Google Scholar] [CrossRef]
- Miao, J.H.; Miao, K.H.; Miao, G.J. Breast cancer biopsy predictions based on mammographic diagnosis using support vector machine learning. Multidiscip. J. Sci. Technol. J. Sel. Areas Bioinform. 2015, 5, 1–9. [Google Scholar]
- Miao, K.H.; Miao, G.J. Mammographic diagnosis for breast cancer biopsy predictions using neural network classification model and receiver operating characteristic (ROC) curve evaluation. Multidiscip. J. Sci. Technol. J. Sel. Areas Bioinform. 2013, 3, 1–10. [Google Scholar]
- Milosevic, M.; Jankovic, D.; Peulic, A. Comparative analysis of breast cancer detection in mammograms and thermograms. Biomed. Tech. 2015, 60, 49–56. [Google Scholar] [CrossRef] [PubMed]
- Nithya, R.; Santhi, B. Breast cancer diagnosis in digital mammogram using statistical features and neural network. Res. J. Appl. Sci. Eng. Technol. 2012, 4, 5480–5483. [Google Scholar]
- Nusantara, A.C.; Purwanti, E.; Soelistiono, S. Classification of digital mammogram based on nearest-neighbor method for breast cancer detection. Int. J. Technol. 2016, 1, 71–77. [Google Scholar] [CrossRef]
- Palantei, E.; Amaliah, A.; Amirullah, I. Breast cancer detection in mammogram images exploiting GLCM, GA features and SVM algorithms. J. Telecommun. Electron. Comput. Eng. 2017, 9, 113–117. [Google Scholar]
- Paramkusham, S.; Rao, K.M.M.; Prabhakar Rao, B.V.V.S.N.; Sharma, S. Application of TAR signature for breast mass analysis. Biomed. Res. 2018, 29, 2030–2034. [Google Scholar] [CrossRef] [Green Version]
- Roseline, R.; Manikandan, S. Determination of breast cancer using knn cluster technique. Indian J. Public Health Res. Dev. 2018, 9, 418–423. [Google Scholar] [CrossRef]
- Shah, H. Automatic classification of breast masses for diagnosis of breast cancer in digital mammograms using neural network. Int. J. Sci. Technol. Eng. 2015, 1, 47–52. [Google Scholar]
- Shivhare, E.; Saxena, V. Breast cancer diagnosis from mammographic images using optimized feature selection and neural network architecture. Int. J. Imaging Syst. Technol. 2021, 31, 253–269. [Google Scholar] [CrossRef]
- Singh, L.; Jaffery, Z.A. Computer-aided diagnosis of breast cancer in digital mammograms. Int. J. Biomed. Eng. Technol. 2018, 27, 233–246. [Google Scholar] [CrossRef]
- Venkata, M.D.; Lingamgunta, S. Triple-modality breast cancer diagnosis and analysis in middle aged women by logistic regression. Int. J. Innov. Technol. Explor. Eng. 2019, 8, 555–562. [Google Scholar]
- Wang, S.; Rao, R.V.; Chen, P.; Zhang, Y.; Liu, A.; Wei, L. Abnormal breast detection in mammogram images by feed-forward neural network trained by jaya algorithm. Fundam. Inform. 2017, 151, 191–211. [Google Scholar] [CrossRef]
- Wutsqa, D.U.; Setiadi, R.P. Point operation to enhance the performance of fuzzy neural network model for breast cancer classification. J. Eng. Appl. Sci. 2017, 12, 4405–4410. [Google Scholar] [CrossRef]
- Yousefi, M.; Krzyżak, A.; Suen, C.Y. Mass detection in digital breast tomosynthesis data using convolutional neural networks and multiple instance learning. Comput. Biol. Med. 2018, 96, 283–293. [Google Scholar] [CrossRef] [PubMed]
- Nindrea, R.D.; Aryandono, T.; Lazuardi, L.; Dwiprahasto, I. Diagnostic accuracy of different machine learning algorithms for breast cancer risk calculation: A meta-analysis. Asian Pacific J. Cancer Prev. 2018, 19, 1747–1752. [Google Scholar] [CrossRef]
- Aggarwal, R.; Sounderajah, V.; Martin, G.; Ting, D.S.W.; Karthikesalingam, A.; King, D.; Ashrafian, H.; Darzi, A. Diagnostic accuracy of deep learning in medical imaging: A systematic review and meta-analysis. NPJ Digit. Med. 2021, 4, 1–23. [Google Scholar] [CrossRef]
- Cuocolo, R.; Cipullo, M.B.; Stanzione, A.; Romeo, V.; Green, R.; Cantoni, V.; Ponsiglione, A.; Ugga, L.; Imbriaco, M. Machine learning for the identification of clinically significant prostate cancer on MRI: A meta-analysis. Eur. Radiol. 2020, 30, 6877–6887. [Google Scholar] [CrossRef]
- van Kempen, E.J.; Post, M.; Mannil, M.; Kusters, B.; ter Laan, M.; Meijer, F.J.A.; Henssen, D.J.H.A. Accuracy of machine learning algorithms for the classification of molecular features of gliomas on MRI: A systematic literature review and meta-analysis. Cancers 2021, 13, 2606. [Google Scholar] [CrossRef]
- Ugga, L.; Perillo, T.; Cuocolo, R.; Stanzione, A.; Romeo, V.; Green, R.; Cantoni, V.; Brunetti, A. Meningioma MRI radiomics and machine learning: Systematic review, quality score assessment, and meta-analysis. Neuroradiology 2021, 63, 1293–1304. [Google Scholar] [CrossRef]
- Tehranifar, P.; Rodriguez, C.B.; April-Sanders, A.K.; Desperito, E.; Schmitt, K.M. Migration history, language acculturation, and mammographic breast density. Cancer Epidemiol. Biomark. Prev. 2018, 27, 566–574. [Google Scholar] [CrossRef] [Green Version]
- Vieira, R.; Biller, G.; Uemura, G.; Ruiz, C.; Curado, M. Breast cancer screening in developing countries. Clinics 2017, 72, 244–253. [Google Scholar] [CrossRef]


| Study | ID | Country | Source | Size of Dataset | Train/Validation/Test Split | Type of Data | Classifier | Prediction Class | TP | TN | FP | FN | Accuracy |
|---|---|---|---|---|---|---|---|---|---|---|---|---|---|
| Abdolmaleki 2006 [34] | 1 | Iran | Primary data | 122 cases | 82/-/40 | DM | NN | Benign-Malignant | 16 | 14 | 8 | 2 | 0.75 |
| Acharyau 2008 [35] | 2 | USA | DDSM | 360 images | 270/-/90 | DM | NN | Normal-Benign-Malignant | 55 | 28 | 2 | 5 | 0.97 |
| 3 | USA | DDSM | 360 images | 270/-/90 | DM | GMM | Normal-Benign-Malignant | 57 | 29 | 1 | 3 | 0.98 | |
| Al-antari 2020 [36] | 4 | USA | DDSM | 600 images | 420/60/120 | DM | DL | Benign-Malignant | 59 | 59 | 1 | 1 | 0.98 |
| 5 | Portugal | INbreast | 410 images | 78/12/22 | DM | DL | Benign-Malignant | 14 | 6 | 2 | 0 | 0.95 | |
| Alfifi 2020 [37] | 6 | UK | MIAS | 200 images | NE | DM | DL | Normal-Benign-Malignant | 124 | 66 | 7 | 3 | 0.95 |
| 7 | UK | MIAS | 200 images | NE | DM | Tree-based | Normal-Benign-Malignant | 102 | 54 | 29 | 15 | 0.78 | |
| 8 | UK | MIAS | 200 images | NE | DM | KNN | Normal-Benign-Malignant | 99 | 50 | 32 | 19 | 0.74 | |
| Al-hiary 2012 [38] | 9 | Jordan | Primary data | NE | NE | DM | NN | Normal-Cancer | 14 | 15 | 1 | 2 | 0.91 |
| Al-masni 2018 [39] | 10 | USA | DDSM | 2400 images | 1920/-/480 | DM | NN | Benign-Malignant | 240 | 226 | 14 | 0 | 0.97 |
| Bandeira-diniz 2018 [40] | 11 | USA | DDSM | 2482 images | 1990/-/492 | DM | DL | Non-mass-Mass | 2418 | 4306 | 442 | 225 | 0.91 |
| 12 | USA | DDSM | 2482 images | 1990/-/492 | DM | DL | Non-mass-Mass | 1774 | 5615 | 210 | 188 | 0.95 | |
| Barkana 2017 [41] | 13 | USA | DDSM | 2173 images | 1451/-/722 | DM | NN | Benign-Malignant | 325 | 270 | 70 | 57 | 0.82 |
| 14 | USA | DDSM | 2173 images | 1451/-/722 | DM | SVM | Benign-Malignant | 318 | 278 | 62 | 64 | 0.83 | |
| Biswas 2019 [42] | 15 | UK | MIAS | 322 images | 226/48/48 | DM | NN | Normal-Abnormal | 32 | 12 | 3 | 1 | 0.92 |
| Cai 2019 [43] | 16 | China | Primary data | 990 images | 891/-/99 | DM | SVM | Benign-Malignant | 48 | 39 | 6 | 6 | 0.89 |
| Chen 2019a [44] | 17 | China | Primary data | 81 cases | NE | DM | Tree-based | Benign-Malignant | 31 | 30 | 11 | 9 | 0.75 |
| Chen 2019b [45] | 18 | USA | Primary data | 275 cases | 10-folds cross validation | DM | SVM | Benign-Malignant | 102 | 104 | 37 | 32 | 0.75 |
| 19 | USA | Primary data | 275 cases | 10-folds cross validation | DM | SVM | Benign-Malignant | 103 | 114 | 27 | 31 | 0.79 | |
| Danala 2018 [46] | 20 | USA | Primary data | 111 cases | LOO-CV | DM | DL | Benign-Malignant | 63 | 24 | 9 | 15 | 0.78 |
| 21 | USA | Primary data | 111 cases | LOO-CV | DM | DL | Benign-Malignant | 55 | 21 | 12 | 23 | 0.68 | |
| Daniellopez-cabrera 2020 [47] | 22 | UK | mini-MIAS | 322 images | NE | DM | DL | Normal-Abnormal | 31 | 101 | 2 | 4 | 0.97 |
| 23 | UK | mini-MIAS | 322 images | NE | DM | DL | Benign-Malignant | 14 | 28 | 3 | 1 | 0.91 | |
| Fathy 2019 [48] | 24 | USA | DDSM | 3932 images | 2517/629/786 | DM | DL | Normal-Abnormal | 389 | 325 | 71 | 1 | 0.91 |
| Girija 2019 [49] | 25 | UK | mini-MIAS | 322 images | NE | DM | Tree-based | Normal-Abnormal | 266 | 48 | 4 | 4 | 0.98 |
| 26 | UK | mini-MIAS | 322 images | NE | DM | Tree-based | Benign-Malignant | 200 | 55 | 6 | 9 | 0.94 | |
| Jebamony 2020 [50] | 27 | UK | mini-MIAS | 294 images | 203/-/91 | DM | NN | Benign-Malignant | 33 | 41 | 12 | 5 | 0.85 |
| 28 | UK | mini-MIAS | 294 images | 203/-/91 | DM | SVM | Benign-Malignant | 37 | 49 | 4 | 1 | 0.96 | |
| Junior 2010 [51] | 29 | UK | mini-MIAS | 428 ROIs | 320/-/108 | DM | NN | Normal-Abnormal | 16 | 69 | 5 | 18 | 0.79 |
| 30 | UK | mini-MIAS | 428 ROIs | 320/-/108 | DM | SVM | Normal-Abnormal | 20 | 80 | 1 | 7 | 0.93 | |
| Kanchanamani 2016 [52] | 31 | UK | MIAS | 322 images | NE | DM | SVM | Normal-Abnormal | 46 | 120 | 24 | 0 | 0.87 |
| 32 | UK | MIAS | 322 images | NE | DM | Bayes-based | Normal-Abnormal | 30 | 94 | 50 | 16 | 0.65 | |
| 33 | UK | MIAS | 322 images | NE | DM | DL | Normal-Abnormal | 23 | 101 | 43 | 23 | 0.65 | |
| 34 | UK | MIAS | 322 images | NE | DM | KNN | Normal-Abnormal | 28 | 112 | 32 | 18 | 0.74 | |
| 35 | UK | MIAS | 322 images | NE | DM | LDA | Normal-Abnormal | 28 | 112 | 32 | 18 | 0.74 | |
| 36 | UK | MIAS | 322 images | NE | DM | SVM | Benign-Malignant | 58 | 53 | 2 | 7 | 0.93 | |
| 37 | UK | MIAS | 322 images | NE | DM | Bayes-based | Benign-Malignant | 50 | 20 | 35 | 15 | 0.58 | |
| 38 | UK | MIAS | 322 images | NE | DM | DL | Benign-Malignant | 29 | 29 | 26 | 36 | 0.48 | |
| 39 | UK | MIAS | 322 images | NE | DM | KNN | Benign-Malignant | 41 | 25 | 30 | 24 | 0.55 | |
| 40 | UK | MIAS | 322 images | NE | DM | LDA | Benign-Malignant | 38 | 33 | 22 | 27 | 0.59 | |
| Kim 2018 [53] | 41 | Korea | Primary data | 29,107 images | 26631/1238/1238 | DM | DL | Normal-Abnormal | 471 | 548 | 71 | 148 | 0.82 |
| Mao 2019 [54] | 42 | China | Primary data | 173 cases | 138/-/35 | DM | SVM | Benign-Malignant | 13 | 14 | 1 | 7 | 0.80 |
| 43 | China | Primary data | 173 cases | 138/-/35 | DM | Logistic | Benign-Malignant | 17 | 14 | 1 | 3 | 0.89 | |
| 44 | China | Primary data | 173 cases | 138/-/35 | DM | KNN | Benign-Malignant | 8 | 14 | 1 | 12 | 0.83 | |
| 45 | China | Primary data | 173 cases | 138/-/35 | DM | Bayes-based | Benign-Malignant | 9 | 13 | 2 | 11 | 0.78 | |
| Miao 2015 [55] | 46 | USA | MMD | 830 cases | 10-folds cross validation | DM | SVM | Benign-Malignant | 381 | 399 | 28 | 22 | 0.94 |
| Miao 2013 [56] | 47 | USA | MMD | 830 cases | NE | DM | NN | Benign-Malignant | 360 | 384 | 43 | 43 | 0.90 |
| Milosevic 2015 [57] | 48 | UK | MIAS | 300 images | 5-folds cross validation | DM | SVM | Normal-Abnormal | 23 | 163 | 24 | 90 | 0.62 |
| 49 | UK | MIAS | 300 images | 5-folds cross validation | DM | KNN | Normal-Abnormal | 44 | 138 | 49 | 69 | 0.61 | |
| 50 | UK | MIAS | 300 images | 5-folds cross validation | DM | Bayes-based | Normal-Abnormal | 53 | 113 | 74 | 60 | 0.55 | |
| 51 | Serbia | Primary data | 300 images | 5-folds cross validation | DM | SVM | Normal-Abnormal | 121 | 130 | 20 | 29 | 0.84 | |
| 52 | Serbia | Primary data | 300 images | 5-folds cross validation | DM | KNN | Normal-Abnormal | 84 | 79 | 71 | 66 | 0.54 | |
| 53 | Serbia | Primary data | 300 images | 5-folds cross validation | DM | Bayes-based | Normal-Abnormal | 114 | 118 | 32 | 36 | 0.77 | |
| Nithya 2012 [58] | 54 | USA | DDSM | 250 images | 200/-/50 | DM | NN | Normal-Abnormal | 23 | 24 | 2 | 1 | 0.94 |
| Nusantara 2016 [59] | 55 | UK | MIAS | 322 images | 291/-/31 | DM | KNN | Normal-Abnormal | 10 | 20 | 0 | 1 | 0.97 |
| Palantei 2017 [60] | 56 | UK | MIAS | NE | NE | DM | SVM | Normal-Abnormal | 9 | 21 | 4 | 0 | 0.88 |
| Paramkusham 2018 [61] | 57 | USA | DDSM | 148 images | 126/-/22 | DM | SVM | Benign-Malignant | 10 | 10 | 1 | 1 | 0.91 |
| Roseline 2018 [62] | 58 | UK | MIAS | NE | NE | DM | KNN | Benign-Malignant | 49 | 60 | 4 | 2 | 0.95 |
| Shah 2015 [63] | 59 | UK | MIAS | 320 images | NE | DM | NN | Normal-Abnormal | 54 | 49 | 2 | 3 | 0.95 |
| 60 | UK | MIAS | 320 images | NE | DM | NN | Benign-Malignant | 24 | 22 | 2 | 6 | 0.85 | |
| Shivhare 2020 [64] | 61 | USA, UK | DDSM, MIAS | NE | NE | DM | NN | Benign-Malignant | 12 | 16 | 2 | 3 | 0.85 |
| 62 | USA, UK | DDSM, MIAS | NE | NE | DM | DL | Benign-Malignant | 1 | 17 | 1 | 14 | 0.55 | |
| 63 | USA, UK | DDSM, MIAS | NE | NE | DM | SVM | Benign-Malignant | 0 | 18 | 0 | 15 | 0.55 | |
| Singh 2018 [65] | 64 | UK | MIAS | 139 ROIs | 69/28/42 | DM | NN | Benign-Malignant | 25 | 14 | 1 | 2 | 0.93 |
| Venkata 2019 [66] | 65 | NA | NA | 110 images | 80/-/30 | DM | Logistic regression | Benign-Malignant | 14 | 14 | 1 | 1 | 0.93 |
| Wang 2017 [67] | 66 | UK | mini-MIAS | 200 images | 10-folds cross validation | DM | NN | Normal-Abnormal | 92 | 92 | 8 | 8 | 0.92 |
| Wutsqa 2017 [68] | 67 | UK | MIAS | 120 cases | 96/-/24 | DM | NN | Normal-Abnormal | 14 | 8 | 0 | 2 | 0.92 |
| Yousefi 2018 [69] | 68 | USA | Primary data | 87 images | NE | Tomosynthesis | Tree-based | Benign-Malignant | 11 | 13 | 2 | 2 | 0.87 |
| Model | Covariate | ꭓ2-Statistic (df) | p-Value |
|---|---|---|---|
| Model 1 | Country | 19.55 (6) | 0.003 * |
| Model 2 | Source | 31.10 (12) | 0.002 * |
| Model 3 | Type of data | 4.23 (2) | 0.121 |
| Model 4 | Classifier | 30.32 (16) | 0.016 * |
| Comparisons | dAUC (95% CI) | p-Value |
|---|---|---|
| Country | ||
| USA vs. UK | 0.051 (0.006, 0.127) | 0.035 * |
| USA vs. others 1 | 0.095 (0.044, 0.191) | 0.001 ** |
| UK vs. others 1 | 0.044 (−0.034, 0.131) | 0.241 |
| Source of data | ||
| Primary data vs. DDSM | — † | — † |
| Primary data vs. MIAS 2 | −0.062 (−0.127, 0.023) | 0.152 |
| DDSM vs. MIAS 2 | — † | — † |
| Classifier | ||
| NN vs. DL | — † | — † |
| NN vs. Tree-based | 0.003 (−0.071, 0.138) | 0.946 |
| NN vs. KNN | 0.157 (0.026, 0.325) | 0.010 |
| NN vs. SVM | 0.033 (−0.034, 0.074) | 0.337 |
| NN vs. Bayes-based | 0.252 (0.119, 0.379) | <0.001 ** |
| DL vs. Tree-based | −0.016 (−0.122, 0.117) | 0.690 |
| DL vs. KNN | — † | — † |
| DL vs. SVM | — † | — † |
| DL vs. Bayes-based | — † | — † |
| Tree-based vs. KNN | 0.153 (−0.023, 0.333) | 0.082 |
| Tree-based vs. SVM | 0.030 (−0.101, 0.099) | 0.578 |
| Tree-based vs. Bayes-based | 0.249 (0.073, 0.395) | 0.007 ** |
| KNN vs. SVM | −0.123 (−0.300, −0.004) | 0.044 * |
| KNN vs. Bayes-based | 0.096 (−0.121, 0.265) | 0.404 |
| SVM vs. Bayes-based | 0.219 (0.094, 0.350) | <0.001 ** |
| Study | Risk ofBias | Applicability | Overall | |||||
| Patient Selection | Index Test | Reference Standard | Flow and Timing | Patient Selection | IndexTest | Reference Standard | ||
| Abdolmaleki 2006 | Low | Unclear | Low | Low | Low | Low | Low | Good |
| Acharyau 2008 | High | Unclear | Low | Unclear | Low | Low | Low | Good |
| Al-antari 2020 | Low | Unclear | Unclear | Low | Unclear | Low | Unclear | Moderate |
| Alfifi 2020 | Unclear | Unclear | Unclear | Unclear | Low | Low | Unclear | Moderate |
| Al-hiary 2012 | High | Low | Unclear | Unclear | Unclear | Low | Unclear | Moderate |
| Al-masni 2018 | Low | Unclear | Low | Unclear | Low | Low | Low | Moderate |
| Bandeira-diniz 2018 | High | Low | Low | Unclear | Low | Low | Low | Good |
| Barkana 2017 | Unclear | Unclear | Low | Unclear | Unclear | Low | Low | Moderate |
| Biswas 2019 | Unclear | Unclear | Unclear | Unclear | Unclear | Low | Unclear | Moderate |
| Cai 2019 | Low | Low | Low | Low | Low | Low | Low | Moderate |
| Chen 2019a | Low | Unclear | Low | Low | Low | Low | Low | Moderate |
| Chen 2019b | Low | Low | Low | Low | Low | Low | Low | Good |
| Danala 2018 | Low | Low | Low | Low | Low | Low | Low | Good |
| Daniellopez-cabrera 2020 | Unclear | Unclear | Unclear | Unclear | Low | Low | Unclear | Good |
| Fathy 2019 | High | Low | Low | Unclear | Low | Low | Low | Poor |
| Girija 2019 | Unclear | Low | Unclear | Unclear | Low | Low | Low | Good |
| Jebamony 2020 | Unclear | Unclear | Unclear | High | Low | Low | Unclear | Moderate |
| Junior 2010 | High | Unclear | Unclear | High | Low | Low | Unclear | Moderate |
| Kanchanamani 2016 | Unclear | Unclear | Unclear | Unclear | Low | Low | Unclear | Moderate |
| Kim 2018 | Unclear | Low | Low | Low | Low | Low | Low | Moderate |
| Mao 2019 | Low | Unclear | Low | Low | Low | Low | Low | Moderate |
| Miao 2015 | Unclear | Unclear | Unclear | High | Low | Low | Unclear | Moderate |
| Miao 2013 | Low | Low | Unclear | High | Low | Low | Unclear | Moderate |
| Milosevic 2015 | Low | Unclear | Unclear | Unclear | Low | Low | Unclear | Moderate |
| Nithya 2012 | Unclear | Unclear | Low | Unclear | Low | Low | Low | Moderate |
| Nusantara 2016 | Unclear | Low | Unclear | Unclear | Low | Low | Low | Moderate |
| Palantei 2017 | High | Unclear | Unclear | Unclear | Low | Low | Unclear | Poor |
| Paramkusham 2018 | Unclear | Unclear | Low | Unclear | Low | Low | Low | Moderate |
| Roseline 2018 | Unclear | Unclear | Unclear | High | Low | Low | Unclear | Moderate |
| Shah 2015 | Unclear | Unclear | Unclear | Unclear | Low | Low | Unclear | Good |
| Shivhare 2020 | Unclear | Unclear | Unclear | High | Low | Low | Unclear | Good |
| Singh 2018 | Unclear | Unclear | Low | Low | Low | Low | Low | Moderate |
| Venkata 2019 | Unclear | Unclear | Unclear | Unclear | Unclear | Low | Unclear | Moderate |
| Wang 2017 | High | Unclear | Unclear | Unclear | Low | Low | Unclear | Moderate |
| Wutsqa 2017 | High | Unclear | Unclear | Unclear | Low | Low | Unclear | Moderate |
| Yousefi 2018 | Unclear | Unclear | Low | Unclear | Low | Low | Low | Moderate |
Publisher’s Note: MDPI stays neutral with regard to jurisdictional claims in published maps and institutional affiliations. |
© 2022 by the authors. Licensee MDPI, Basel, Switzerland. This article is an open access article distributed under the terms and conditions of the Creative Commons Attribution (CC BY) license (https://creativecommons.org/licenses/by/4.0/).
Share and Cite
Hanis, T.M.; Islam, M.A.; Musa, K.I. Diagnostic Accuracy of Machine Learning Models on Mammography in Breast Cancer Classification: A Meta-Analysis. Diagnostics 2022, 12, 1643. https://doi.org/10.3390/diagnostics12071643
Hanis TM, Islam MA, Musa KI. Diagnostic Accuracy of Machine Learning Models on Mammography in Breast Cancer Classification: A Meta-Analysis. Diagnostics. 2022; 12(7):1643. https://doi.org/10.3390/diagnostics12071643
Chicago/Turabian StyleHanis, Tengku Muhammad, Md Asiful Islam, and Kamarul Imran Musa. 2022. "Diagnostic Accuracy of Machine Learning Models on Mammography in Breast Cancer Classification: A Meta-Analysis" Diagnostics 12, no. 7: 1643. https://doi.org/10.3390/diagnostics12071643
APA StyleHanis, T. M., Islam, M. A., & Musa, K. I. (2022). Diagnostic Accuracy of Machine Learning Models on Mammography in Breast Cancer Classification: A Meta-Analysis. Diagnostics, 12(7), 1643. https://doi.org/10.3390/diagnostics12071643