
Individualized Contrast Media Application Based on Body Weight and Contrast Enhancement in Computed Tomography of Livers without Steatosis


Abstract
:1. Introduction
2. Materials and Methods
2.1. Patients
2.2. Imaging Protocols
2.3. Contrast Material and Injection Protocol
2.4. Quantitative and Subjective Image Analysis
2.5. Statistical Analysis
3. Results
3.1. Baseline Characteristics
3.2. Objective Liver Attenuation and Enhancement
3.3. Comparison of Post-Contrast Liver Attenuation and Enhancement
3.4. Subjective Quality
4. Discussion
5. Conclusions
Author Contributions
Funding
Institutional Review Board Statement
Informed Consent Statement
Data Availability Statement
Acknowledgments
Conflicts of Interest
References
- Heiken, J.P.; Brink, J.A.; McClennan, B.L.; Sagel, S.S.; Crowe, T.M.; Gaines, M.V. Dynamic incremental CT: Effect of volume and concentration of contrast material and patient weight on hepatic enhancement. Radiology 1995, 195, 353–357. [Google Scholar] [CrossRef] [PubMed]
- Brink, J.A.; Heiken, J.P.; Forman, H.P.; Sagel, S.S.; Molina, P.L.; Brown, P.C. Hepatic Spiral CT: Reduction of Dose of Intravenous Contrast Material. Radiology 1995, 197, 88–89. [Google Scholar] [CrossRef] [PubMed]
- De Jong, D.J.; Veldhuis, W.B.; Wessels, F.J.; de Vos, B.; Moeskops, P.; Kok, M. Towards Personalised Contrast Injection: Artificial-Intelligence-Derived Body Composition and Liver Enhancement in Computed Tomography. J. Pers. Med. 2021, 11, 159. [Google Scholar] [CrossRef] [PubMed]
- Soyer, P.; Poccard, M.; Boudiaf, M.; Abitbol, M.; Hamzi, L.; Panis, Y.; Valleur, P.; Rymer, R. Detection of hypovascular hepatic metastases at triple-phase helical CT: Sensitivity of phases and comparison with surgical and histopathologic findings. Radiology 2004, 231, 413–420. [Google Scholar] [CrossRef]
- Benbow, M.; Bull, R.K. Simple weight-based contrast dosing for standardization of portal phase CT liver enhancement. Clin. Radiol. 2011, 66, 940–944. [Google Scholar] [CrossRef]
- Zanardo, M.; Doniselli, F.M.; Esseridou, A.; Agrò, M.; Panarisi, N.A.R.; Monti, C.B.; Di Leo, G.; Sardanelli, F. Lean body weight versus total body weight to calculate the iodinated contrast media volume in abdominal CT: A randomised controlled trial. Insights Imaging 2020, 11, 132. [Google Scholar] [CrossRef]
- Perrin, E.; Jackson, M.; Grant, R.; Lloyd, C.; Chinaka, F.; Goh, V. Weight-adapted iodinated contrast media administration in abdomino-pelvic CT: Can image quality be maintained? Radiography 2018, 24, 22–27. [Google Scholar] [CrossRef]
- Goshima, S.; Kanematsu, M.; Noda, Y.; Kondo, H.; Watanabe, H.; Kawada, H.; Kawai, N.; Tanahashi, Y.; Bae, K.T. Determination of optimal intravenous contrast agent iodine dose for the detection of liver metastasis at 80-kVp CT. Eur. Radiol. 2014, 24, 1853–1859. [Google Scholar] [CrossRef]
- Matsumoto, Y.; Masuda, T.; Sato, T.; Arataki, K.; Nakamura, Y.; Tatsugami, F.; Awai, K. Contrast Material Injection Protocol with the Dose Determined According to Lean Body Weight at Hepatic Dynamic Computed Tomography. J. Comput. Assist. Tomogr. 2019, 43, 736–740. [Google Scholar] [CrossRef]
- Costa, A.F.; Peet, K.; Abdolell, M. Dosing Iodinated Contrast Media According to Lean Versus Total Body Weight at Abdominal CT: A Stratified Randomized Controlled Trial. Acad. Radiol. 2020, 27, 833–840. [Google Scholar] [CrossRef]
- Ho, L.M.; Nelson, R.C.; DeLong, D.M. Determining Contrast Medium Dose and Rate on Basis of Lean Body Weight: Does This Strategy Improve Patient-to-Patient Uniformity of Hepatic Enhancement during Multi–Detector Row CT? Radiology 2007, 243, 431–437. [Google Scholar] [CrossRef]
- Kondo, H.; Kanematsu, M.; Goshima, S.; Watanabe, H.; Onozuka, M.; Moriyama, N.; Bae, K.T. Aortic and hepatic enhancement at multidetector CT: Evaluation of optimal iodine dose determined by lean body weight. Eur. J. Radiol. 2011, 80, e273–e277. [Google Scholar] [CrossRef]
- Caruso, D.; Rosati, E.; Panvini, N.; Rengo, M.; Bellini, D.; Moltoni, G.; Bracci, B.; Lucertini, E.; Zerunian, M.; Polici, M.; et al. Optimization of contrast medium volume for abdominal CT in oncologic patients: Prospective comparison between fixed and lean body weight-adapted dosing protocols. Insights Imaging 2021, 12, 40. [Google Scholar] [CrossRef]
- Jensen, C.T.; Blair, K.J.; Wagner-Bartak, N.A.; Vu, L.N.; Carter, B.W.; Sun, J.; Bathala, T.K.; Gupta, S. Comparison of Abdominal Computed Tomographic Enhancement and Organ Lesion Depiction between Weight-Based Scanner Software Contrast Dosing and a Fixed-Dose Protocol in a Tertiary Care Oncologic Center. J. Comput. Assist. Tomogr. 2019, 43, 155–162. [Google Scholar] [CrossRef]
- Kondo, H.; Kanematsu, M.; Goshima, S.; Tomita, Y.; Kim, M.-J.J.; Moriyama, N.; Onozuka, M.; Shiratori, Y.; Bae, K.T. Body Size Indexes for Optimizing Iodine Dose for Aortic and Hepatic Enhancement at Multidetector CT: Comparison of Total Body Weight, Lean Body Weight, and Blood Volume. Radiology 2010, 254, 163–169. [Google Scholar] [CrossRef] [Green Version]
- Zhang, Q.; Guo, M.-J.J.; Wu, Y.-F.F. Correlation of abdominal fat ratio with hepatic CT enhancement. Exp. Ther. Med. 2015, 10, 285–288. [Google Scholar] [CrossRef] [Green Version]
- Verburg, F.A.; Kuhl, C.K.; Pietsch, H.; Palmowski, M.; Mottaghy, F.M.; Behrendt, F.F. The influence of different contrast medium concentrations and injection protocols on quantitative and clinical assessment of FDG-PET/CT in lung cancer. Eur. J. Radiol. 2013, 82, e617–e622. [Google Scholar] [CrossRef]
- Walgraeve, M.-S.; Pyfferoen, L.; Van De Moortele, K.; Zanca, F.; Bielen, D.; Casselman, J.W. Implementation of patient-tailored contrast volumes based on body surface area and heart rate harmonizes contrast enhancement and reduces contrast load in small patients in portal venous phase abdominal CT. Eur. J. Radiol. 2019, 121, 108630. [Google Scholar] [CrossRef]
- Koiwahara, G.; Tsuda, T.; Matsuda, M.; Hirata, M.; Tanaka, H.; Hyodo, T.; Kido, T.; Mochizuki, T. Different enhancement of the hepatic parenchyma in dynamic CT for patients with normal liver and chronic liver diseases and with the dose of contrast medium based on body surface area. Jpn. J. Radiol. 2015, 33, 194–200. [Google Scholar] [CrossRef]
- Van Cooten, V.V.; de Jong, D.J.; Wessels, F.J.; de Jong, P.A.; Kok, M.; van Cooten, V.V.; de Jong, D.J.; Wessels, F.J.; de Jong, P.A.; Kok, M. Liver Enhancement on Computed Tomography Is Suboptimal in Patients with Liver Steatosis. J. Pers. Med. 2021, 11, 1255. [Google Scholar] [CrossRef]
- Kok, M.; Mihl, C.; Mingels, A.A.; Kietselaer, B.L.; Mühlenbruch, G.; Seehofnerova, A.; Wildberger, J.E.; Das, M. Influence of contrast media viscosity and temperature on injection pressure in computed tomographic angiography: A phantom study. Investig. Radiol. 2014, 49, 217–223. [Google Scholar] [CrossRef]
- Martens, B.; Hendriks, B.M.F.; Eijsvoogel, N.G.; Wildberger, J.E.; Mihl, C. Individually Body Weight–Adapted Contrast Media Application in Computed Tomography Imaging of the Liver at 90 kVp. Investig. Radiol. 2019, 54, 177–182. [Google Scholar] [CrossRef]
- Martens, B.; Hendriks, B.M.F.; Mihl, C.; Wildberger, J.E. Tailoring Contrast Media Protocols to Varying Tube Voltages in Vascular and Parenchymal CT Imaging: The 10-to-10 Rule. Investig. Radiol. 2020, 55, 673–676. [Google Scholar] [CrossRef]
- Farrell, G.C.; Teoh, N.C.; McCuskey, R.S. Hepatic microcirculation in fatty liver disease. Anat. Rec. 2008, 291, 684–692. [Google Scholar] [CrossRef]
- Francque, S.; Verrijken, A.; Mertens, I.; Hubens, G.; Van Marck, E.; Pelckmans, P.; Van Gaal, L.; Michielsen, P. Noncirrhotic human nonalcoholic fatty liver disease induces portal hypertension in relation to the histological degree of steatosis. Eur. J. Gastroenterol. Hepatol. 2010, 22, 1449–1457. [Google Scholar] [CrossRef]
- Lawrence, D.A.; Oliva, I.B.; Israel, G.M. Detection of Hepatic Steatosis on Contrast-Enhanced CT Images: Diagnostic Accuracy of Identification of Areas of Presumed Focal Fatty Sparing. Am. J. Roentgenol. 2012, 199, 44–47. [Google Scholar] [CrossRef]

| TBW-Based | Semi-Fixed | |||
|---|---|---|---|---|
| Total | No. participants | 80 | 80 | |
| Male | 56.3% | 62.5% | 0.260 | |
| Age (years) | 64 (50–70) | 63 (55–73) | 0.040 | |
| TBW (kg) | 78.0 (68.0–89.5) | 81.7 (72.5–89.0) | 0.430 | |
| BMI | 26.8 (±4.7) | 26.5 (±4.3) | 0.715 | |
| Grams of iodine | 40.2 (±7.9) | 42.1 (±4.4) | 0.074 | |
| Grams of iodine/kgTBW | 0.499 (±0.012) | 0.528 (±0.079) | 0.002 | |
| Group ≤ 70 kg | No. participants | 21 | 16 | |
| Male | 10% | 31% | 0.107 | |
| Age (years) | 61 (52–69) | 66 (56–75) | 0.291 | |
| TBW (kg) | 63.0 (59.0–67.0) | 62.5 (55.9–64.5) | 0.308 | |
| BMI | 22.9 (±2.7) | 21.5 (±2.0) | 0.108 | |
| Grams of iodine | 31.4 (±2.00) | 37.7 (±3.1) | 0.000 | |
| Grams of iodine/kgTBW | 0.501 (±0.008) | 0.619 (±0.061) | 0.000 | |
| Group 70–90 kg | No. participants | 41 | 49 | |
| Male | 66% | 69% | 0.447 | |
| Age (years) | 64 (50–69) | 64 (54–72) | 0.201 | |
| TBW (kg) | 79.0 (74.0–83.0) | 82.0 (78.9–85.1) | 0.095 | |
| BMI | 26.6 (±3.0) | 26.4 (±2.6) | 0.808 | |
| Grams of iodine | 39.6 (±3.1) | 42.4 (±3.8) | 0.000 | |
| Grams of iodine/kgTBW | 0.499 (±0.012) | 0.523 (±0.054) | 0.006 | |
| Group ≥ 90 kg | No. participants | 18 | 15 | |
| Male | 89% | 73% | 0.242 | |
| Age (years) | 56 (49–70) | 62 (56–67) | 0.281 | |
| TBW (kg) | 104 (95.0–115) | 101 (94.2–110) | 0.789 | |
| BMI | 31.8 (±5.2) | 31.8 (±4.2) | 0.985 | |
| Grams of iodine | 52.0 (±4.3) | 45.8 (±3.8) | 0.000 | |
| Grams of iodine/kgTBW | 0.498 (±0.014) | 0.447 (±0.062) | 0.002 | |
| Mean (±SD) or Median (IQR) | p-value |
| TBW-Based | Semi-Fixed | |||||
|---|---|---|---|---|---|---|
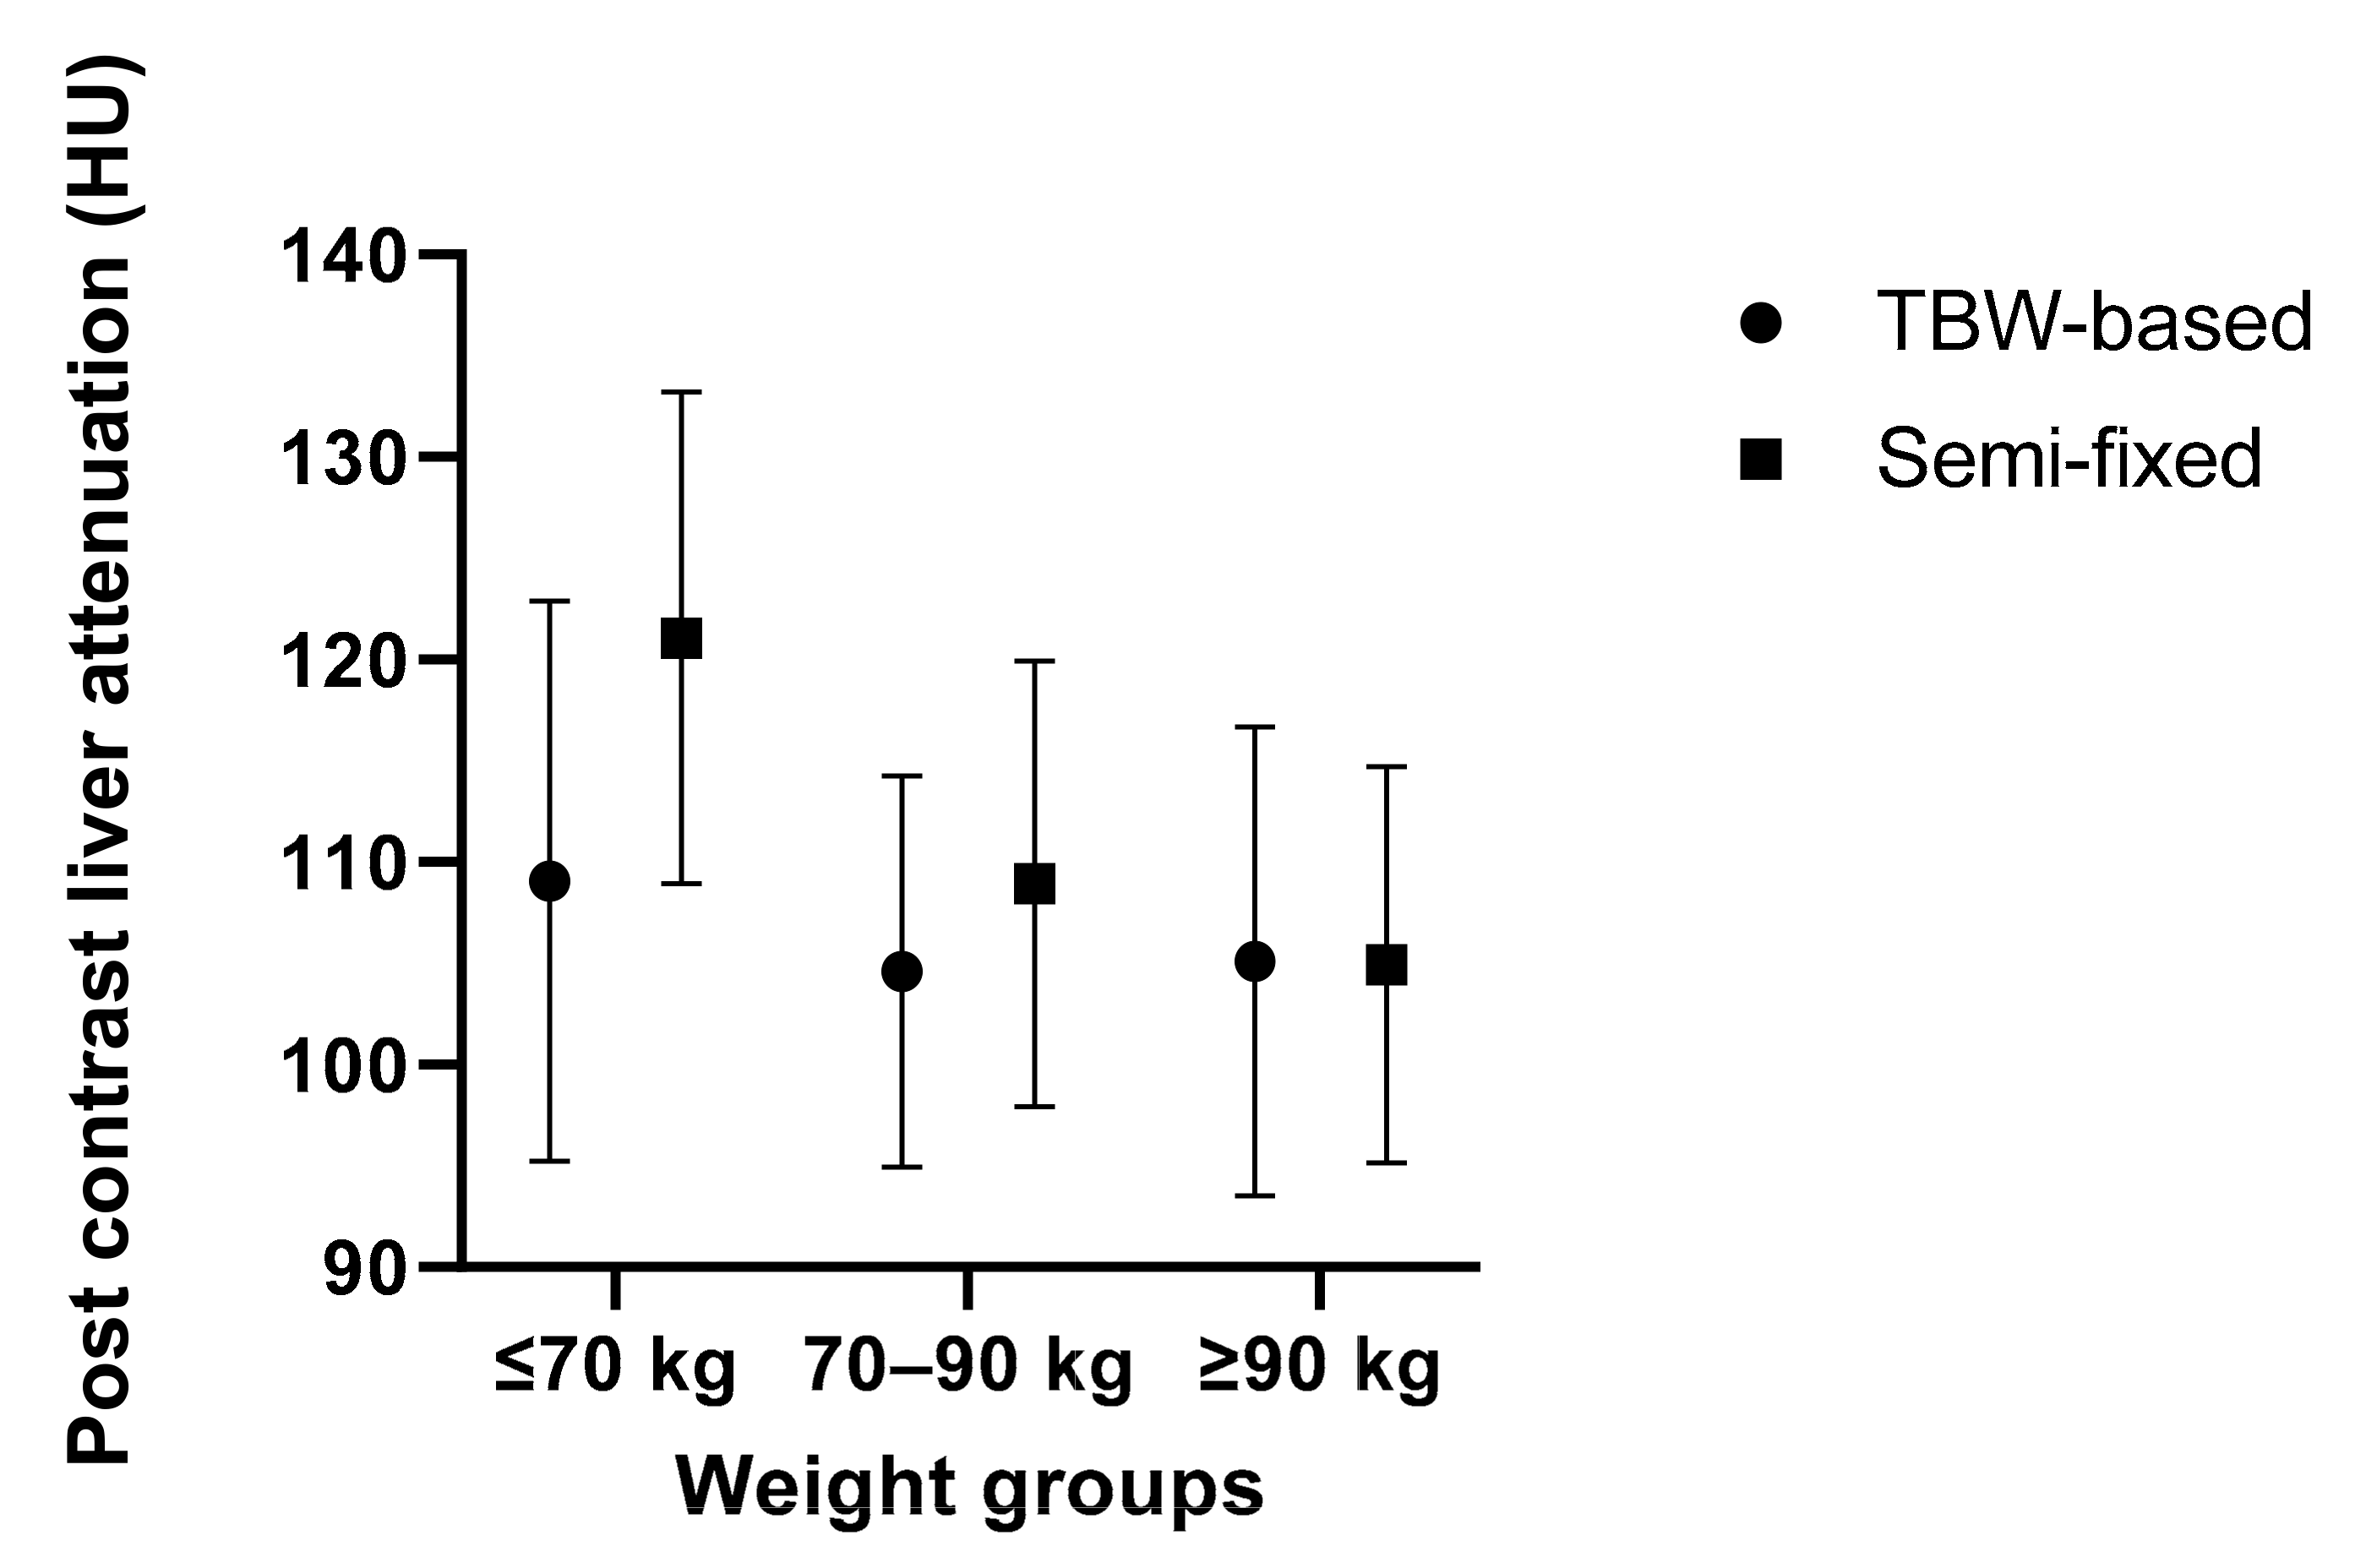
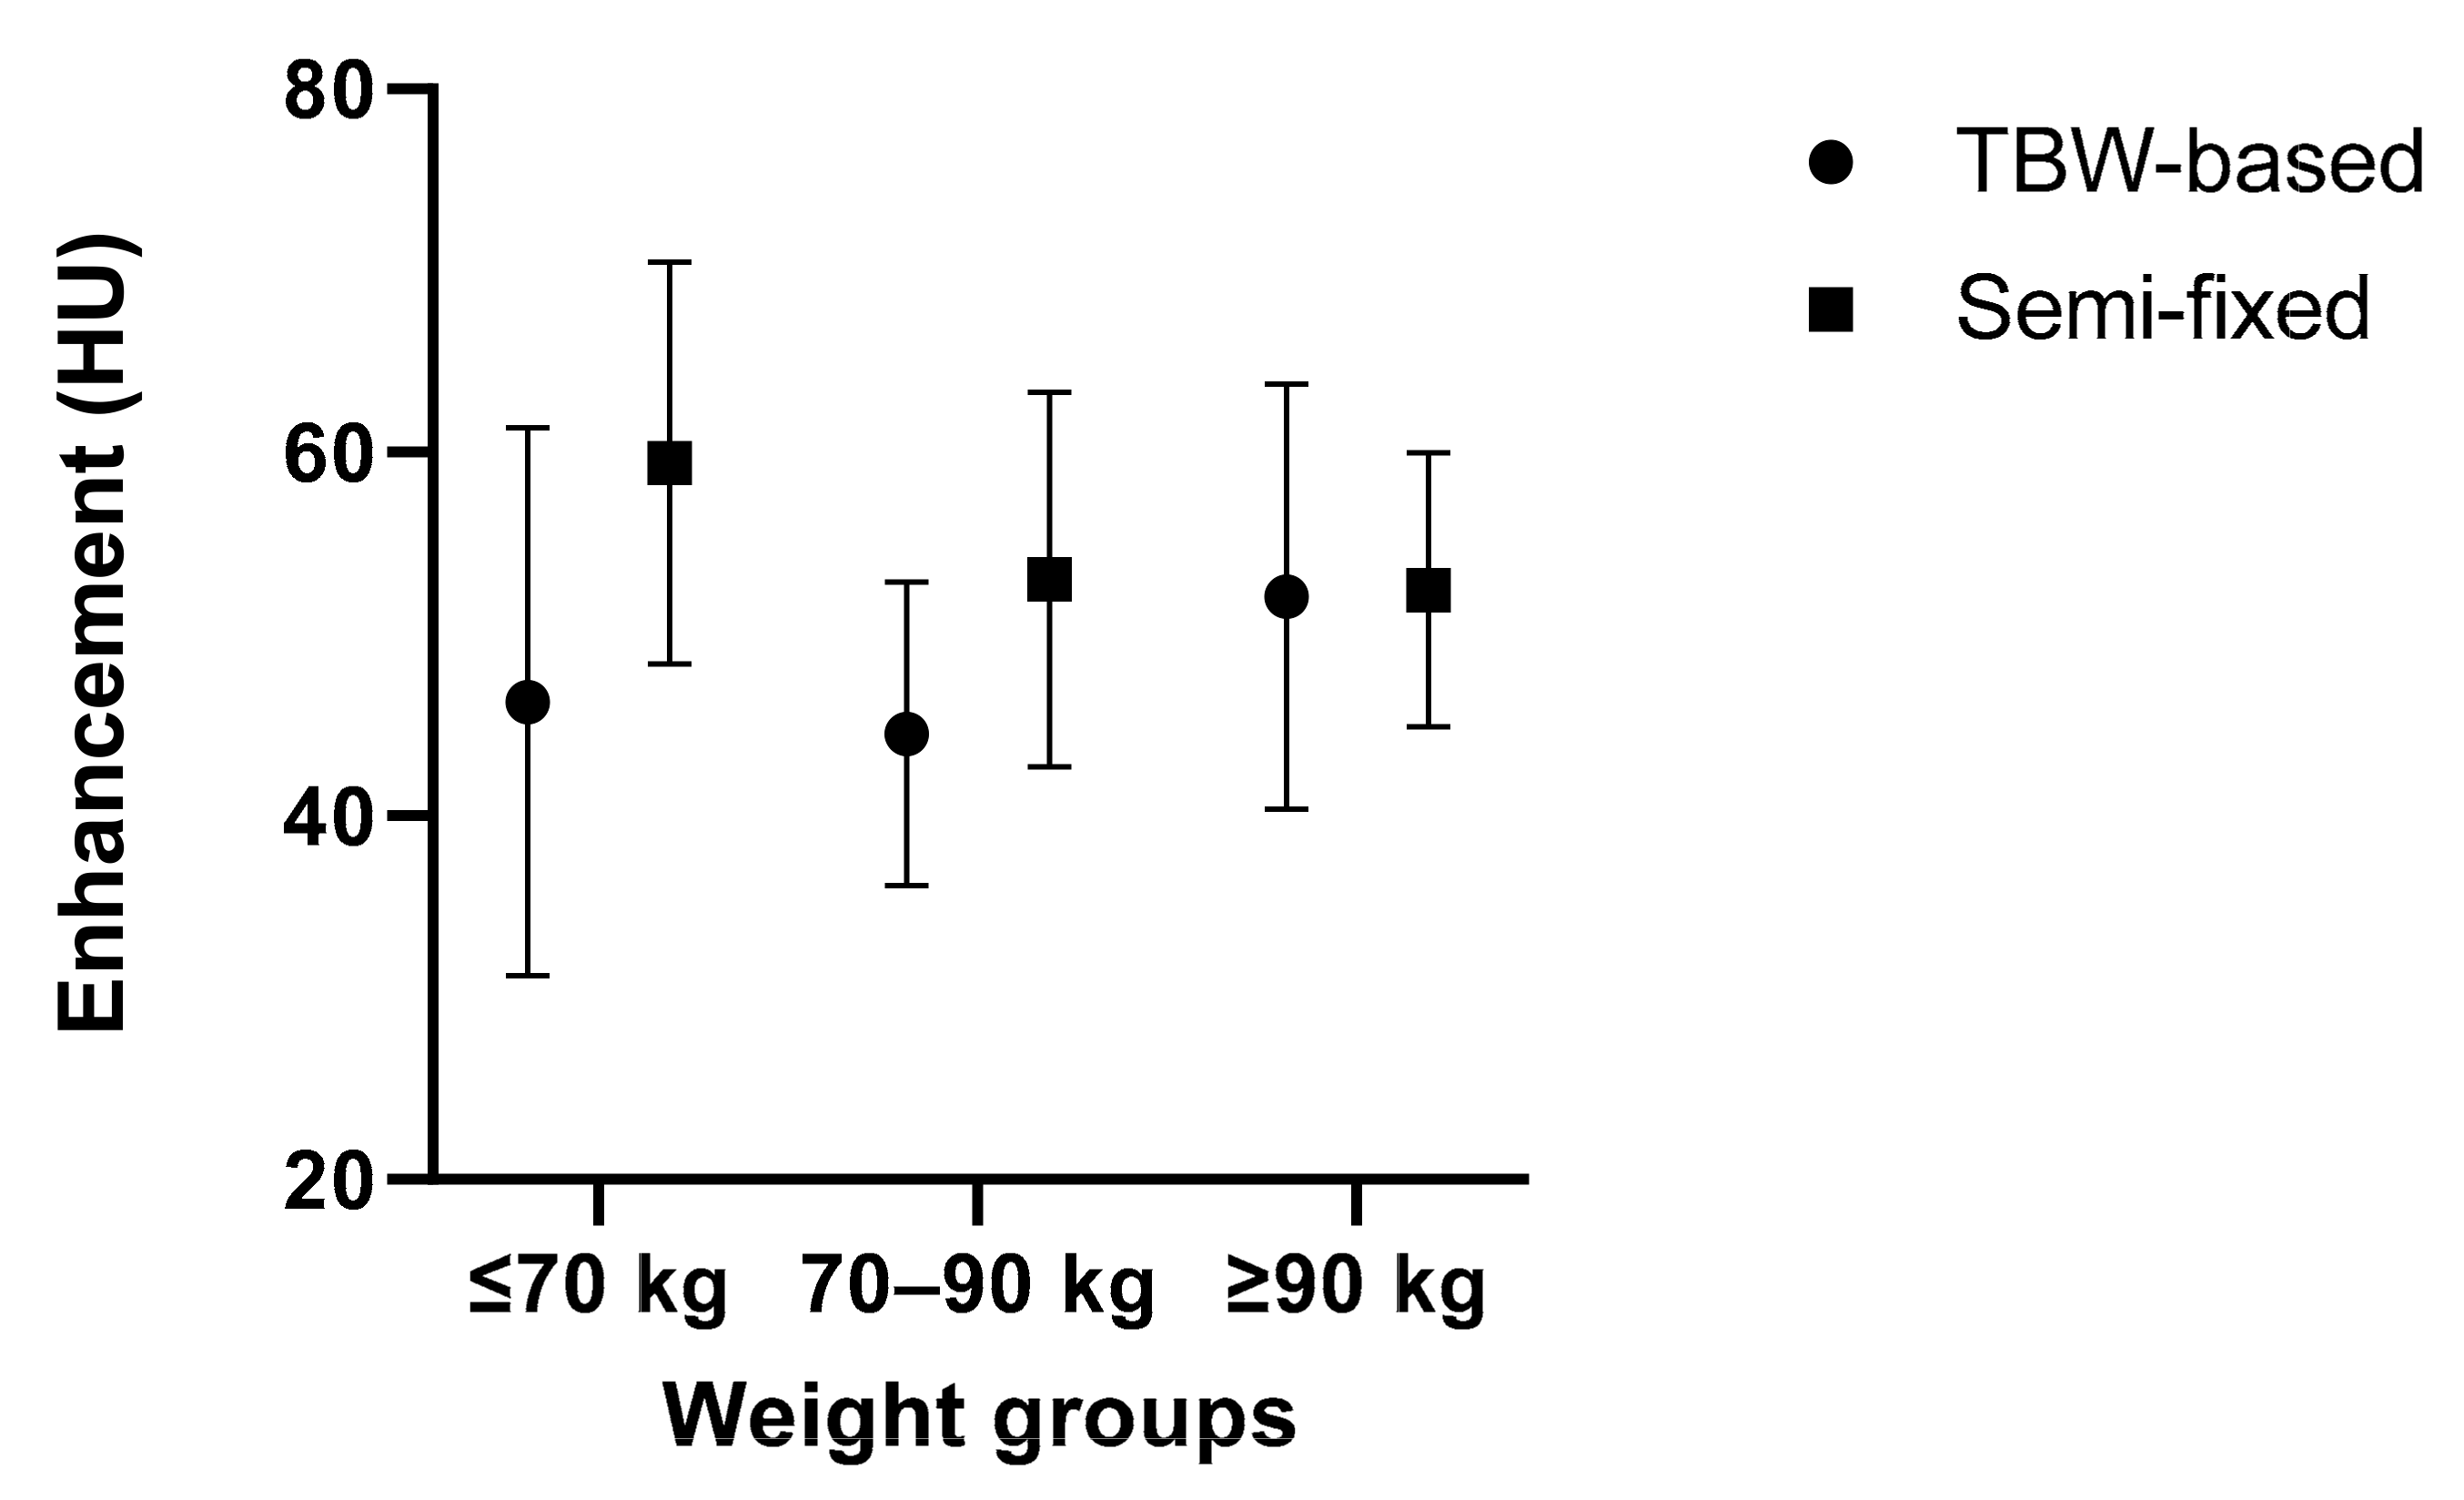
| Pre-contrast attenuation | Enhancement | Post-contrast attenuation | Pre-contrast attenuation | Enhancement | Post-contrast attenuation | |
| Total | 58.2 (±7.1) | 46.7 (±11.5) | 105.9 (±11.3) | 56.4 (±5.6) | 54.2 (±10.2) | 110.6 (±12.2) |
| Group ≤ 70 kg | 60.8 (±5.2) | 46.2 (±15.1) | 109.1 (±13.8) | 61.6 (±3.9) | 59.4 (±11.0) | 121.1 (±12.1) |
| Group 70–90 kg | 59.3 (±6.8) | 44.5 (±8.4) | 104.6 (±9.67) | 55.9 (±5.1) | 53.0 (±10.3) | 108.9 (±11.0) |
| Group ≥ 90 kg | 52.5 (±7.2) | 52.1 (±11.7) | 105.1 (±11.6) | 52.5 (±4.7) | 52.4 (±7.5) | 105.0 (±9.79) |
| Intergroup comparison | 0.069 | 0.331 | 0.064 | 0.000 | ||
| Mean (±SD) | p-value | |||||
Publisher’s Note: MDPI stays neutral with regard to jurisdictional claims in published maps and institutional affiliations. |
© 2022 by the authors. Licensee MDPI, Basel, Switzerland. This article is an open access article distributed under the terms and conditions of the Creative Commons Attribution (CC BY) license (https://creativecommons.org/licenses/by/4.0/).
Share and Cite
de Jong, D.J.; van Cooten, V.V.; Veldhuis, W.B.; de Jong, P.A.; Kok, M. Individualized Contrast Media Application Based on Body Weight and Contrast Enhancement in Computed Tomography of Livers without Steatosis. Diagnostics 2022, 12, 1551. https://doi.org/10.3390/diagnostics12071551
de Jong DJ, van Cooten VV, Veldhuis WB, de Jong PA, Kok M. Individualized Contrast Media Application Based on Body Weight and Contrast Enhancement in Computed Tomography of Livers without Steatosis. Diagnostics. 2022; 12(7):1551. https://doi.org/10.3390/diagnostics12071551
Chicago/Turabian Stylede Jong, Daan J., Véronique V. van Cooten, Wouter B. Veldhuis, Pim A. de Jong, and Madeleine Kok. 2022. "Individualized Contrast Media Application Based on Body Weight and Contrast Enhancement in Computed Tomography of Livers without Steatosis" Diagnostics 12, no. 7: 1551. https://doi.org/10.3390/diagnostics12071551
APA Stylede Jong, D. J., van Cooten, V. V., Veldhuis, W. B., de Jong, P. A., & Kok, M. (2022). Individualized Contrast Media Application Based on Body Weight and Contrast Enhancement in Computed Tomography of Livers without Steatosis. Diagnostics, 12(7), 1551. https://doi.org/10.3390/diagnostics12071551