
First Molars–Incisors Rate and Pattern of Bone Loss: A Cross-Sectional Analysis of CBCT Images

Abstract
:1. Introduction
2. Materials and Methods
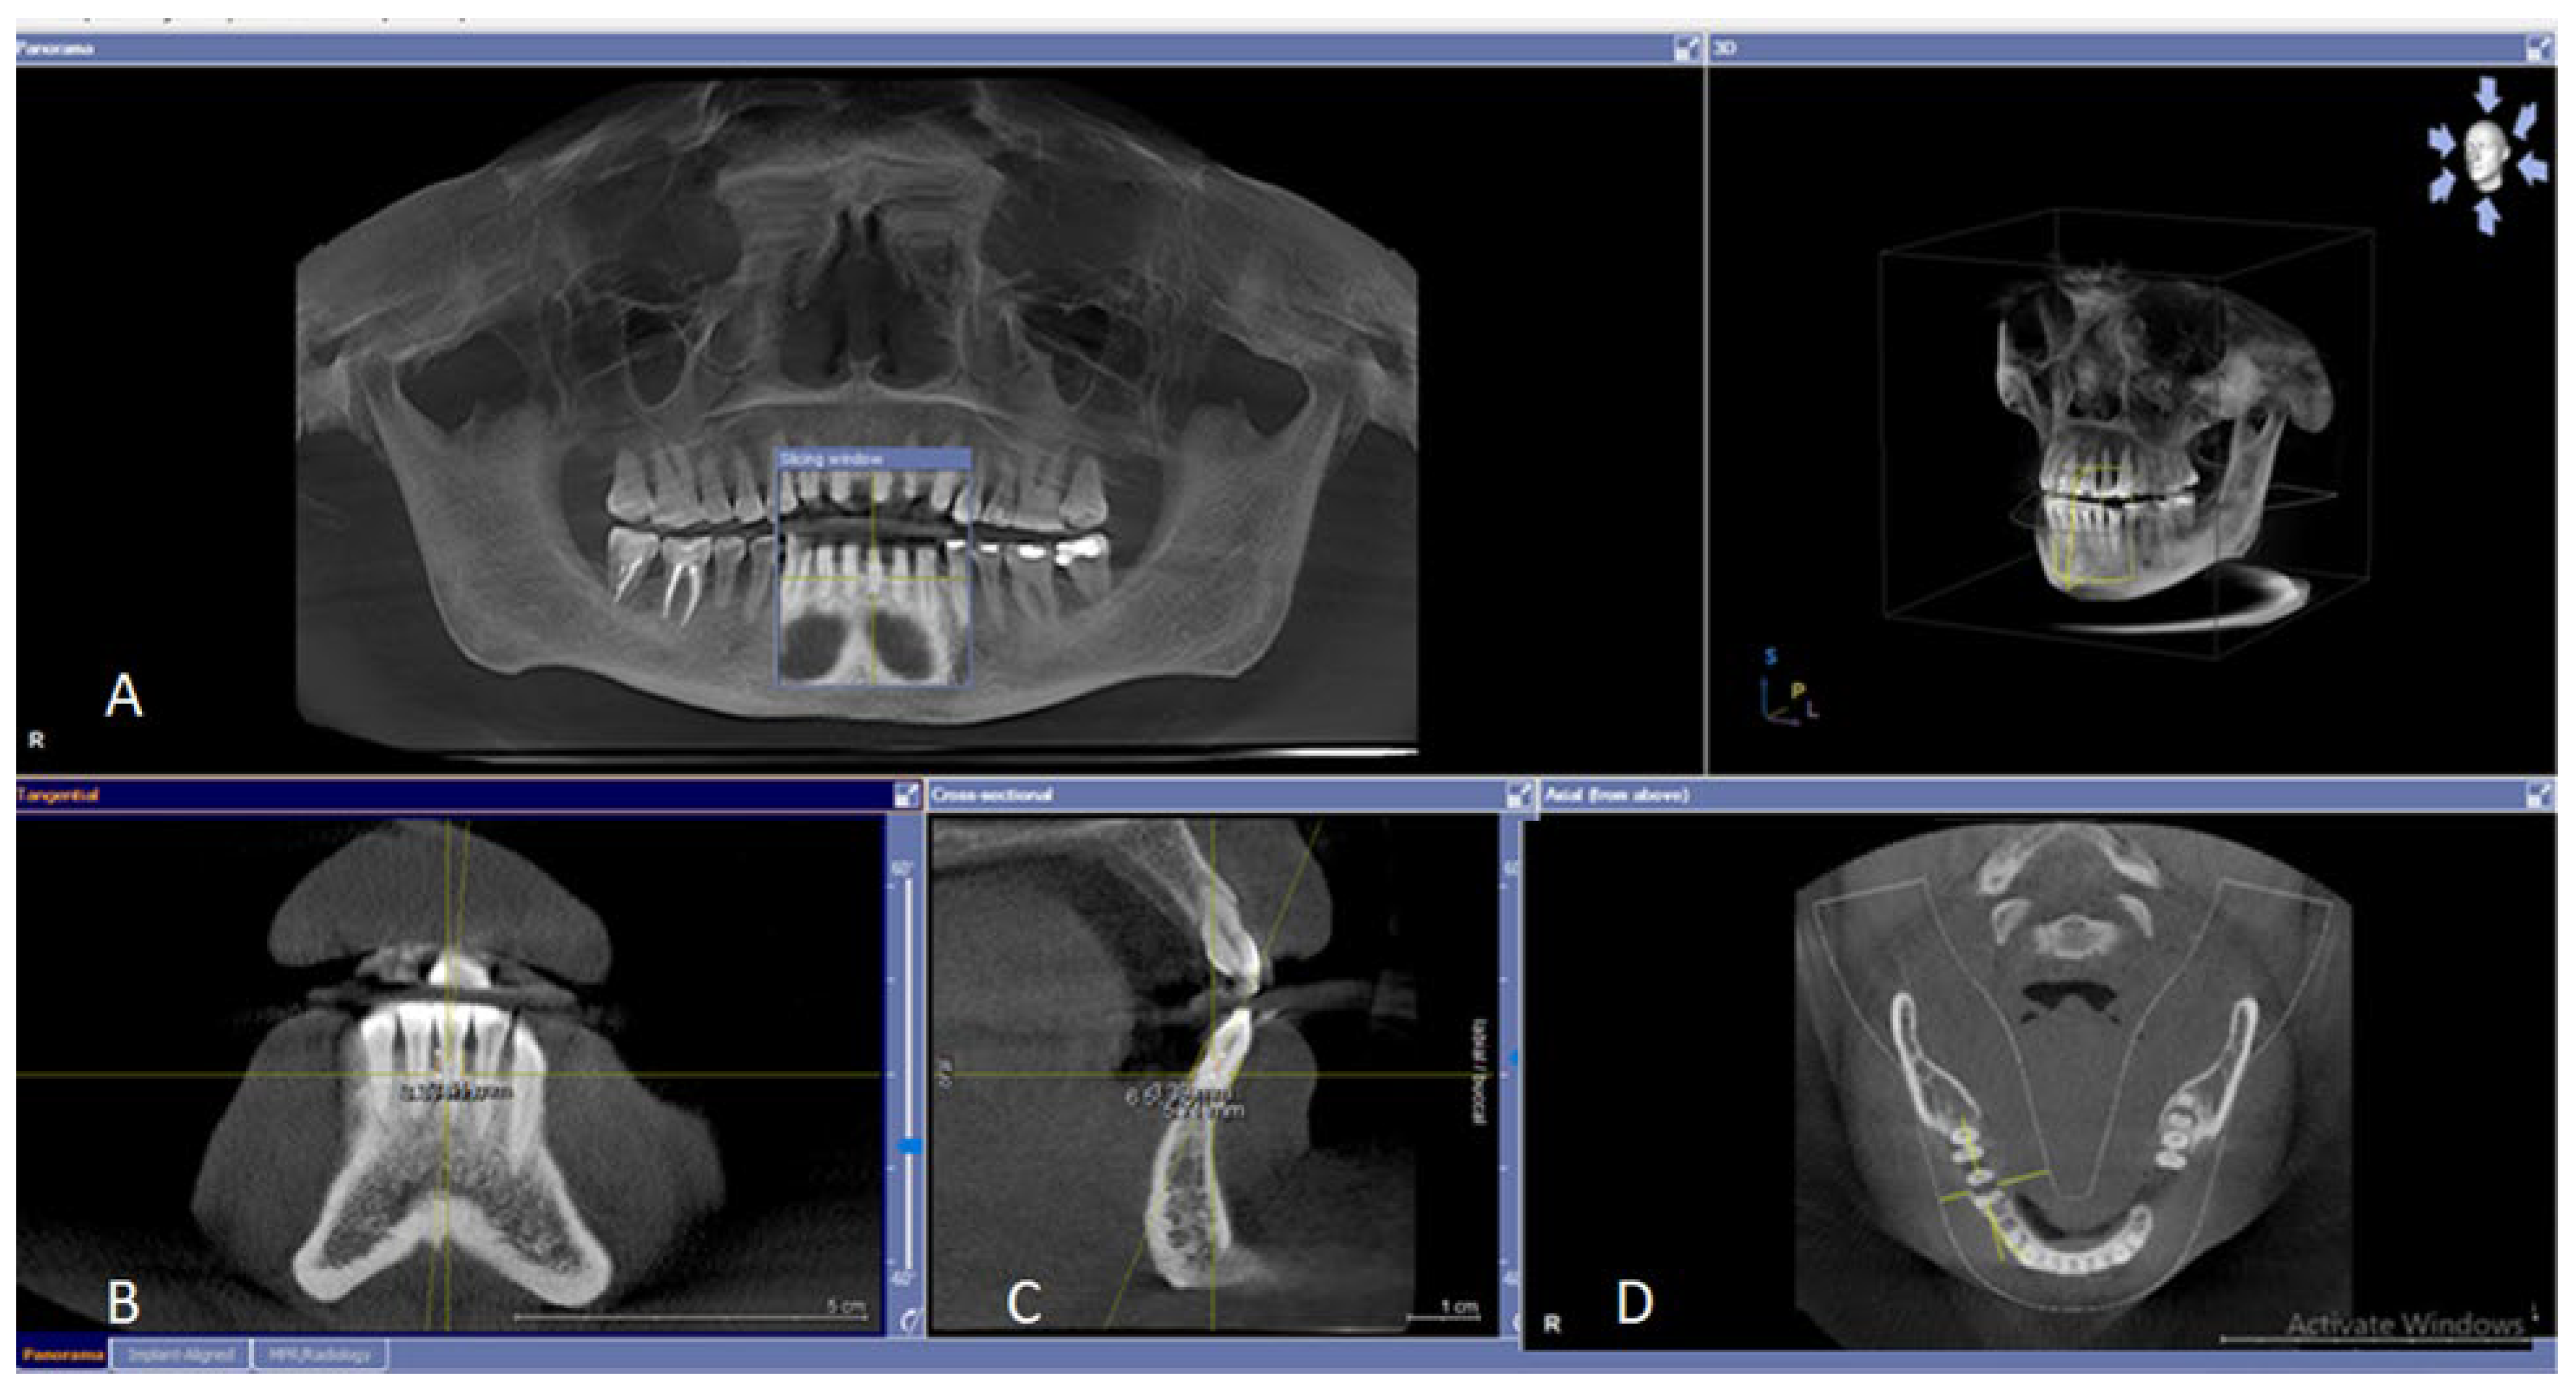
2.1. CBCT Imaging
2.2. Study Design and Measurements
2.3. Inclusion and Exclusion Criteria
2.4. Study Registration
2.5. Inter- and Intra-Examiner Calibration
2.6. Sample Size Calculation
2.7. Statistical Analysis
3. Results
4. Discussion
5. Conclusions
Funding
Institutional Review Board Statement
Informed Consent Statement
Data Availability Statement
Acknowledgments
Conflicts of Interest
References
- Caton, J.G.; Armitage, G.; Berglundh, T.; Chapple, I.L.; Jepsen, S.; Kornman, K.S.; Mealey, B.L.; Papapanou, P.N.; Sanz, M.; Tonetti, M.S.; et al. A new classification scheme for periodontal and peri-implant diseases and conditions—Introduction and key changes from the 1999 classification. J. Periodontol. 2018, 89, S1–S8. [Google Scholar] [CrossRef] [PubMed]
- Papapanou, P.N.; Sanz, M.; Buduneli, N.; Dietrich, T.; Feres, M.; Fine, D.H.; Flemmig, T.F.; Garcia, R.; Giannobile, W.V.; Graziani, F.; et al. Periodontitis: Consensus report of workgroup 2 of the 2017 World Workshop on the Classification of Periodontal and Peri-Implant Diseases and Conditions. J. Periodontol. 2018, 89, S173–S182. [Google Scholar] [CrossRef] [PubMed] [Green Version]
- Fine, D.H.; Armitage, G.C.; Genco, R.J.; Griffen, A.L.; Diehl, S.R. Unique etiologic, demographic, and pathologic characteristics of localized aggressive periodontitis support classification as a distinct subcategory of periodontitis. J. Am. Dent. Assoc. 2019, 150, 922–931. [Google Scholar] [CrossRef] [PubMed]
- Meng, H.; Xu, L.; Li, Q.; Han, J.; Zhao, Y. Determinants of host susceptibility in aggressive periodontitis. Periodontology 2000 2007, 43, 133–159. [Google Scholar] [CrossRef] [PubMed]
- Bragger, U. Radiographic parameters: Biological significance and clinical use. Periodontology 2000 2005, 39, 73–90. [Google Scholar] [CrossRef] [PubMed]
- Eickholz, P.; Hausmann, E. Accuracy of radiographic assessment of interproximal bone loss in intrabony defects using linear measurements. Eur. J. Oral Sci. 2000, 108, 70–73. [Google Scholar] [CrossRef]
- Tugnait, A.; Clerehugh, V.; Hirschmann, P. The usefulness of radiographs in diagnosis and management of periodontal diseases: A review. J. Dent. 2000, 28, 219–226. [Google Scholar] [CrossRef]
- Goldman, H.M.; Cohen, D.W. The Infrabony Pocket: Classification and Treatment. J. Periodontol. 1958, 29, 272–291. [Google Scholar] [CrossRef]
- Hausmann, E.; Allen, K.; Clerehugh, V. What alveolar crest level on a bite-wing radiograph represents bone loss? J. Periodontol. 1991, 62, 570–572. [Google Scholar] [CrossRef]
- Kallestal, C.; Matsson, L. Criteria for assessment of interproximal bone loss on bite-wing radiographs in adolescents. J. Clin. Periodontol. 1989, 16, 300–304. [Google Scholar] [CrossRef]
- Regan, J.E.; Mitchell, D.F. Roentgenographic and dissection measurements of alveolar crest height. J. Am. Dent. Assoc. 1963, 66, 356–359. [Google Scholar] [CrossRef]
- Vandenberghe, B.; Jacobs, R.; Yang, J. Topographic assessment of periodontal craters and furcation involvements by using 2D digital images versus 3D cone beam CT: An in-vitro Study. Chin. J. Dent. Res. 2007, 10, 21. [Google Scholar]
- Pour, D.G.; Romoozi, E.; Shayesteh, Y.S. Accuracy of Cone Beam Computed Tomography for Detection of Bone Loss. J. Dent. Tehran Univ. Med. Sci. 2015, 12, 513–523. [Google Scholar]
- Zardawi, F.M.; Aboudb, A.N.; Khursheeda, D.A. A retrospective panoramic study for alveolar bone loss among young adults in Sulaimani City, Iraq. Sulaimani Dent. J. 2014, 1, 94–98. [Google Scholar] [CrossRef]
- Zhang, W.; Foss, K.; Wang, B.-Y. A retrospective study on molar furcation assessment via clinical detection, intraoral radiography and cone beam computed tomography. BMC Oral Health 2018, 18, 75. [Google Scholar] [CrossRef] [Green Version]
- Albandar, J.M.; Brown, L.J.; Loe, H. Clinical Features of Early-Onset Periodontitis. J. Am. Dent. Assoc. 1997, 128, 1393–1399. [Google Scholar] [CrossRef]
- Tonetti, M.S.; Greenwell, H.; Kornman, K.S. Staging and grading of periodontitis: Framework and proposal of a new classification and case definition. J. Periodontol. 2018, 89, S159–S172. [Google Scholar] [CrossRef] [Green Version]
- Sahibzada, H.A. Pattern and causes of tooth extraction in patients reporting to a teaching dental hospital. J. Islamabad Med. Dent. Coll. 2016, 5, 172–176. [Google Scholar]
- de Toledo, B.E.C.; Barroso, E.M.; Martins, A.T.; Zuza, E.P. Prevalence of periodontal bone loss in Brazilian adolescents through interproximal radiography. Int. J. Dent. 2012, 2012, 357056. [Google Scholar] [CrossRef] [Green Version]
- Fitriananda, A.K.; Kiswanjaya, B.; Bachtiar-Iskandar, H.H. Alveolar Bone Loss Analysis on Dental Digital Radiography Image. Makara J. Health Res. 2021, 25, 8. [Google Scholar]
- Alsaegh, M.A.; Albadrani, A.W. Pattern and Reasons for Permanent Tooth Extractions at Dental Clinics of the University of Science and Technology of Fujairah, UAE. Open Dent. J. 2020, 14, 143–149. [Google Scholar] [CrossRef] [Green Version]
- Da’ameh, D.A. Reasons for permanent tooth extraction in the North of Afghanistan. J. Dent. 2006, 34, 48–51. [Google Scholar] [CrossRef] [PubMed]
- Chukwuneke, F.; Anyanechi, C. Survey of the reasons for dental extraction in Eastern Nigeria. Ann. Med. Health Sci. Res. 2012, 2, 129–133. [Google Scholar] [CrossRef] [PubMed] [Green Version]
- Bimstein, E. Frequency of alveolar bone loss adjacent to proximal caries in the primary molars and healing due to restoration of the teeth. Pediatr. Dent. 1992, 14, 30–33. [Google Scholar] [PubMed]
- Natto, Z.S.; Hameedaldain, A. Methodological Quality Assessment of Meta-analyses and Systematic Reviews of the Relationship Between Periodontal and Systemic Diseases. J. Evid. Based Dent. Pract. 2019, 19, 131–139. [Google Scholar] [CrossRef]
- Eke, P.I.; Dye, B.A.; Wei, L.; Slade, G.D.; Thornton-Evans, G.O.; Borgnakke, W.S.; Taylor, G.W.; Page, R.C.; Beck, J.D.; Genco, R.J. Update on Prevalence of Periodontitis in Adults in the United States: NHANES 2009 to 2012. J. Periodontol. 2015, 86, 611–622. [Google Scholar] [CrossRef] [Green Version]
- Najim, U.; Slotte, C.; Norderyd, O. Prevalence of furcation-involved molars in a Swedish adult population. A radiographic epidemiological study. Clin. Exp. Dent. Res. 2016, 2, 104–111. [Google Scholar] [CrossRef] [Green Version]
- Wiebe, C.B.; Putnins, E.E. The periodontal disease classification system of the American Academy of Periodontology—An update. J. Can. Dent. Assoc. 2000, 66, 594–599. [Google Scholar]
- Jayakumar, A.; Rohini, S.; Naveen, A.; Haritha, A.; Reddy, K. Horizontal alveolar bone loss: A periodontal orphan. J. Indian Soc. Periodontol. 2010, 14, 181–185. [Google Scholar] [CrossRef]
- Helmi, M.F.; Huang, H.; Goodson, J.M.; Hasturk, H.; Tavares, M.; Natto, Z.S. Prevalence of periodontitis and alveolar bone loss in a patient population at Harvard School of Dental Medicine. BMC Oral Health 2019, 19, 254. [Google Scholar] [CrossRef] [Green Version]
- Dye, B.A.; Tan, S.; Smith, V.; Barker, L.K.; Thornton-Evans, G.; Eke, P.I.; Beltrán-Aguilar, E.D. Trends in Oral Health Status; United States, 1988–1994 and 1999–2004; CDC: Atlanta, GA, USA, 2007. [Google Scholar]
- Zhao, H.; Li, C.; Lin, L.; Pan, Y.; Wang, H.; Zhao, J.; Tan, L.; Pan, C.; Song, J.; Zhang, D. Assessment of Alveolar Bone Status in Middle Aged Chinese (40-59 Years) with Chronic Periodontitis—Using CBCT. PLoS ONE 2015, 10, e0139553. [Google Scholar] [CrossRef] [PubMed] [Green Version]
- Brunton, P.A. Prevention in clinical oral health care. Br. Dent. J. 2008, 204, 217. [Google Scholar] [CrossRef]
- Natto, Z.S.; Aladmawy, M.; Alasqah, M.; Papas, A. Factors contributing to tooth loss among the elderly: A cross sectional study. Singap. Dent. J. 2014, 35, 17–22. [Google Scholar] [CrossRef] [PubMed] [Green Version]
- Eke, P.I.; Wei, L.; Borgnakke, W.S.; Thornton-Evans, G.; Zhang, X.; Lu, H.; McGuire, L.C.; Genco, R.J. Periodontitis prevalence in adults ≥ 65 years of age, in the USA. Periodontology 2000 2016, 72, 76–95. [Google Scholar] [CrossRef] [PubMed]


| Demographic Profile of the Study Sample | ||||
|---|---|---|---|---|
| (n) CBCT | 250 | (n) Teeth examined = 6067 | ||
| Number of present 1st molars and incisors teeth and sites examined | Total | 2578 Teeth 10,312 Sites | Maxilla | 1313—T |
| 5252—S | ||||
| Mandible | 1265—T | |||
| 5060—S | ||||
| Number of missing 1st molar and incisors T. Total 422 | 1st Molars | 332 78.67% | Male | 136 (32.23%) |
| Female | 196 (46.44%) | |||
| Incisors | 90 21.32% | Male | 52 (12.32%) | |
| Female | 38 (9.0%) | |||
| Number of 1ST molars and incisors present | First molars | 668 (25.9%) | Maxilla | 370 (14.35%) |
| Mandible | 298 (11.56%) | |||
| Incisors | 1910 (74.1%) | Maxilla | 943 (36.57%) | |
| Mandible | 967 (37.515) | |||
| Sex | Male | Female | ||
| 97 (38.8%) | 153 (61.2%) | |||
| Age | 18–79 | Mean + SD | 40.68 ± 13.12 | |
| Group-1 | 18–20 | n = 14 (5.6%) | ||
| Group-2 | 21–30 | n = 49 (19.6%) | ||
| Group-3 | 31–40 | n = 66 (26.4%) | ||
| Group-4 | 41–50 | n = 65 (26.0%) | ||
| Group-5 | 51–60 | n = 35 (14.0%) | ||
| Group-6 | >60 | n = 21 (8.4%) | ||
| Frequency, Percentage, and Pattern of Bone Loss | |||||||||
|---|---|---|---|---|---|---|---|---|---|
| Frequency & % by Teeth | 1st Molars = 58 (1%) | Incisors = 540 (8.9%) | Total = 23.2% | ||||||
| By Sites | 1st Molars—total | Incisors—total | |||||||
| Site | M | B | L | D | M | B | L | D | |
| Frequency | 55 | 11 | 11 | 57 | 538 | 276 | 229 | 539 | |
| Percentage | 8.2 | 1.6 | 1.6 | 8.6 | 28.2 | 14.6 | 12 | 28.3 | |
| Amount (mm) | 0.811 | 0.327 | 0.264 | 0.85 | 5.67 | 4.050 | 2.296 | 5.59 | |
| Pattern total No. of 1st molars n = 668 T | H | 37 | Pattern total No. of incisors n = 1910 T | H | 434 | ||||
| V | 19 | V | 51 | ||||||
| Non-affected | 612 | ^ Pv 0.00 | Non-affected | 1370 | ^ Pv 0.00 | ||||
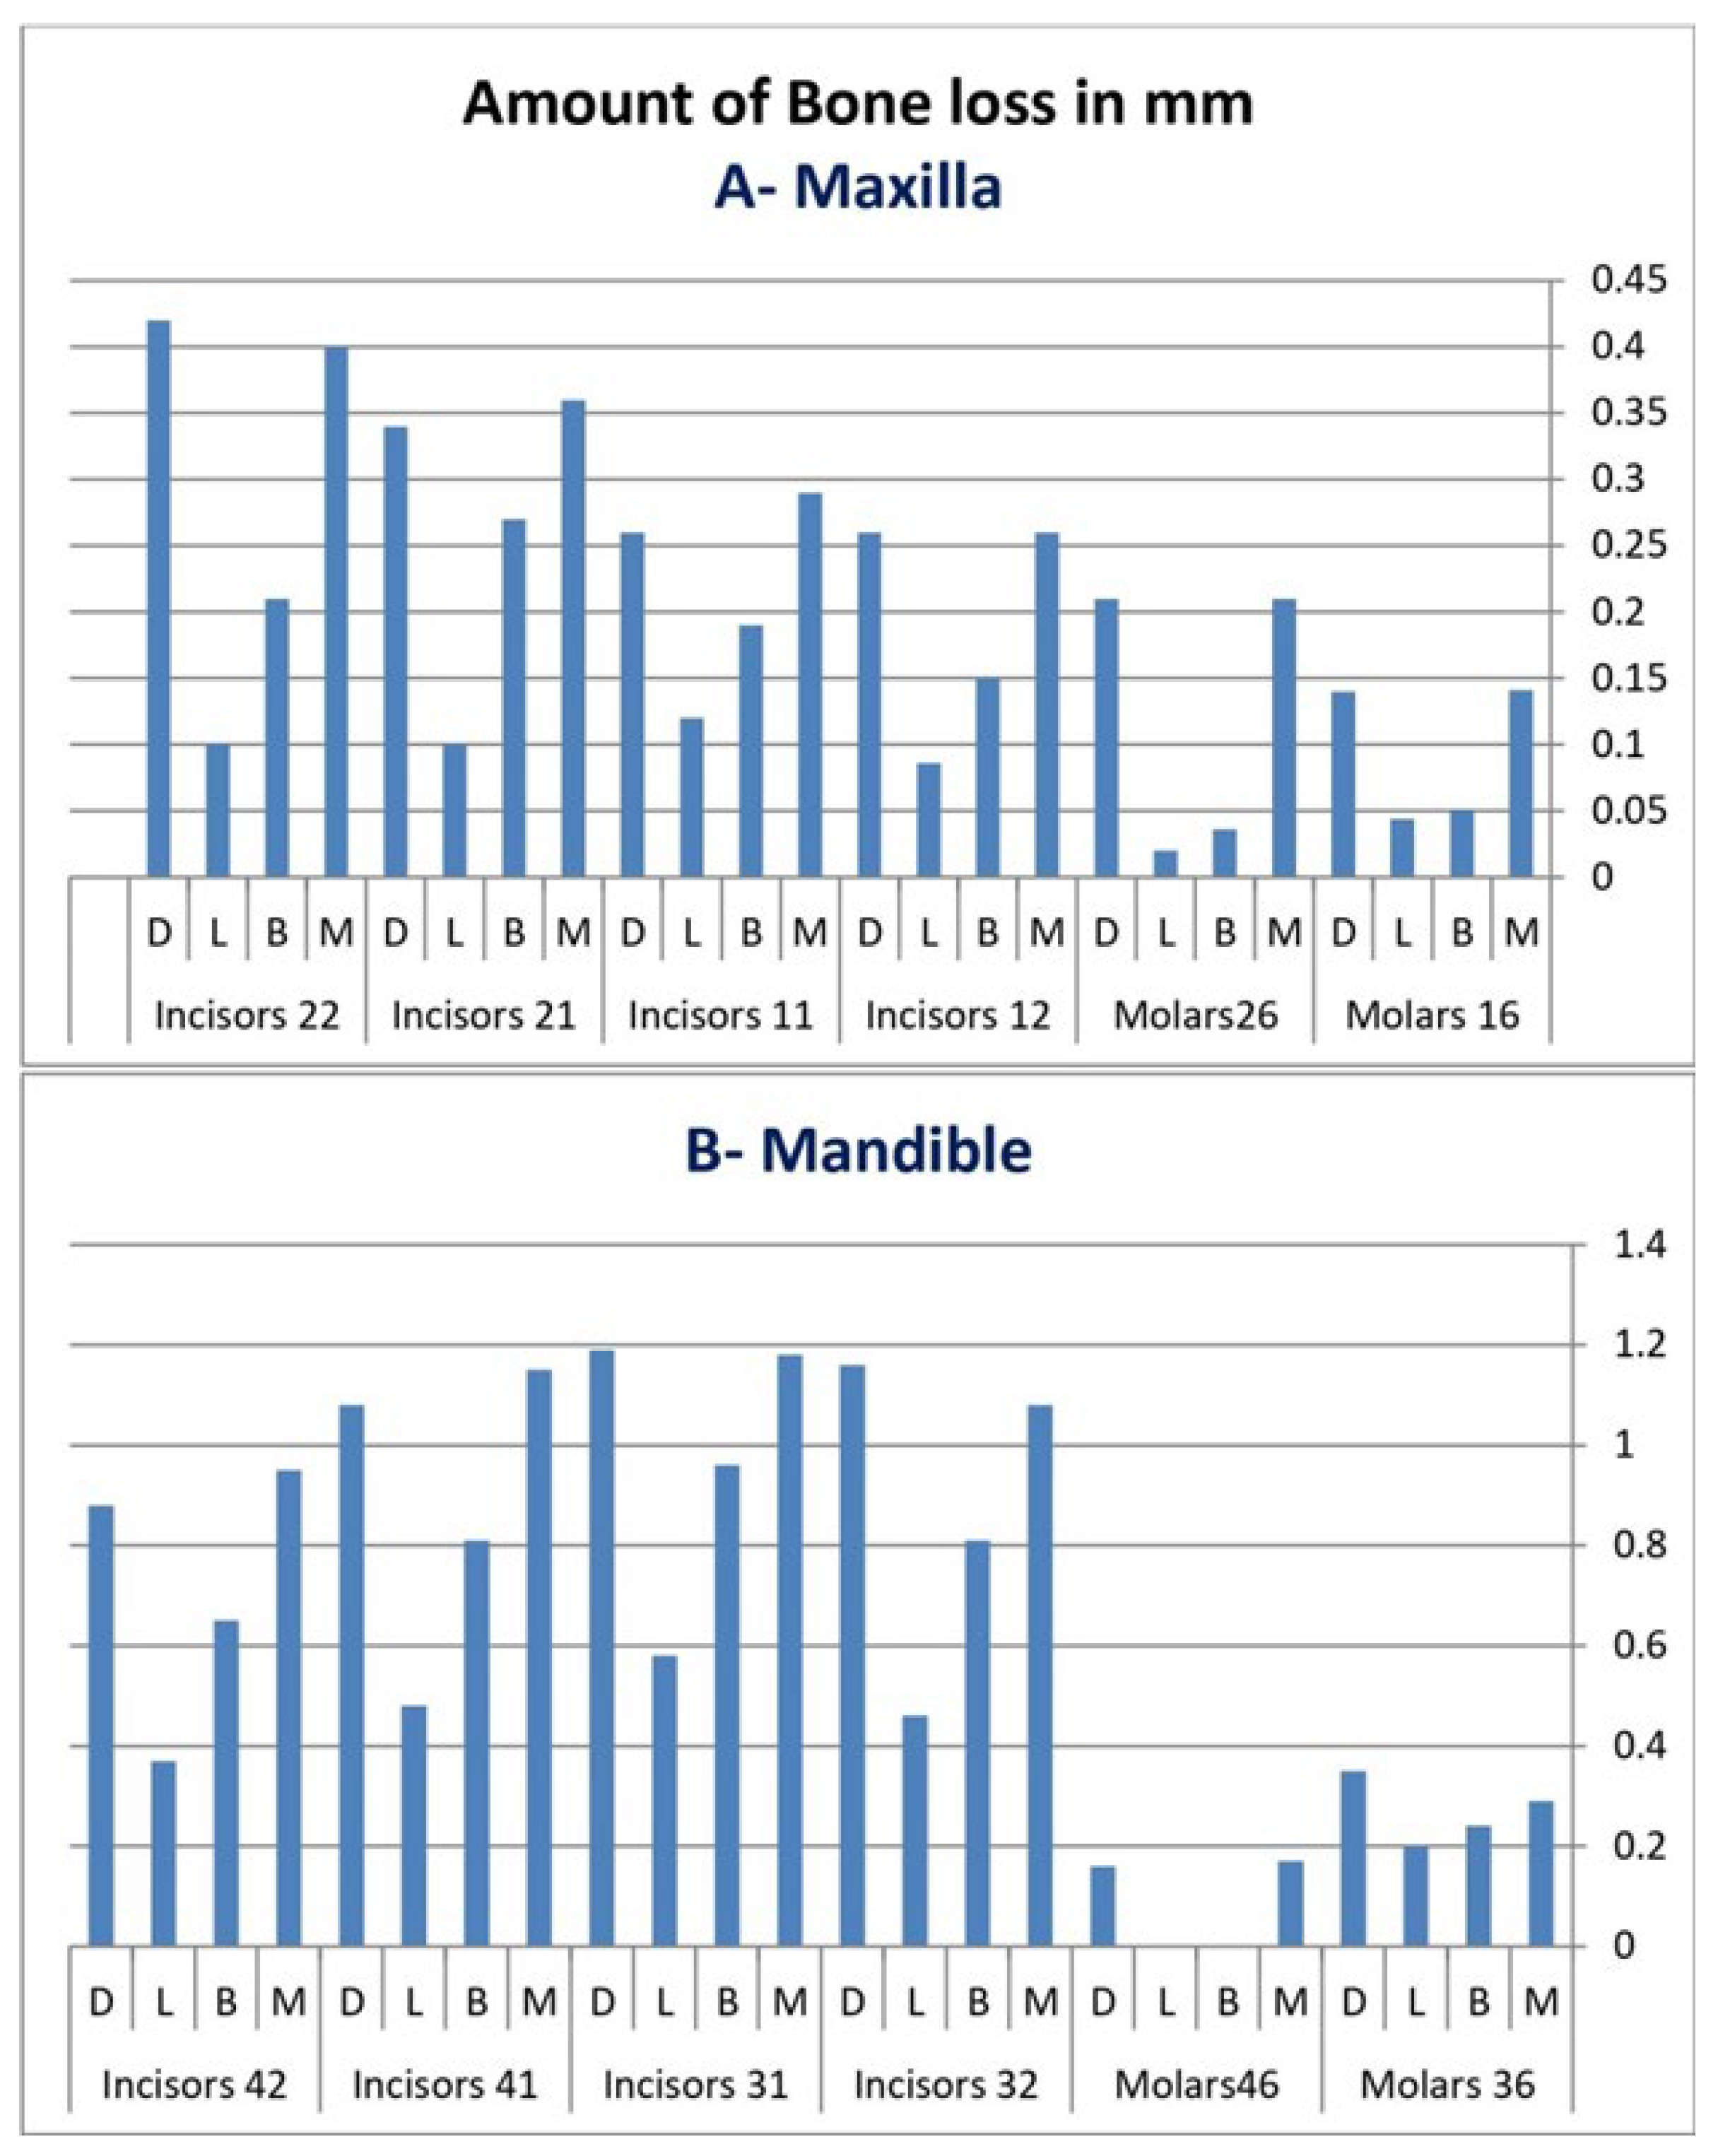
| Maxilla | Maxillary 1st molars | Maxillary incisors | |||||||
| Site | M | B | L | D | M | B | L | D | |
| Frequency | 23 | 4 | 4 | 24 | 129 | 65 | 55 | 127 | |
| Percentage | 6.2 | 1.1 | 1.1 | 7 | 13.7 | 7.1 | 5.8 | 13.5 | |
| Amount (mm) | 0.351 | 0.087 | 0.064 | 0.35 | 1.31 | 0.82 | 0.406 | 1.28 | |
| Pattern Maxillary 1st molars n = 370 | H | 17 | ^ Pv 0.001 | Pattern maxillary incisors n = 943 T | H | 114 | ^ Pv 0.001 | ||
| V | 6 | V | 14 | ||||||
| Non-affected | 347 | Non-affected | 815 | ||||||
| Mandible | Mandibular 1st molars | Mandibular incisors | |||||||
| Site | M | B | L | D | M | B | L | D | |
| Frequency | 32 | 7 | 7 | 33 | 409 | 213 | 174 | 412 | |
| Percentage | 10.7 | 2.3 | 2.4 | 11.1 | 42.3 | 21.9 | 18 | 42.2 | |
| Amount (mm) | 0.46 | 0.24 | 0.20 | 0.51 | 4.36 | 3.23 | 1.89 | 4.31 | |
| Pattern maxillary 1st molars n = 298 T | H | 20 | ^ Pv 0.001 | Pattern mandible incisors n = 967 T | H | 320 | ^ Pv 0.001 | ||
| V | 13 | V | 37 | ||||||
| Non-affected | 265 | Non-affected | 610 | ||||||
| Site | M | B | D | L/P | Site | M | B | D | L/P | ||||||||||
|---|---|---|---|---|---|---|---|---|---|---|---|---|---|---|---|---|---|---|---|
| Teeth Number and Sites | Frq | % | Frq | % | Frq | % | Frq | % | PV | Teeth Number and Sites | Frq | % | Frq | % | Frq | % | Frq | % | PV |
| 11 nT-232 nS-928 | 29 | 12.6 | 11 | 4.7 | 28 | 12.1 | 14 | 6 | 0.01 | 21 nT-237 nS-948 | 35 | 14.8 | 21 | 8.4 | 35 | 14.8 | 16 | 6.8 | 0.01 |
| Amount mm | 0.29 | 0.19 | 0.12 | 0.26 | Amount mm | 0.36 | 0.27 | 0.10 | 0.34 | ||||||||||
| 12 nT-236 nS-944 | 25 | 10.6 | 11 | 4.7 | 25 | 10.7 | 10 | 4.2 | 0.01 | 22 nT-238 nS-952 | 40 | 16.8 | 18 | 7.6 | 39 | 16.4 | 15 | 6.3 | 0.01 |
| Amount mm | 0.26 | 0.15 | 0.09 | 0.26 | Amount mm | 0.40 | 0.21 | 0.10 | 0.42 | ||||||||||
| 16 nT-178 Ns-712 | 11 | 6.1 | 2 | 1.1 | 10 | 5.6 | 2 | 1.1 | 0.02 | 26 nT-192 nS-768 | 12 | 6.3 | 2 | 1 | 13 | 6.8 | 2 | 1 | 0.01 |
| Amount mm | 0.141 | 0.051 | 0.044 | 0.14 | Amount mm | 0.21 | 0.036 | 0.02 | 0.21 | ||||||||||
| 16 | Fur n % | 3 1.2% | 26 | Fur n % | 1 0.4% | ||||||||||||||
| 31 nT-238 nS-948 | 107 | 45 | 60 | 25.3 | 108 | 45.4 | 50 | 21 | 0.01 | 41 nT-238 nS-952 | 103 | 43.3 | 54 | 22.7 | 103 | 43.3 | 41 | 17.2 | 0.01 |
| Amount mm | 0.18 | 0.96 | 0.58 | 1.19 | Amount mm | 1.15 | 0.81 | 0.48 | 1.08 | ||||||||||
| 32 nT-247 nS-988 | 105 | 42.5 | 53 | 21.5 | 107 | 43.5 | 46 | 18.6 | 0.01 | 42 nT-244 nS-988 | 94 | 38.5 | 43 | 17.6 | 92 | 37.7 | 37 | 15.2 | 0.01 |
| Amount mm | 1.08 | 0.81 | 0.46 | 1.16 | Amount mm | 0.95 | 0.65 | 0.37 | 0.88 | ||||||||||
| 36 nT-146 nS-584 | 18 | 12.3 | 7 | 4.8 | 19 | 13.1 | 7 | 4.8 | 0.036 | 46 nT-152 nS-616 | 14 | 9..2 | 1 | 0.7 | 14 | 9.3 | 0 | 0 | 0.01 |
| Amount mm | 0.29 | 0.24 | 0.20 | 0.35 | Amount mm | 0.16 | 0.0 | 0.0 | 0.16 | ||||||||||
| 36 | Fur n % | 7 2.8% | 46 | Fur n % | 1 0.4% | • Friedman’s Test for Furcation.16, 26,36,46 | |||||||||||||
| Pv = 0.300 | |||||||||||||||||||
| Tooth numbers and statistical differences between age groups | |||||||||||
| 16 (0.001) | 12 (0.001) | 11 (0.001) | 21 (0.001) | 22 (0.001) | 26 (0.001) | ||||||
| 1*5 | 0.001 | 1*5 | 0.002 | 1*5 | 0.05 | 1*5 | 0.001 | 1*5 | 0.001 | 1*5 | 0.001 |
| 2*5 | 0.001 | 1*6 | 0.001 | 1*6 | 0.001 | 1*6 | 0.02 | 1*6 | 0.001 | 2*5 | 0.001 |
| 3*5 | 0.001 | 2*5 | 0.001 | 2*5 | 0.01 | 2*4 | 0.001 | 2*4 | 0.002 | 3*5 | 0.001 |
| 4*5 | 0.001 | 2*6 | 0.001 | 2*6 | 0.001 | 2*5 | 0.001 | 2*5 | 0.001 | 4*5 | 0.001 |
| 5*6 | 0.001 | 3*5 | 0.001 | 3*5 | 0.001 | 2*6 | 0.001 | 2*6 | 0.001 | 5*6 | 0.001 |
| 3*6 | 0.001 | 3*6 | 0.001 | 3*4 | 0.01 | 3*4 | 0.003 | ||||
| 4*6 | 0.001 | 4*6 | 0.001 | 3*5 | 0.001 | ||||||
| 3*6 | 0.001 | ||||||||||
| 36 (0.001) | 32 (0.001) | 31 (0.001) | 41 (0.001) | 42 (0.001) | 46 (0.084) | ||||||
| 1*5 | 0.001 | 1*4 | 0.001 | 1*4 | 0.001 | 1*4 | 0.001 | 1*4 | 0.007 | 1*6 | 0.02 |
| 1*6 | 0.01 | 1*5 | 0.001 | 1*5 | 0.001 | 1*5 | 0.001 | 1*5 | 0.001 | 2*6 | 0.01 |
| 2*5 | 0.001 | 1*6 | 0.001 | 1*6 | 0.001 | 1*6 | 0.001 | 1*6 | 0.001 | ||
| 2* | 0.01 | 2*4 | 0.001 | 2*4 | 0.001 | 2*4 | 0.001 | 2*4 | 0.001 | ||
| 3*5 | 0.001 | 2*5 | 0.001 | 2*5 | 0.001 | 2*5 | 0.001 | 2*5 | 0.001 | ||
| 3*6 | 0.01 | 2*6 | 0.001 | 2*6 | 0.001 | 2*6 | 0.001 | 2*6 | 0.001 | ||
| 4*5 | 0.001 | 3*4 | 0.001 | 3*4 | 0.001 | 3*4 | 0.001 | 3*4 | 0.001 | ||
| 3*5 | 0.001 | 3*5 | 0.001 | 3*5 | 0.001 | 3*5 | 0.001 | ||||
| 3*6 | 0.001 | 3*6 | 0.001 | 3*6 | 0.001 | 3*6 | 0.001 | ||||
| 4*5 | 0.001 | 4*5 | 0.001 | 4*5 | 0.001 | 4*5 | 0.003 | ||||
| 4*6 | 0.001 | 4*6 | 0.001 | 4*6 | 0.001 | 4*6 | 0.001 | ||||
Publisher’s Note: MDPI stays neutral with regard to jurisdictional claims in published maps and institutional affiliations. |
© 2022 by the author. Licensee MDPI, Basel, Switzerland. This article is an open access article distributed under the terms and conditions of the Creative Commons Attribution (CC BY) license (https://creativecommons.org/licenses/by/4.0/).
Share and Cite
Zardawi, F.M. First Molars–Incisors Rate and Pattern of Bone Loss: A Cross-Sectional Analysis of CBCT Images. Diagnostics 2022, 12, 1536. https://doi.org/10.3390/diagnostics12071536
Zardawi FM. First Molars–Incisors Rate and Pattern of Bone Loss: A Cross-Sectional Analysis of CBCT Images. Diagnostics. 2022; 12(7):1536. https://doi.org/10.3390/diagnostics12071536
Chicago/Turabian StyleZardawi, Faraedon Mostafa. 2022. "First Molars–Incisors Rate and Pattern of Bone Loss: A Cross-Sectional Analysis of CBCT Images" Diagnostics 12, no. 7: 1536. https://doi.org/10.3390/diagnostics12071536
APA StyleZardawi, F. M. (2022). First Molars–Incisors Rate and Pattern of Bone Loss: A Cross-Sectional Analysis of CBCT Images. Diagnostics, 12(7), 1536. https://doi.org/10.3390/diagnostics12071536