
Repeatability of Contrast-Enhanced Ultrasound to Determine Renal Cortical Perfusion

 ,
, 
Abstract
:
1. Introduction
2. Materials and Methods
2.1. Participant Characteristics
2.2. Study Procedures
2.3. Renal CEUS Technique
2.4. Ultrasound Machine Settings
2.5. Image Acquisition
2.6. Image Analysis
2.7. Statistical Analysis
3. Results
3.1. Perfusion Variables
3.2. Intra-Individual Repeatability
3.3. Inter-Operator Variability
3.4. Relationship between Perfusion Variables and Personal Characteristics
4. Discussion
5. Conclusions
Author Contributions
Funding
Institutional Review Board Statement
Informed Consent Statement
Data Availability Statement
Conflicts of Interest
References
- Harrois, A.; Grillot, N.; Figueiredo, S.; Duranteau, J. Acute kidney injury is associated with a decrease in cortical renal perfusion during septic shock. Crit. Care 2018, 22, 161. [Google Scholar] [CrossRef] [PubMed] [Green Version]
- Yoon, H.E.; Kim, D.W.; Kim, D.; Kim, Y.; Shin, S.J.; Shin, Y.R. A pilot trial to evaluate the clinical usefulness of contrast-enhanced ultrasound in predicting renal outcomes in patients with acute kidney injury. PLoS ONE 2020, 15, e0235130. [Google Scholar] [CrossRef] [PubMed]
- Garessus, J.; Brito, W.; Loncle, N.; Vanelli, A.; Hendriks-Balk, M.; Wuerzner, G.; Schneider, A.; Burnier, M.; Pruijm, M. Cortical perfusion as assessed with contrast-enhanced ultrasound is lower in patients with chronic kidney disease than in healthy subjects but increases under low salt conditions. Nephrol. Dial. Transplant. 2021, 37, 705–712. [Google Scholar] [CrossRef] [PubMed]
- Dong, Y.; Wang, W.P.; Cao, J.; Fan, P.; Lin, X. Early assessment of chronic kidney dysfunction using contrast-enhanced ultrasound: A pilot study. Br. J. Radiol. 2014, 87, 20140350. [Google Scholar] [CrossRef] [Green Version]
- Ma, F.; Cang, Y.; Zhao, B.; Liu, Y.; Wang, C.; Liu, B.; Wu, T.; Song, Y.; Peng, A. Contrast-enhanced ultrasound with SonoVue could accurately assess the renal microvascular perfusion in diabetic kidney damage. Nephrol. Dial. Transplant. 2012, 27, 2891–2898. [Google Scholar] [CrossRef] [Green Version]
- Wang, L.; Wu, J.; Cheng, J.F.; Liu, X.Y.; Ma, F.; Guo, L.H.; Xu, J.M.; Wu, T.; Mohan, C.; Peng, A.; et al. Diagnostic value of quantitative contrast-enhanced ultrasound (CEUS) for early detection of renal hyperperfusion in diabetic kidney disease. J. Nephrol. 2015, 28, 669–678. [Google Scholar] [CrossRef]
- Tsuruoka, K.; Yasuda, T.; Koitabashi, K.; Yazawa, M.; Shimazaki, M.; Sakurada, T.; Shirai, S.; Shibagaki, Y.; Kimura, K.; Tsujimoto, F. Evaluation of Renal Microcirculation by Contrast-Enhanced Ultrasound with SonazoidTM as a Contrast Agent. Int. Heart J. 2010, 51, 176–182. [Google Scholar] [CrossRef] [Green Version]
- Schwenger, V.; Hankel, V.; Seckinger, J.; Macher-Göppinger, S.; Morath, C.; Zeisbrich, M.; Zeier, M.; Kihm, L.P. Contrast-enhanced ultrasonography in the early period after kidney transplantation predicts long-term allograft function. Transplant. Proc. 2014, 46, 3352–3357. [Google Scholar] [CrossRef]
- Odudu, A.; Nery, F.; Harteveld, A.A.; Evans, R.G.; Pendse, D.; Buchanan, C.E.; Francis, S.T.; Fernández-Seara, M.A. Arterial spin labelling MRI to measure renal perfusion: A systematic review and statement paper. Nephrol. Dial. Transplant. 2018, 33 (Suppl. 2), ii15–ii21. [Google Scholar] [CrossRef]
- Schneider, A.; Johnson, L.; Goodwin, M.; Schelleman, A.; Bellomo, R. Bench-to-bedside review: Contrast enhanced ultrasonography—A promising technique to assess renal perfusion in the ICU. Crit. Care 2011, 15, 157. [Google Scholar] [CrossRef] [Green Version]
- Choi, G.; Je, B.K.; Hong, D.; Cha, J. Microvascular Doppler ultrasound in children with acute pyelonephritis. Med. Ultrason. 2021, 23, 161–167. [Google Scholar] [CrossRef] [PubMed]
- De Backer, D.; Orbegozo Cortes, D.; Donadello, K.; Vincent, J.L. Pathophysiology of microcirculatory dysfunction and the pathogenesis of septic shock. Virulence 2014, 5, 73–79. [Google Scholar] [CrossRef] [PubMed] [Green Version]
- Roman, R.J. Renal Blood Flow. In Laser-Doppler Blood Flowmetry: Developments in Cardiovascular Medicine; Shepherd, A.P., Öberg, P.Å., Eds.; Springer: Boston, MA, USA, 1990; Volume 107. [Google Scholar]
- Wan, L.; Yang, N.; Hiew, C.Y.; Schelleman, A.; Johnson, L.; May, C.; Bellomo, R. An assessment of the accuracy of renal blood flow estimation by Doppler ultrasound. Intensive Care Med. 2008, 34, 1503–1510. [Google Scholar] [CrossRef] [PubMed]
- Nicolò, P.D.; Granata, A. Renal intraparenchymal resistive index: The ultrasonographic answer to many clinical questions. J. Nephrol. 2019, 32, 527–538. [Google Scholar] [CrossRef]
- Tublin, M.E.; Bude, R.O.; Platt, J.F. The Resistive Index in Renal Doppler Sonography: Where Do We Stand? Am. J. Roentgenol. 2003, 180, 885–892. [Google Scholar] [CrossRef]
- Haitsma Mulier, J.L.G.; Rozemeijer, S.; Röttgering, J.G.; Spoelstra-de Man, A.M.; Elbers, P.W.; Tuinman, P.R.; de Waard, M.C.; Oudemans-van Straaten, H.M. Renal resistive index as an early predictor and discriminator of acute kidney injury in critically ill patients; A prospective observational cohort study. PLoS ONE 2018, 13, e0197967. [Google Scholar] [CrossRef] [Green Version]
- Ikee, R.; Kobayashi, S.; Hemmi, N.; Imakiire, T.; Kikuchi, Y.; Moriya, H.; Suzuki, S.; Miura, S. Correlation Between the Resistive Index by Doppler Ultrasound and Kidney Function and Histology. Am. J. Kidney Dis. 2003, 46, 603–609. [Google Scholar] [CrossRef]
- Parolini, C.; Noce, A.; Staffolani, E.; Giarrizzo, G.F.; Costanzi, S.; Splendiani, G. Renal Resistive Index and Longterm Outcome in Chronic Nephropathies. Radiology 2009, 252, 888–896. [Google Scholar] [CrossRef]
- Schneider, A.; Hofmann, L.; Wuerzner, G.; Glatz, N.; Maillard, M.; Meuwly, J.Y.; Eggimann, P.; Burnier, M.; Vogt, B. Renal perfusion evaluation with contrast-enhanced ultrasonography. Nephrol. Dial. Transplant. 2012, 27, 674–681. [Google Scholar] [CrossRef]
- Li, L.P.; Tan, H.; Thacker, J.M.; Li, W.; Zhou, Y.; Kohn, O.; Sprague, S.M.; Prasad, P.V. Evaluation of Renal Blood Flow in Chronic Kidney Disease Using Arterial Spin Labeling Perfusion Magnetic Resonance Imaging. Kidney Int. Rep. 2017, 2, 36–43. [Google Scholar] [CrossRef] [Green Version]
- Kihm, L.P.; Blume, C.; Seckinger, J.; Hankel, V.; Stoffler, D.; Morath, C.; Zeier, M.; Schwenger, V. Acute effects of calcineurin inhibitors on kidney allograft microperfusion visualized by contrast-enhanced sonography. Transplantation 2012, 93, 1125–1129. [Google Scholar] [CrossRef] [PubMed]
- Schneider, A.; Goodwin, M.D.; Schelleman, A.; Bailey, M.; Johnson, L.; Bellomo, R. Contrast-enhanced ultrasound to evaluate changes in renal cortical perfusion around cardiac surgery: A pilot study. Crit. Care 2013, 17, R138. [Google Scholar] [CrossRef] [PubMed] [Green Version]
- Cicchetti, D. Guidelines, criteria, and rules of thumb for evaluating normed and standardized assessment instruments in psychology. Psychol. Assess. 1994, 6, 284–290. [Google Scholar] [CrossRef]
- Maklad, N.F.; Ophir, J.; Balsara, V. Attenuation of Ultrasound in Normal Liver and Diffuse Liver Disease In Vivo. Ultrason. Imaging 1984, 6, 117–125. [Google Scholar] [CrossRef] [PubMed]
- Pruijm, M.; Hofmann, L.; Piskunowicz, M.; Muller, M.E.; Zweiacker, C.; Bassi, I.; Vogt, B.; Stuber, M.; Burnier, M. Determinants of renal tissue oxygenation as measured with BOLD-MRI in chronic kidney disease and hypertension in humans. PLoS ONE 2014, 9, e95895. [Google Scholar] [CrossRef] [Green Version]
- Pruijm, M.; Hofmann, L.; Maillard, M.; Tremblay, S.; Glatz, N.; Wuerzner, G.; Burnier, M.; Vogt, B. Effect of sodium loading/depletion on renal oxygenation in young normotensive and hypertensive men. Hypertension 2010, 55, 1116–1122. [Google Scholar] [CrossRef] [Green Version]
- Boss, A.; Martirosian, P.; Jehs, M.C.; Dietz, K.; Alber, M.; Rossi, C.; Claussen, C.D.; Schick, F. Influence of oxygen and carbogen breathing on renal oxygenation measured by T2*-weighted imaging at 3.0 T. NMR Biomed. 2009, 22, 638–645. [Google Scholar] [CrossRef]
- Tiemann, K.; Becher, H.; Lohmeier, S. Real-time assessment of tissue perfusion following bubble destruction at low emission-power—First experimental results using power pulse inversion imaging. J. Am. Coll. Cardiol. 2000, 35, 426A. [Google Scholar]
- Schneider, A.G.; Goodwin, M.D.; Schelleman, A.; Bailey, M.; Johnson, L.; Bellomo, R. Contrast-enhanced ultrasonography to evaluate changes in renal cortical microcirculation induced by noradrenaline: A pilot study. Crit. Care 2014, 18, 653. [Google Scholar] [CrossRef] [Green Version]
- Ignee, A.; Jedrejczyk, M.; Schuessler, G.; Jakubowski, W.; Dietrich, C.F. Quantitative contrast enhanced ultrasound of the liver for time intensity curves-Reliability and potential sources of errors. Eur. J. Radiol. 2010, 73, 153–158. [Google Scholar] [CrossRef]
- Lu, Q.; Huang, B.J.; Xue, L.Y.; Fan, P.L.; Wang, W.P. Differentiation of Renal Tumor Histotypes: Usefulness of Quantitative Analysis of Contrast-Enhanced Ultrasound. AJR Am. J. Roentgenol. 2015, 205, W335–W342. [Google Scholar] [CrossRef] [PubMed]
- Averkiou, M.A.; Correas, J.M.; Lassau, N.; Leen, E.; Piscaglia, F. An EFSUMB introduction into Dynamic Contrast-Enhanced Ultrasound (DCE-US) for quantification of tumour perfusion. Ultraschall Med. 2012, 33, 344–351. [Google Scholar]
- Liu, D.J.X.; Hesta, M.; Stock, E.; Bogaerts, E.; Broeckx, B.J.; Saunders, J.H.; Vanderperren, K. Renal perfusion parameters measured by contrast-enhanced ultrasound in healthy dogs demonstrate a wide range of variability in the long-term. Vet. Radiol. Ultrasound 2019, 60, 201–209. [Google Scholar] [CrossRef] [PubMed]
- Leinonen, M.R.; Raekallio, M.R.; Vainio, O.M.; Ruohoniemi, M.O.; O’Brien, R.T. The Effect of the Sample Size and Location on Contrast Ultrasound Measurement of Perfusion Parameters. Vet. Radiol. Ultrasound 2010, 52, 82–87. [Google Scholar] [CrossRef]


| mTT (Second) | AI (a.u.) | PI (a.u.) | WiR (a.u.) | |||||
|---|---|---|---|---|---|---|---|---|
| Median (IQR) | Range | Median (IQR) | Range | Median (IQR) | Range | Median (IQR) | Range | |
| Scan 1 | 1.07 (0.90–1.34) | [0.77–1.50] | 14,120.50 (9872.13–22,728.00) | [6473.00–31,352.00] | 10,302.64 (8647.33–23,680.44) | [5699.38–32,616.76] | 0.65 (0.51–0.77) | [0.46–0.87] |
| Scan 2 | 1.07 (0.89–1.21) | [0.80–1.34] | 22,083.50 (12,211.13–36,251.62) | [6411.00–52,191.00] | 18,959.96 (9713.19–37,897.76) | [7682.51–55,390.67] | 0.65 (0.57–0.78) | [0.52–0.87] |
| mTT (sec) | AI (a.u.) | PI (a.u.) | WiR (a.u) | |
|---|---|---|---|---|
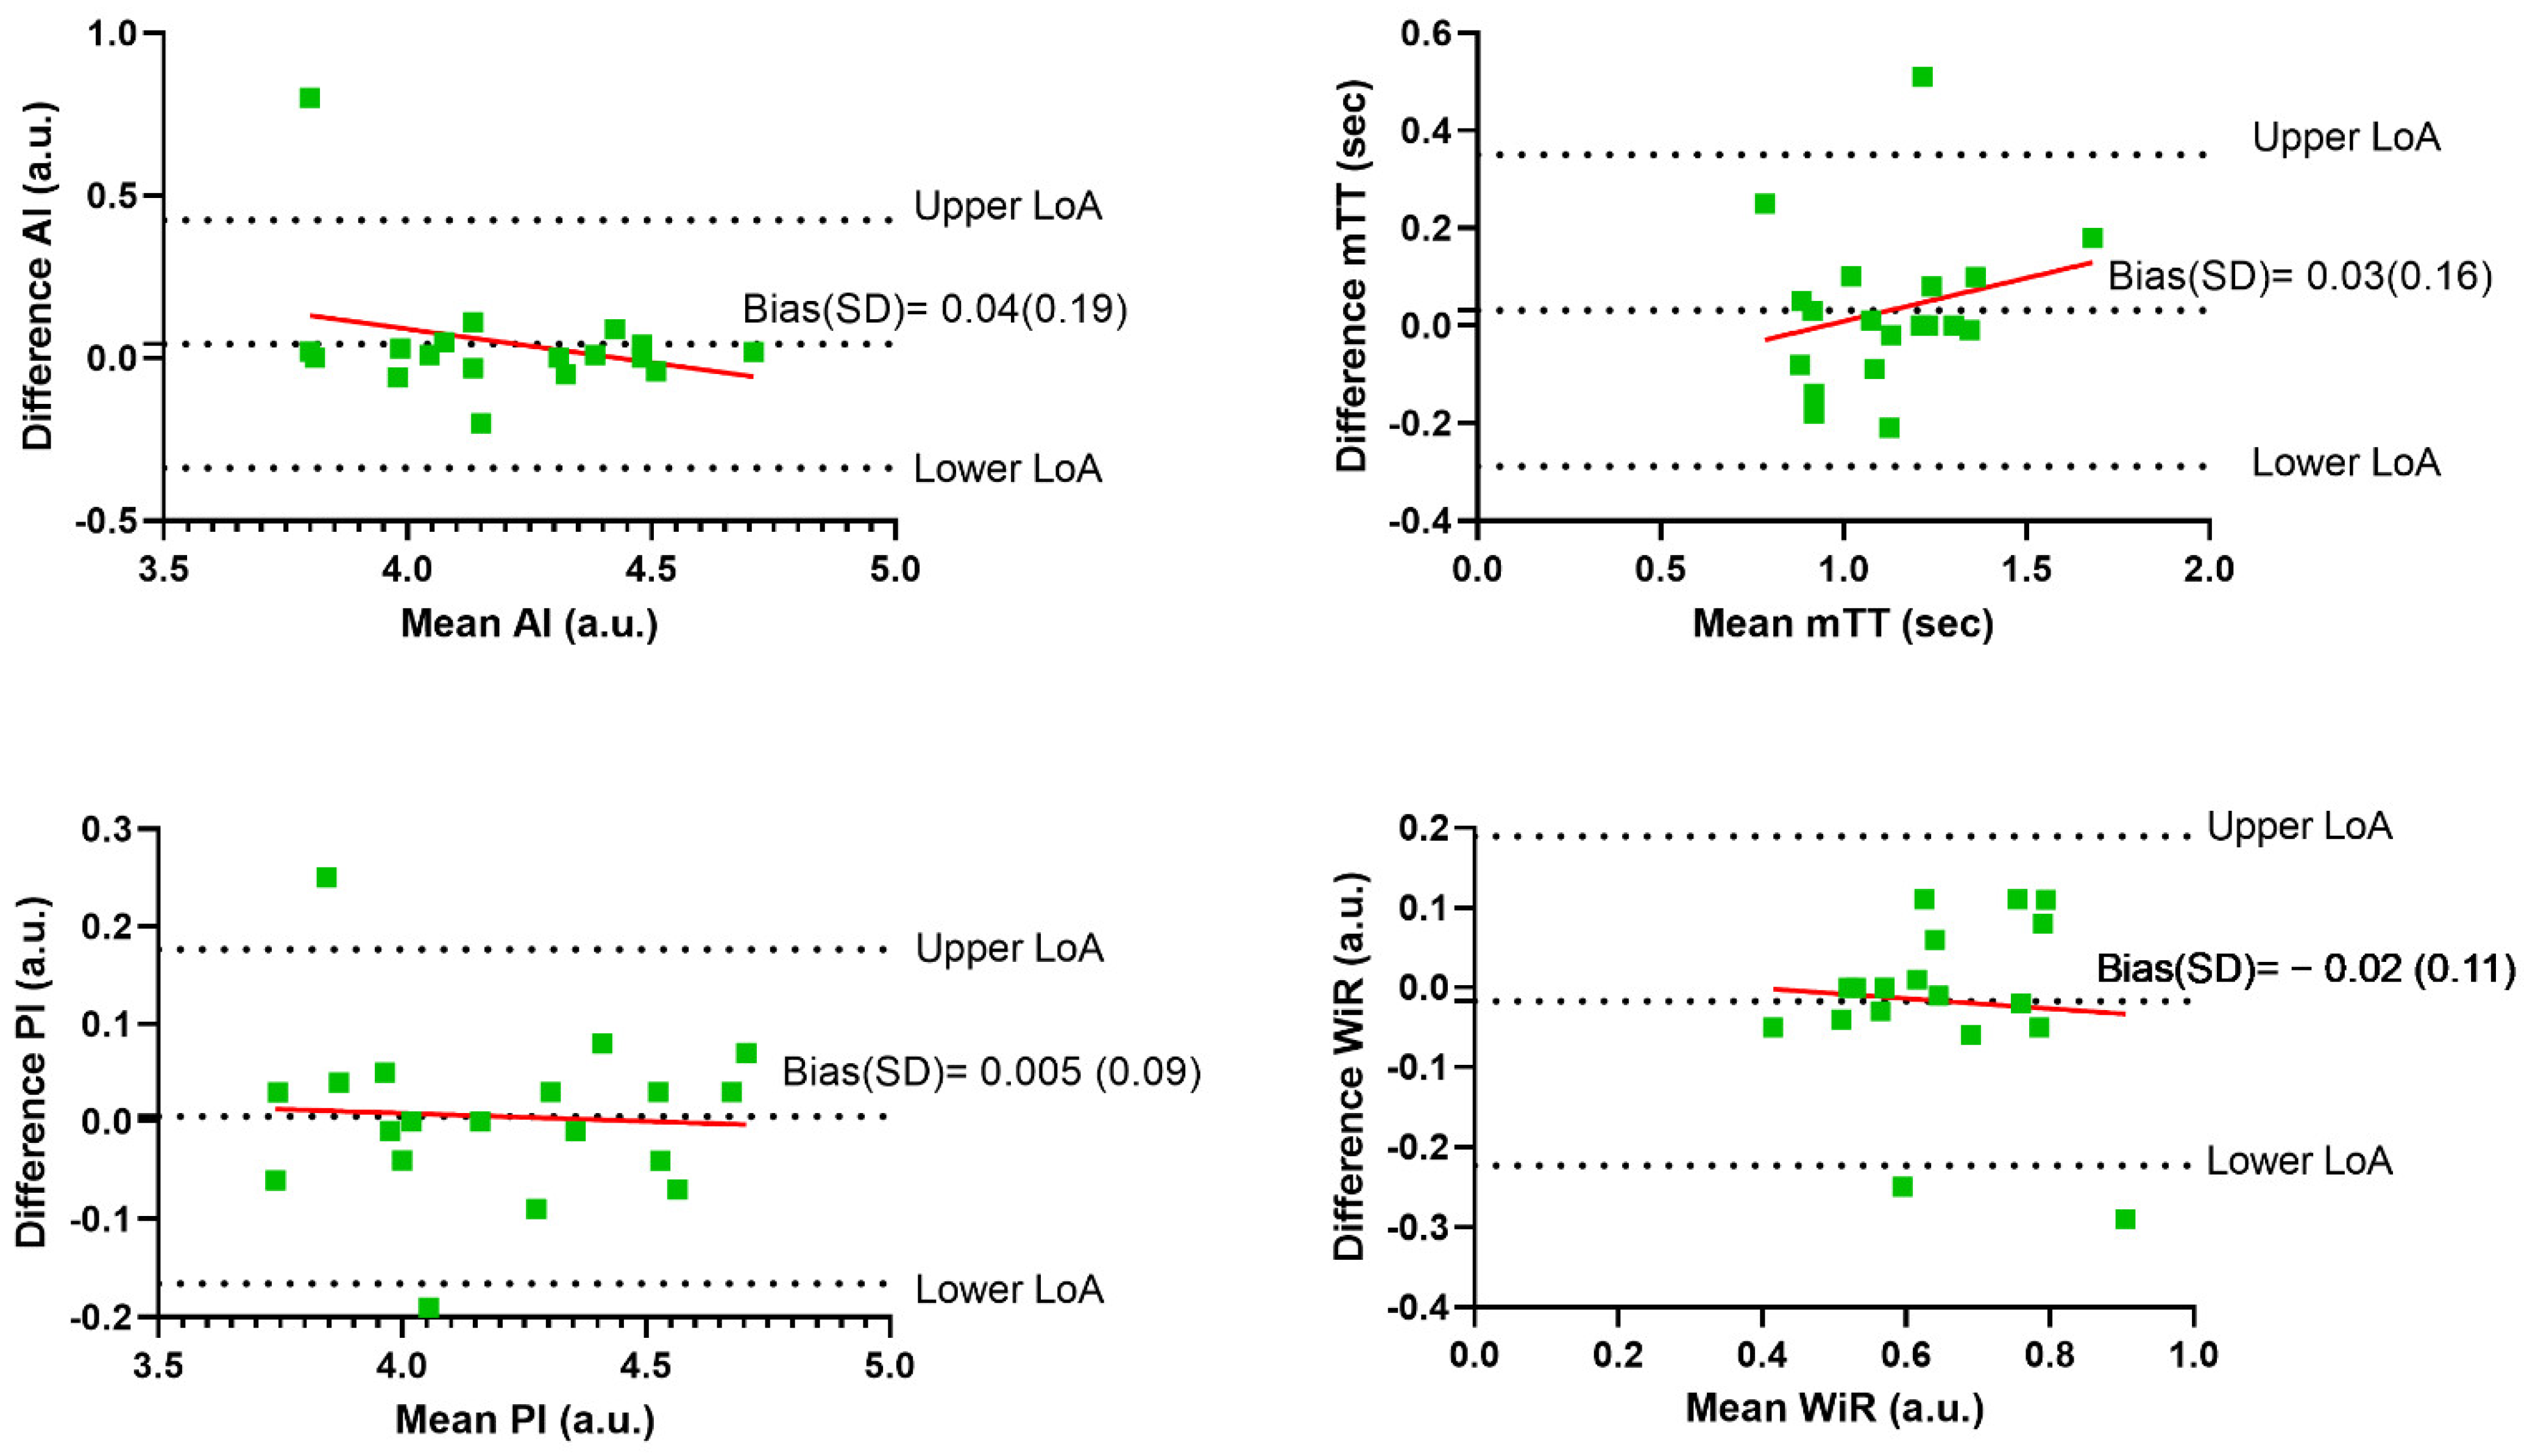
| Difference means (SD) | 0.06 (0.21) | −8993.35 (13,350.64) | −9653.75 (11,940.57) | −0.0150 (0.15) |
| CEUS1 | CEUS2 | |||||
|---|---|---|---|---|---|---|
| HR (bpm) | SBP (mmHg) | DBP (mmHg) | HR (bpm) | SBP (mmHg) | DBP (mmHg) | |
| Median (IQR) | 60 | 121 | 82 | 54 | 122 | 81 |
| Mean (SD) Female | Mean (SD) Male | p-Value | |
|---|---|---|---|
| mTT (sec) | 1.004 (0.16) | 1.232 (0.30) | 0.17 |
| AI (a.u.) | 202,796 (10,139.62) | 12,360 (4254.49) | 0.25 |
| PI (a.u.) | 20,636.48 (10,284.58) | 10,486.44 (6151.23) | 0.056 |
| WiR (a.u.) | 0.71 (0.101) | 0.59 (0.169) | 0.21 |
Publisher’s Note: MDPI stays neutral with regard to jurisdictional claims in published maps and institutional affiliations. |
© 2022 by the authors. Licensee MDPI, Basel, Switzerland. This article is an open access article distributed under the terms and conditions of the Creative Commons Attribution (CC BY) license (https://creativecommons.org/licenses/by/4.0/).
Share and Cite
Almushayt, S.J.; Pham, A.; Phillips, B.E.; Williams, J.P.; Taal, M.W.; Selby, N.M. Repeatability of Contrast-Enhanced Ultrasound to Determine Renal Cortical Perfusion. Diagnostics 2022, 12, 1293. https://doi.org/10.3390/diagnostics12051293
Almushayt SJ, Pham A, Phillips BE, Williams JP, Taal MW, Selby NM. Repeatability of Contrast-Enhanced Ultrasound to Determine Renal Cortical Perfusion. Diagnostics. 2022; 12(5):1293. https://doi.org/10.3390/diagnostics12051293
Chicago/Turabian StyleAlmushayt, Shatha J., Alisa Pham, Bethan E. Phillips, John P. Williams, Maarten W. Taal, and Nicholas M. Selby. 2022. "Repeatability of Contrast-Enhanced Ultrasound to Determine Renal Cortical Perfusion" Diagnostics 12, no. 5: 1293. https://doi.org/10.3390/diagnostics12051293
APA StyleAlmushayt, S. J., Pham, A., Phillips, B. E., Williams, J. P., Taal, M. W., & Selby, N. M. (2022). Repeatability of Contrast-Enhanced Ultrasound to Determine Renal Cortical Perfusion. Diagnostics, 12(5), 1293. https://doi.org/10.3390/diagnostics12051293