
Vitamin D Status Assessment: Lack of Correlation between Serum and Hair 25-Hydroxycholecalciferol Levels in Healthy Young Adults


Abstract
:
1. Introduction
2. Materials and Methods
2.1. Subjects and Sampling
2.2. Standards and Reagents
2.3. Calibrant and Stock Solutions
2.4. Sample Preparation
2.5. LC-MS/MS System
2.6. Method Validation
2.7. Statistical Analysis
3. Results
3.1. Method Development and Validation
3.2. Vitamin D Status of the Volunteers
3.3. The Correlation between Demographic and Lifestyle and Vitamin D3 Metabolites from Serum and Hair Samples
4. Discussion
5. Conclusions
Supplementary Materials
Author Contributions
Funding
Institutional Review Board Statement
Informed Consent Statement
Data Availability Statement
Acknowledgments
Conflicts of Interest
References
- Saponaro, F.; Saba, A.; Zucchi, R. An update on vitamin D metabolism. Int. J. Mol. Sci. 2020, 21, 6573. [Google Scholar] [CrossRef] [PubMed]
- Wang, Y.; Zhu, J.; DeLuca, H.F. Where is the vitamin D receptor? Arch. Biochem. Biophys. 2012, 523, 123–133. [Google Scholar] [CrossRef] [PubMed]
- Slominski, A.T.; Kim, T.-K.; Li, W.; Postlethwaite, A.; Tieu, E.W.; Tang, E.K.Y.; Tuckey, R.C. Detection of novel CYP11A1-derived secosteroids in the human epidermis and serum and pig adrenal gland. Sci. Rep. 2015, 5, 14875. [Google Scholar] [CrossRef] [PubMed] [Green Version]
- Slominski, A.T.; Li, W.; Kim, T.-K.; Semak, I.; Wang, J.; Zjawiony, J.K.; Tuckey, R.C. Novel activities of CYP11A1 and their potential physiological significance. J. Steroid Biochem. Mol. Biol. 2015, 151, 25–37. [Google Scholar] [CrossRef] [Green Version]
- Bivona, G.; Agnello, L.; Bellia, C.; Iacolino, G.; Scazzone, C.; Lo Sasso, B.; Ciaccio, M. Non-skeletal activities of vitamin d: From physiology to brain pathology. Medicina 2019, 55, 341. [Google Scholar] [CrossRef] [Green Version]
- Jones, G. The discovery and synthesis of the nutritional factor vitamin D. Int. J. Paleopathol. 2018, 23, 96–99. [Google Scholar] [CrossRef]
- Caccamo, D.; Ricca, S.; Currò, M.; Ientile, R. Health risks of hypovitaminosis D: A review of new molecular insights. Int. J. Mol. Sci. 2018, 19, 892. [Google Scholar] [CrossRef] [Green Version]
- Bivona, G.; Gambino, C.M.; Iacolino, G.; Ciaccio, M. Vitamin D and the nervous system. Neurol. Res. 2019, 41, 827–835. [Google Scholar] [CrossRef]
- Moretti, R.; Morelli, M.E.; Caruso, P. Vitamin D in neurological diseases: A rationale for a pathogenic impact. Int. J. Mol. Sci. 2018, 19, 2245. [Google Scholar] [CrossRef] [Green Version]
- Eyles, D.W. Vitamin D: Brain and behavior. JBMR Plus 2021, 5, e10419. [Google Scholar] [CrossRef]
- Bivona, G.; Lo Sasso, B.; Gambino, C.M.; Giglio, R.V.; Scazzone, C.; Agnello, L.; Ciaccio, M. The role of vitamin d as a biomarker in alzheimer’s disease. Brain Sci. 2021, 11, 334. [Google Scholar] [CrossRef] [PubMed]
- Gáll, Z.; Székely, O. Role of vitamin d in cognitive dysfunction: New molecular concepts and discrepancies between animal and human findings. Nutrients 2021, 13, 3672. [Google Scholar] [CrossRef] [PubMed]
- Giustina, A.; Adler, R.A.; Binkley, N.; Bollerslev, J.; Bouillon, R.; Dawson-Hughes, B.; Ebeling, P.R.; Feldman, D.; Formenti, A.M.; Lazaretti-Castro, M.; et al. Consensus statement from 2nd international conference on controversies in vitamin D. Rev. Endocr. Metab. Disord. 2020, 21, 89–116. [Google Scholar] [CrossRef] [PubMed] [Green Version]
- Marcinowska-Suchowierska, E.; Kupisz-Urbanska, M.; Lukaszkiewicz, J.; Pludowski, P.; Jones, G. Vitamin D toxicity a clinical perspective. Front. Endocrinol. 2018, 9, 550. [Google Scholar] [CrossRef] [PubMed] [Green Version]
- Sahota, O. Understanding vitamin D deficiency. Age Ageing 2014, 43, 589–591. [Google Scholar] [CrossRef] [PubMed] [Green Version]
- Smith, L.M.; Gallagher, J.C. Dietary vitamin D intake for the elderly population: Update on the recommended dietary allowance for vitamin D. Endocrinol. Metab. Clin. N. Am. 2017, 46, 871–884. [Google Scholar] [CrossRef] [PubMed]
- Holló, A.; Clemens, Z.; Kamondi, A.; Lakatos, P.; Szucs, A. Correction of vitamin D deficiency improves seizure control in epilepsy: A pilot study. Epilepsy Behav. 2012, 24, 131–133. [Google Scholar] [CrossRef]
- Kupisz-Urbańska, M.; Płudowski, P.; Marcinowska-Suchowierska, E. Vitamin d deficiency in older patients—Problems of sarcopenia, drug interactions, management in deficiency. Nutrients 2021, 13, 1247. [Google Scholar] [CrossRef]
- McKenzie, R.L.; Liley, J.B.; Björn, L.O. UV radiation: Balancing risks and benefits. Photochem. Photobiol. 2009, 85, 88–98. [Google Scholar] [CrossRef]
- Amrein, K.; Scherkl, M.; Hoffmann, M.; Neuwersch-Sommeregger, S.; Köstenberger, M.; Tmava Berisha, A.; Martucci, G.; Pilz, S.; Malle, O. Vitamin D deficiency 2.0: An update on the current status worldwide. Eur. J. Clin. Nutr. 2020, 74, 1498–1513. [Google Scholar] [CrossRef]
- Lips, P.; Cashman, K.D.; Lamberg-Allardt, C.; Bischoff-Ferrari, H.A.; Obermayer-Pietsch, B.; Bianchi, M.L.; Stepan, J.; El-Hajj Fuleihan, G.; Bouillon, R. Current vitamin D status in European and Middle East countries and strategies to prevent vitamin D deficiency: A position statement of the European Calcified Tissue Society. Eur. J. Endocrinol. 2019, 180, P23–P54. [Google Scholar] [CrossRef] [PubMed] [Green Version]
- Mousavi, S.E.; Amini, H.; Heydarpour, P.; Amini Chermahini, F.; Godderis, L. Air pollution, environmental chemicals, and smoking may trigger vitamin D deficiency: Evidence and potential mechanisms. Environ. Int. 2019, 122, 67–90. [Google Scholar] [CrossRef] [PubMed]
- Franca Gois, P.; Wolley, M.; Ranganathan, D.; Seguro, A. Vitamin D deficiency in chronic kidney disease: Recent evidence and controversies. Int. J. Environ. Res. Public Health 2018, 15, 1773. [Google Scholar] [CrossRef] [PubMed] [Green Version]
- Serra, G.; Corsello, G.; Antona, V.; D’Alessandro, M.M.; Cassata, N.; Cimador, M.; Giuffrè, M.; Schierz, I.A.M.; Piro, E. Autosomal recessive polycystic kidney disease: Case report of a newborn with rare PKHD1 mutation, rapid renal enlargement and early fatal outcome. Ital. J. Pediatr. 2020, 46, 154. [Google Scholar] [CrossRef]
- Herrmann, M.; Farrell, C.J.L.; Pusceddu, I.; Fabregat-Cabello, N.; Cavalier, E. Assessment of vitamin D status—A changing landscape. Clin. Chem. Lab. Med. 2017, 55, 3–26. [Google Scholar] [CrossRef] [Green Version]
- Shah, I.; Akhtar, M.K.; Hisaindee, S.; Rauf, M.A.; Sadig, M.; Ashraf, S.S. Clinical diagnostic tools for vitamin D assessment. J. Steroid Biochem. Mol. Biol. 2018, 180, 105–117. [Google Scholar] [CrossRef]
- Bikle, D.D.; Schwartz, J. Vitamin D binding protein, total and free Vitamin D levels in different physiological and pathophysiological conditions. Front. Endocrinol. 2019, 10, 317. [Google Scholar] [CrossRef] [Green Version]
- El-Khoury, J.M.; Reineks, E.Z.; Wang, S. Progress of liquid chromatography-mass spectrometry in measurement of vitamin D metabolites and analogues. Clin. Biochem. 2011, 44, 66–76. [Google Scholar] [CrossRef]
- Rezayi, M.; Ghayour-Mobarhan, M.; Tavakoly Sany, S.B.; Fani, M.; Avan, A.; Pasdar, Z.; Ferns, G.A.; Abouzari-Lotf, E.; Amiri, I.S. A comparison of analytical methods for measuring concentrations of 25-hydroxy vitamin D in biological samples. Anal. Methods 2018, 10, 5599–5612. [Google Scholar] [CrossRef]
- Fraser, W.D.; Tang, J.C.Y.; Dutton, J.J.; Schoenmakers, I. Vitamin D measurement, the debates continue, new analytes have emerged, developments have variable outcomes. Calcif. Tissue Int. 2020, 106, 3–13. [Google Scholar] [CrossRef] [Green Version]
- Jenkinson, C. The vitamin D metabolome: An update on analysis and function. Cell Biochem. Funct. 2019, 37, 408–423. [Google Scholar] [CrossRef] [PubMed]
- Bikle, D.D. The free hormone hypothesis: When, why, and how to measure the free hormone levels to assess vitamin D, thyroid, sex hormone, and cortisol status. JBMR Plus 2021, 5, e10418. [Google Scholar] [CrossRef] [PubMed]
- Bouillon, R.; Schuit, F.; Antonio, L.; Rastinejad, F. Vitamin D binding protein: A historic overview. Front. Endocrinol. 2020, 10, 910. [Google Scholar] [CrossRef] [PubMed]
- Shah, I.; Al-Dabbagh, B.; Gariballa, S.; Al-Menhali, A.; Muhammad, N.; Yasin, J.; Ashraf, S.S. Application of a new vitamin D blood test on the Emirati population. J. Steroid Biochem. Mol. Biol. 2018, 180, 118–128. [Google Scholar] [CrossRef] [PubMed]
- Lee, D.H.; Kang, H.; Kim, J.H.; Jung, M.H.; Cho, M.C. Cerebrospinal fluid vitamin D-binding protein as a new biomarker for the diagnosis of meningitis. Neurol. Sci. 2019, 40, 1597–1605. [Google Scholar] [CrossRef]
- Zgaga, L.; Laird, E.; Healy, M. 25-Hydroxyvitamin D measurement in human hair: Results from a proof-of-concept study. Nutrients 2019, 11, 423. [Google Scholar] [CrossRef] [Green Version]
- Shah, I.; Mansour, M.; Jobe, S.; Salih, E.; Naughton, D.; Salman Ashraf, S. A non-invasive hair test to determine vitamin D3 levels. Molecules 2021, 26, 3269. [Google Scholar] [CrossRef]
- Kohn, M.; Senyak, J. Sample Size Calculators. Available online: https://sample-size.net/correlation-sample-size/ (accessed on 25 January 2021).
- Aloia, J.F.; Patel, M.; Dimaano, R.; Li-Ng, M.; Talwar, S.A.; Mikhail, M.; Pollack, S.; Yeh, J.K. Vitamin D intake to attain a desired serum 25-hydroxyvitamin D concentration. Am. J. Clin. Nutr. 2008, 87, 1952–1958. [Google Scholar] [CrossRef] [Green Version]
- Barnes, M.S.; Robson, P.J.; Bonham, M.P.; Strain, J.J.; Wallace, J.M.W. Effect of vitamin D supplementation on vitamin D status and bone turnover markers in young adults. Eur. J. Clin. Nutr. 2006, 60, 727–733. [Google Scholar] [CrossRef]
- Ala-Houhala, M.J.; Vähävihu, K.; Hasan, T.; Kautiainen, H.; Ylianttila, L.; Viljakainen, H.T.; Snellman, E.; Reunala, T. Comparison of narrowband ultraviolet B exposure and oral vitamin D substitution on serum 25-hydroxyvitamin D concentration. Br. J. Dermatol. 2012, 167, 160–164. [Google Scholar] [CrossRef]
- Lagunova, Z.; Porojnicu, A.C.; Aksnes, L.; Holick, M.F.; Iani, V.; Bruland, Ø.S.; Moan, J. Effect of vitamin D supplementation and ultraviolet B exposure on serum 25-hydroxyvitamin D concentrations in healthy volunteers: A randomized, crossover clinical trial. Br. J. Dermatol. 2013, 169, 434–440. [Google Scholar] [CrossRef] [PubMed]
- Bogh, M.K.B.; Gullstrand, J.; Svensson, A.; Ljunggren, B.; Dorkhan, M. Narrowband ultraviolet B three times per week is more effective in treating vitamin D deficiency than 1600 IU oral vitamin D3 per day: A randomized clinical trial. Br. J. Dermatol. 2012, 167, 625–630. [Google Scholar] [CrossRef] [PubMed]
- Sauvé, B.; Koren, G.; Walsh, G.; Tokmakejian, S.; Van Uum, S.H.M. Measurement of cortisol in human hair as a biomarker of systemic exposure. Clin. Investig. Med. 2007, 30, 183–192. [Google Scholar] [CrossRef] [PubMed] [Green Version]
- Sharpley, C.F.; McFarlane, J.R.; Slominski, A. Stress-linked cortisol concentrations in hair: What we know and what we need to know. Rev. Neurosci. 2011, 23, 111–121. [Google Scholar] [CrossRef] [PubMed] [Green Version]
- Staufenbiel, S.M.; Penninx, B.W.J.H.; Spijker, A.T.; Elzinga, B.M.; van Rossum, E.F.C. Hair cortisol, stress exposure, and mental health in humans: A systematic review. Psychoneuroendocrinology 2013, 38, 1220–1235. [Google Scholar] [CrossRef] [PubMed]
- Slominski, R.M.; Raman, C.; Elmets, C.; Jetten, A.M.; Slominski, A.T.; Tuckey, R.C. The significance of CYP11A1 expression in skin physiology and pathology. Mol. Cell. Endocrinol. 2021, 530, 111238. [Google Scholar] [CrossRef] [PubMed]
- Cashman, K.D.; van den Heuvel, E.G.; Schoemaker, R.J.; Prévéraud, D.P.; Macdonald, H.M.; Arcot, J. 25-Hydroxyvitamin D as a biomarker of vitamin D status and its modeling to inform strategies for prevention of vitamin D deficiency within the population. Adv. Nutr. An. Int. Rev. J. 2017, 8, 947–957. [Google Scholar] [CrossRef] [Green Version]
- Grant, W.B.; Al Anouti, F.; Boucher, B.J.; Dursun, E.; Gezen-Ak, D.; Jude, E.B.; Karonova, T.; Pludowski, P. A narrative review of the evidence for variations in serum 25-hydroxyvitamin D concentration thresholds for optimal health. Nutrients 2022, 14, 639. [Google Scholar] [CrossRef]
- Bivona, G.; Gambino, C.M.; Lo Sasso, B.; Scazzone, C.; Giglio, R.V.; Agnello, L.; Ciaccio, M. Serum vitamin D as a biomarker in autoimmune, psychiatric and neurodegenerative diseases. Diagnostics 2022, 12, 130. [Google Scholar] [CrossRef]
- Bikle, D.; Christakos, S. New aspects of vitamin D metabolism and action—Addressing the skin as source and target. Nat. Rev. Endocrinol. 2020, 16, 234–252. [Google Scholar] [CrossRef]
- Bikle, D.D. Extraskeletal actions of vitamin D. Ann. N. Y. Acad. Sci. 2016, 1376, 29–52. [Google Scholar] [CrossRef] [PubMed] [Green Version]
- Slominski, A.T.; Kim, T.-K.; Shehabi, H.Z.; Semak, I.; Tang, E.K.Y.; Nguyen, M.N.; Benson, H.A.E.; Korik, E.; Janjetovic, Z.; Chen, J.; et al. In vivo evidence for a novel pathway of vitamin D 3 metabolism initiated by P450scc and modified by CYP27B1. FASEB J. 2012, 26, 3901–3915. [Google Scholar] [CrossRef] [PubMed] [Green Version]
- Slominski, A.T.; Kim, T.-K.; Shehabi, H.Z.; Tang, E.K.Y.; Benson, H.A.E.; Semak, I.; Lin, Z.; Yates, C.R.; Wang, J.; Li, W.; et al. In vivo production of novel vitamin D2 hydroxy-derivatives by human placentas, epidermal keratinocytes, Caco-2 colon cells and the adrenal gland. Mol. Cell. Endocrinol. 2014, 383, 181–192. [Google Scholar] [CrossRef] [PubMed] [Green Version]


| Analytes | Concentration Level | Intraday (n = 5) | Interday (n = 4) | ||
|---|---|---|---|---|---|
| Precision, % CV | Accuracy, % | Precision, % CV | Accuracy, % | ||
| 25(OH)D3 | LLOQ 2 ng/mL | 16.98% | 96.9% | 11.52% | 100.5% |
| QCA 8 ng/mL | 10.84% | 114.2% | 10.72% | 104.1% | |
| QCB 17.5 ng/mL | 3.38% | 110.1% | 9.87% | 100.2% | |
| QCC 30 ng/mL | 3.72% | 108.7% | 7.49% | 108.7% | |
| vitamin D3 | LLOQ 2 ng/mL | 4.14% | 113.2% | 4.16% | 111.4% |
| QCA 8 ng/mL | 6.59% | 104.4% | 4.00% | 103.4% | |
| QCB 17.5 ng/mL | 14.49% | 100.3% | 13.79% | 99.9% | |
| QCC 30 ng/mL | 10.74% | 107.7% | 10.75% | 107.2% | |
| Parameters | Mean ± SEM/Median (Range) | p Value | |
|---|---|---|---|
| t1 | t2 | ||
| Serum 25(OH)D3 (ng/mL) | 14.11 ± 1.26 | 17.67 ± 1.34 | 0.001 ** |
| Serum vitamin D3 (ng/mL) | 0.175 (0–16.64) | 0.9 (0–12.85) | 0.212 |
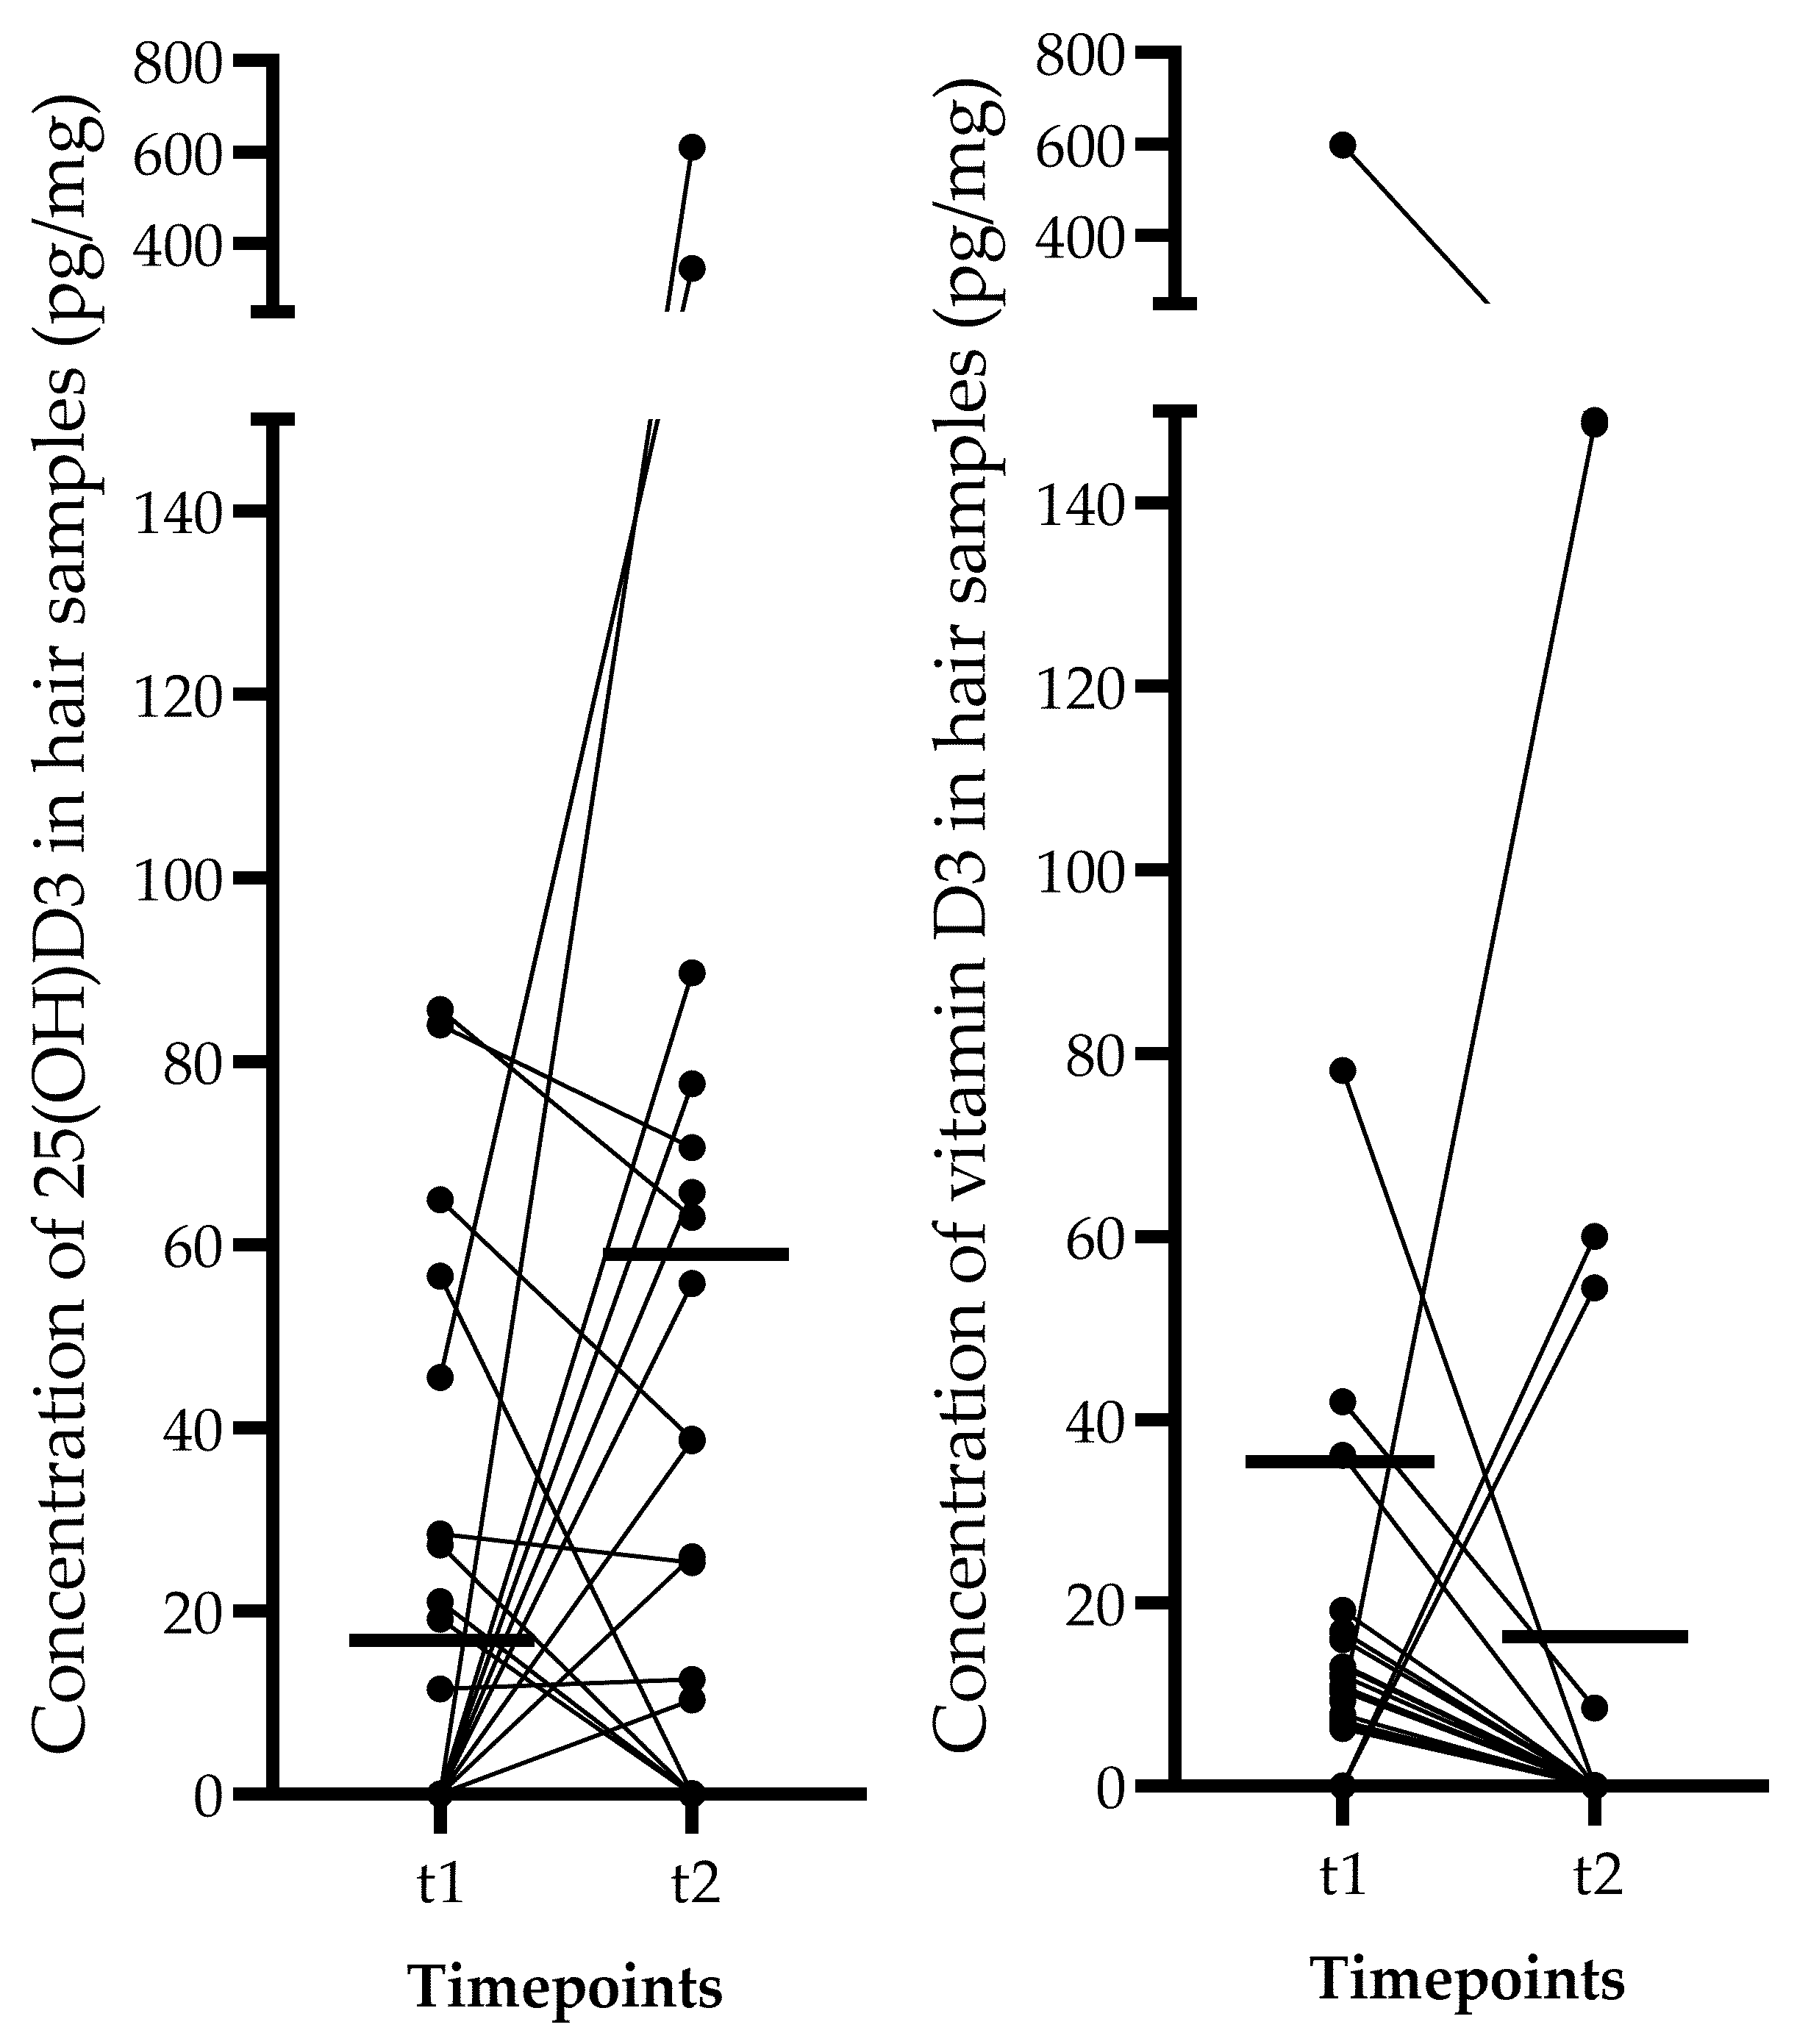
| Hair 25(OH)D3 (pg/mg) | 0.0 (0–85.63) | 11.44 (0–611.2) | 0.211 |
| Hair vitamin D3 (pg/mg) | 9.86 (0–598.3) | 0.0 (0–149) | 0.321 |
| Dependent Variable | Timepoint (t) | Independent Variable | Correlation (Spearman r) | p Value |
|---|---|---|---|---|
| Serum 25(OH)D3 | 1 | Gender | −0.012 | 0.953 |
| BMI | −0.197 | 0.335 | ||
| Supplementation | 0.206 | 0.313 | ||
| Sun exposure | 0.158 | 0.440 | ||
| Physical activity | 0.083 | 0.686 | ||
| 2 | Gender | −0.049 | 0.813 | |
| BMI | −0.291 | 0.149 | ||
| Supplementation | 0.082 | 0.689 | ||
| Sun exposure | 0.390 | 0.049 | ||
| Physical activity | 0.189 | 0.355 | ||
| Serum 25(OH)D3 at t1 | 0.717 | <0.001 | ||
| Serum vitamin D3 | 1 | Gender | −0.039 | 0.850 |
| BMI | −0.083 | 0.687 | ||
| Supplementation | 0.418 | 0.034 | ||
| Sun exposure | −0.248 | 0.222 | ||
| Physical activity | 0.024 | 0.908 | ||
| 2 | Gender | −0.224 | 0.272 | |
| BMI | 0.133 | 0.516 | ||
| Supplementation | 0.273 | 0.177 | ||
| Sun exposure | −0.199 | 0.329 | ||
| Physical activity | 0.363 | 0.068 | ||
| Serum vitamin D3 at t1 | 0.467 | 0.016 | ||
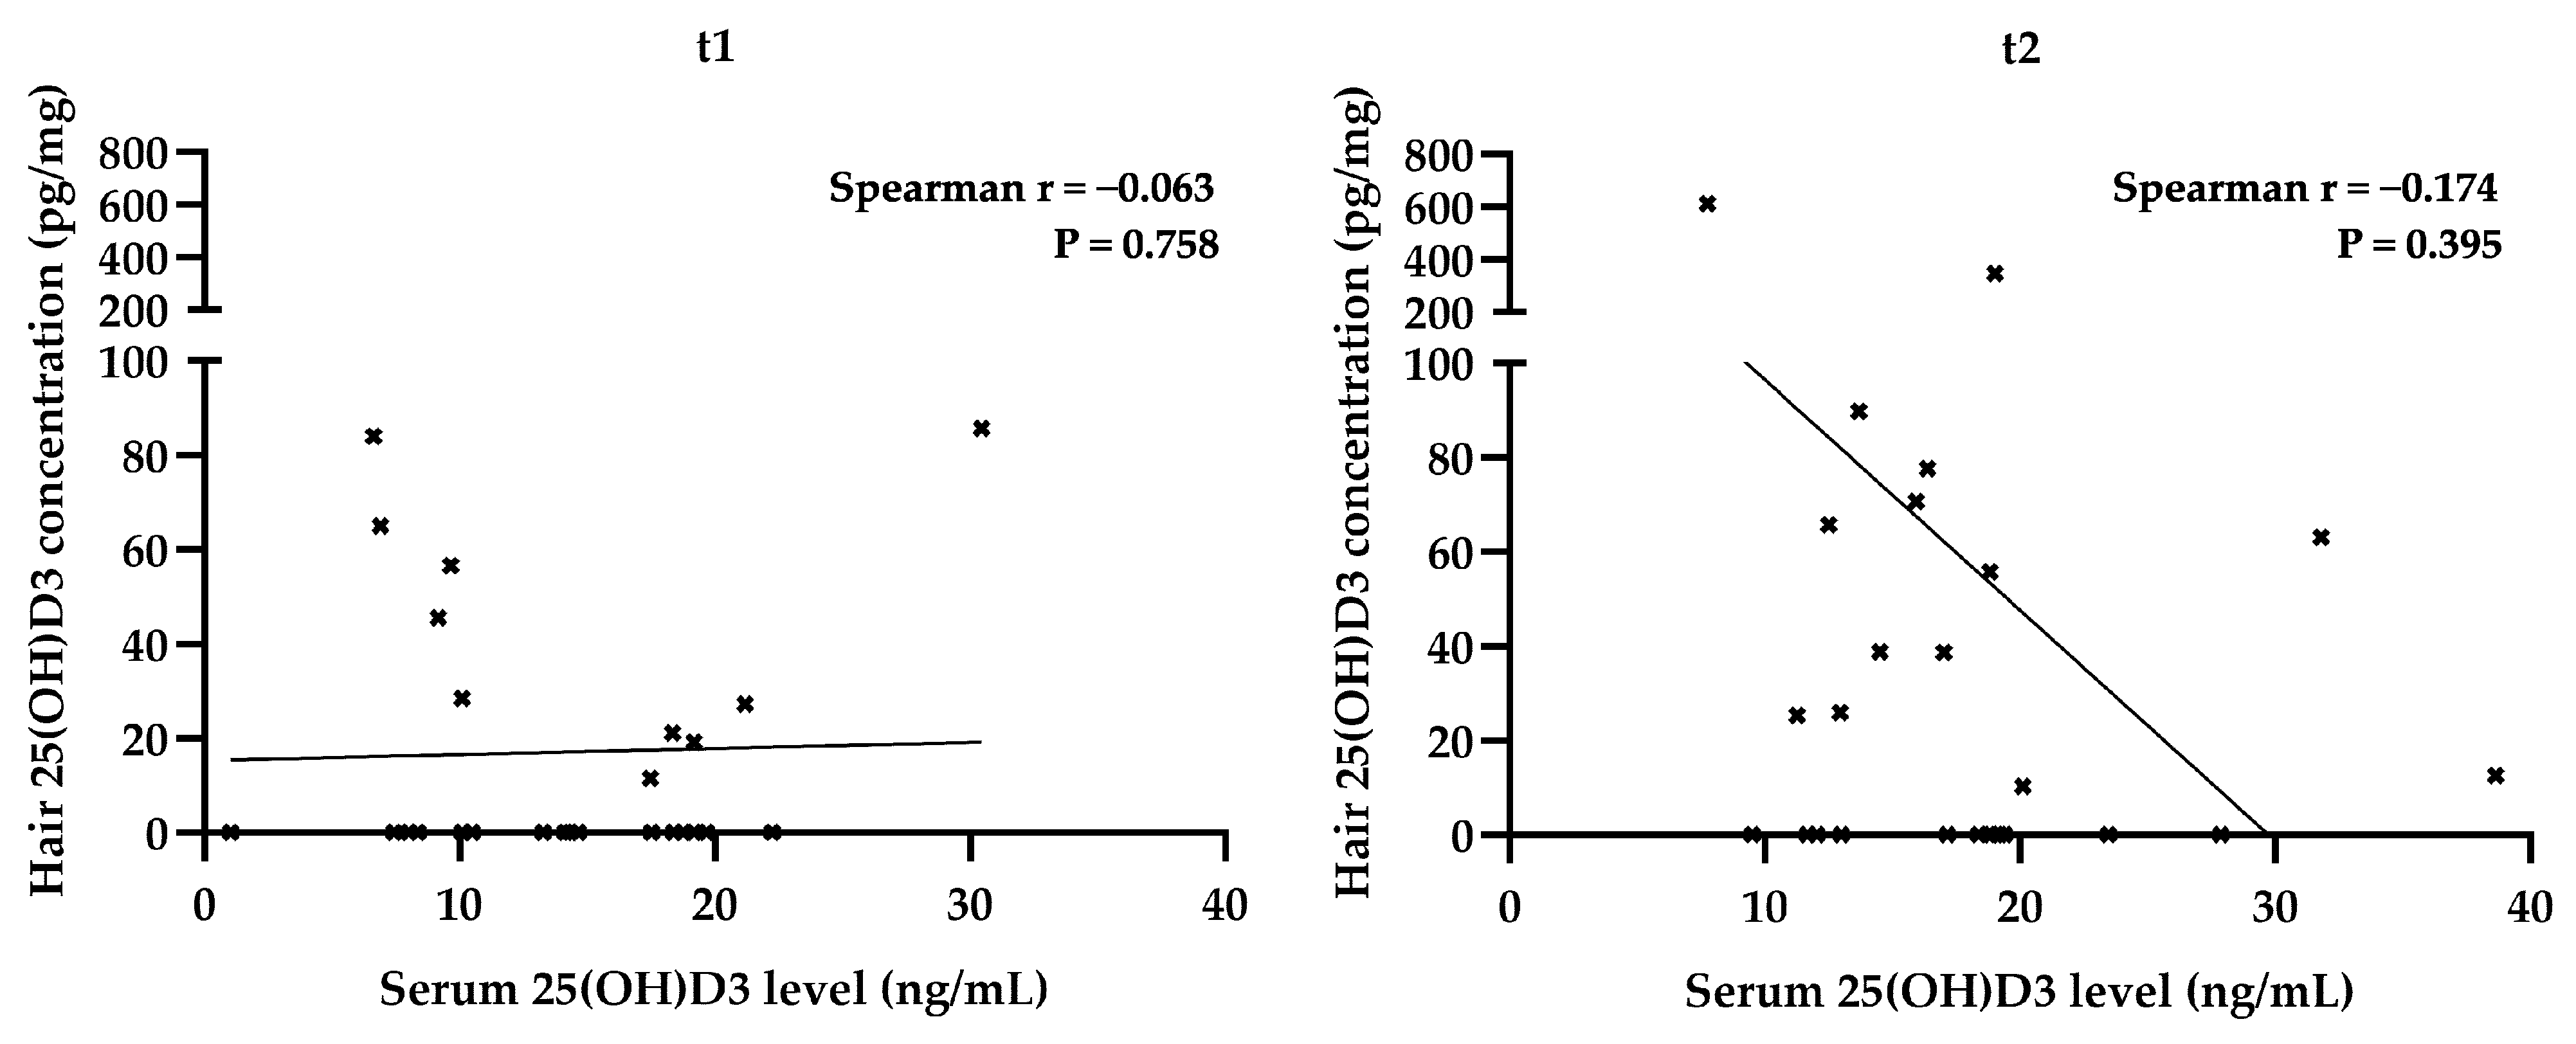
| Hair 25(OH)D3 | 1 | Gender | 0.056 | 0.787 |
| BMI | −0.041 | 0.844 | ||
| Supplementation | 0.106 | 0.607 | ||
| Sun exposure | 0.253 | 0.213 | ||
| Physical activity | −0.203 | 0.320 | ||
| Serum 25(OH)D3 at t1 | −0.063 | 0.758 | ||
| 2 | Gender | −0.090 | 0.663 | |
| BMI | −0.058 | 0.777 | ||
| Supplementation | −0.135 | 0.510 | ||
| Sun exposure | −0.272 | 0.179 | ||
| Physical activity | −0.135 | 0.512 | ||
| Serum 25(OH)D3 at t2 | −0.174 | 0.396 | ||
| Hair 25(OH)D3 at t1 | 0.148 | 0.471 |
Publisher’s Note: MDPI stays neutral with regard to jurisdictional claims in published maps and institutional affiliations. |
© 2022 by the authors. Licensee MDPI, Basel, Switzerland. This article is an open access article distributed under the terms and conditions of the Creative Commons Attribution (CC BY) license (https://creativecommons.org/licenses/by/4.0/).
Share and Cite
Gáll, Z.; Csukor, B.; Urkon, M.; Farczádi, L.; Kolcsár, M. Vitamin D Status Assessment: Lack of Correlation between Serum and Hair 25-Hydroxycholecalciferol Levels in Healthy Young Adults. Diagnostics 2022, 12, 1229. https://doi.org/10.3390/diagnostics12051229
Gáll Z, Csukor B, Urkon M, Farczádi L, Kolcsár M. Vitamin D Status Assessment: Lack of Correlation between Serum and Hair 25-Hydroxycholecalciferol Levels in Healthy Young Adults. Diagnostics. 2022; 12(5):1229. https://doi.org/10.3390/diagnostics12051229
Chicago/Turabian StyleGáll, Zsolt, Brigitta Csukor, Melinda Urkon, Lénárd Farczádi, and Melinda Kolcsár. 2022. "Vitamin D Status Assessment: Lack of Correlation between Serum and Hair 25-Hydroxycholecalciferol Levels in Healthy Young Adults" Diagnostics 12, no. 5: 1229. https://doi.org/10.3390/diagnostics12051229
APA StyleGáll, Z., Csukor, B., Urkon, M., Farczádi, L., & Kolcsár, M. (2022). Vitamin D Status Assessment: Lack of Correlation between Serum and Hair 25-Hydroxycholecalciferol Levels in Healthy Young Adults. Diagnostics, 12(5), 1229. https://doi.org/10.3390/diagnostics12051229