
The Comparison of Three Predictive Indexes to Discriminate Malignant Ovarian Tumors from Benign Ovarian Endometrioma: The Characteristics and Efficacy

 , , ,
, , ,
Abstract
:1. Introduction
2. Materials and Methods
2.1. Patients
2.2. Tumor Imaging and Diagnoses
2.3. Detection of CA125, CA19-9, CEA, and HE4 Concentrations
2.4. Calculation of the ROMA, the CPH, and the R2 Predictive Value
Post-menopausal PI = −8.09 + 1.04 × LN(HE4) + 0.732 × LN(CA125)
ROMA(%) = exp(PI)/[1 + exp(PI)] × 100
CPH-I = exp(PI)/[1 + exp(PI)] × 100
2.5. Statistical Analysis
3. Results
3.1. Patients
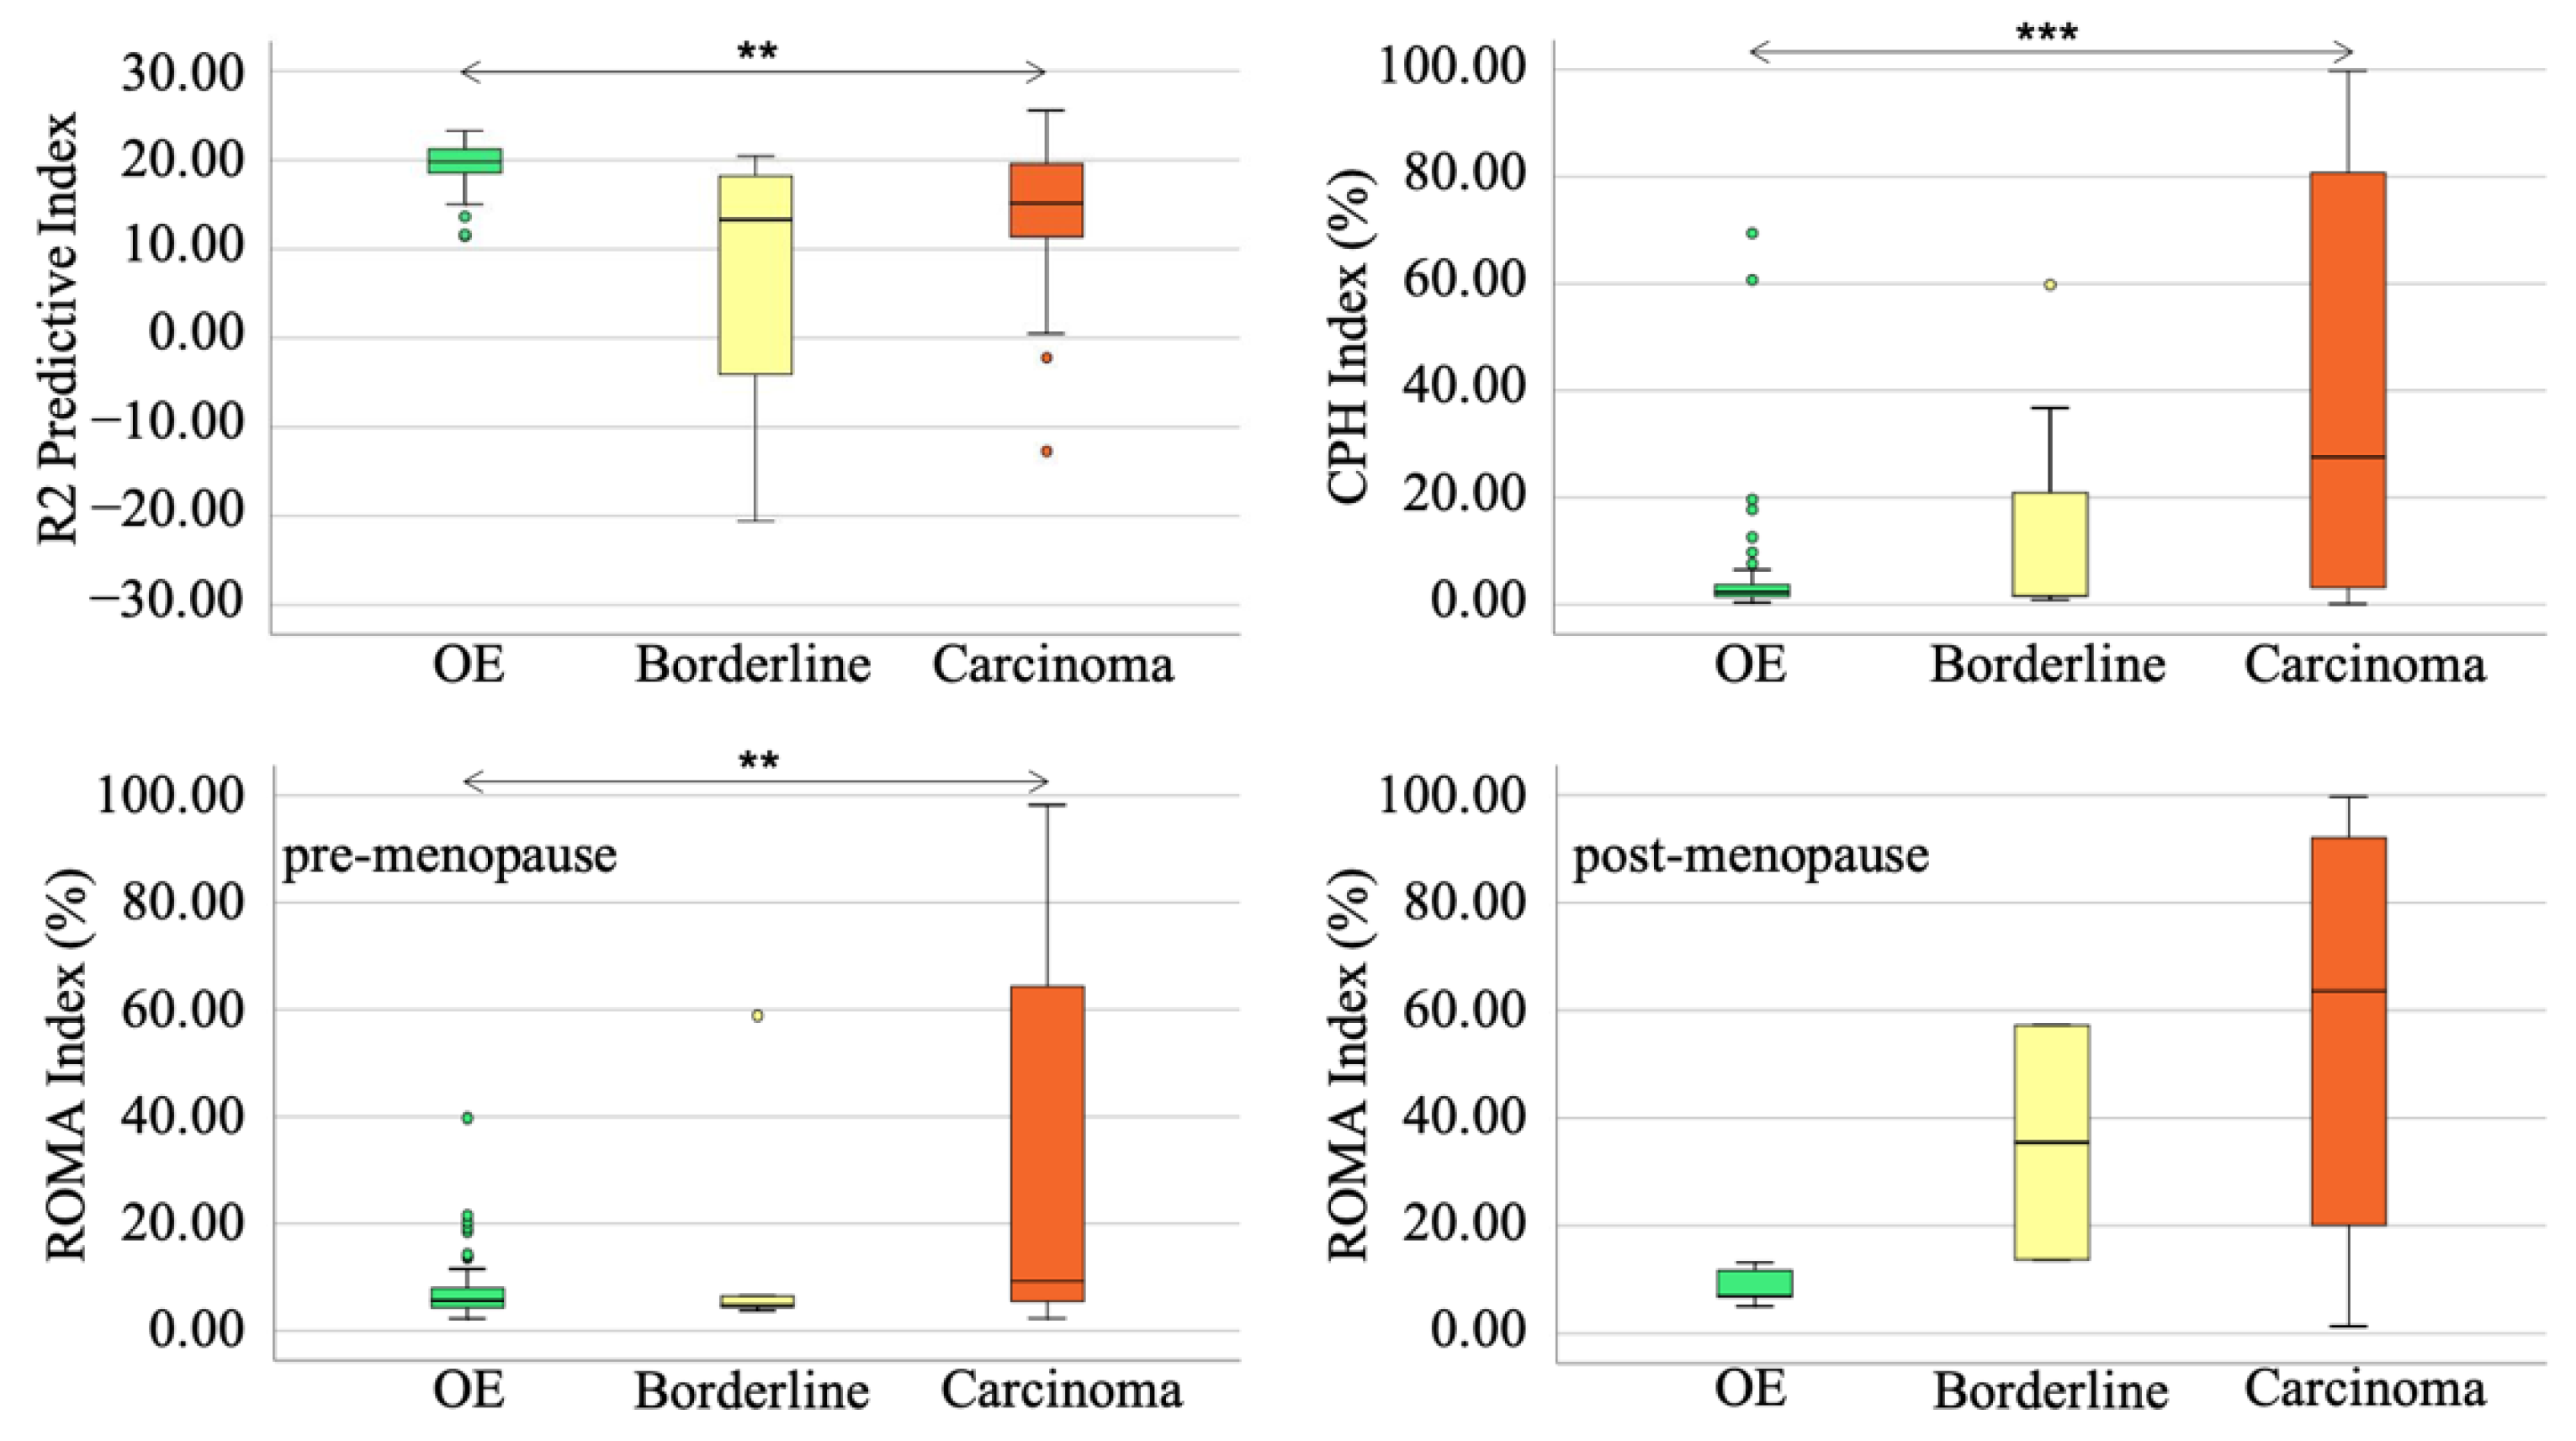
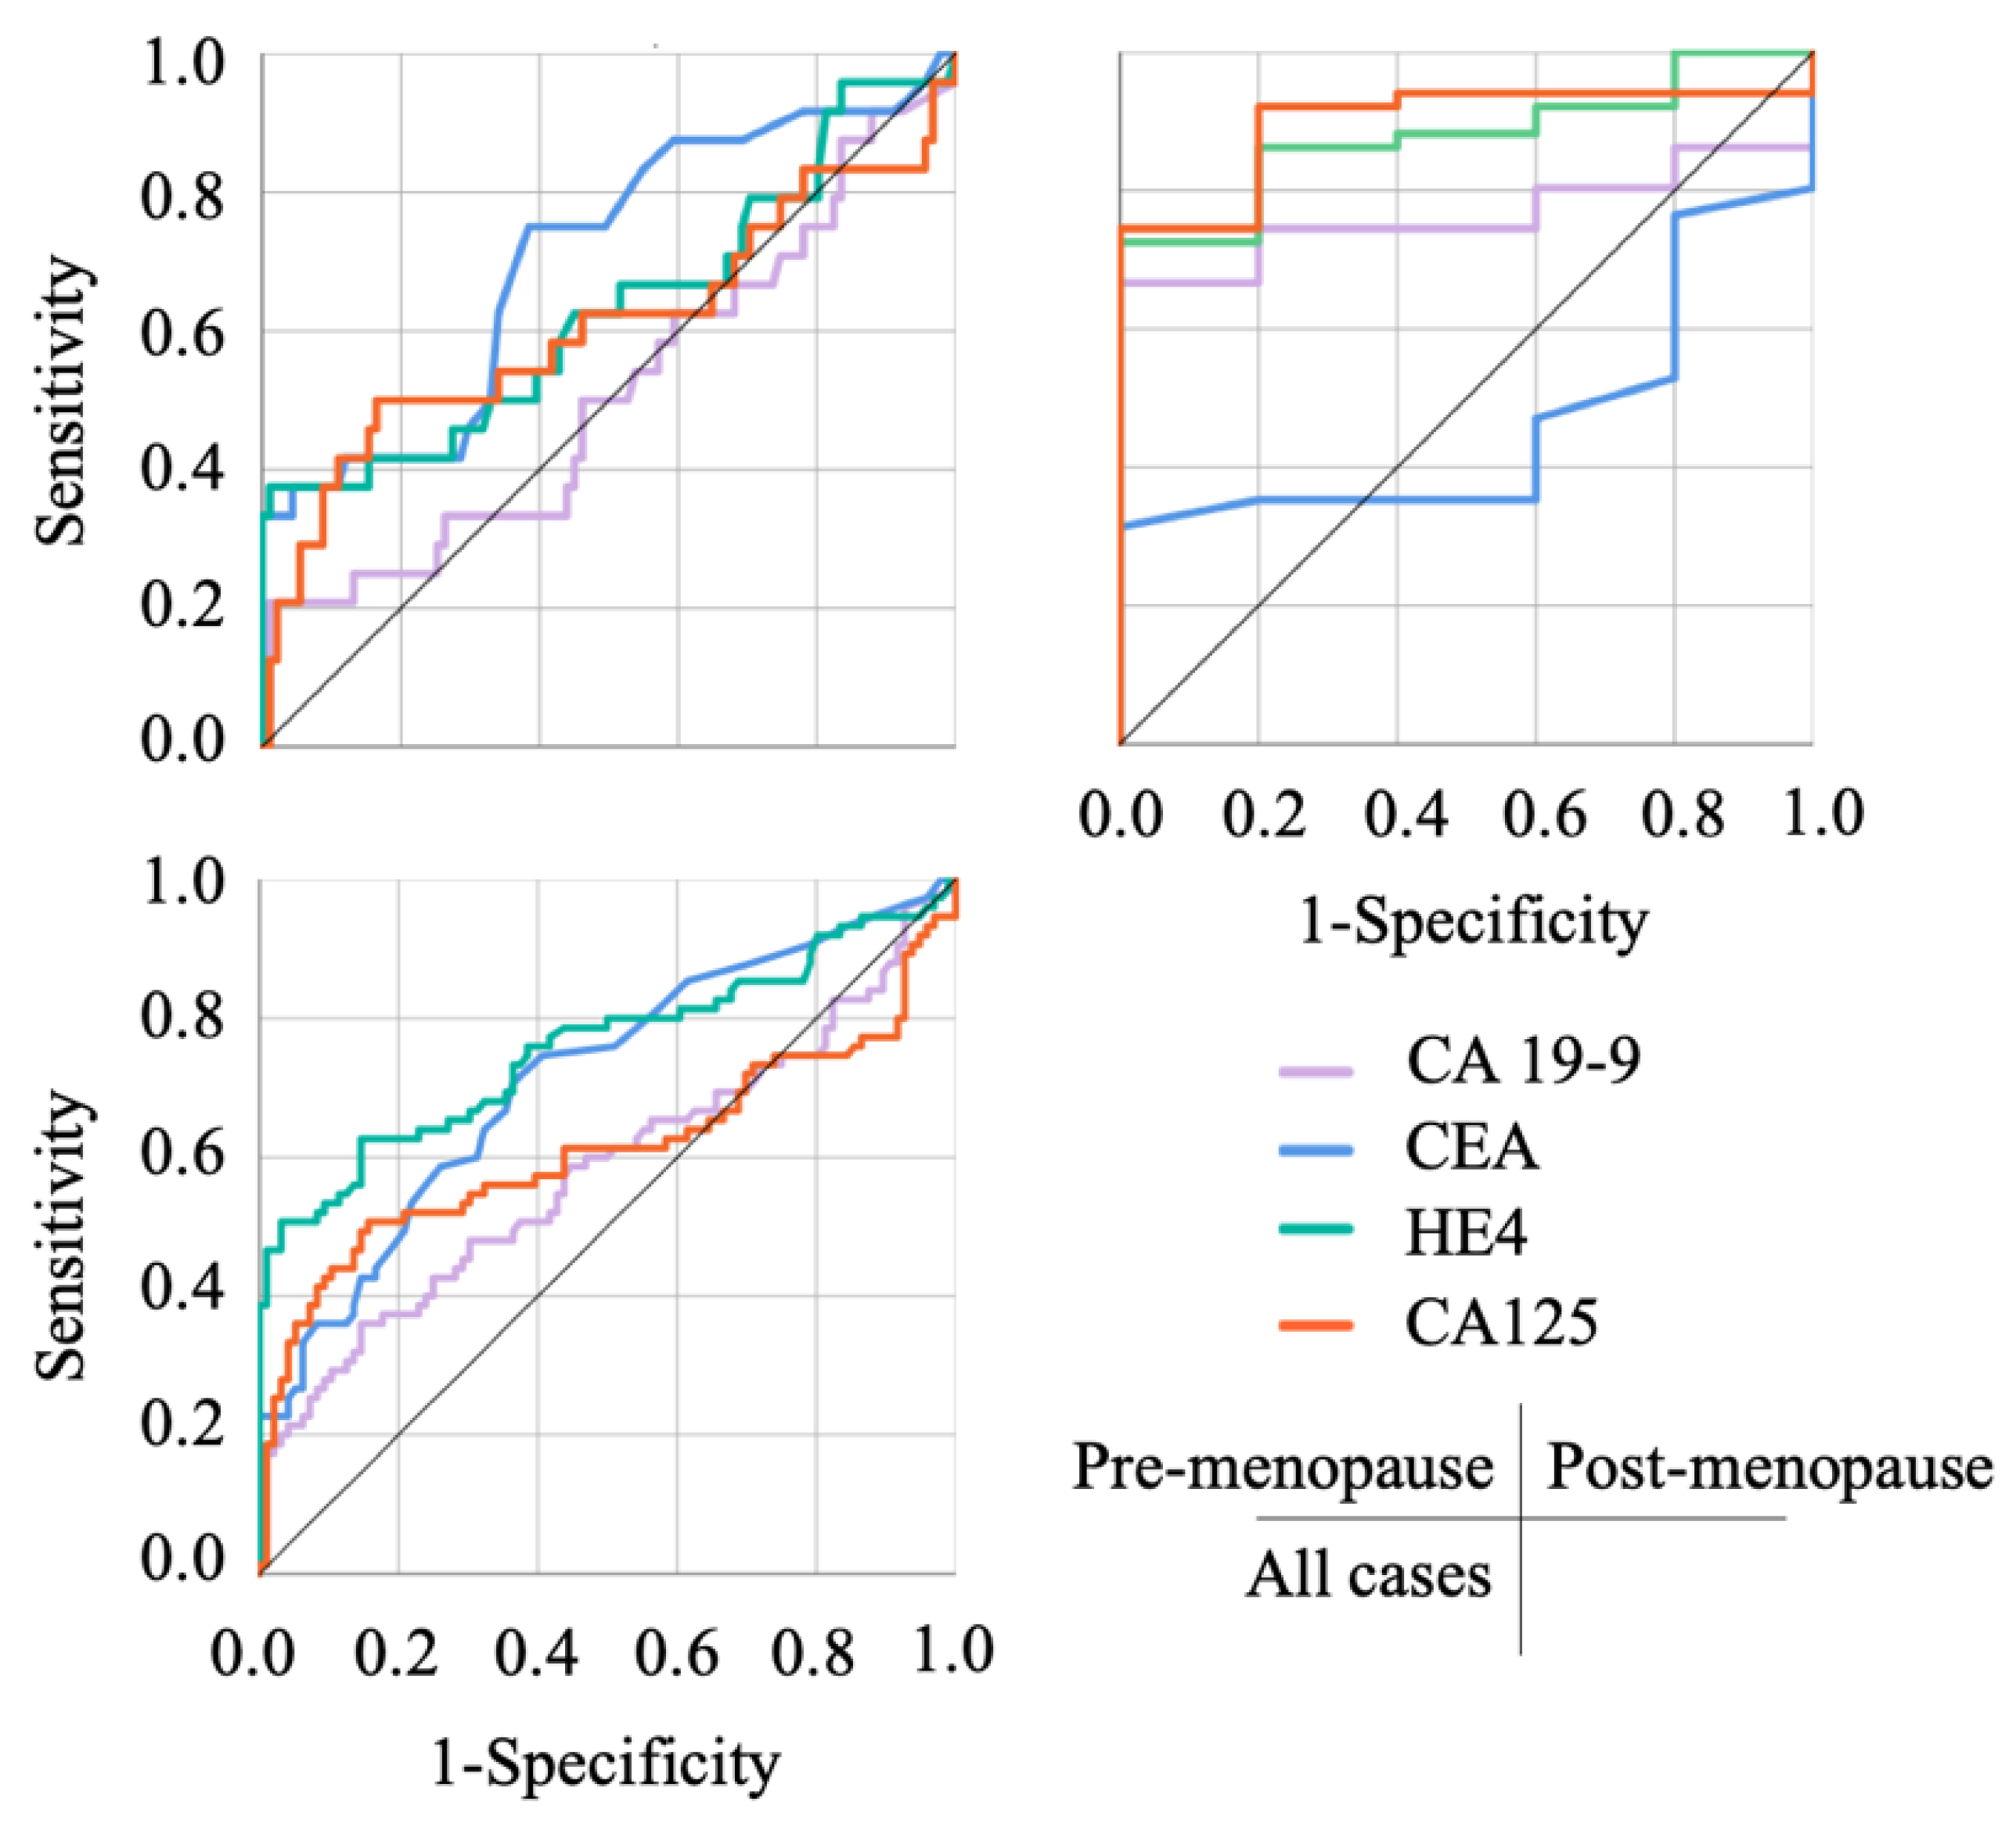
3.2. The Characteristics of Each Biological Marker in Each Cohort
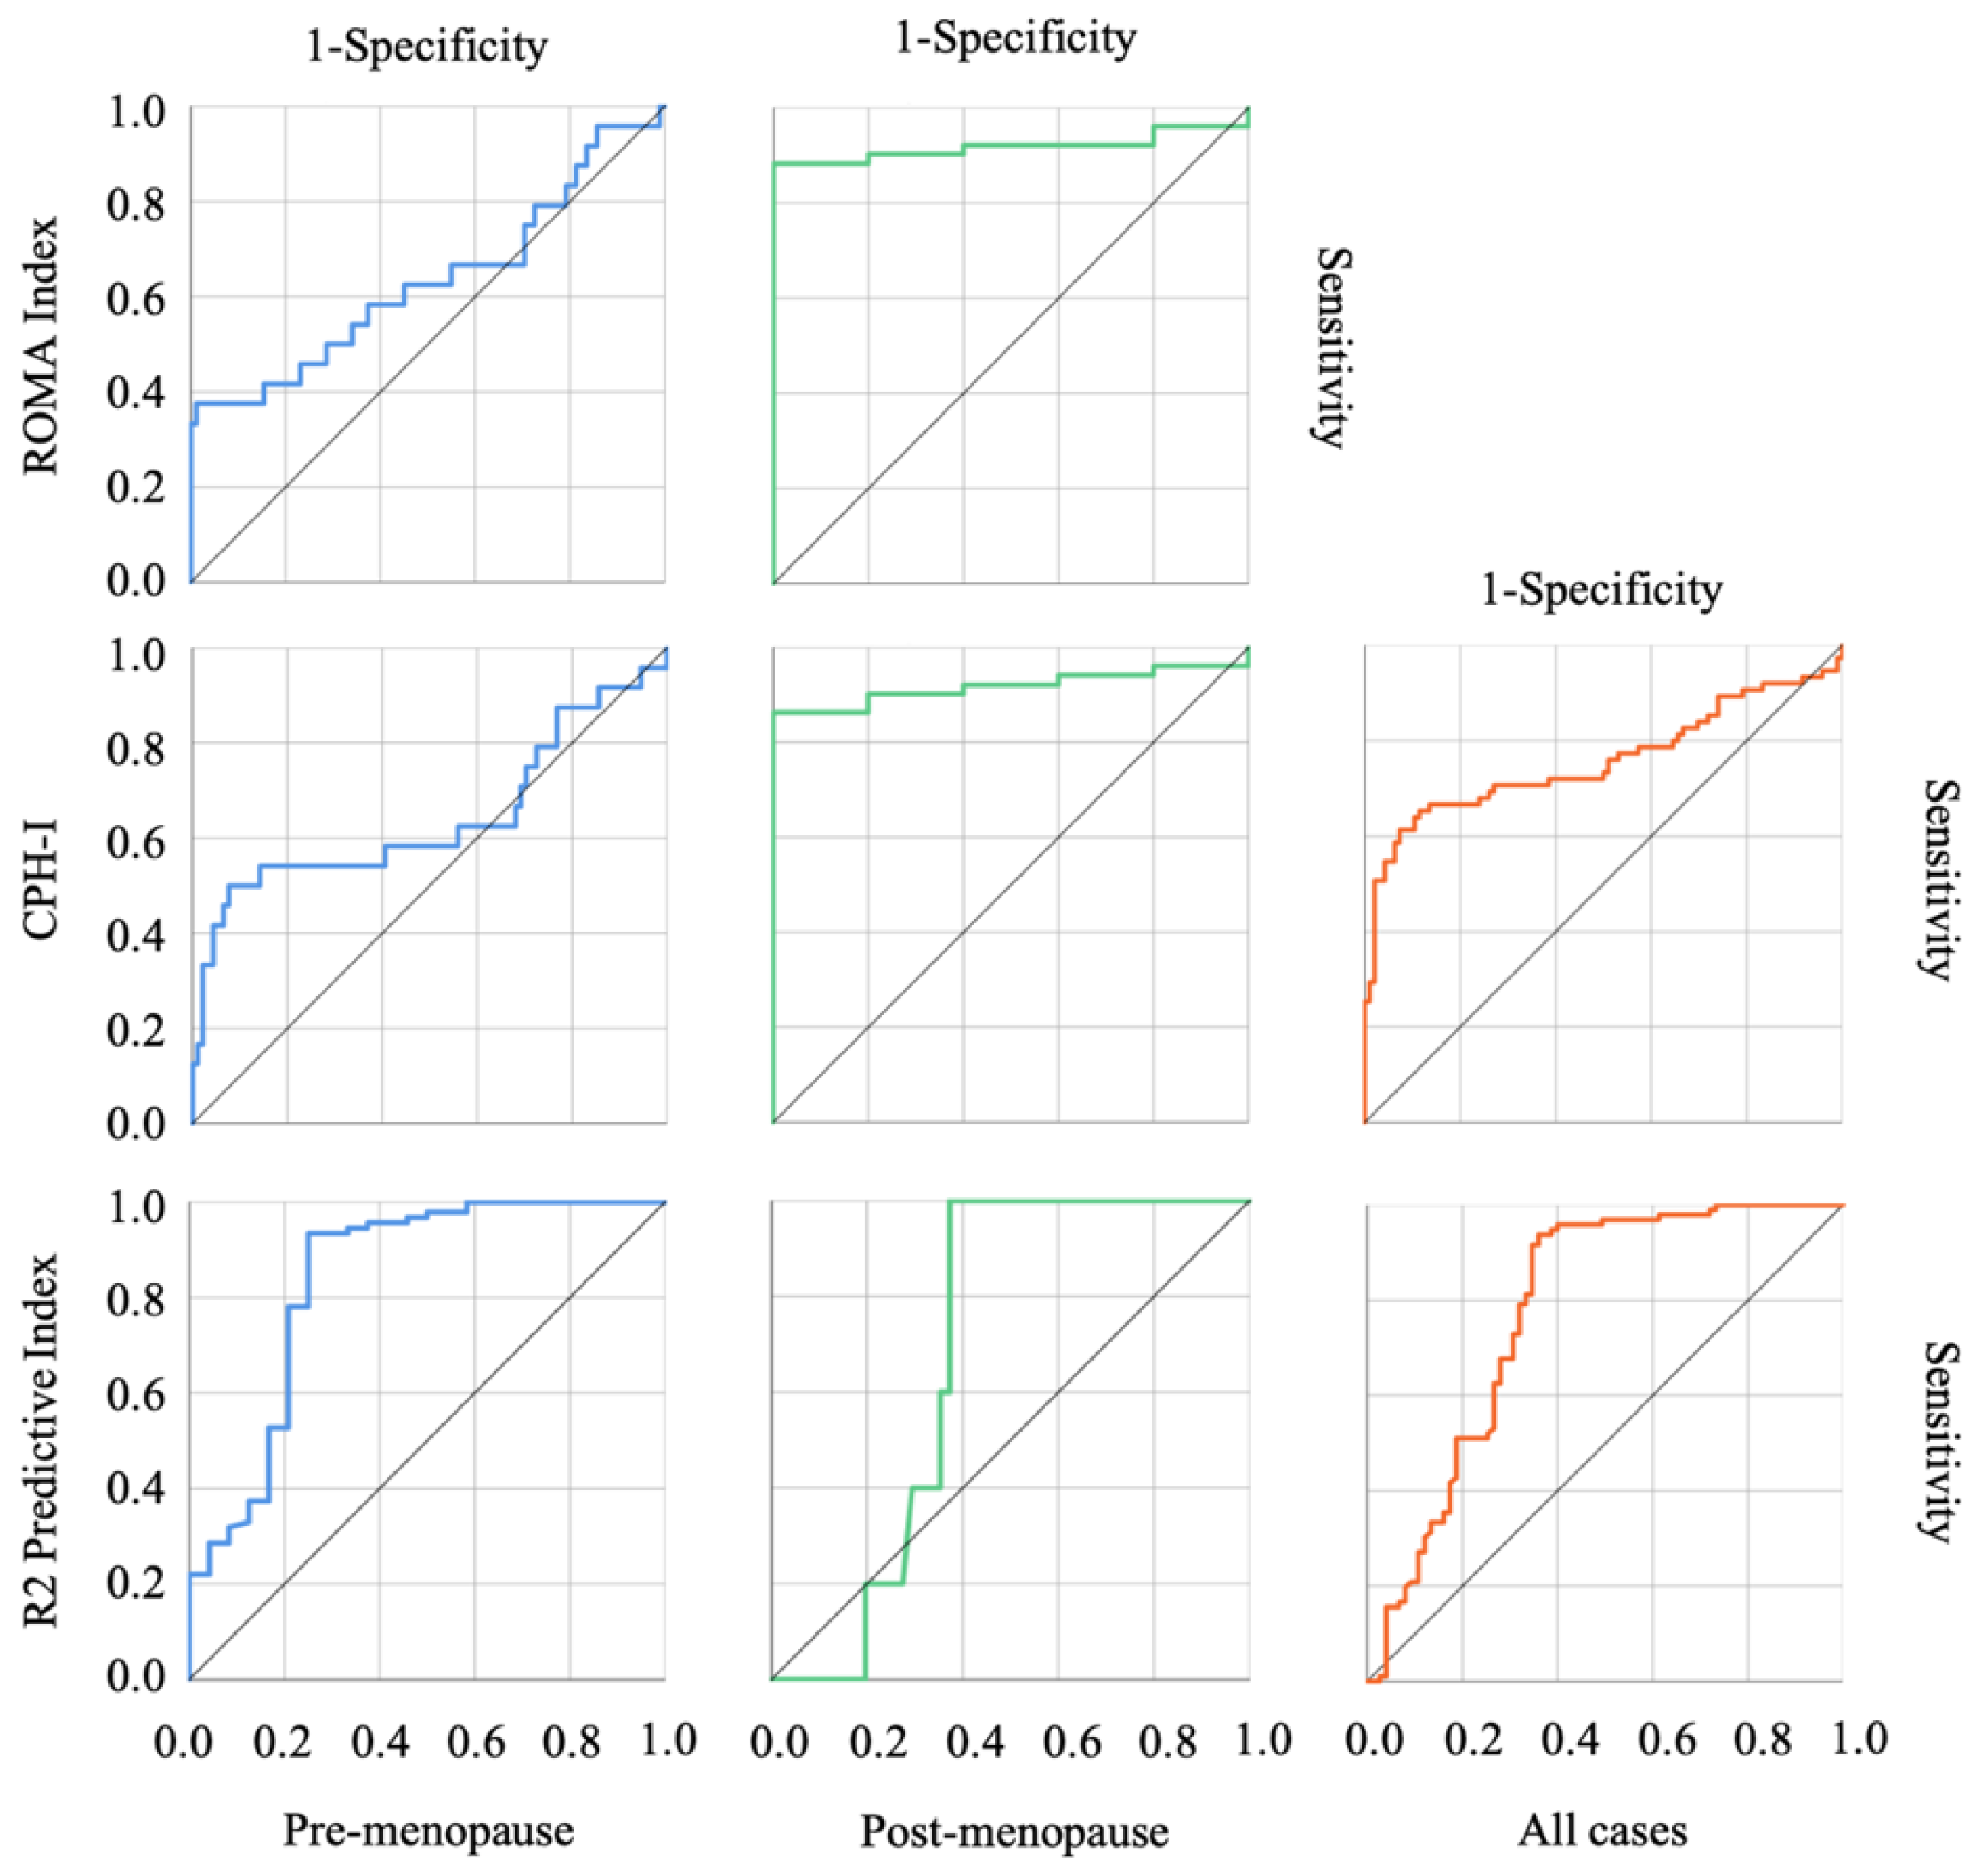
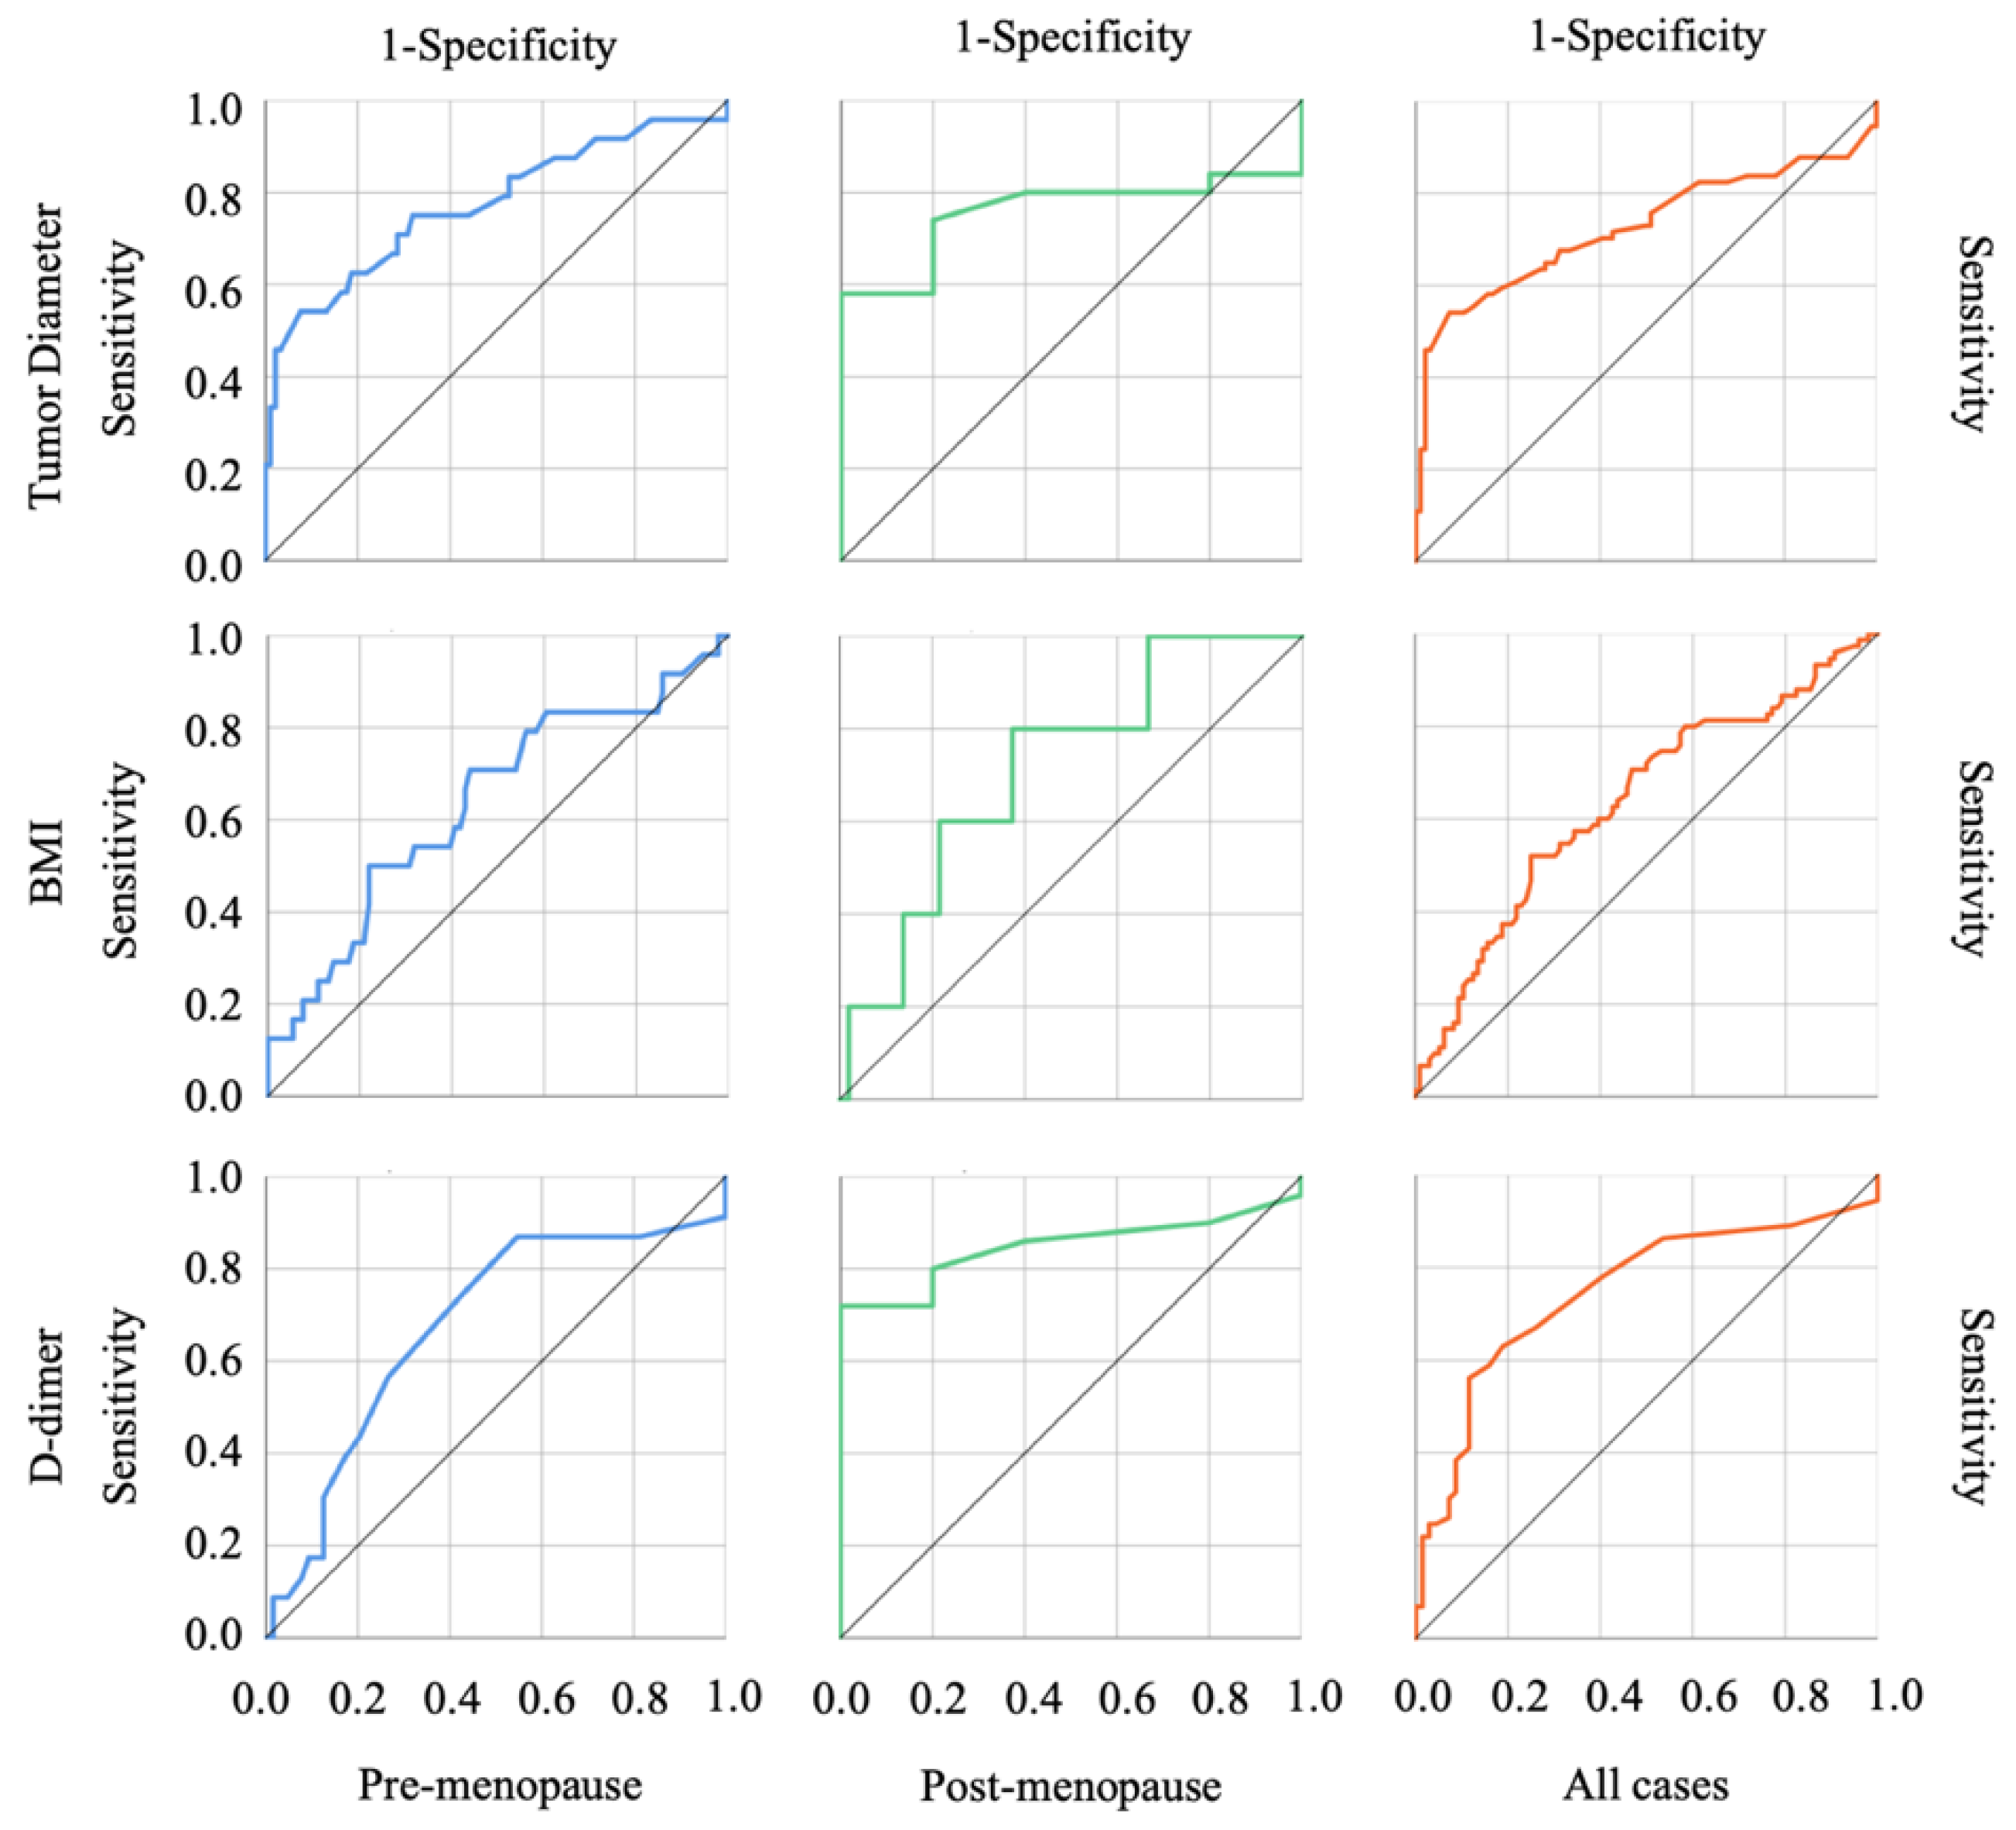
3.3. The Usefulness of Each Index in Discriminating OE and Malignant Ovarian Tumors
3.4. The Usefulness of the R2 Predictive Index in Discriminating OE from Borderline Tumors
3.5. The Differentiation of R2 Predictive Value between OE and Borderline Tumor or Advanced Malignant Tumors
4. Discussion
5. Conclusions
Author Contributions
Funding
Institutional Review Board Statement
Informed Consent Statement
Data Availability Statement
Acknowledgments
Conflicts of Interest
References
- Siegel, R.L.; Miller, K.D.; Jemal, A. Cancer statistics, 2019. CA Cancer J. Clin. 2019, 69, 7–34. [Google Scholar] [CrossRef] [PubMed] [Green Version]
- Bharwani, N.; Reznek, R.H.; Rockall, A.G. Ovarian Cancer Management: The role of imaging and diagnostic challenges. Eur. J. Radiol. 2011, 78, 41–51. [Google Scholar] [CrossRef] [PubMed]
- Saorin, A.; Di Gregorio, E.; Miolo, G.; Steffan, A.; Corona, G. Emerging Role of Metabolomics in Ovarian Cancer Diagnosis. Metabolites 2020, 10, 419. [Google Scholar] [CrossRef] [PubMed]
- Feeney, L.; Harley, I.J.; McCluggage, W.G.; Mullan, P.B.; Beirne, J.P. Liquid biopsy in ovarian cancer: Catching the silent killer before it strikes. World J. Clin. Oncol. 2020, 11, 868–889. [Google Scholar] [CrossRef] [PubMed]
- Zhang, Z.; Bast, R.C., Jr.; Yu, Y.; Li, J.; Sokoll, L.J.; Rai, A.J.; Rosenzweig, J.M.; Cameron, B.; Wang, Y.Y.; Meng, X.Y.; et al. Three Biomarkers Identified from Serum Proteomic Analysis for the Detection of Early Stage Ovarian Cancer. Cancer Res. 2004, 64, 5882–5890. [Google Scholar] [CrossRef] [PubMed] [Green Version]
- Stewart, C.; Ralyea, C.; Lockwood, S. Ovarian Cancer: An Integrated Review. Semin. Oncol. Nurs. 2019, 35, 151–156. [Google Scholar] [CrossRef]
- Lheureux, S.; Gourley, C.; Vergote, I.; Oza, A.M. Epithelial ovarian cancer. Lancet 2019, 393, 1240–1253. [Google Scholar] [CrossRef] [Green Version]
- Perrone, M.G.; Luisi, O.; De Grassi, A.; Ferorelli, S.; Cormio, G.; Scilimati, A. Translational Theragnosis of Ovarian Cancer: Where do we stand? Curr. Med. Chem. 2020, 27, 5675–5715. [Google Scholar] [CrossRef]
- Zampieri, L.X.; Grasso, D.; Bouzin, C.; Brusa, D.; Rossignol, R.; Sonveaux, P. Mitochondria Participate in Chemoresistance to Cisplatin in Human Ovarian Cancer Cells. Mol. Cancer Res. 2020, 18, 1379–1391. [Google Scholar] [CrossRef]
- Shih, I.; Kurman, R.J. Ovarian tumorigenesis: A proposed model based on morphological and molecular genetic analysis. Am. J. Pathol. 2004, 164, 1511–1518. [Google Scholar] [CrossRef]
- Kurman, R.J.; Shih, I. The origin and pathogenesis of epithelial ovarian cancer: A proposed unifying theory. Am. J. Surg. Pathol. 2010, 34, 433–443. [Google Scholar] [CrossRef] [PubMed] [Green Version]
- Zeppernick, F.; Meinhold-Heerlein, I.; Shih, I.-M. Precursors of ovarian cancer in the fallopian tube: Serous tubal intraepithelial carcinoma—An update. J. Obstet. Gynaecol. Res. 2015, 41, 6–11. [Google Scholar] [CrossRef] [PubMed] [Green Version]
- Kurman, R.J.; Shih, I. The Dualistic Model of Ovarian Carcinogenesis: Revisited, Revised, and Expanded. Am. J. Pathol. 2016, 186, 733–747. [Google Scholar] [CrossRef] [PubMed] [Green Version]
- Kaldawy, A.; Segev, Y.; Lavie, O.; Auslender, R.; Sopik, V.; Narod, S.A. Low-grade serous ovarian cancer: A review. Gynecol. Oncol. 2016, 143, 433–438. [Google Scholar] [CrossRef] [PubMed]
- Darelius, A.; Kristjansdottir, B.; Dahm-Kähler, P.; Strandell, A. Risk of epithelial ovarian cancer Type I and II after hysterectomy, salpingectomy and tubal ligation—A nationwide case-control study. Int. J. Cancer 2021, 149, 1544–1552. [Google Scholar] [CrossRef] [PubMed]
- Lengyel, E. Ovarian Cancer Development and Metastasis. Am. J. Pathol. 2010, 177, 1053–1064. [Google Scholar] [CrossRef]
- Kobayashi, H.; Sumimoto, K.; Moniwa, N.; Imai, M.; Takakura, K.; Kuromaki, T.; Morioka, E.; Arisawa, K.; Terao, T. Risk of developing ovarian cancer among women with ovarian endometrioma: A cohort study in Shizuoka, Japan. Int. J. Gynecol. Cancer 2007, 17, 37–43. [Google Scholar] [CrossRef]
- Kobayashi, H. Ovarian cancer in endometriosis: Epidemiology, natural history, and clinical diagnosis. Int. J. Clin. Oncol. 2009, 14, 378–382. [Google Scholar] [CrossRef]
- Kobayashi, H. Potential scenarios leading to ovarian cancer arising from endometriosis. Redox Rep. 2016, 21, 119–126. [Google Scholar] [CrossRef]
- Giudice, L.C.; Kao, L.C. Endometriosis. Lancet 2004, 364, 1789–1799. [Google Scholar] [CrossRef]
- Falcone, T.; Flyckt, R. Clinical Management of Endometriosis. Obstet. Gynecol. 2018, 131, 557–571. [Google Scholar] [CrossRef] [PubMed] [Green Version]
- Hewitt, G. Dysmenorrhea and Endometriosis: Diagnosis and Management in Adolescents. Clin. Obstet. Gynecol. 2020, 63, 536–543. [Google Scholar] [CrossRef] [PubMed]
- Nnoaham, K.E.; Hummelshoj, L.; Webster, P.; d’Hooghe, T.; de Cicco Nardone, F.; de Cicco Nardone, C.; Jenkinson, C.; Kennedy, S.H.; Zondervan, K.T. World Endometriosis Research Foundation Global Study of Women’s Health consortium. Impact of endometriosis on quality of life and work productivity: A multicenter study across ten countries. Fertil. Steril. 2011, 96, 366–373.e8. [Google Scholar] [CrossRef] [PubMed] [Green Version]
- Patzkowsky, K. Rethinking endometriosis and pelvic pain. J. Clin. Investig. 2021, 131, e154876. [Google Scholar] [CrossRef] [PubMed]
- Macer, M.L.; Taylor, H.S. Endometriosis and infertility: A review of the pathogenesis and treatment of endometriosis-associated infertility. Obstet. Gynecol. Clin. N. Am. 2012, 39, 535–549. [Google Scholar] [CrossRef] [Green Version]
- Tanbo, T.; Fedorcsak, P. Endometriosis-associated infertility: Aspects of pathophysiological mechanisms and treatment options. Acta Obstet. Gynecol. Scand. 2017, 96, 659–667. [Google Scholar] [CrossRef]
- Jiang, L.; Akatsuka, S.; Nagai, H.; Chew, S.-H.; Ohara, H.; Okazaki, Y.; Yamashita, Y.; Yoshikawa, Y.; Yasui, H.; Ikuta, K.; et al. Iron overload signature in chrysotile-induced malignant mesothelioma. J. Pathol. 2012, 228, 366–377. [Google Scholar] [CrossRef]
- Akatsuka, S.; Yamashita, Y.; Ohara, H.; Liu, Y.-T.; Izumiya, M.; Abe, K.; Ochiai, M.; Jiang, L.; Nagai, H.; Okazaki, Y.; et al. Fenton Reaction Induced Cancer in Wild Type Rats Recapitulates Genomic Alterations Observed in Human Cancer. PLoS ONE 2012, 7, e43403. [Google Scholar] [CrossRef]
- Toyokuni, S. Iron overload as a major targetable pathogenesis of asbestos-induced mesothelial carcinogenesis. Redox Rep. 2014, 19, 1–7. [Google Scholar] [CrossRef]
- Kew, M.C. Hepatic iron overload and hepatocellular carcinoma. Liver Cancer 2014, 3, 31–40. [Google Scholar] [CrossRef]
- Rockfield, S.; Raffel, J.; Mehta, R.; Rehman, N.; Nanjundan, M. Iron overload and altered iron metabolism in ovarian cancer. Biol. Chem. 2017, 398, 995–1007. [Google Scholar] [CrossRef] [PubMed]
- Yoshimoto, C.; Iwabuchi, T.; Shigetomi, H.; Kobayashi, H. Cyst fluid iron-related compounds as useful markers to distinguish malignant transformation from benign endometriotic cysts. Cancer Biomark. 2015, 15, 493–499. [Google Scholar] [CrossRef] [PubMed] [Green Version]
- Yoshimoto, C.; Takahama, J.; Iwabuchi, T.; Uchikoshi, M.; Shigetomi, H.; Kobayashi, H. Transverse Relaxation Rate of Cyst Fluid Can Predict Malignant Transformation of Ovarian Endometriosis. Magn. Reson. Med. Sci. 2017, 16, 137–145. [Google Scholar] [CrossRef] [PubMed] [Green Version]
- Kobayashi, H.; Yamada, Y.; Kawahara, N.; Ogawa, K.; Yoshimoto, C. Modern approaches to noninvasive diagnosis of malignant transformation of endometriosis. Oncol. Lett. 2019, 17, 1196–1202. [Google Scholar] [CrossRef] [Green Version]
- Kawahara, N.; Miyake, R.; Yamanaka, S.; Kobayashi, H. A Novel Predictive Tool for Discriminating Endometriosis Associated Ovarian Cancer from Ovarian Endometrioma: The R2 Predictive Index. Cancers 2021, 13, 3829. [Google Scholar] [CrossRef]
- Moro, F.; Magoga, G.; Pasciuto, T.; Mascilini, F.; Moruzzi, M.C.; Fischerova, D.; Savelli, L.; Giunchi, S.; Mancari, R.; Franchi, D.; et al. Imaging in gynecological disease (13): Clinical and ultrasound characteristics of endometrioid ovarian cancer. Ultrasound Obstet. Gynecol. 2018, 52, 535–543. [Google Scholar] [CrossRef] [Green Version]
- Ben-Meir, L.C.; Mashiach, R.; Eisenberg, V.H. External Validation of the IOTA Classification in Women with Ovarian Masses Suspected to Be Endometrioma. J. Clin. Med. 2021, 10, 2971. [Google Scholar] [CrossRef]
- Wei, S.U.; Li, H.; Zhang, B. The diagnostic value of serum HE4 and CA-125 and ROMA index in ovarian cancer. Biomed. Rep. 2016, 5, 41–44. [Google Scholar] [CrossRef] [Green Version]
- Wang, Z.; Tao, X.; Ying, C. CPH-I and HE4 Are More Favorable Than CA125 in Differentiating Borderline Ovarian Tumors from Epithelial Ovarian Cancer at Early Stages. Dis. Markers 2019, 2019, 6241743. [Google Scholar] [CrossRef]
- Kim, B.; Park, Y.; Kim, B.; Ahn, H.J.; Lee, K.-A.; Chung, J.E.; Han, S.W. Diagnostic performance of CA 125, HE4, and risk of Ovarian Malignancy Algorithm for ovarian cancer. J. Clin. Lab. Anal. 2019, 33, e22624. [Google Scholar] [CrossRef] [Green Version]
- Huy, N.V.Q.; Van Khoa, V.; Tam, L.M.; Vinh, T.Q.; Tung, N.S.; Thanh, C.N.; Chuang, L. Standard and optimal cut-off values of serum ca-125, HE4 and ROMA in preoperative prediction of ovarian cancer in Vietnam. Gynecol. Oncol. Rep. 2018, 25, 110–114. [Google Scholar] [CrossRef] [PubMed]
- Lee, Y.J.; Kim, Y.M.; Kang, J.S.; Nam, S.H.; Kim, D.Y.; Kim, Y.T. Comparison of Risk of Ovarian Malignancy Algorithm and cancer antigen 125 to discriminate between benign ovarian tumor and early-stage ovarian cancer according to imaging tumor sub-types. Oncol. Lett. 2020, 20, 931–938. [Google Scholar] [CrossRef] [PubMed]
- Carreras-Dieguez, N.; Glickman, A.; Munmany, M.; Casanovas, G.; Agustí, N.; Díaz-Feijoo, B.; Saco, A.; Sánchez, B.; Gaba, L.; Angeles, M.A.; et al. Comparison of HE4, CA125, ROMA and CPH-I for Preoperative Assessment of Adnexal Tumors. Diagnostics 2022, 12, 226. [Google Scholar] [CrossRef] [PubMed]
- Moore, R.G.; McMeekin, D.S.; Brown, A.K.; DiSilvestro, P.; Miller, M.C.; Allard, W.J.; Gajewski, W.; Kurman, R.; Bast, R.C., Jr.; Skates, S.J. A novel multiple marker bioassay utilizing HE4 and CA125 for the prediction of ovarian cancer in patients with a pelvic mass. Gynecol. Oncol. 2009, 112, 40–46. [Google Scholar] [CrossRef] [Green Version]
- Karlsen, M.A.; Høgdall, E.V.; Christensen, I.J.; Borgfeldt, C.; Kalapotharakos, G.; Zdrazilova-Dubska, L.; Chovanec, J.; Lok, C.A.; Stiekema, A.; Mutz-Dehbalaie, I.; et al. A novel diagnostic index combining HE4, CA125 and age may improve triage of women with suspected ovarian cancer—An international multicenter study in women with an ovarian mass. Gynecol. Oncol. 2015, 138, 640–646. [Google Scholar] [CrossRef]
- Tran, D.T.; Vo, V.K.; Le, M.T.; Chuang, L.; Nguyen, V.Q.H. Copenhagen Index versus ROMA in preoperative ovarian malignancy risk stratification: Result from the first Vietnamese prospective cohort study. Gynecol. Oncol. 2021, 162, 113–119. [Google Scholar] [CrossRef]
- Yoshida, A.; Derchain, S.F.; Pitta, D.R.; Andrade, L.A.L.D.A.; Sarian, L.O. Comparing the Copenhagen Index (CPH-I) and Risk of Ovarian Malignancy Algorithm (ROMA): Two equivalent ways to differentiate malignant from benign ovarian tumors before surgery? Gynecol. Oncol. 2016, 140, 481–485. [Google Scholar] [CrossRef]
- Akinwunmi, B.O.; Babic, A.; Vitonis, A.F.; Cramer, D.W.; Titus, L.; Tworoger, S.S.; Terry, K.L. Chronic Medical Conditions and CA125 Levels among Women without Ovarian Cancer. Cancer Epidemiol. Biomarkers Prev. 2018, 27, 1483–1490. [Google Scholar] [CrossRef] [Green Version]
- Kil, K.; Chung, J.E.; Pak, H.J.; Jeung, I.C.; Kim, J.H.; Jo, H.H.; Kim, M.R. Usefulness of CA125 in the differential diagnosis of uterine adenomyosis and myoma. Eur. J. Obstet. Gynecol. Reprod. Biol. 2015, 185, 131–135. [Google Scholar] [CrossRef]
- McLemore, M.R.; Aouizerat, B.E.; Lee, K.A.; Chen, L.-M.; Cooper, B.; Tozzi, M.; Miaskowski, C. A Comparison of the Cyclic Variation in Serum Levels of CA125 Across the Menstrual Cycle Using Two Commercial Assays. Biol. Res. Nurs. 2012, 14, 250–256. [Google Scholar] [CrossRef] [Green Version]
- Markman, M. The Role of CA-125 in the Management of Ovarian Cancer. Oncologist 1997, 2, 6–9. [Google Scholar] [CrossRef] [PubMed] [Green Version]
- Gupta, K.K.; Gupta, V.K.; Naumann, R.W. Ovarian cancer: Screening and future directions. Int. J. Gynecol. Cancer 2019, 29, 195–200. [Google Scholar] [CrossRef] [PubMed]
- Nisenblat, V.; Bossuyt, P.M.; Shaikh, R.; Farquhar, C.; Jordan, V.; Scheffers, C.S.; Mol, B.W.J.; Johnson, N.; Hull, M.L. Blood biomarkers for the non-invasive diagnosis of endometriosis. Cochrane Database Syst. Rev. 2016, 2016, CD012179. [Google Scholar] [CrossRef] [PubMed] [Green Version]
- Clauss, A.; Lilja, H.; Lundwall, A. A locus on human chromosome 20 contains several genes expressing protease inhibitor domains with homology to whey acidic protein. Biochem. J. 2002, 368, 233–242. [Google Scholar] [CrossRef] [PubMed] [Green Version]
- Drapkin, R.; Von Horsten, H.H.; Lin, Y.; Mok, S.C.; Crum, C.P.; Welch, W.R.; Hecht, J.L. Human Epididymis Protein 4 (HE4) Is a Secreted Glycoprotein that Is Overexpressed by Serous and Endometrioid Ovarian Carcinomas. Cancer Res. 2005, 65, 2162–2169. [Google Scholar] [CrossRef] [Green Version]
- Brennan, D.J.; Hackethal, A.; Metcalf, A.M.; Coward, J.; Ferguson, K.; Oehler, M.K.; Quinn, M.; Janda, M.; Leung, Y.; Freemantle, M.; et al. Serum HE4 as a prognostic marker in endometrial cancer—A population based study. Gynecol. Oncol. 2014, 132, 159–165. [Google Scholar] [CrossRef] [PubMed] [Green Version]
- Terlikowska, K.M.; Dobrzycka, B.; Witkowska, A.M.; Mackowiak-Matejczyk, B.; Sledziewski, T.K.; Kinalski, M.; Terlikowski, S.J. Preoperative HE4, CA125 and ROMA in the differential diagnosis of benign and malignant adnexal masses. J. Ovarian Res. 2016, 9, 43. [Google Scholar] [CrossRef] [Green Version]


| Benign Tumor (OE) | Malignant Tumor (EAOC) | p-Value | |
|---|---|---|---|
| Number | n = 96 | n = 75 | |
| Age (years) | |||
| Median (range) | 37.00 (18–63) | 54.00 (21–82) | |
| Mean ± SD | 36.40 ± 8.82 | 54.36 ± 11.63 | <0.001 |
| BMI | |||
| Median (range) | 20.05 (14.52–34.25) | 21.98 (15.20–36.00) | |
| Mean ± SD | 20.75 ± 3.55 | 22.49 ± 4.22 | 0.002 |
| Gravida | |||
| 0 | 55 | 25 | |
| ≥1 | 41 | 50 | 0.001 |
| Parity | |||
| 0 | 59 | 26 | |
| ≥1 | 37 | 49 | <0.001 |
| FIGO sage | – | I (n = 49), II (n = 3), III (n = 15), IV (n = 8) | |
| Subtype | Endometrioma (n = 96) | Endometrioid carcinoma (n = 27) | |
| CCC (n = 40) | |||
| SMBT (n = 8) | |||
| Cyst size (mm) | |||
| Median (range) | 64.50 (38.00–185.00) | 105.00 (16.50–350.00) | |
| Mean ± SD | 67.79 ± 22.97 | 110.05 ± 60.85 | <0.001 |
| Menopause | |||
| Yes | 5 | 51 | |
| No | 91 | 24 | <0.001 |
| Laterality | * | ||
| Unilateral | 56 | 60 | |
| Bilateral | 40 | 14 | 0.001 |
| Benign Tumor (OE) | Malignant Tumor (EAOC) | p-Value | |
|---|---|---|---|
| Number | n = 96 | n = 75 | |
| CA 19-9 (U/mL) | |||
| Median (range) | 23.30 (0.50–1085.70) | 29.50 (0.00–8953.10) | |
| Mean ± SD | 48.14 ± 118.09 | 391.93 ± 1305.99 | 0.068 |
| CEA (ng/mL) | |||
| Median (range) | 1.50 (0.60–5.20) | 2.20 (0.70–30.00) | |
| Mean ± SD | 1.75 ± 0.99 | 4.05 ± 5.25 | <0.001 |
| HE4 (pmol/L) | |||
| Median (range) | 42.30 (28.10–107.70) | 72.7 (28.7–1873.70) | |
| Mean ± SD | 45.19 ± 12.26 | 215.52 ± 336.46 | <0.001 |
| CA125 (U/mL) | |||
| Median (range) | 58.25 (10.10–5525.20) | 147.20 (1.00–9426.00) | |
| Mean ± SD | 159.70 ± 575.42 | 691.53 ± 1402.11 | 0.013 |
| Hb (g/mL) | |||
| Median (range) | 12.60 (8.90–14.60) | 12.80 (4.60–15.70) | |
| Mean ± SD | 12.60 ± 1.06 | 12.46 ± 1.88 | 0.691 |
| D-dimer (µg/mL) | |||
| Median (range) | 0.70 (0.50–8.40) | 1.30 (0.40–34.70) | |
| Mean ± SD | 0.99 ± 1.11 | 3.05 ± 4.87 | <0.001 |
| AUC | p-Value | Cut-Off Value | Sensitivity | Specificity | PPV | NPV | |
|---|---|---|---|---|---|---|---|
| CA 19-9 (U/mL) | |||||||
| Pre-menopause | 0.511 | 0.872 | – | – | – | – | – |
| Post-menopause | 0.765 | 0.062 | – | – | – | – | – |
| Combined | 0.581 | 0.068 | – | – | – | – | – |
| CEA (ng/mL) | |||||||
| Pre-menopause | 0.704 | 0.002 | 1.55 | 0.750 | 0.615 | 33.96 | 90.32 |
| Post-menopause | 0.465 | 0.796 | – | – | – | – | – |
| Combined | 0.714 | <0.001 | 1.65 | 0.707 | 0.635 | 60.22 | 73.49 |
| HE4 (pmol/L) | |||||||
| Pre-menopause | 0.631 | 0.049 | 82.90 | 0.375 | 0.989 | 90.00 | 85.71 |
| Post-menopause | 0.878 | 0.006 | 54.10 | 0.725 | 1.000 | 100.00 | 26.31 |
| Combined | 0.758 | <0.001 | 54.65 | 0.627 | 0.854 | 77.04 | 74.54 |
| CA125 (U/mL) | |||||||
| Pre-menopause | 0.606 | 0.112 | – | – | – | – | – |
| Post-menopause | 0.898 | 0.004 | 15.00 | 0.922 | 0.800 | 97.91 | 50.00 |
| Combined | 0.610 | 0.013 | 146.15 | 0.507 | 0.844 | 71.69 | 68.64 |
| Tumor diameter (mm) | |||||||
| Pre-menopause | 0.772 | <0.001 | 97.50 | 0.542 | 0.923 | 65.00 | 88.42 |
| Post-menopause | 0.758 | 0.059 | – | – | – | – | – |
| Combined | 0.726 | <0.001 | 97.50 | 0.541 | 0.927 | 85.10 | 71.77 |
| BMI | |||||||
| Pre-menopause | 0.636 | 0.041 | 21.94 | 0.500 | 0.780 | 37.50 | 85.54 |
| Post-menopause | 0.718 | 0.111 | – | – | – | – | – |
| Combined | 0.636 | 0.002 | 21.94 | 0.520 | 0.750 | 61.90 | 66.66 |
| D-dimer (µg/mL) | |||||||
| Pre-menopause | 0.675 | 0.013 | 0.65 | 0.870 | 0.453 | 32.78 | 92.59 |
| Post-menopause | 0.848 | 0.011 | 0.95 | 0.720 | 1.000 | 100.00 | 26.31 |
| Combined | 0.748 | <0.001 | 1.15 | 0.562 | 0.884 | 75.00 | 71.30 |
| CPH-I (%) | |||||||
| Pre-menopause | 0.642 | 0.032 | 6.564 | 0.500 | 0.923 | 63.15 | 87.50 |
| Post-menopause | 0.918 | 0.002 | 1.884 | 0.863 | 1.000 | 100.00 | 41.66 |
| Combined | 0.758 | <0.001 | 6.564 | 0.613 | 0.927 | 86.79 | 75.42 |
| ROMA Index (%) | |||||||
| Pre-menopause | 0.633 | 0.046 | 24.78 | 0.375 | 0.989 | 90.00 | 85.71 |
| Post-menopause | 0.918 | 0.002 | 13.23 | 0.882 | 1.000 | 100.00 | 45.45 |
| Combined | – | – | – | – | – | 98.18 | 81.89 |
| R2 Predictive Index | |||||||
| Pre-menopause | 0.840 | <0.001 | 16.95 | 0.934 | 0.750 | 75.00 | 93.40 |
| Post-menopause | 0.684 | 0.177 | 18.39 | 1.000 | 0.627 | 100.00 | 20.83 |
| Combined | 0.777 | <0.001 | 16.95 | 0.938 | 0.640 | 88.88 | 76.92 |
| Univariate Analysis | Multivariate Analysis | ||||||
|---|---|---|---|---|---|---|---|
| Risk Ratio (95% CI) | p-Value | Risk Ratio (95% CI) | p-Value | Risk Ratio (95% CI) | p-Value | ||
| CPH-I | ≤6.564 | 1.00 (referent) | — | — | |||
| (%) | >6.564 | 20.16 (8.20–49.54) | <0.001 | — | — | ||
| ROMA Index | 1.00 (referent) | 1.00 (referent) | — | — | |||
| (%) | 244.28 (31.96–1866.91) | <0.001 | 222.14 (22.27–2215.50) | <0.001 | — | — | |
| R2 Predictive | ≤16.95 | 1.00 (referent) | 1.00 (referent) | — | — | ||
| Index | >16.95 | 26.66 (10.29–69.05) | <0.001 | 9.80 (2.90–33.13) | <0.001 | — | — |
| Gravida | 0 | 1.00 (referent) | |||||
| ≥1 | 2.68 (1.43–5.02) | 0.002 | |||||
| Parity | 0 | 1.00 (referent) | |||||
| ≥1 | 3.00 (1.60–5.63) | 0.001 | |||||
| Laterality | Uni- | 1.00 (referent) | 1.00 (referent) | 1.00 (referent) | |||
| Bi- | 0.32 (0.16–0.66) | 0.002 | 0.15 (0.03–0.75) | 0.021 | 0.22 (0.08–0.65) | 0.006 | |
| BMI | ≤21.94 | 1.00 (referent) | |||||
| >21.94 | 3.25 (1.70–6.20) | <0.001 | |||||
| Tumor diameter | <97.50 | 1.00 (referent) | — | — | 1.00 (referent) | ||
| (mm) | ≥97.50 | 14.53 (5.94–35.49) | <0.001 | — | — | 12.68 (4.21–38.22) | <0.001 |
| D-dimer | <1.15 | 1.00 (referent) | 1.00 (referent) | ||||
| (µg/mL) | ≥1.15 | 7.45 (3.60–15.42) | <0.001 | 5.13 (1.81–14.53) | 0.002 | ||
| CEA | <1.65 | 1.00 (referent) | — | — | 1.00 (referent) | ||
| (ng/mL) | ≥1.65 | 4.19 (2.19–8.02) | <0.001 | — | — | 4.36 (1.75–10.85) | 0.002 |
| HE4 | <54.65 | 1.00 (referent) | — | — | 1.00 (referent) | ||
| (pmol/L) | ≥54.65 | 9.83 (4.71–20.50) | <0.001 | — | — | 3.85 (1.37–10.82) | 0.011 |
| CA125 | <146.15 | 1.00 (referent) | — | — | |||
| (U/mL) | ≥146.15 | 5.54 (2.71–11.31) | <0.001 | — | — | ||
| Univariate Analysis | Multivariate Analysis | ||||||
|---|---|---|---|---|---|---|---|
| Risk Ratio (95% CI) | p-Value | Risk Ratio (95% CI) | p-Value | Risk Ratio (95% CI) | p-Value | ||
| CPH-I | ≤6.564 | 1.00 (referent) | 1.00 (referent) | — | — | ||
| (%) | >6.564 | 12.00 (3.95–36.45) | <0.001 | 6.45 (1.47–28.22) | 0.013 | — | — |
| ROMA Index | ≤24.78 | 1.00 (referent) | — | — | |||
| (%) | >24.78 | 54.00 (6.37–457.62) | <0.001 | — | — | ||
| R2 Predictive | ≤16.95 | 1.00 (referent) | 1.00 (referent) | — | — | ||
| Index | >16.95 | 42.50 (12.29–146.95) | <0.001 | 31.19 (8.48–114.74) | <0.001 | — | — |
| Gravida | 0 | 1.00 (referent) | |||||
| ≥1 | 1.04 (0.41–2.59) | 0.929 | |||||
| Parity | 0 | 1.00 (referent) | |||||
| ≥1 | 1.25 (0.50–3.14) | 0.627 | |||||
| Laterality | Uni- | 1.00 (referent) | 1.00 (referent) | ||||
| Bi- | 0.19 (0.05–0.71) | 0.013 | 0.15 (0.02–0.81) | 0.028 | |||
| BMI | ≤21.94 | 1.00 (referent) | |||||
| >21.94 | 3.55 (1.38–9.10) | 0.008 | |||||
| Tumor diameter | <97.50 | 1.00 (referent) | — | — | 1.00 (referent) | ||
| (mm) | ≥97.50 | 14.18 (4.65–43.17) | <0.001 | — | — | 11.78 (3.09–44.93) | <0.001 |
| D-dimer | <0.65 | 1.00 (referent) | |||||
| (µg/mL) | ≥0.65 | 6.09 (1.93–19.26) | 0.002 | ||||
| CEA | <1.55 | 1.00 (referent) | — | — | |||
| (ng/mL) | ≥1.55 | 4.80 (1.73–13.25) | 0.002 | — | — | ||
| HE4 | <82.90 | 1.00 (referent) | — | — | 1.00 (referent) | ||
| (pmol/L) | ≥82.90 | 54.00 (6.37–457.42) | <0.001 | — | — | 47.94 (4.01–572.03) | 0.002 |
| Index | Cohort | PLR | NLR | DOR |
|---|---|---|---|---|
| CPH Index | Pre-menopause | 6.50 | 0.54 | 12.00 |
| Combined | 8.41 | 0.41 | 20.16 | |
| ROMA Index | Pre-menopause | 34.12 | 0.63 | 54.00 |
| Combined | 69.12 | 0.28 | 244.28 | |
| R2 Predictive Index | Pre-menopause | 11.37 | 0.26 | 42.50 |
| Combined | 10.24 | 0.38 | 26.66 |
| Univariate Analysis | Multivariate Analysis | ||||||
|---|---|---|---|---|---|---|---|
| Risk Ratio (95% CI) | p-Value | Risk Ratio (95% CI) | p-Value | Risk Ratio (95% CI) | p-Value | ||
| CPH-I | ≤6.564 | 1.00 (referent) | — | — | |||
| (%) | >6.564 | 4.23 (0.71–25.02) | 0.111 | — | — | ||
| ROMA Index | 1.00 (referent) | — | — | ||||
| (%) | 57.00 (4.99–650.89) | 0.001 | — | — | |||
| R2 Predictive | ≤16.95 | 1.00 (referent) | 1.00 (referent) | — | — | ||
| Index | >16.95 | 45.00 (7.43–272.52) | <0.001 | 45.00 (7.43–272.52) | <0.001 | — | — |
| Gravida | 0 | 1.00 (referent) | |||||
| ≥1 | 2.23 (0.50–9.89) | 0.289 | |||||
| Parity | 0 | 1.00 (referent) | |||||
| ≥1 | 2.65 (0.59–11.78) | 0.198 | |||||
| Laterality | Uni- | 1.00 (referent) | |||||
| Bi- | 0.46 (0.09–2.43) | 0.366 | |||||
| BMI | ≤21.94 | 1.00 (referent) | |||||
| >21.94 | 5.00 (1.11–22.50) | 0.036 | |||||
| Tumor diameter | <97.50 | 1.00 (referent) | — | — | 1.00 (referent) | ||
| (mm) | ≥97.50 | 7.62 (1.50–38.74) | 0.014 | — | — | 7.33 (1.32–40.48) | 0.022 |
| D-dimer | <1.15 | 1.00 (referent) | |||||
| (µg/mL) | ≥1.15 | 3.51 (0.75–16.38) | 0.110 | ||||
| CEA | <1.65 | 1.00 (referent) | — | — | |||
| (ng/mL) | ≥1.65 | 5.22 (1.00–27.31) | 0.050 | — | — | ||
| HE4 | <54.65 | 1.00 (referent) | — | — | |||
| (pmol/L) | ≥54.65 | 1.95 (0.35–10.66) | 0.440 | — | — | ||
| CA125 | <146.15 | 1.00 (referent) | — | — | |||
| (U/mL) | ≥146.15 | 3.24 (0.69–15.01) | 0.133 | — | — | ||
| OE | Borderline Tumor | Carcinoma | p-Value | |
|---|---|---|---|---|
| Number | n = 96 | n = 8 | n = 67 | |
| R2 Predictive Index | ||||
| Median (range) | 19.80 (11.47–23.32) | 13.27 (−20.60–20.43) | 15.16 (−12.74–25.56) | |
| Mean ± SD | 19.61 ± 2.13 | 6.81 ± 16.30 | 14.15 ± 7.00 | 0.001 |
Publisher’s Note: MDPI stays neutral with regard to jurisdictional claims in published maps and institutional affiliations. |
© 2022 by the authors. Licensee MDPI, Basel, Switzerland. This article is an open access article distributed under the terms and conditions of the Creative Commons Attribution (CC BY) license (https://creativecommons.org/licenses/by/4.0/).
Share and Cite
Yamanaka, S.; Kawahara, N.; Kawaguchi, R.; Waki, K.; Maehana, T.; Fukui, Y.; Miyake, R.; Yamada, Y.; Kobayashi, H.; Kimura, F. The Comparison of Three Predictive Indexes to Discriminate Malignant Ovarian Tumors from Benign Ovarian Endometrioma: The Characteristics and Efficacy. Diagnostics 2022, 12, 1212. https://doi.org/10.3390/diagnostics12051212
Yamanaka S, Kawahara N, Kawaguchi R, Waki K, Maehana T, Fukui Y, Miyake R, Yamada Y, Kobayashi H, Kimura F. The Comparison of Three Predictive Indexes to Discriminate Malignant Ovarian Tumors from Benign Ovarian Endometrioma: The Characteristics and Efficacy. Diagnostics. 2022; 12(5):1212. https://doi.org/10.3390/diagnostics12051212
Chicago/Turabian StyleYamanaka, Shoichiro, Naoki Kawahara, Ryuji Kawaguchi, Keita Waki, Tomoka Maehana, Yosuke Fukui, Ryuta Miyake, Yuki Yamada, Hiroshi Kobayashi, and Fuminori Kimura. 2022. "The Comparison of Three Predictive Indexes to Discriminate Malignant Ovarian Tumors from Benign Ovarian Endometrioma: The Characteristics and Efficacy" Diagnostics 12, no. 5: 1212. https://doi.org/10.3390/diagnostics12051212
APA StyleYamanaka, S., Kawahara, N., Kawaguchi, R., Waki, K., Maehana, T., Fukui, Y., Miyake, R., Yamada, Y., Kobayashi, H., & Kimura, F. (2022). The Comparison of Three Predictive Indexes to Discriminate Malignant Ovarian Tumors from Benign Ovarian Endometrioma: The Characteristics and Efficacy. Diagnostics, 12(5), 1212. https://doi.org/10.3390/diagnostics12051212