
An Ensemble of CNN Models for Parkinson’s Disease Detection Using DaTscan Images

 , ,
, ,  ,
,  and
and
Abstract
:1. Introduction
2. Related Work
3. Motivation and Overview
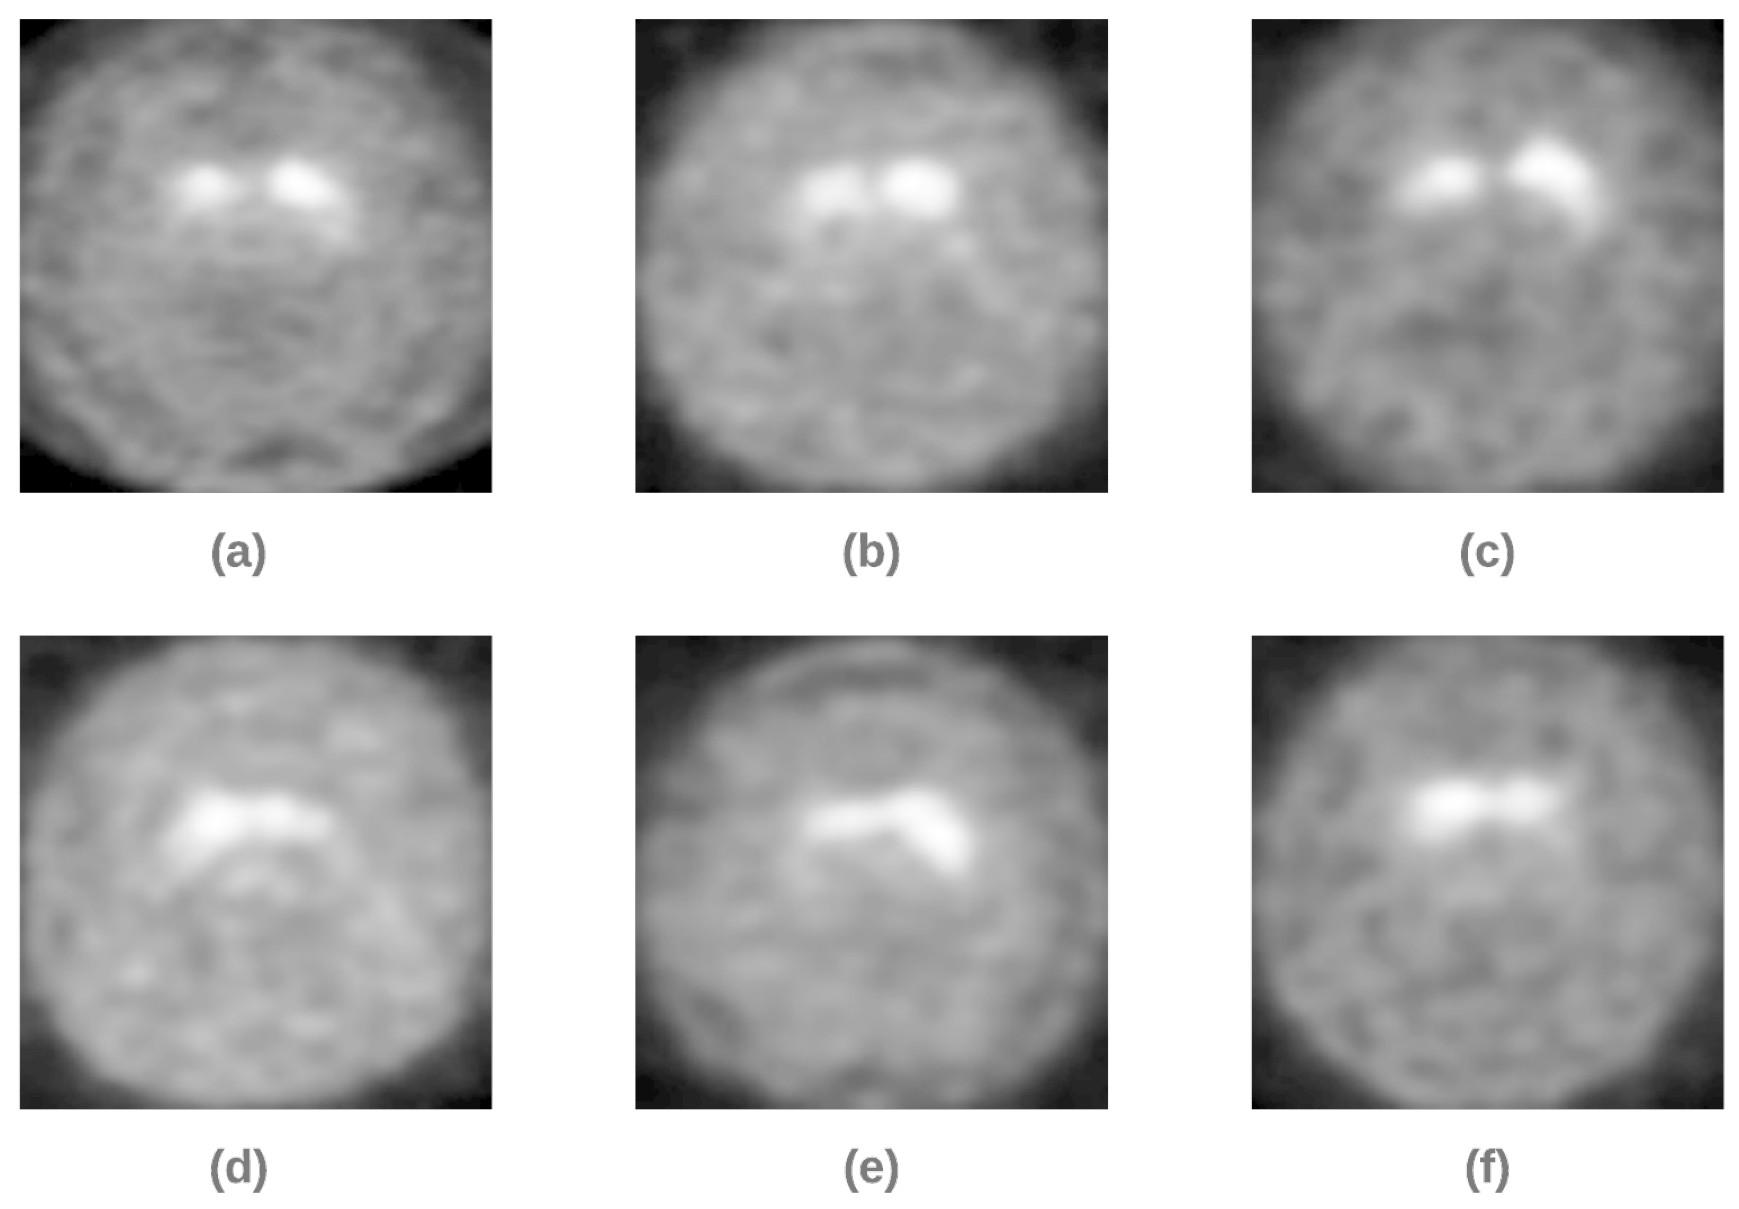
4. Dataset
4.1. Dataset Preparation
4.2. Dataset Splitting
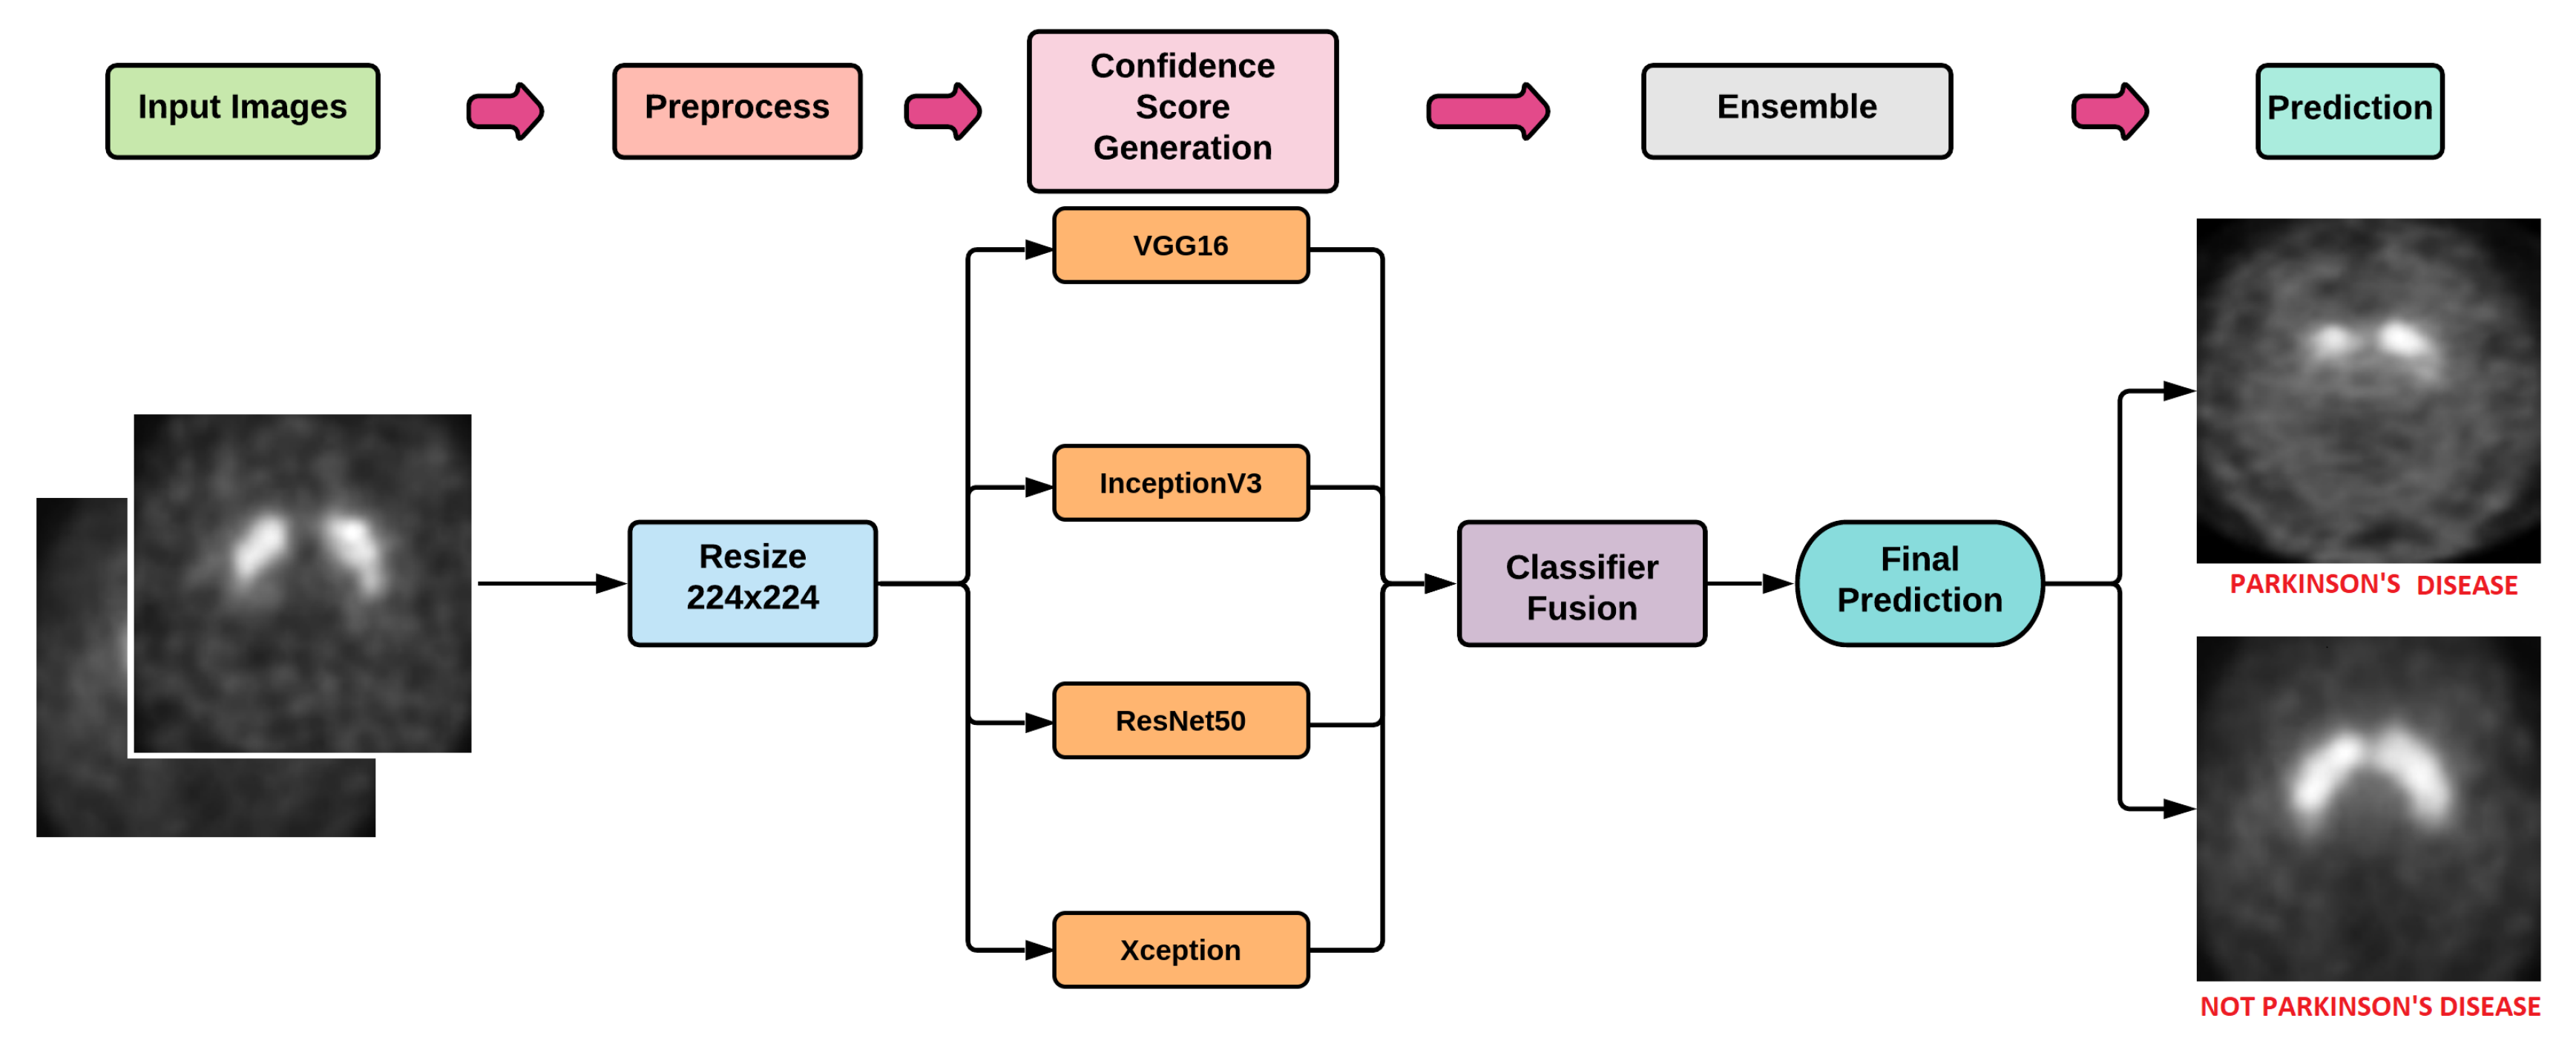
5. Proposed Methodology
5.1. DL Models
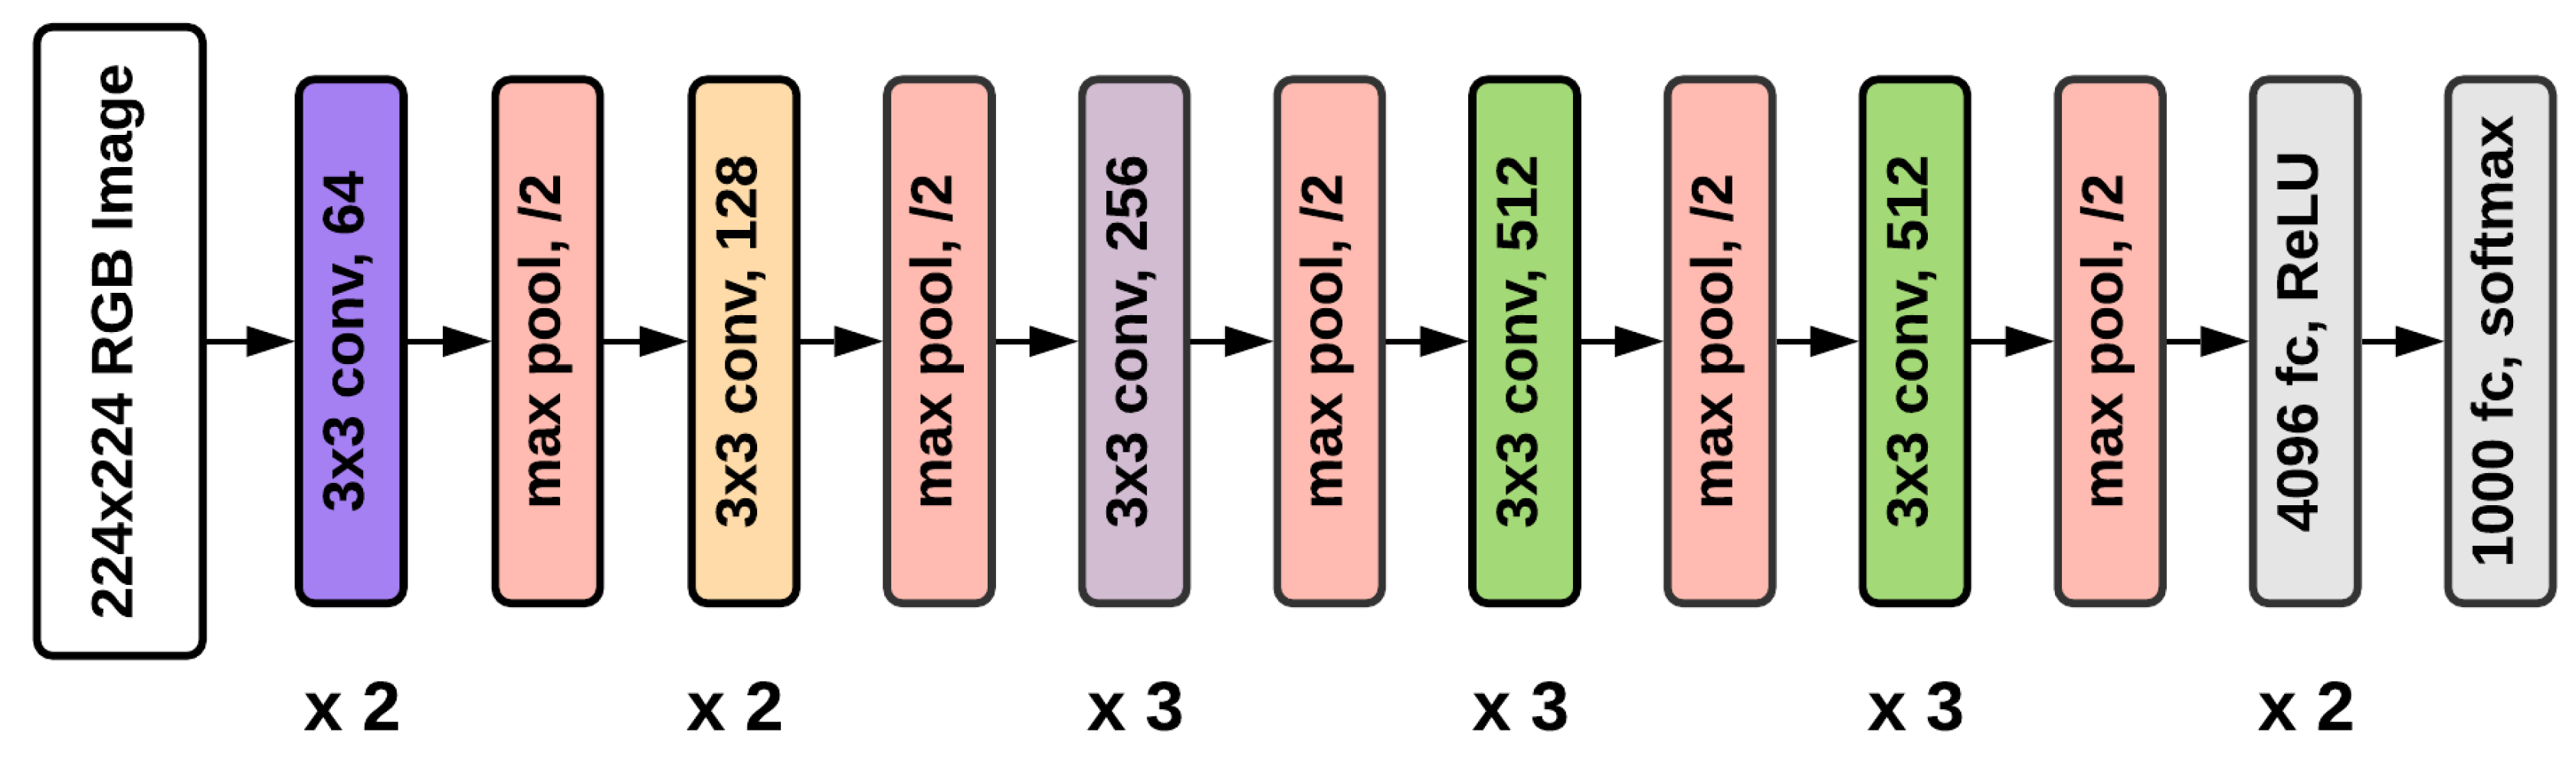
5.1.1. VGG16
5.1.2. ResNet50
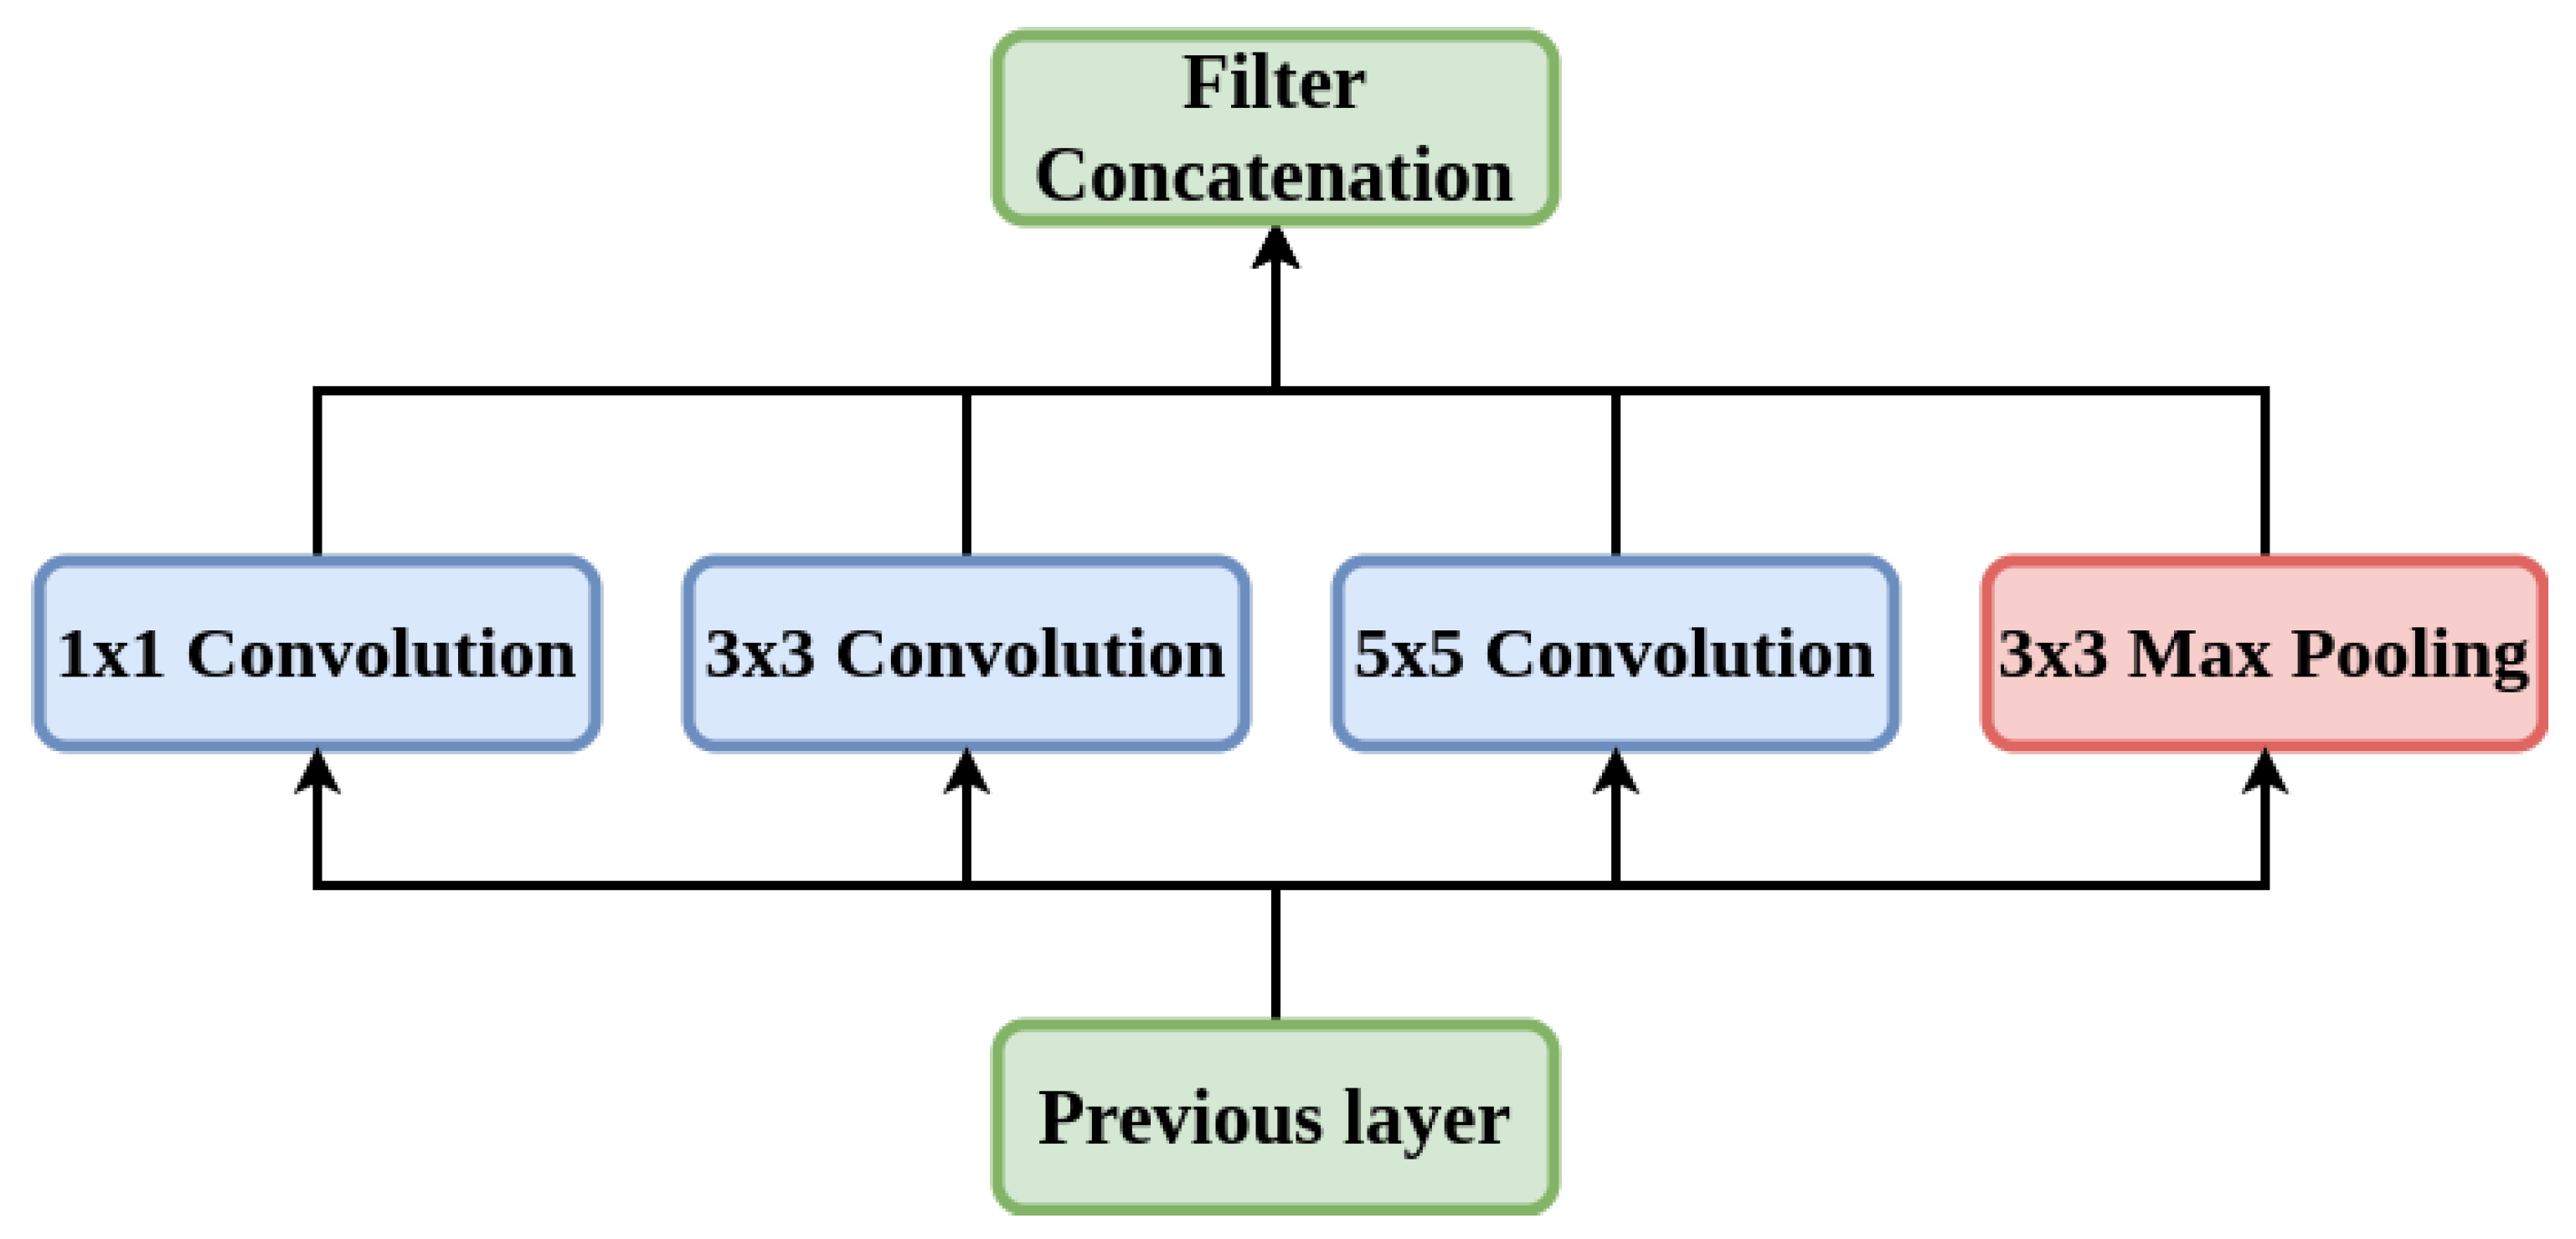
5.1.3. Inception-V3
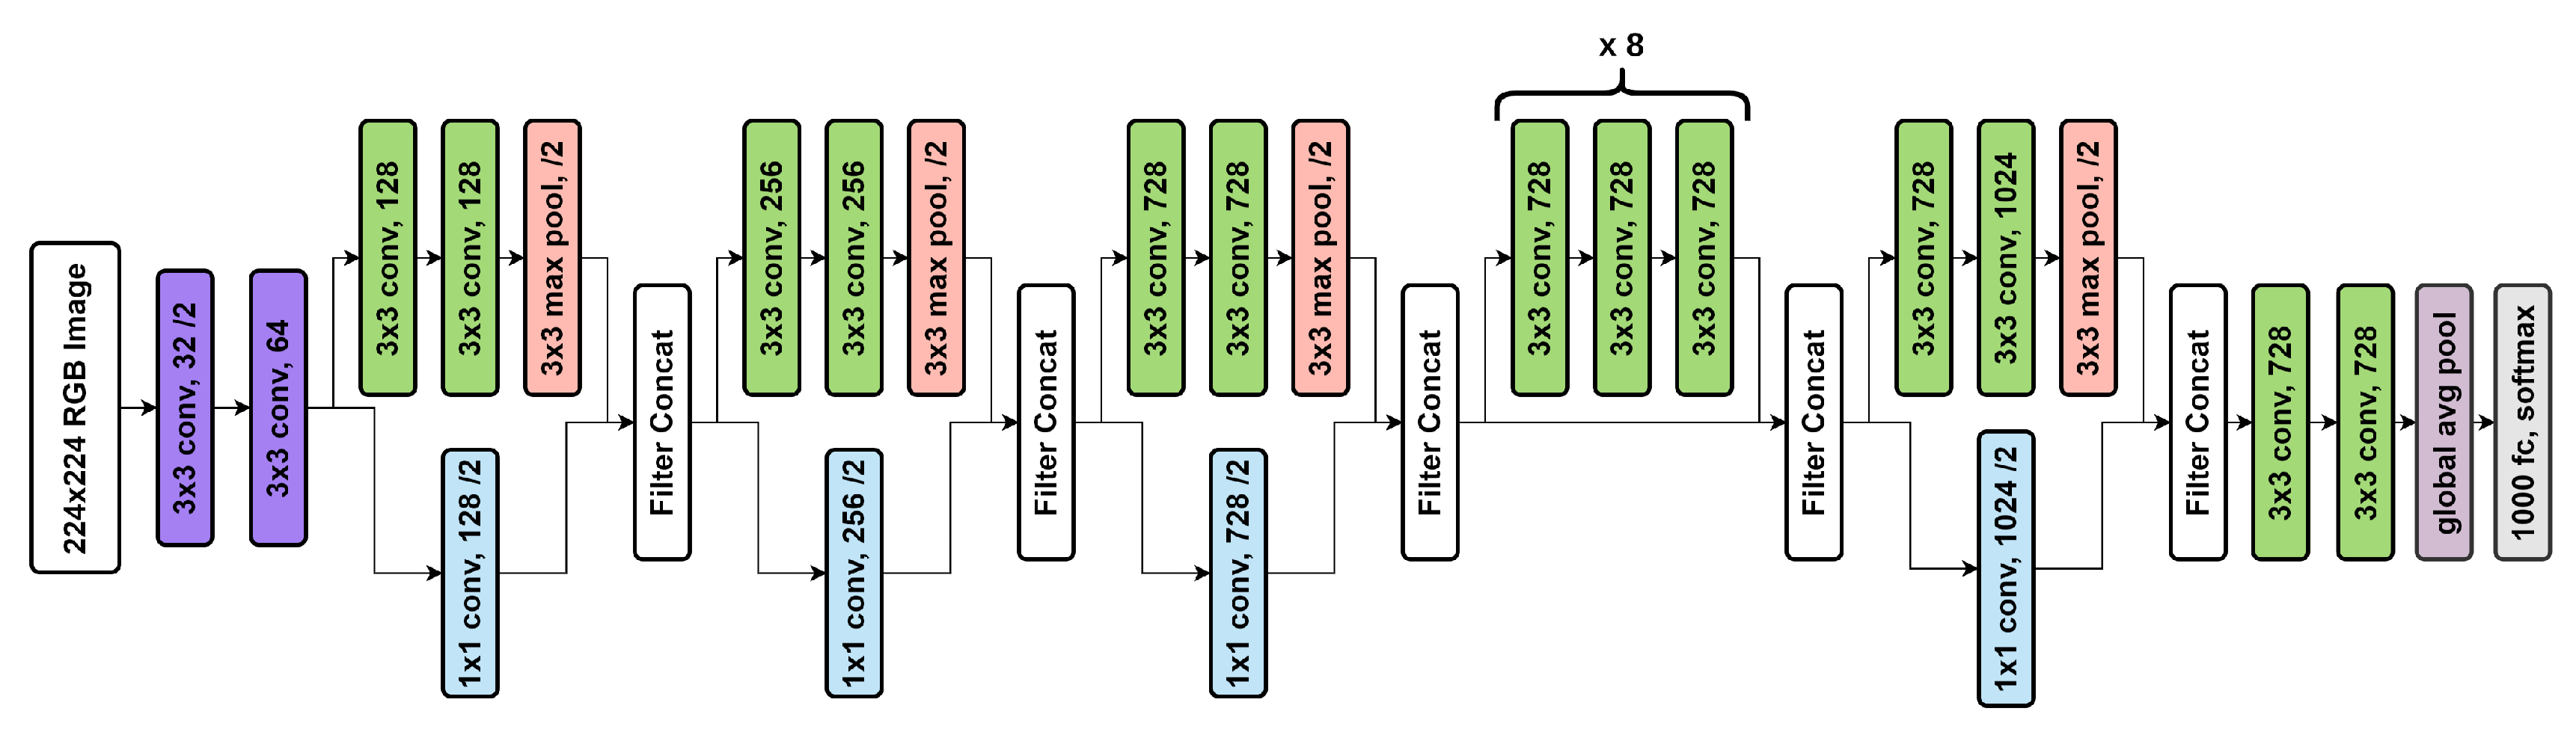
5.1.4. Xception
5.2. Ensemble Method
6. Results
- True Positives (TP): True positives are the case when the actual class of the data point was True (1) and the predicted class is also True (1).
- True Negative (TN): True negatives are the case when the actual class of the data point was False (0) and the predicted class is also False (0).
- False Positive (FP): False positives are the case when the actual class of the data point was False (1) and the predicted class is True (1).
- False Negative (FN): False negatives are the case when the actual class of the data point was True (1) and the predicted class is False (0).
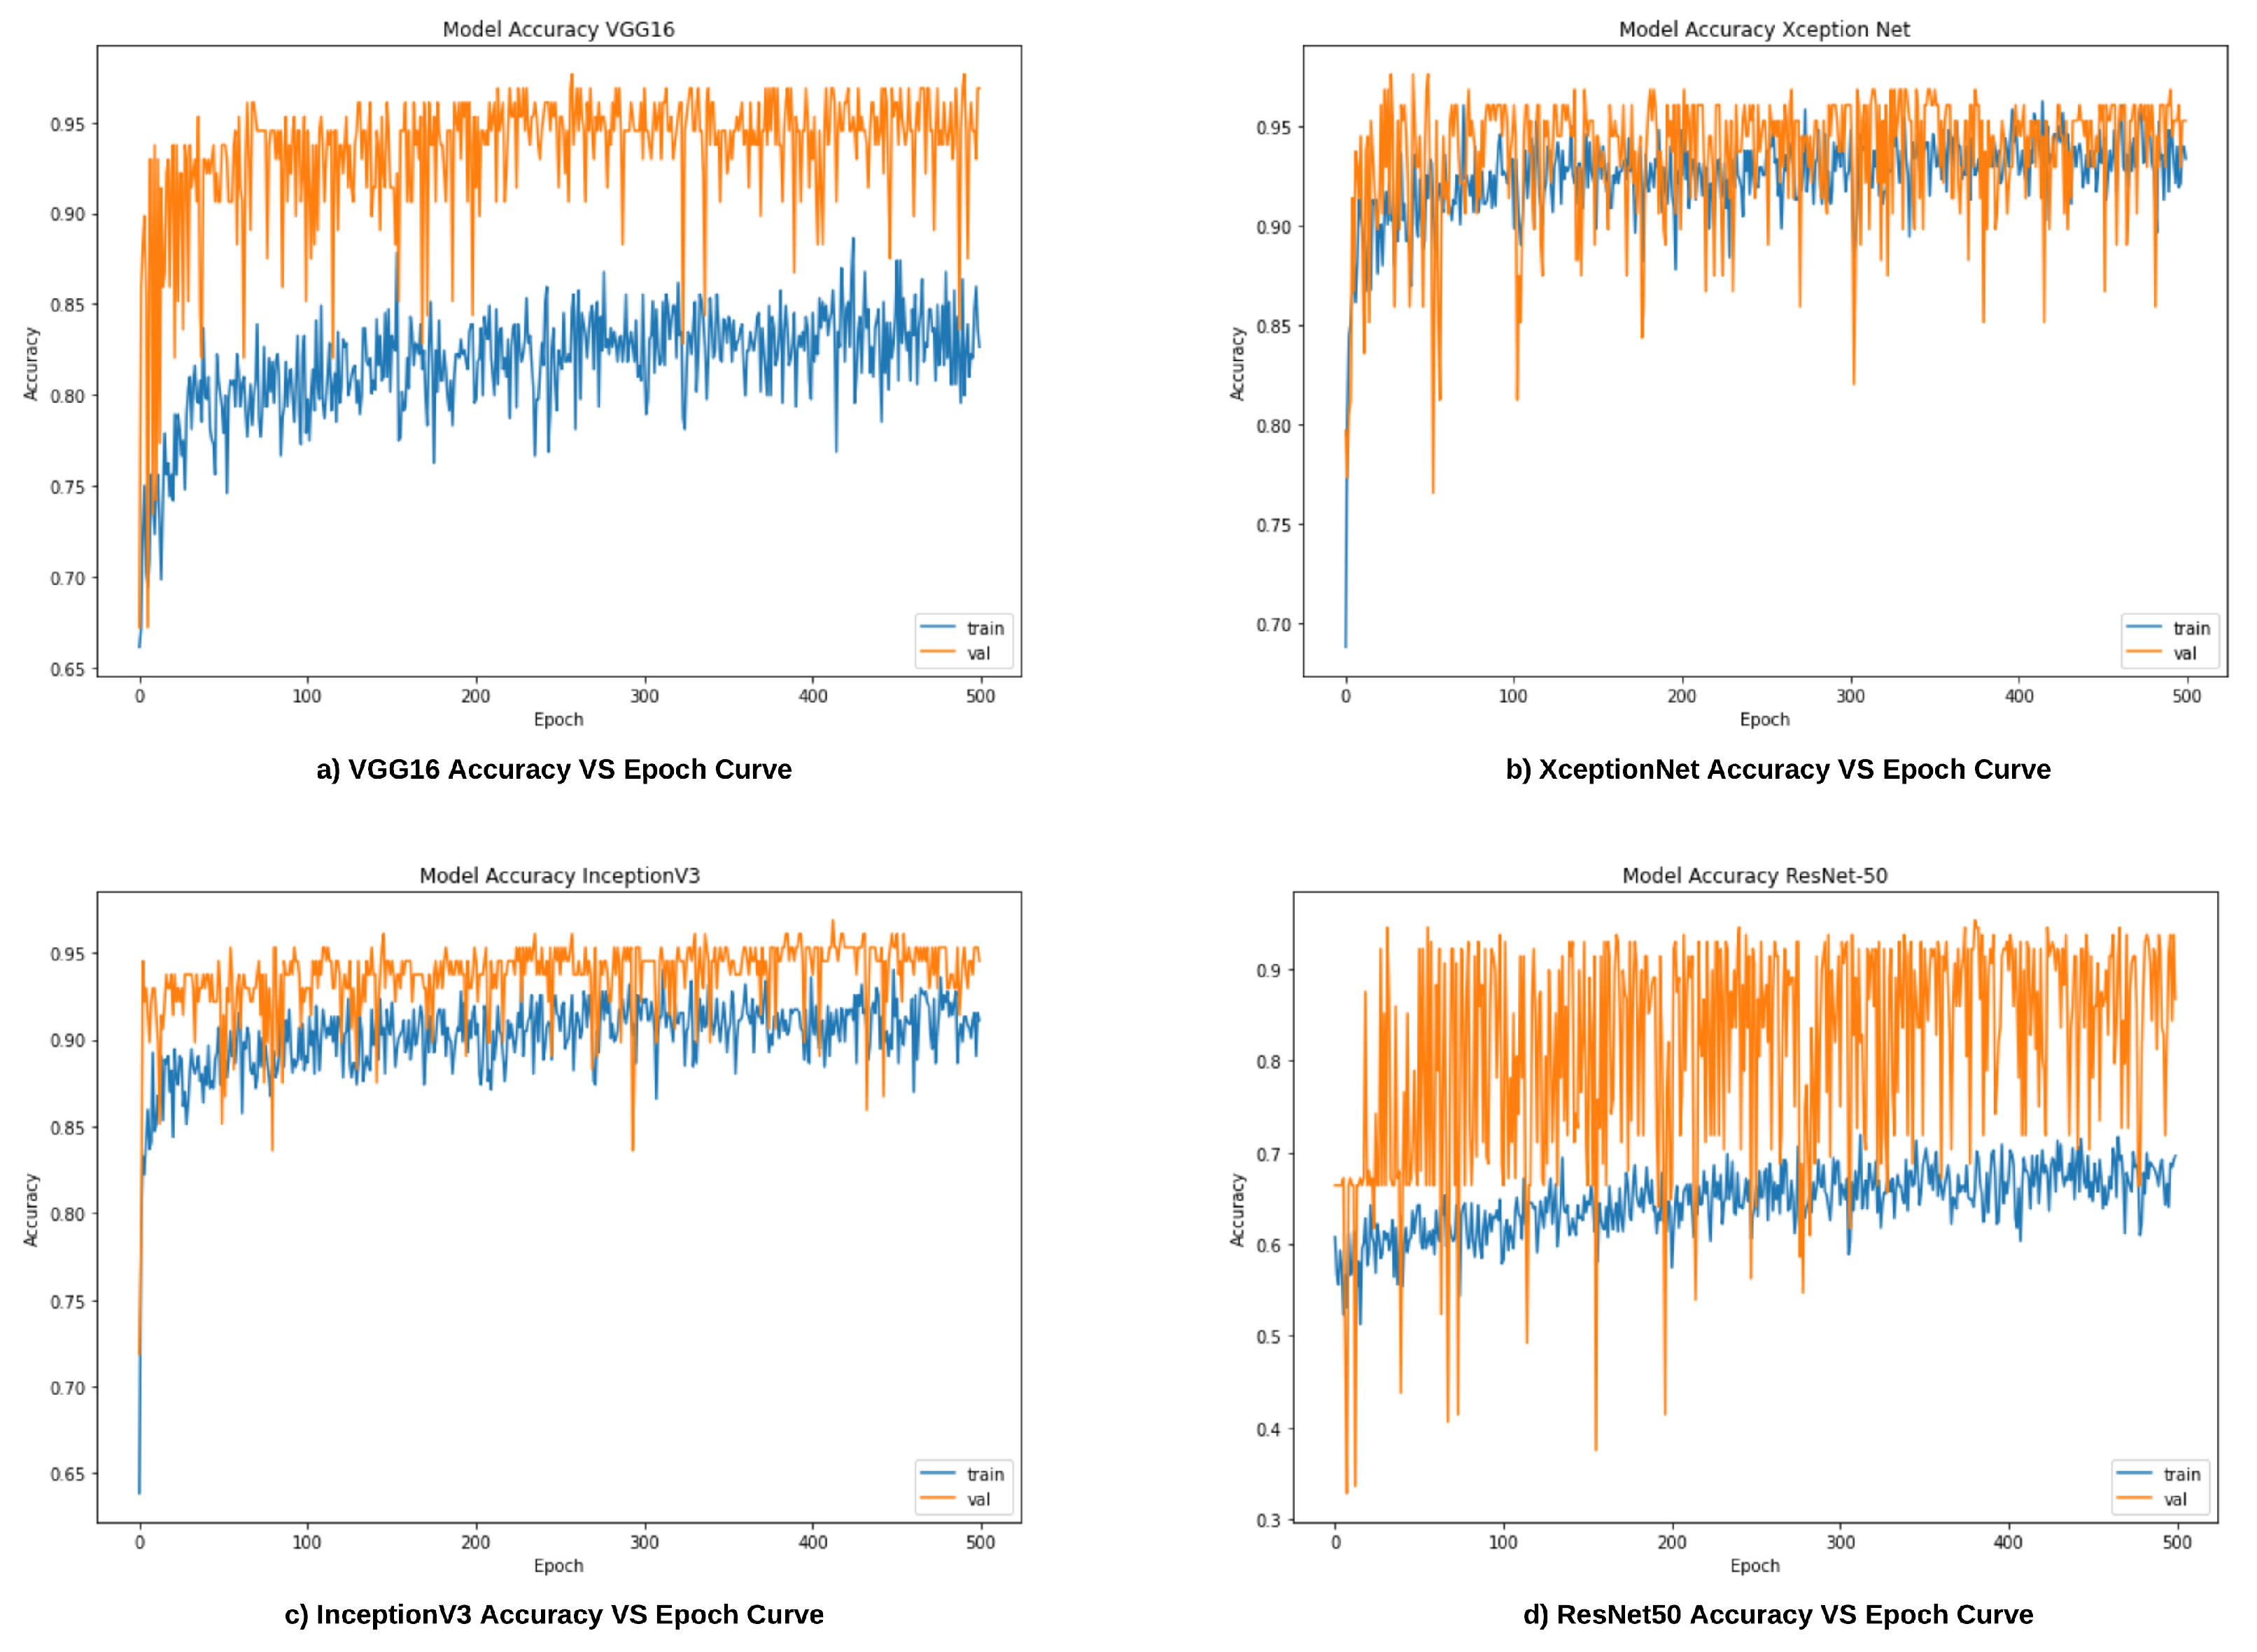
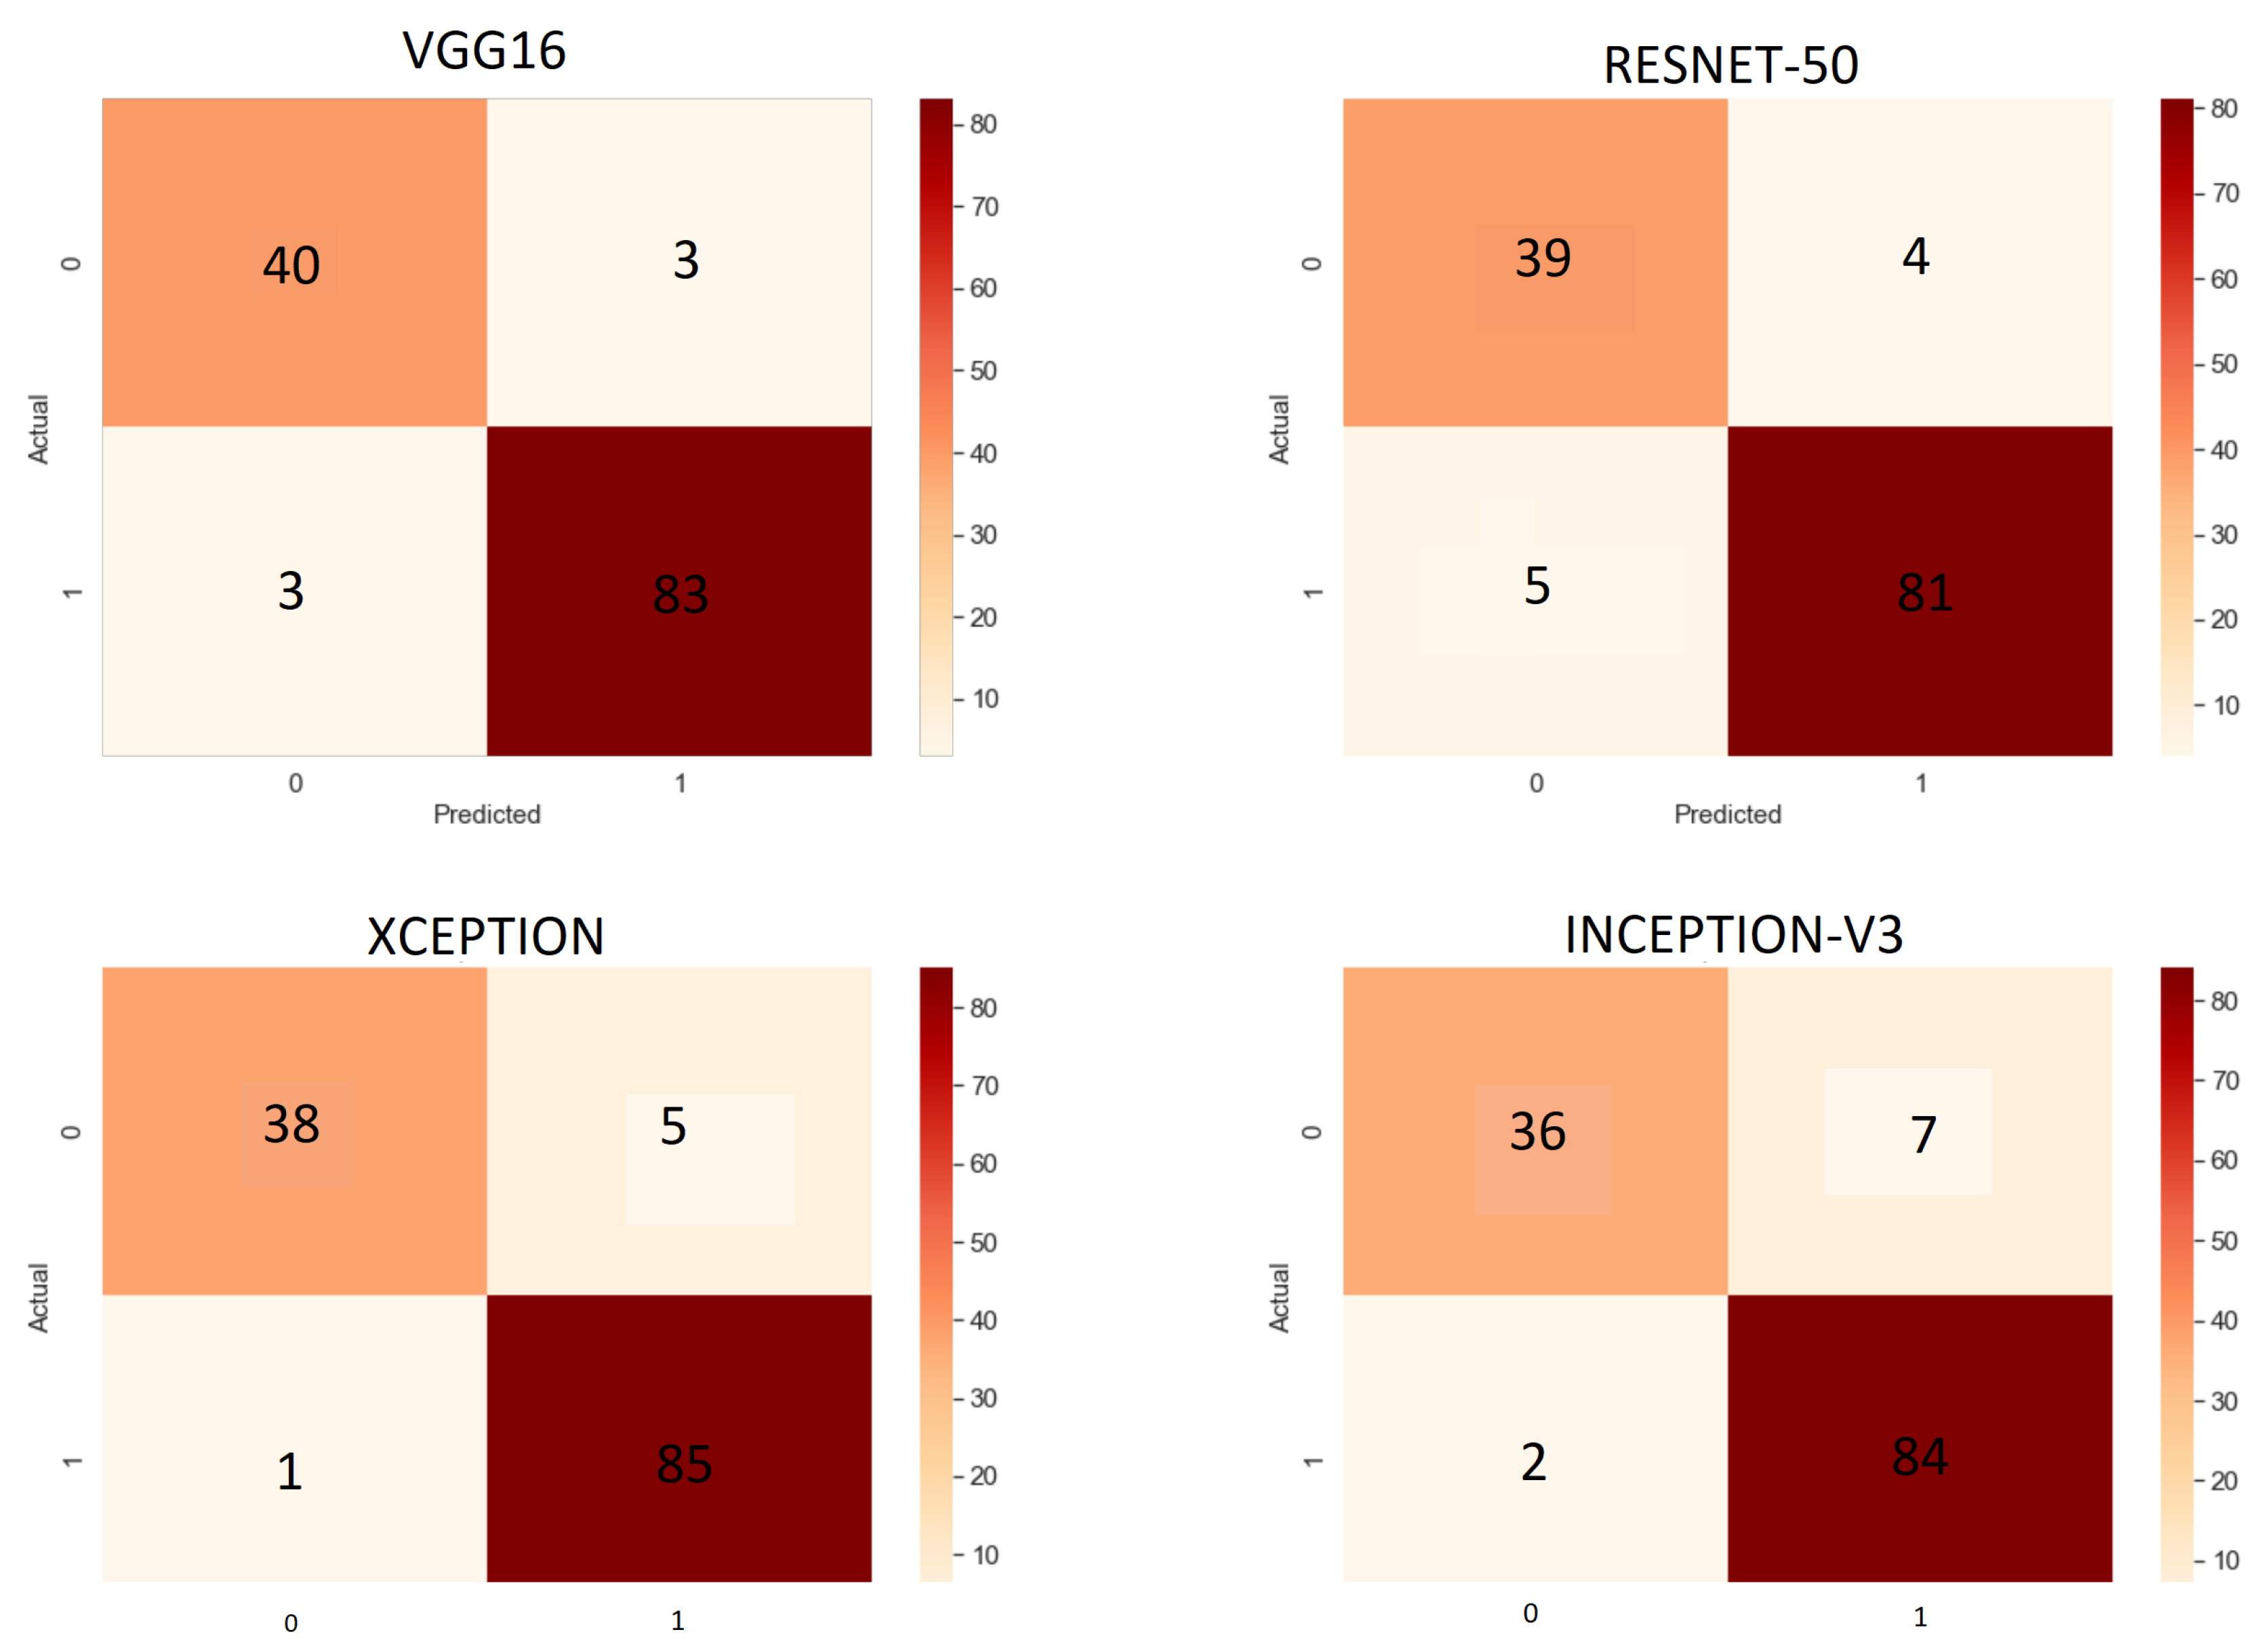
6.1. Results of Base Learners
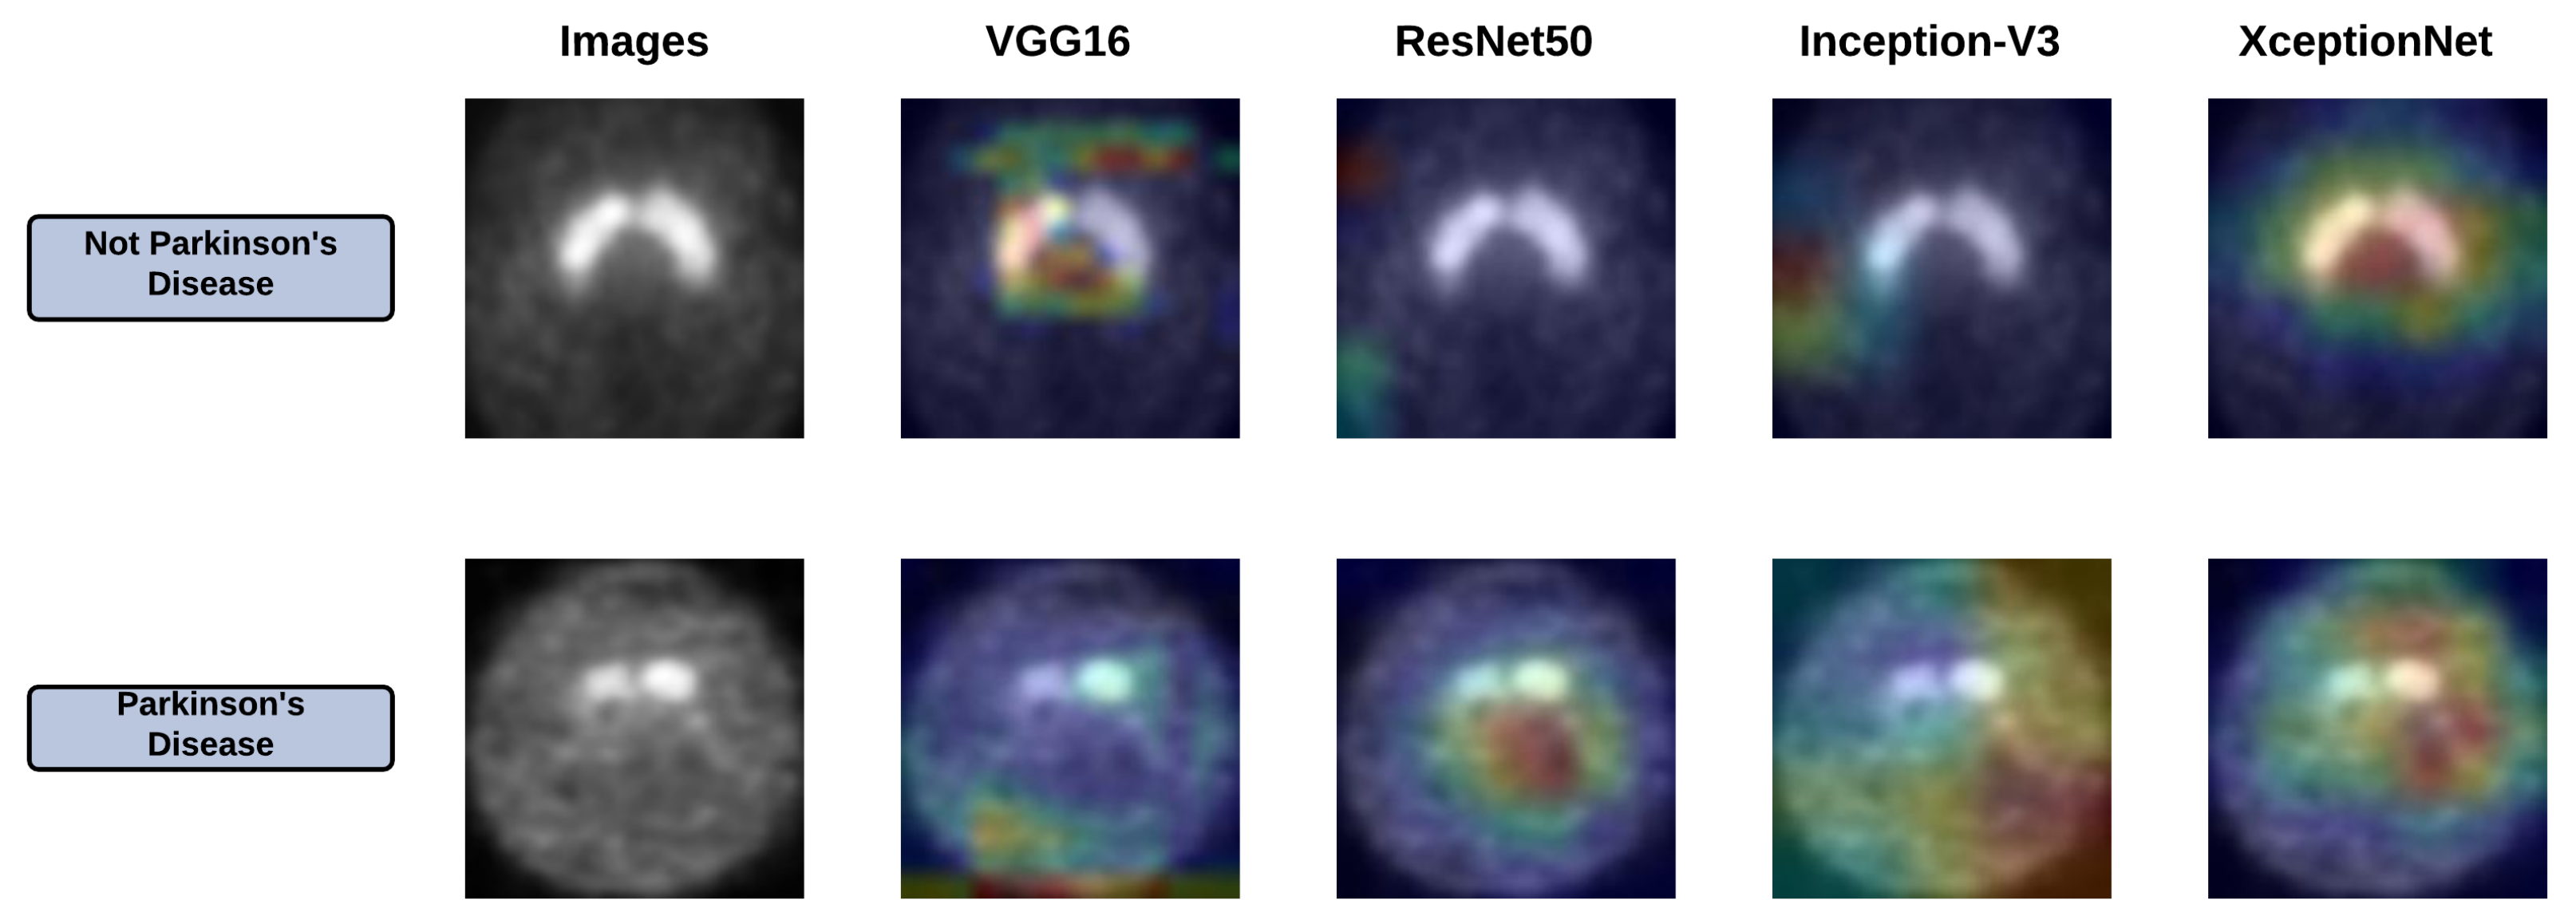
6.2. Grad-Cam Analysis of Base Learners
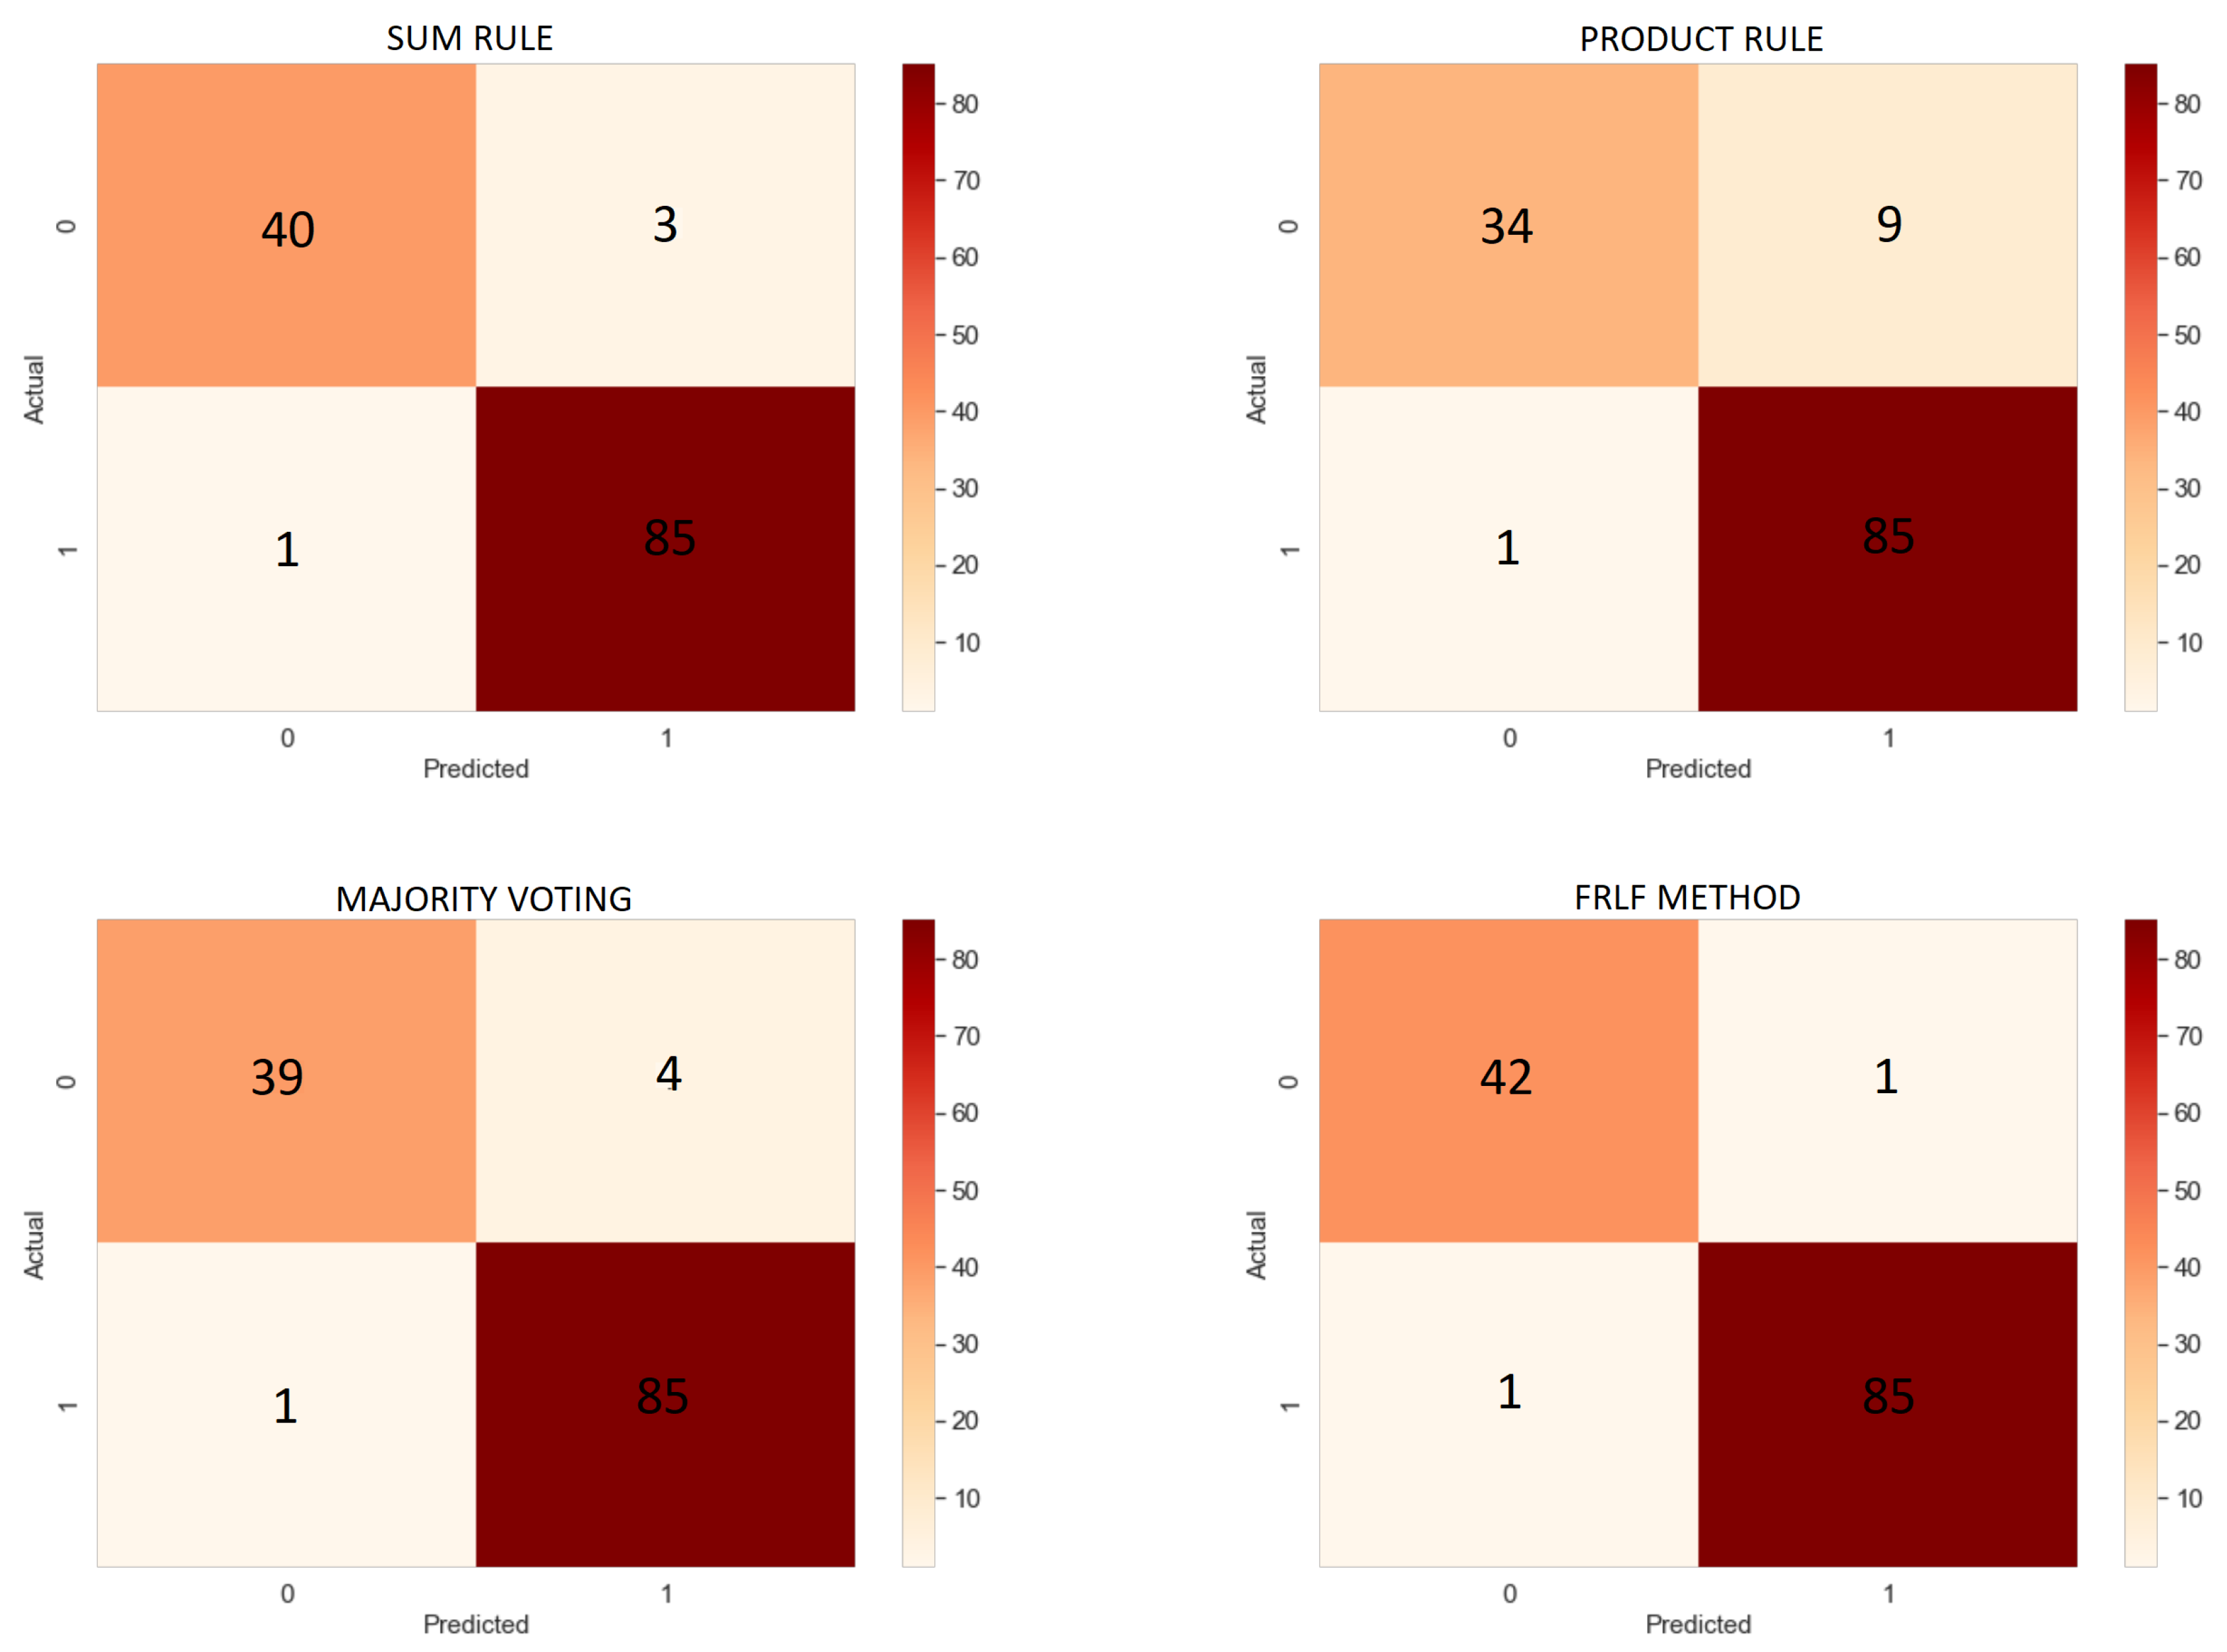
6.3. Results of Ensemble Approach
6.4. Comparison
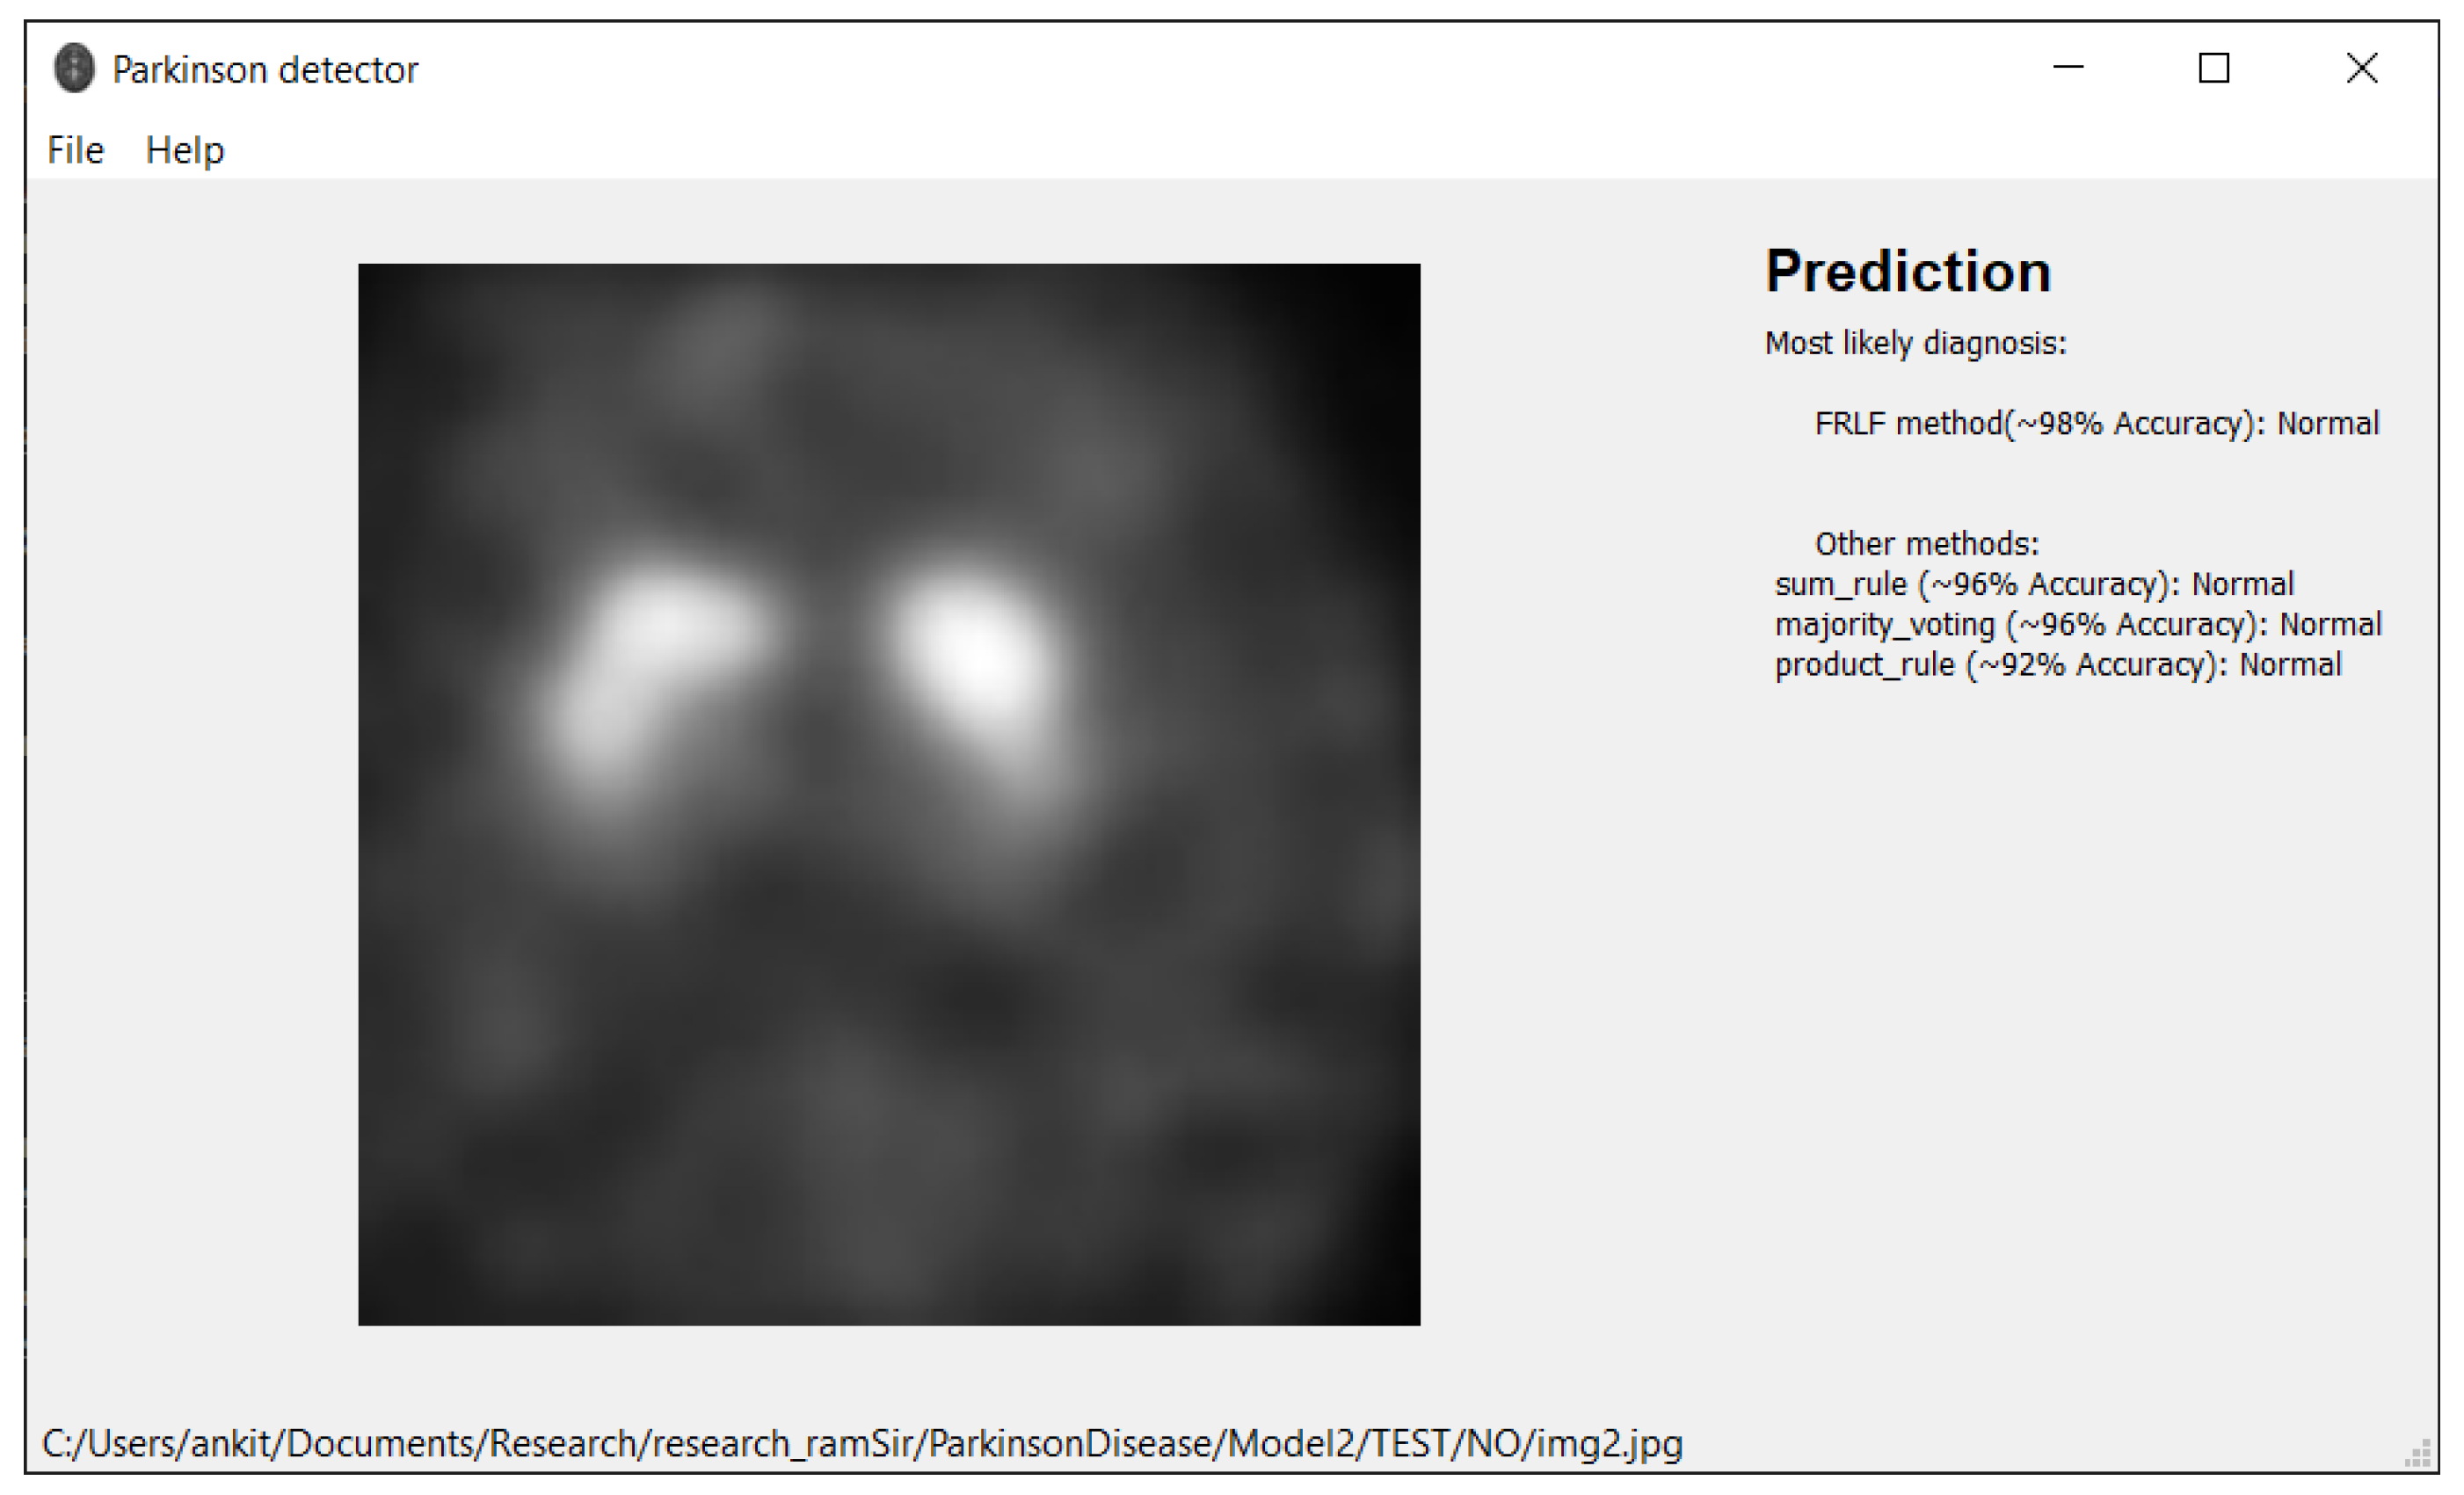
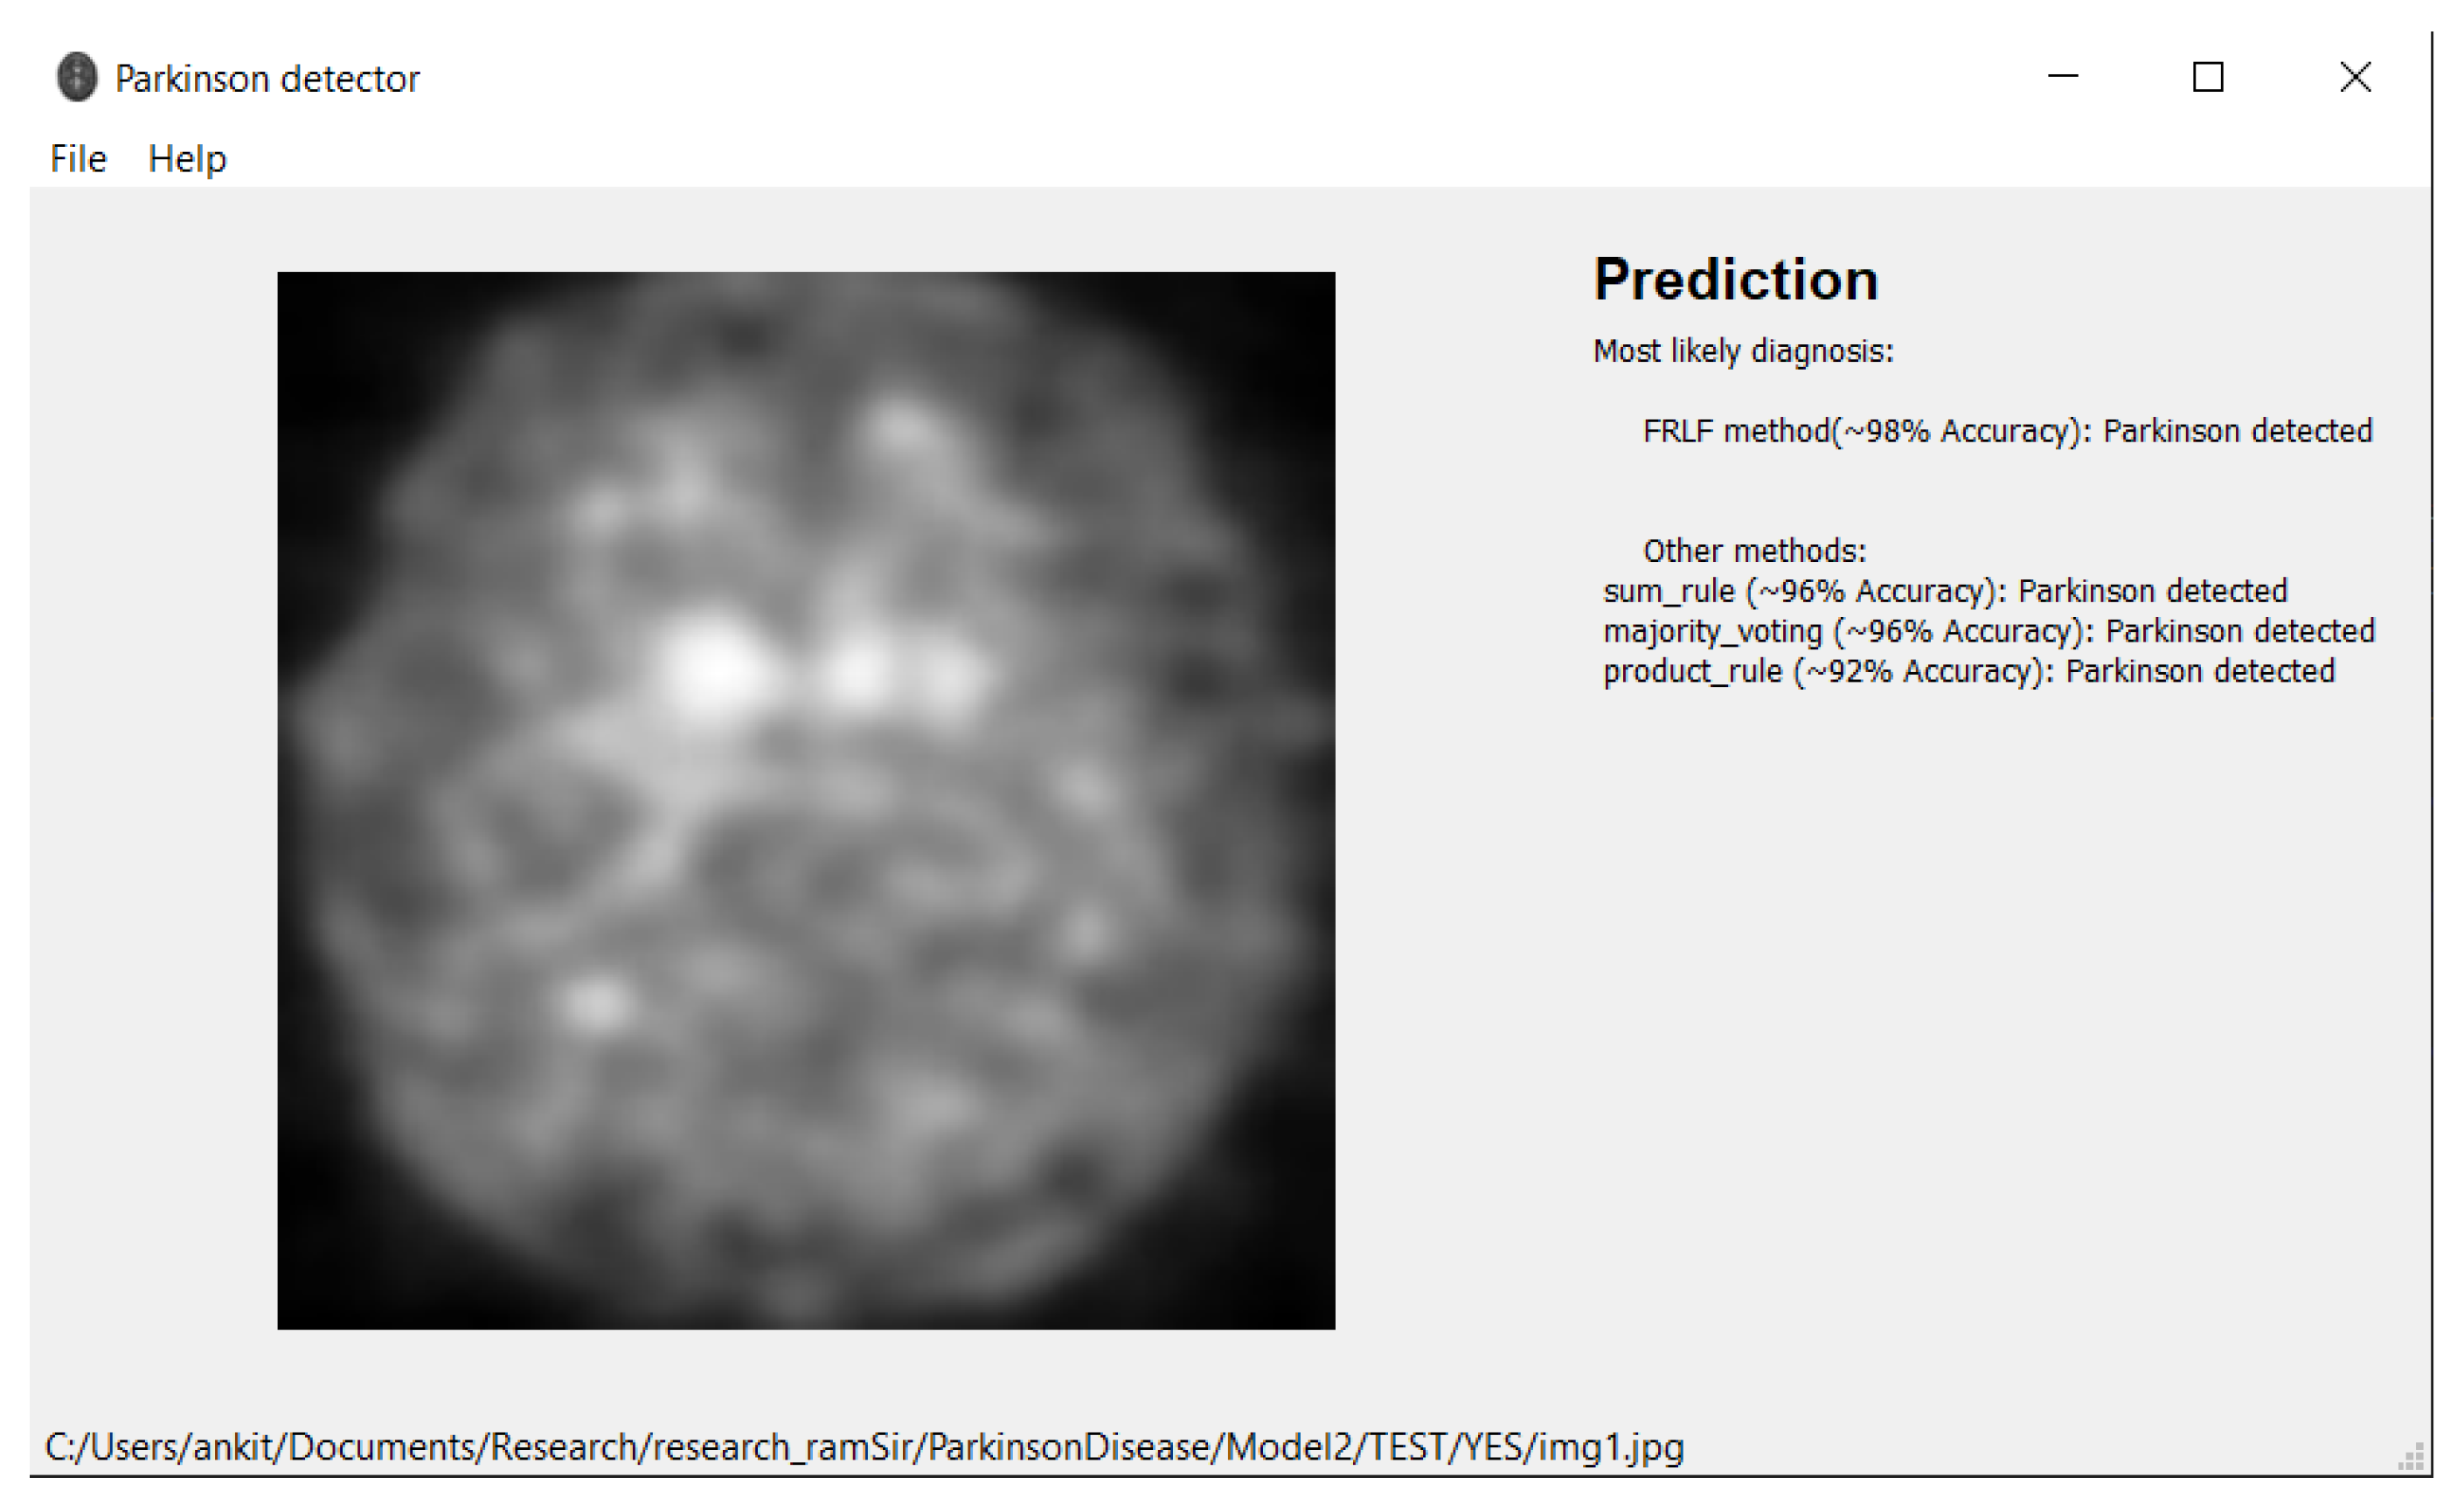
7. Software Tool
- Operating system:
- –
- Windows 7 or later
- –
- Ubuntu 16.04 or later
- –
- Mac OS 10.12.6 (Sierra) or later (64-bit) (no GPU support)
- Python 3.6 or later
- Hard Drive-Maximum 4GB of free space
- Processor-Intel Core i3
- Internet connection-wideband connection for first use (for neural networks downloading)
- Admin privileges are not a requirement.
8. Discussion
9. Conclusions
Author Contributions
Funding
Institutional Review Board Statement
Informed Consent Statement
Data Availability Statement
Conflicts of Interest
References
- Tysnes, O.; Storstein, A. Epidemiology of Parkinson’s disease. J. Neural. Transm. 2017, 124, 901–905. [Google Scholar] [CrossRef] [PubMed]
- What Causes Parkinson’s Disease. Available online: https://www.parkinson.org/Understanding-Parkinsons/Causes (accessed on 2 March 2019).
- Massano, J.; Bhatia, K.P. Clinical approach to parkinson’s disease: Features, diagnosis, and principles of management. Cold Spring Harb. Perspect Med. 2012, 2, a008870. [Google Scholar] [CrossRef] [PubMed]
- Zhang, A.; San-Segundo, R.; Panev, S.; Tabor, G.; Stebbins, K.; Whitford, A.S.; De la Torre, F.; Hodgins, J.K. Automated tremor detection in parkinson’s disease using accelerometer signals. In Proceedings of the IEEE/ACM International Conference on Connected Health: Applications, Systems and Engineering Technologies, Washington, DC, USA, 26–28 September 2018; pp. 13–14. [Google Scholar] [CrossRef] [Green Version]
- Cai, Z.; Gu, J.; Wen, C.; Zhao, D.; Huang, C.; Huang, H.; Tong, C.; Li, J.; Chen, H. An intelligent parkinson’s disease diagnostic system based on a chaotic bacterial foraging optimization enhanced fuzzy knn approach. Comput. Math. Methods Med. 2018, 2018, 2396952. [Google Scholar] [CrossRef]
- Tagaris, A.; Kollias, D.; Stafylopatis, A. Assessment of parkinson’s disease based on deep neural networks. In Proceedings of the International Conference on Engineering Applications of Neural Networks, Crete, Greece, 5–7 June 2017; Volume 744, pp. 391–403. [Google Scholar] [CrossRef]
- Parkinson’s Progression Markers Initiative. Available online: https://www.ppmi-info.org/ (accessed on 2 March 2019).
- Abós, A.; Baggio, H.; Segura, B.; García-Díaz, A.I.; Compta, Y.; Martí, M.J.; Junqué, F.V.; Junqué, C. Discriminating cognitive status in Parkinson’s disease through functional connectomics and machine learning. Sci. Rep. 2017, 7, 45347. [Google Scholar] [CrossRef] [PubMed]
- Amoroso, N.; Rocca, M.L.; Monaco, A.; Bellotti, R.; Tangaro, S. Complex networks reveal early MRI markers of Parkinson’s disease. Med. Image Anal. 2018, 48, 12–24. [Google Scholar] [CrossRef] [PubMed]
- Lei, H.; Zhao, Y.; Wen, Y.; Luo, Q.; Cai, Y.; Liu, G.; Lei, B. Sparse feature learning for multi-class Parkinson’s disease classification. Technol. Health Care 2018, 26, 193–203. [Google Scholar] [CrossRef] [Green Version]
- Salvatore, C.; Cerasa, A.; Castiglioni, I.; Gallivanone, F.; Augimeri, A.; Lopez, M.; Arabia, G.; Morelli, M.; Gilardi, M.C.; Quattrone, A. Machine learning on brain MRI data for differential diagnosis of Parkinson’s disease and Progressive Supranuclear Palsy. J. Neurosci. Methods 2014, 222, 230–237. [Google Scholar] [CrossRef]
- Prashanth, R.; Roy, S.D.; Mandal, P.K.; Ghosh, S. High-Accuracy Classification of Parkinson’s Disease Through Shape Analysis and Surface Fitting in 123I-Ioflupane SPECT Imaging. IEEE J. Biomed. Health Inform. 2017, 21, 794–802. [Google Scholar] [CrossRef] [Green Version]
- Brahim, A.; Khedher, L.; Górriz, J.M.; Ramírez, J.; Toumi, H.; Lespessailles, E.; Jennane, R.; El Hassouni, M. A proposed computer-aided diagnosis system for parkinson’s disease classification using 123i-fp-cit imaging. In Proceedings of the International Conference on Advanced Technologies for Signal and Image Processing (ATSIP), Fez, Morocco, 22–24 May 2017. [Google Scholar] [CrossRef]
- Rumman, M.; Tasneem, A.N.; Farzana, S.; Pavel, M.I.; Alam, M.A. Early detection of parkinson’s disease using image processing and artificial neural network. In Proceedings of the International Conference on Informatics, Electronics and Vision, Kitakyushu, Japan, 25–29 June 2018. [Google Scholar] [CrossRef] [Green Version]
- Sivaranjini, S.; Sujatha, C.M. Deep learning based diagnosis of pd using convolutional neural network. Multimed. Tools Appl. 2020, 79, 15467–15479. [Google Scholar] [CrossRef]
- Esmaeilzadeh, S.; Yang, Y.; Adeli, E. End-to-End Parkinson Disease Diagnosis using Brain MR-Images by 3D-CNN. arXiv 2018, arXiv:1806.05233. [Google Scholar]
- Shah, P.M.; Zeb, A.; Shafi, U.; Zaidi, S.F.A.; Shah, M.A. Detection of parkinson disease in brain mri using convolutional neural network. In Proceedings of the 24th International Conference on Automation and Computing (ICAC), Newcastle upon Tyne, UK, 6–7 September 2018. [Google Scholar] [CrossRef]
- Shinde, S.; Prasad, S.; Saboo, Y.; Kaushick, R.; Saini, J.; Pal, P.K.; Ingalhalikar, M. Predictive markers for Parkinson’s disease using deep neural nets on neuromelanin sensitive MRI. Neuroimage 2019, 22, 101748. [Google Scholar] [CrossRef] [PubMed]
- Magesh, P.R.; Myloth, R.D.; Tom, R.J. An explainable machine learning model for early detection of parkinson’s disease using lime on datscan imagery. Comput. Biol. Med. 2020, 126, 104041. [Google Scholar] [CrossRef] [PubMed]
- Quan, J.; Xu, L.; Xu, R.; Tong, T.; Su, J. DaTscan SPECT Image Classification for Parkinson’s Disease. arXiv 2019, arXiv:1909.04142. [Google Scholar]
- Ortiz, A.; Munilla, J.; Martínez-Ibañez, M.; Górriz, J.M.; Ramírez, J.; Salas-Gonzalez, D. Parkinson’s disease detection using isosurfacesbased features and convolutional neural networks. Front. Neuroinform. 2019, 13, 48. [Google Scholar] [CrossRef] [PubMed] [Green Version]
- Banerjee, A.; Singh, P.K.; Sarkar, R. Fuzzy integral based cnn classifier fusion for 3d skeleton action recognition. IEEE Trans. Circuits Syst. Video Technol. 2020, 31, 2206–2216. [Google Scholar] [CrossRef]
- Garain, A.; Singh, P.K.; Sarkar, R. Fuzzygcp: A deep learning architecture for automatic spoken language identification from speech signals. Expert Syst. Appl. 2021, 168, 114416. [Google Scholar] [CrossRef]
- Sarkar, S.S.; Ansari, M.S.; Mahanty, A.; Mali, K.; Sarkar, R. Microstructure image classification: A classifier combination approach using fuzzy integral measure. Integr. Mater Manuf. Innov. 2021, 10, 286–298. [Google Scholar] [CrossRef]
- Kundu, R.; Singh, P.K.; Mirjalili, S.; Sarkar, R. COVID-19 detection from lung CT-Scans using a fuzzy integral-based CNN ensemble. Comput. Biol. Med. 2021, 138, 104895. [Google Scholar] [CrossRef]
- Ghosal, S.; Sarkar, M.; Sarkar, R. NoFED-Net: Non-Linear Fuzzy Ensemble of Deep Neural Networks for Human Activity Recognition. IEEE Internet Things J. 2022. [Google Scholar] [CrossRef]
- Bhowal, P.; Sen, S.; Velasquez, J.D.; Sarkar, R. Fuzzy ensemble of deep learning models using choquet fuzzy integral, coalition game and information theory for breast cancer histology classification. Expert Syst. Appl. 2022, 190, 116167. [Google Scholar] [CrossRef]
- Ganguly, S.; Bhowal, P.; Oliva, D.; Sarkar, R. BLeafNet: A Bonferroni mean operator based fusion of CNN models for plant identification using leaf image classification. Ecol. Inform. 2022, 69, 101585. [Google Scholar] [CrossRef]
- Pramanik, R.; Biswas, M.; Sen, S.; de Souza, A.; Júnior, L.; Paulo Papa, J.; Sarkar, R. A Fuzzy Distance-based Ensemble of Deep Models for Cervical Cancer Detection. Comput. Methods Programs Biomed. 2022, 219, 106776. [Google Scholar] [CrossRef] [PubMed]
- Paul, A.; Pramanik, R.; Malakar, S.; Sarkar, R. An ensemble of deep transfer learning models for handwritten music symbol recognition. Neural Comput. Appl. 2021, 1–19. [Google Scholar] [CrossRef]
- Gök, M. An ensemble of k-nearest neighbours algorithm for detection of parkinson’s disease. Int. J. Syst. Sci. 2013, 46, 1108–1112. [Google Scholar] [CrossRef]
- Castillo-Barnes, D.; Ramírez, J.; Segovia, F.; Martínez-Murcia, F.; Salas-Gonzalez, D.; Górriz, J. Robust ensemble classification methodology for i123-ioflupane spect images and multiple heterogeneous biomarkers in the diagnosis of parkinson’s disease. Front. Neuroinformatics 2018, 12, 53. [Google Scholar] [CrossRef] [Green Version]
- Sharma, P.; Sundaram, S.; Sharma, M.; Sharma, A.; Gupta, D. Diagnosis of Parkinson’s disease using modified grey wolf optimization. Cogn. Syst. Res. 2018, 54, 100–115. [Google Scholar] [CrossRef]
- Gupta, D.; Julka, A.; Jain, S.; Aggarwal, T.; Khanna, A.; Arunkumar, N.; de Albuquerque, V.H.C. Optimized cuttlefish algorithm for diagnosis of Parkinson’s disease. Cogn. Syst. Res. 2018, 52, 36–48. [Google Scholar] [CrossRef]
- Sharma, V.; Kaur, S.; Kumar, J.; Singh, A.K. A Fast Parkinson’s Disease Prediction Technique using PCA and Artificial Neural Network. In Proceedings of the 2019 International Conference on Intelligent Computing and Control Systems (ICCS), Madurai, India, 15–17 May 2019; pp. 1491–1496. [Google Scholar] [CrossRef]
- Rana, B.; Juneja, A.; Saxena, M.; Gudwani, S.; Kumaran, S.S.; Agrawal, R.K.; Behari, M. Regions-of-interest based automated diagnosis of Parkinson’s disease using T1-weighted MRI. Expert Syst. Appl. 2015, 42, 4506–4516. [Google Scholar] [CrossRef]
- Adams, M.P.; Rahmim, A.; Tang, J. Improved motor outcome prediction in Parkinson’s disease applying deep learning to DaTscan SPECT images. Comput. Biol. Med. 2021, 132, 104312. [Google Scholar] [CrossRef]
- Leung, K.H.; Rowe, S.P.; Pomper, M.G.; Du, Y. A three-stage, deep learning, ensemble approach for prognosis in patients with Parkinson’s disease. EJNMMI Res. 2021, 11, 52. [Google Scholar] [CrossRef]
- Simonyan, K.; Zisserman, A. Very deep convolutional networks for large-scale image recognition. arXiv 2014, arXiv:1409.1556. [Google Scholar]
- Chollet, F. Xception: Deep Learning with Depthwise Separable Convolutions. In Proceedings of the 2017 IEEE Conference on Computer Vision and Pattern Recognition (CVPR), Honolulu, HI, USA, 21–26 July 2017. [Google Scholar] [CrossRef] [Green Version]
- He, K.; Zhang, X.; Ren, S.; Sun, J. Deep residual learning for image recognition. In Proceedings of the 2016 IEEE Conference on Computer Vision and Pattern Recognition (CVPR), Las Vegas, NV, USA, 27–30 June 2016. [Google Scholar] [CrossRef] [Green Version]
- Szegedy, C.; Vanhoucke, V.; Ioffe, S.; Shlens, J.; Wojna, Z. Rethinking the inception architecture for computer vision. arXiv 2015, arXiv:1512.00567. [Google Scholar]
- Kingma, D.P.; Ba, J. Adam: A method for stochastic optimization. arXiv 2014, arXiv:1412.6980. [Google Scholar]
- Sing, J.K.; Dey, A.; Ghosh, M. Confidence factor weighted gaussian function induced parallel fuzzy rank-level fusion for inference and its application to face recognition. Inf. Fusion 2019, 47, 60–71. [Google Scholar] [CrossRef]
- Selvaraju, R.R.; Cogswell, M.; Das, A.; Vedantam, R.; Parikh, D.; Batra, D. Grad-cam: Visual explanations from deep networks via gradientbased localization. In Proceedings of the IEEE International Conference on Computer Vision 2017, Venice, Italy, 2–29 October 2017; pp. 618–626. [Google Scholar] [CrossRef]
- De, R.; Chakraborty, A.; Chatterjee, A.; Sarkar, R. A weighted ensemble-based active learning model to label microarray data. Med. Biol. Eng. Comput. 2020, 58, 2427–2441. [Google Scholar] [CrossRef]
- Mohandes, M.; Deriche, M.; Aliyu, S.O. Classifiers combination techniques: A comprehensive review. IEEE Access 2018, 6, 19626–19639. [Google Scholar] [CrossRef]
- Long, D.; Wang, J.; Xuan, M.; Gu, Q.; Xu, X.; Kong, D.; Zhang, M. Automatic classification of early pd with multi-modal mr imaging. PLoS ONE 2012, 7, e47714. [Google Scholar] [CrossRef] [Green Version]
- Available online: https://gitlab.com/digiratory/biomedimaging/parkinson-detector (accessed on 17 June 2021).


| Work Ref. | Dataset | Method/Classifier | Accuracy | Sensitivity | Specificity |
|---|---|---|---|---|---|
| [8] | Custom | SVM on rsfMRI | 86.96% | 78.95% | 92.59% |
| [9] | PPMI | SVM | 93% | 93% | 92% |
| [10] | PPMI | Sparse feature selection model | 80% | 84.70 ± 19.29% | - |
| [11] | PPMI | PCA followed by SVM | >90% | >90% | >90% |
| [12] | PPMI | SVM with striatal binding ratio | 96.14% | 95.74% | 77.35% |
| [13] | PPMI | SVM | 92.6% | 91.2% | 93.1% |
| [14] | PPMI | ANN | 94% | 100% | 88% |
| [15] | PPMI | AlexNet | 88.9% | - | - |
| [18] | Custom | CNN | 85% | - | - |
| [19] | PPMI | VGG-16 | 95.2% | - | 90.9% |
| [20] | PPMI | InceptionV3 | 98.4% | 98.8% | 97.6% |
| [21] | PPMI | AlexNet and LeNet | 95±0.3% | - | - |
| [31] | PD dataset | KNN | 98.46% | - | - |
| [32] | PPMI | SVM with linear kernel classifiers | 96% | - | - |
| [33] | Custom | Modified Grey Wolf Optimization | 94.83% | - | - |
| [34] | Custom | Optimized cuttlefish algorithm | 94% | - | - |
| [35] | PPMI | PCA and ANN | 97% | - | - |
| [36] | Custom | ROI based diagnosis | 86.67% | - | - |
| Category | PD | Non-PD | Total |
|---|---|---|---|
| Train | 346 | 170 | 516 |
| Test | 86 | 43 | 129 |
| Model | Accuracy | Precision | Sensitivity | Specificity | F1-Score |
|---|---|---|---|---|---|
| VGG16 | 95.34% | 96.51% | 96.51% | 93.02% | 96.51% |
| ResNet 50 | 93.02% | 95.29% | 94.19% | 90.69% | 94.74% |
| Inception-V3 | 93.02% | 92.31% | 97.67% | 83.72% | 94.81% |
| Xception | 95.34% | 94.44% | 98.84% | 88.37% | 96.59% |
| Model | Accuracy (in %) | Precision | Sensitivity | Specificity | F1-Score |
|---|---|---|---|---|---|
| Sum Rule | 96.89% | 96.59% | 98.84% | 93.02% | 97.70% |
| Product Rule | 92.25% | 90.42% | 98.84% | 79.07% | 94.44% |
| Majority Voting | 96.12% | 95.5% | 98.84% | 90.69% | 97.59% |
| FRLFmethod | 98.45% | 98.84% | 98.84% | 97.67% | 98.84% |
| Work Ref. | Method/Classifier | Accuracy | Dataset Used |
|---|---|---|---|
| [12] | SVM with Striatal Binding Ratio | 96.14% | PPMI |
| [13] | PCA with SVM | 92.60% | PPMI |
| [14] | Custom ANN | 94.00% | PPMI |
| [19] | VGG-16 | 95.20% | PPMI |
| [20] | InceptionV3 | 98.40% | PPMI |
| [21] | LeNet and AlexNet | 95% ± 0.30% | PPMI |
| [48] | t-test and SVM | 86.96% | PPMI |
| Proposed | CNN models + FRLF | 98.45% | PPMI |
Publisher’s Note: MDPI stays neutral with regard to jurisdictional claims in published maps and institutional affiliations. |
© 2022 by the authors. Licensee MDPI, Basel, Switzerland. This article is an open access article distributed under the terms and conditions of the Creative Commons Attribution (CC BY) license (https://creativecommons.org/licenses/by/4.0/).
Share and Cite
Kurmi, A.; Biswas, S.; Sen, S.; Sinitca, A.; Kaplun, D.; Sarkar, R. An Ensemble of CNN Models for Parkinson’s Disease Detection Using DaTscan Images. Diagnostics 2022, 12, 1173. https://doi.org/10.3390/diagnostics12051173
Kurmi A, Biswas S, Sen S, Sinitca A, Kaplun D, Sarkar R. An Ensemble of CNN Models for Parkinson’s Disease Detection Using DaTscan Images. Diagnostics. 2022; 12(5):1173. https://doi.org/10.3390/diagnostics12051173
Chicago/Turabian StyleKurmi, Ankit, Shreya Biswas, Shibaprasad Sen, Aleksandr Sinitca, Dmitrii Kaplun, and Ram Sarkar. 2022. "An Ensemble of CNN Models for Parkinson’s Disease Detection Using DaTscan Images" Diagnostics 12, no. 5: 1173. https://doi.org/10.3390/diagnostics12051173
APA StyleKurmi, A., Biswas, S., Sen, S., Sinitca, A., Kaplun, D., & Sarkar, R. (2022). An Ensemble of CNN Models for Parkinson’s Disease Detection Using DaTscan Images. Diagnostics, 12(5), 1173. https://doi.org/10.3390/diagnostics12051173